Article

Mapping Urban Networks through Inter-Firm Investment Linkages: The Case of Listed Companies in Jiangsu, China

1
School of Architecture and Urban Planning, Nanjing University, Nanjing 210093, China
2
Provincial Engineering Laboratory of Smart City Design Simulation&Visualization, Jiangsu, Nanjing 210093, China
*
Author to whom correspondence should be addressed.
Sustainability 2020, 12(1), 89; https://doi.org/10.3390/su12010089
Submission received: 21 November 2019 / Revised: 12 December 2019 / Accepted: 18 December 2019 / Published: 21 December 2019
(This article belongs to the Section Sustainable Urban and Rural Development)

Abstract

:
Recently, literature on urban network research from the perspective of firm networks has been increasing. Focusing on firms’ multi-location distribution, existing studies use mainly the internal organization structural information of firms to portray one-type industry or all-industry networks, and there are deficiencies in reflecting the authenticity of networks and comparing the differences across industries. In contrast to studies applying intra-firm networks, this study collects real investment data of all listed firms in Jiangsu Province and studies urban networks through quantifying inter-firm linkages. Based on inter-firm investment linkages, this study provides fresh insights on inter-city connections in China. The results show that Nanjing, Suzhou, Shanghai, Beijing and Shenzhen are the constant network centers across different industries. Particularly, Shenzhen has been favored by more investment inflows far beyond its GDP. In China’s unique institutional context, state power, geographical location, market and other factors jointly affect the flow of investment, and the role of state power deserves special attention. Since real economic connections are used to describe urban networks, the findings might contribute to ongoing debates regarding economic centers in China and bring further implications for policy making in investment environment improvement. It enriches the research of urban networks based on real inter-firm connections, and provides ideas for the wider regional study and the combination of econometric techniques and social network analysis.

1. Introduction

The rapid development of information technology and the resulting increase in inter-city linkages enables urban network an important paradigm for studying urban systems [1,2]. Since Beaverstock [3] constructed the roster of world cities based on the produce service connections between cities, diverse kinds of inter-city linkages, including individuals, information, services, and goods, have been widely used to measure urban networks with different spatial scales [4,5,6,7]. As space carriers providing diverse kinds of productive resources, firms are key actors in the formation of urban networks. Starting from a firm’s location behavior, the interlocking network model and the headquarter-subsidiary ownership method are two current approaches to studying urban networks from a firm network perspective.
Based on the theories of the space of flows [1] and the global city [8], the interlocking network model assumes that two cities locating offices of the same producer service firm can interact, and the interaction strength depends on the importance of the offices [9]. Although the interlocking network model has been applied as the ‘de facto method’ to measure city networks at many scales [10,11], questions about its accuracy and universality remain. Neal [12] and Liu [5] critique the model on the basis that the “rich” inter-city interactions generated by the interlocking network model would lead to a “flat” network which hides the real clusters. Another question about the usefulness of this model is that the producer service firms in developing countries tend to be concentrated in a few cities, and the network status of most cities with underdeveloped economies embedded in the producer services network is difficult to evaluate. Compared with the interlocking network model, the headquarter-subsidiary ownership method is a more straightforward and precise approach. Built on concrete data rather than assumptions, this method focuses on the control from the city where the headquarters are located on the location of branches [13,14]. The merit of the headquarter-subsidiary ownership method lies in converting ‘tangible’ intra-firm linkages into inter-city connections, which does not go “beyond what is strictly supported by the available data” [14]. However, this method also has some defects. For instance, in the myth of global management of multinational firms, the relations between headquarters and branches are quite complex rather than following a pattern of asymmetric control [15]. Besides, since large cities are more likely to be the location site for large firms establishing multi-locational branches [16], the headquarter-subsidiary ownership model is also limited by its application scale. In fact, the Fortune 500 companies [4] and other large companies [17] have become the main research targets of empirical studies applying the headquarter-subsidiary ownership method.
Apart from the above shortcomings, the most critical issue is that the interlocking network model and the headquarter-subsidiary ownership method are intrinsically unable to outline a ‘complete’ urban network due to their initial focuses on using intra-firm structural data to describe inter-urban linkages. Intra-firm, inter-firm and extra-firm are the three categories of firm networks [18]. Intra-firm and inter-firm are the two regarded as suitable to quantify inter-city linkages [19]. Intra-firm linkages come mainly from the vertically internal organizational structures and processes [20]. In contrast, inter-firm linkages include broad horizontal connections [19], regardless of whether the firms have organizational relationships or not. In other words, inter-firm linkages are broad enough to include intra-firm connections. More importantly, the development of global production networks has brought extensive inter-firm connections within the same or across different industries [21]. Therefore, inter-firm linkages are bound to be a promising perspective for urban network study [19].
Based on these investment connections between listed firms registered in Jiangsu and their domestic investees, this study’s main goal is to reveal the changes of node hierarchy and urban networks from different industry perspectives and focuses on two key questions: 1. which cities are the centers of investment networks and what are their spatial distribution characteristics; 2. which cities get more investment favor compared with their economic scale and why? It is found that Shanghai, Beijing and Shenzhen are the constant centers outside Jiangsu Province in the investment networks across industries, while Nanjing and Suzhou are provincial centers. In China’s unique institutional context, geographic location, market, state power and other factors together affect the flow of investment. Relatively speaking, city hierarchy preference of investment is more obvious than geographical proximity preference, particularly in scientific research and technology services. Moreover, Shenzhen has attracted more investment that does not match its GDP, showing the potential to outrank Shanghai and win the leading position in domestic investment.
The following paper is divided into two main sections. The first contains a review of existing studies on inter-city connections and we identify the necessity to study inter-firm investment linkages. However, the key challenge is to find and analyze a real firm relational data set which can support comparative studies across industries. This is what we attempt in the second section. Focusing on the two dimensions of the overall industry and the subdivided industries, through analyzing the investment connections between China’s cities, the novelty of this paper is mainly reflected in two aspects: in terms of data, we collect and analyze firms’ massive investment paths; in terms of methods, we combine social network analysis and econometric techniques to explore the feature of China’s urban networks and the impact of GDP on investment flows.

2. Inter–Firm Investment and Inter-City Connections

The internet era has witnessed the shift of cities from independent nodes to interdependent hubs in the network [1]. The development of cities increasingly depends on positions in the multi-space-scale economic exchanges [13]. Against the backdrop of the sizable economic growth of China in recent years, a large number of recent empirical studies have focused on using diverse economic activities to explore the control function or network status of Chinese cities. In the study of the “world city”, Csomós [22] found that Beijing has become the leading command and control center of the world economy on the basis of the rich corporate headquarters it hosts. Raźniak’s [23] ranking of world economic centers proves Beijing’s leading position in China’s inland cities. Based on service firms’ data gathering of Globalization and World Cities Study Group and Network [GaWC] research, Derudder [24] tracked the shifting global connectivity of Chinese cities between 2010 and 2016; this researcher found that most Chinese cities gained connectivity in the world urban networks due to the rise of the wholesale industry. In terms of China’s urban networks, the most recent studies include that Xi [25] used online commodity services to reveal the spatial pattern of the national urban network under the influence of the internet economy, and Liang [26] mapped the international freight forwarding service regional network in the Yangtze River Delta.
Among economic activities producing inter-city connections, inter-firm investment has unique policy implications. Specifically, studying inter-firm investment is conducive to regional policy making due to the role of investment in achieving economies of scope, reducing operational risks, knowledge spillover and employment creation [27]. In fact, attracting investment has become a fundamental path for promoting urban and regional competition [27]. However, limited by available relational data, existing empirical studies on inter-firm investment connections are quite few, mainly including Battiston’s [27] analysis on inter-regional investment stocks across Europe and Ma’s [28] analysis on inter-province investment connections of Chinese listed companies between 2002 and 2009.
As Pan [19] argued, the key challenge to promoting studies on all types of inter-firm linkages, including inter-firm investment, is to find a feasible relational data set. Such a data set needs to not only reveal reliable inter-city linkages but also support comparative studies of firm networks across sectors. Existing studies confirm that there are significant differences in urban networks from the perspective of different industries. Through the lens of studies based on intra-firm structural data, for example, although Shanghai is one of the top three linkage nodes in China’s urban network in terms of finance [29] and advanced production services [2], its leading position is replaced by Hangzhou, where Alibaba is located, in the internet industry network [30]. Studies at the regional level are also full of diametrically opposed findings. Li [31] verifies that Nanjing has more advantages than Suzhou in the spatial layout of all-industry listed firms’ branches in the Yangtze River Delta, while Ye [32] has drawn the opposite conclusion from the perspective of the logistics industry. Indeed, since different industries have varying demands for cost management in supply, production, sales and other parts, affecting the formation of firm networks, it makes sense to analyze and compare firm networks across different industries through gathering reliable inter-firm relational data. However, with the exception of Ye’s [33] comparative analysis of China’s firm networks through subdividing the pharmaceutical industry, few existing studies discuss the changes of urban network structures in parallel industries such as manufacturing, services, and scientific research, which is otherwise crucial for identifying the function of cities and the spatial organization of economies.
The online disclosure of investment information of listed firms in China is undoubtedly an opportunity to overcome the data constraint and to study multi-dimensional urban networks from the perspective of inter-firm connections. By the end of 2018, there were more than 3500 A-share listed firms in China, and most of them are leaders in the industry. That is to say, listed firms play a prominent role in China’s economic construction. Therefore, the economic activities of listed companies have been widely applied for the study of economic spatial organization at various scales in China [34]. Meanwhile, massive reliable investment and attribute data of China’s listed companies have been published on several newly established business survey websites, which makes it feasible to study inter-firm connections based on the increasingly rich internet big data. China’s urban network research based on inter-firm investment connections finally ushered in the opportunity to fill the gap of empirical analysis.

3. Data and Methodology

This study collected the investment and attribute data of all listed firms registered in Jiangsu Province to quantify inter-firm and inter-city connections. Jiangsu’s GDP ranked second in China in 2018, and this province has played a decisive role in China’s social and economic development. Data were crawled from the Tian Yancha website by Python in February 2019. Authorized by the National Enterprise Credit Information Publicity System, the Tian Yancha website publishes business information of more than 180 million firms in China. This website’s published investment data has been applied to study the spatial expansion of firms [35] and the headquarter-branch connections [34]. After removing listed firms with abnormal business conditions and the situation of natural persons holding shares, a total of 15,664 investment data sets of 1262 listed firms registered in Jiangsu Province (Depending on the openness of data, 104 firms with foreign capital have been excluded, less than 10% of the collected research data) were obtained, and each data set includes the firm’s location, industry, shareholders and their shareholding ratio. For privacy reasons, this study uses a shareholding ratio instead of a monetized quota to represent investment intensity between firms. Focusing on the description of inter-city linkages, this study takes cities at prefecture level and above as research units, and 10,394 cross-city investment data sets are further extracted as research data. These cross-city investments flow from 13 cities in Jiangsu Province to 299 (Cities in Taiwan, Hong Kong, and Macao are excluded. Moreover, because of the special administrative system in Hainan Province in which about 76% of the land area is in counties directly controlled by the Hainan Province government, the entire Hainan Province is simplified as one research unit.) research units in China. The geographical and industrial (industry classifications follow the national standard GB/T 4754—2017 industrial classification for national economic activities) distribution (origin) of cross-city investment out-flow linkages are shown in Figure 1 and Table 1.
Social network analysis is the most common method for measuring inter-city flows. Following the projection method of converting the firm-by-firm matrix into a city-by-city matrix based on cities where firms are located [5], this study focuses on sequentially describing the node hierarchy, structure and organization of investment networks by applying social network analysis. Considering the practical implications for policy making, the node hierarchy in this study depends on a city’s indegree, which refers to the summarized intensity of cross-city investment inflow and can be calculated as follows:
T j = i N t i
where T j is the indegree of city J, N is the number of firms registered in city J, t i is the summarized investment inflow intensity that all firms registered in city J as investees.
Then, this study makes an exploratory correlations analysis between some cities’ (top 100 in GDP and more than zero in investment, cities in Jiangsu Province are excluded) indegree and their GDP, in order to initially explore the attraction of cities’ economy scale to investment. The analysis consists of two steps. First, using the existing research [36] for reference, the following logarithmic standardization treatment is carried out for cities’ indegree:
L j = L O G 10 T j / M A X T j = n 100 + 1 50
L j is the standardized indegree of city J, M A X T j = n is the maximum original value of indegree of the cities included in the analysis. Second, linear fitting analysis is carried out between the standardized indegree and the GDP, and the residual between the actual investment value and the theoretical value is calculated. The Top 5 cities in the positive residual are extracted for further interpretation.
In the network structure section, the spatial differentiation characteristics of directed weighted networks of investment across industries are analyzed. Power BI and Arcgis 10.2 are respectively used to visualize symmetry investment networks (mutual investment between cities in Jiangsu) and asymmetry investment networks (one-way investment from cities in Jiangsu to cities located outside of Jiangsu). Besides, the spatial organization of investment networks is analyzed based on the dominant flow which is often used to reflect the linkage preference of cities on the basis of eliminating the influence of data volume [37]. The TOP 1 city of investment outflow of each node in the network is selected for interpretation. In order to retain and compare industrial characteristics, Section 3 of this paper outlines results from the network analysis of the overall industry and subdivided industries. The latter includes four types of industries: manufacturing; wholesale and retail; scientific research and technology services; and leasing and business services. The sum of cross-city investment quantities of these industries accounts for 81% of the total research data.

4. Results

4.1. The Investment Networks of Overall Industry

4.1.1. Node Hierarchy

Figure 2 presents the node hierarchy of indegree based on investment flows of all industries. The eastern coastal cities stand out as major nodes in terms of attracting investments from all industry; in particular, Shanghai, Beijing, Shenzhen, and Nanjing are first-level cities (Figure 2). Shanghai holds a dominant position with the largest indegree value of 684, which far exceeds Beijing’s value (405), resulting in a rank of second. Shenzhen (382) and Nanjing (310) follow closely, ranking third and fourth respectively. The second-tier cities are mainly composed of cities within Jiangsu Province and the rest of the municipalities directly under the Central Government including Tianjin and Chongqing. Most of the third and fourth level nodes are highly concentrated in the east, but there are also exceptions. For instance, Lhasa (33) and Changchun (38), the capital cities in the southwest and northeast, are located in the third level (Figure 2). In general, the node level of cities in the all-industry investment network is basically consistent with their administrative status.
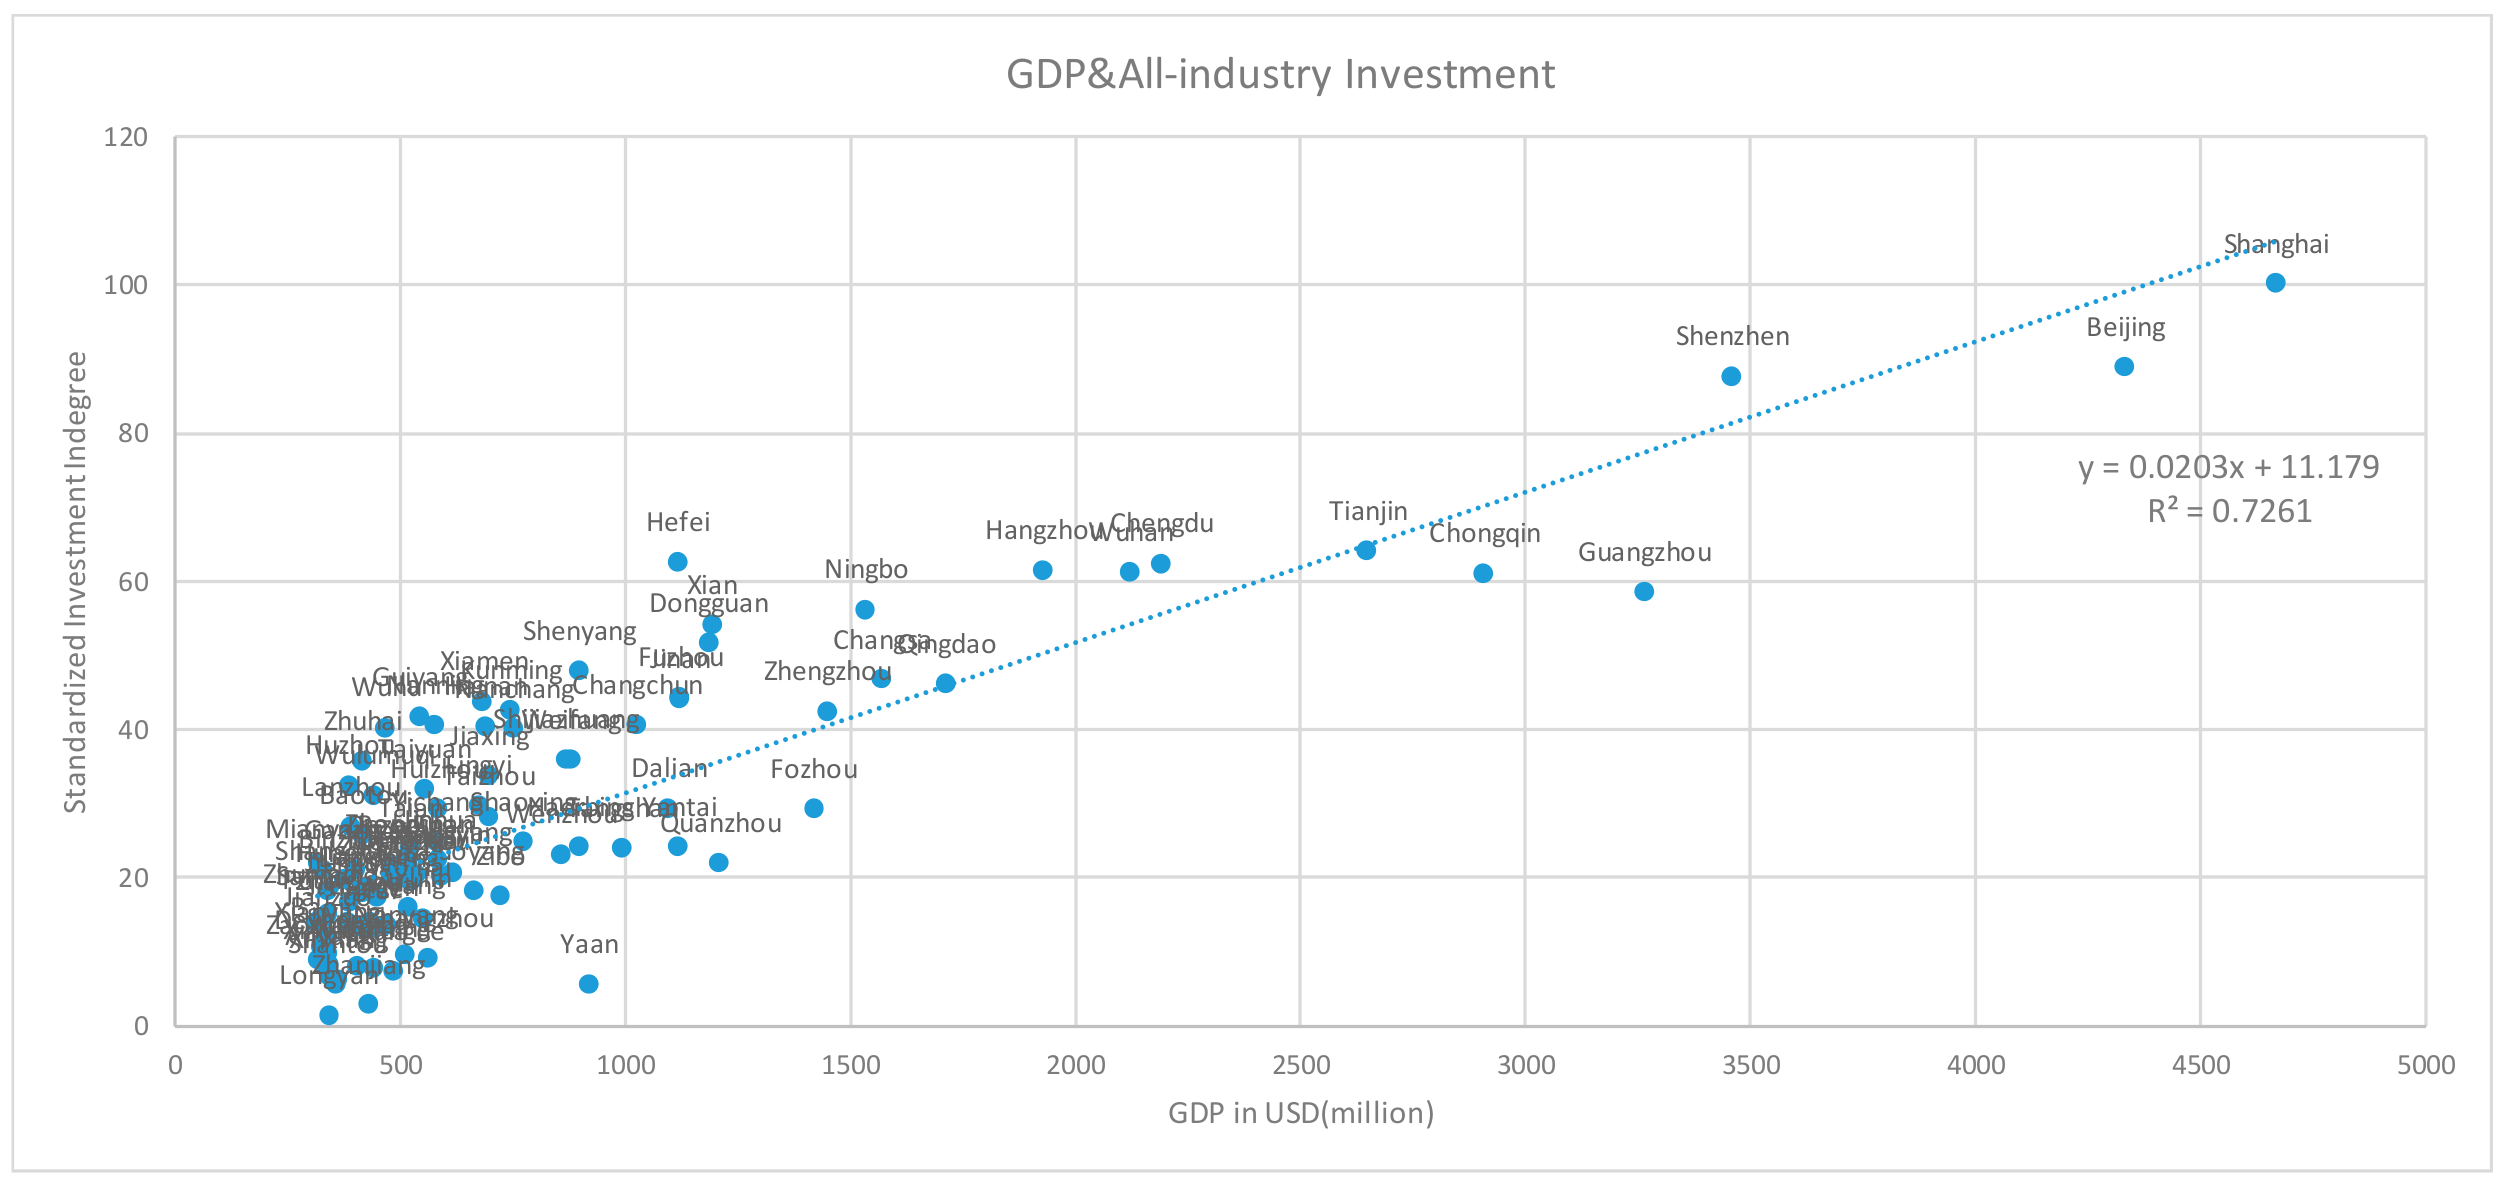
The R2 of correlation analysis between GDP and all-industry investment inflow is 0.73 (Figure 3), which shows that cities with large economic scale are more likely to attract investment. It is worth noting that, among the Top 5 cities in China’s GDP in 2018, only Shenzhen’s actual investment inflow is greater than its corresponding theoretical value of GDP (Figure 3). In 2019, Shenzhen builds the first demonstration area of socialism with Chinese characteristics, which has become a major national strategy of China. Shenzhen has speeded up its economic transformation and improved its urban functions with reference to global benchmark cities, thus attracting rich investment from all over China, including Jiangsu. The GDP of Top 5 cities with positive residuals (Table 2) is ranked between 20–70 in China, mainly corresponding to “second tier and third tier cities (the annual report of 337 cities at prefecture level and above in China based on multi-source big data evaluation issued by China Business Network Co., Ltd. (CBN) https://baike.baidu.com/item/中国城市新分级名单/12702007?fr=aladdin)”. Since Nanjing and Suzhou, the main investment outflow origins of Jiangsu Province, are listed as “new first tier cites (the annual report of 337 cities at prefecture level and above in China based on multi-source big data evaluation issued by China Business Network Co., Ltd. (CBN) https://baike.baidu.com/item/中国城市新分级名单/12702007?fr=aladdin)”. It reflects that the investment of Jiangsu Province mainly covers the next gradient cities in China.

4.1.2. Network Structure

Figure 4 presents the investment flows of all industries between cities within Jiangsu Province. Suzhou and Nanjing are the two network hubs in terms of investment distribution. Suzhou has invested intensively in cities including Nanjing, Wuxi, Huai’an and Changzhou, and these cities are relatively evenly distributed across the province. Among them, the investment flows from Suzhou to Nanjing and Suzhou to Wuxi are the two most influential linkages in the entire network. In contrast, Nanjing’s investment in other cities is more homogeneous: only Suzhou and Huai’an are favored to some extent. In addition, the remaining cities play a larger role as capital inflows in the investment network. In short, except for Nanjing-Suzhou and Wuxi-Suzhou, which are close to the city-dyad in the network, the connections between other cities are not much different.
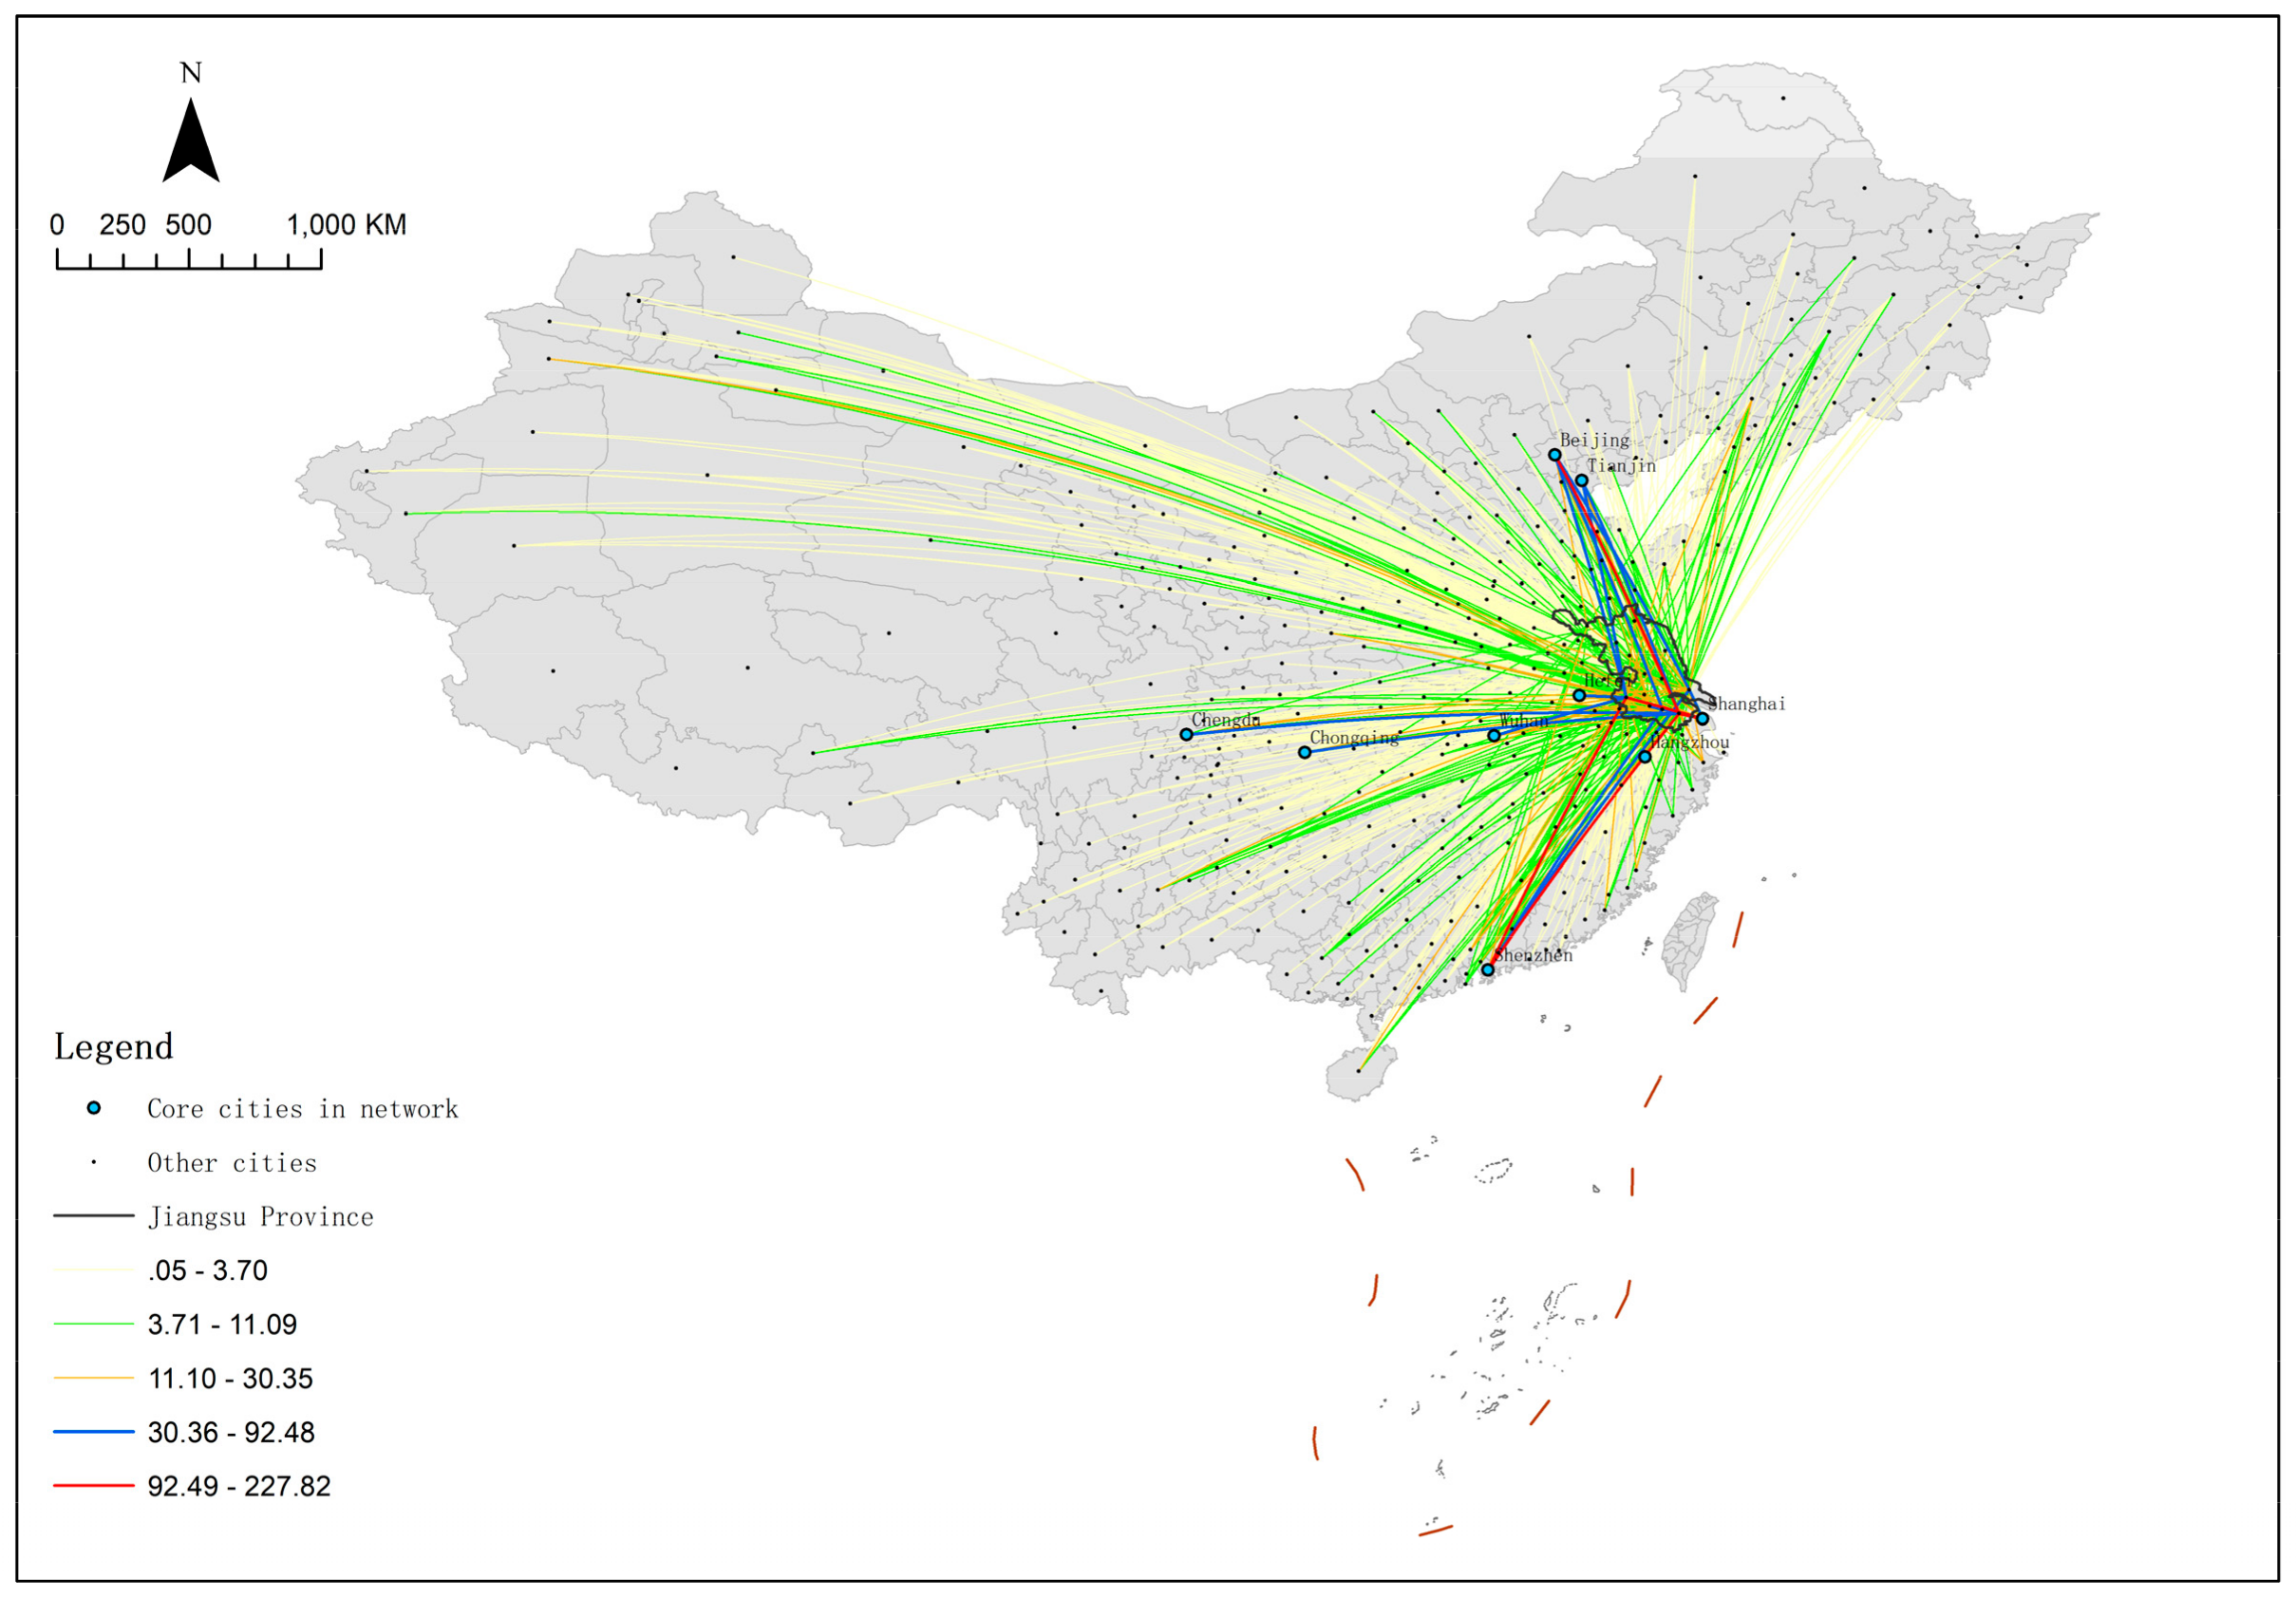
Figure 5 shows the spatial pattern of the investment network based on connections between cities in and outside Jiangsu Province. Taking Nanjing and Suzhou as points of origin, the first-level and second-level investment flows form a T-shaped structure, with Beijing, Tianjin, Shanghai, Hangzhou, Shenzhen, Hefei, Wuhan, Chongqing, and Chengdu as major nodes. It is worth noting that high-level investment flows by jumping to either international cities like Beijing, Shanghai, and Shenzhen or to regional centers along the Yangtze River. Cities in the Yangtze River Delta region are not preferred much for geographical proximity. Instead, this region is filled with intensive middle-level and low-level investment flows. In addition, stimulated by the national strategy of Western Development and related local preferential policies, considerable investment flows to the northwest and southwest. The vast northeast has become an investment depression area.

4.1.3. Network Organization

Based on the largest flow, Table 3 lists TOP 1 linkage nodes of cities in Jiangsu Province. Among the four cities selected as TOP 1, Shanghai was selected up to nine times, showing strong radiation capability to cities in Jiangsu Province. In addition to the geographical proximity, the impact of historical legacy [38] and cultural ties on investment flows cannot be neglected. In fact, not only most of Shanghai once belonged to Jiangsu (for instance, Jiading and Songjiang were once under the jurisdiction of Suzhou, the former has a solid foundation of automobile industry, while the latter is the location of the Songjiang University Town), Shanghai is also within the Wu culture radiation area (Suzhou and Wuxi are the centers of Wu culture). All of them virtually strengthen the current flows between firms in Shanghai and Jiangsu, especially private firms.
In contrast, Nanjing, the capital city of Jiangsu, was selected as the TOP 1 city only by two economically underdeveloped cities, Suqian and Huai’an, indicating that Nanjing’s influence in Jiangsu Province has been completely replaced by Shanghai. Interestingly, Nanjing’s TOP 1 linkage city is Shenzhen rather than Shanghai, which is possibly related to the competition between Nanjing and Shanghai in the Yangtze River Delta region. In addition, the electronic information industry in Nanjing and Shenzhen is highly developed, which may generate diverse linkages between them.

4.2. The Investment Networks of Subdivided Industries

4.2.1. Node Hierarchy

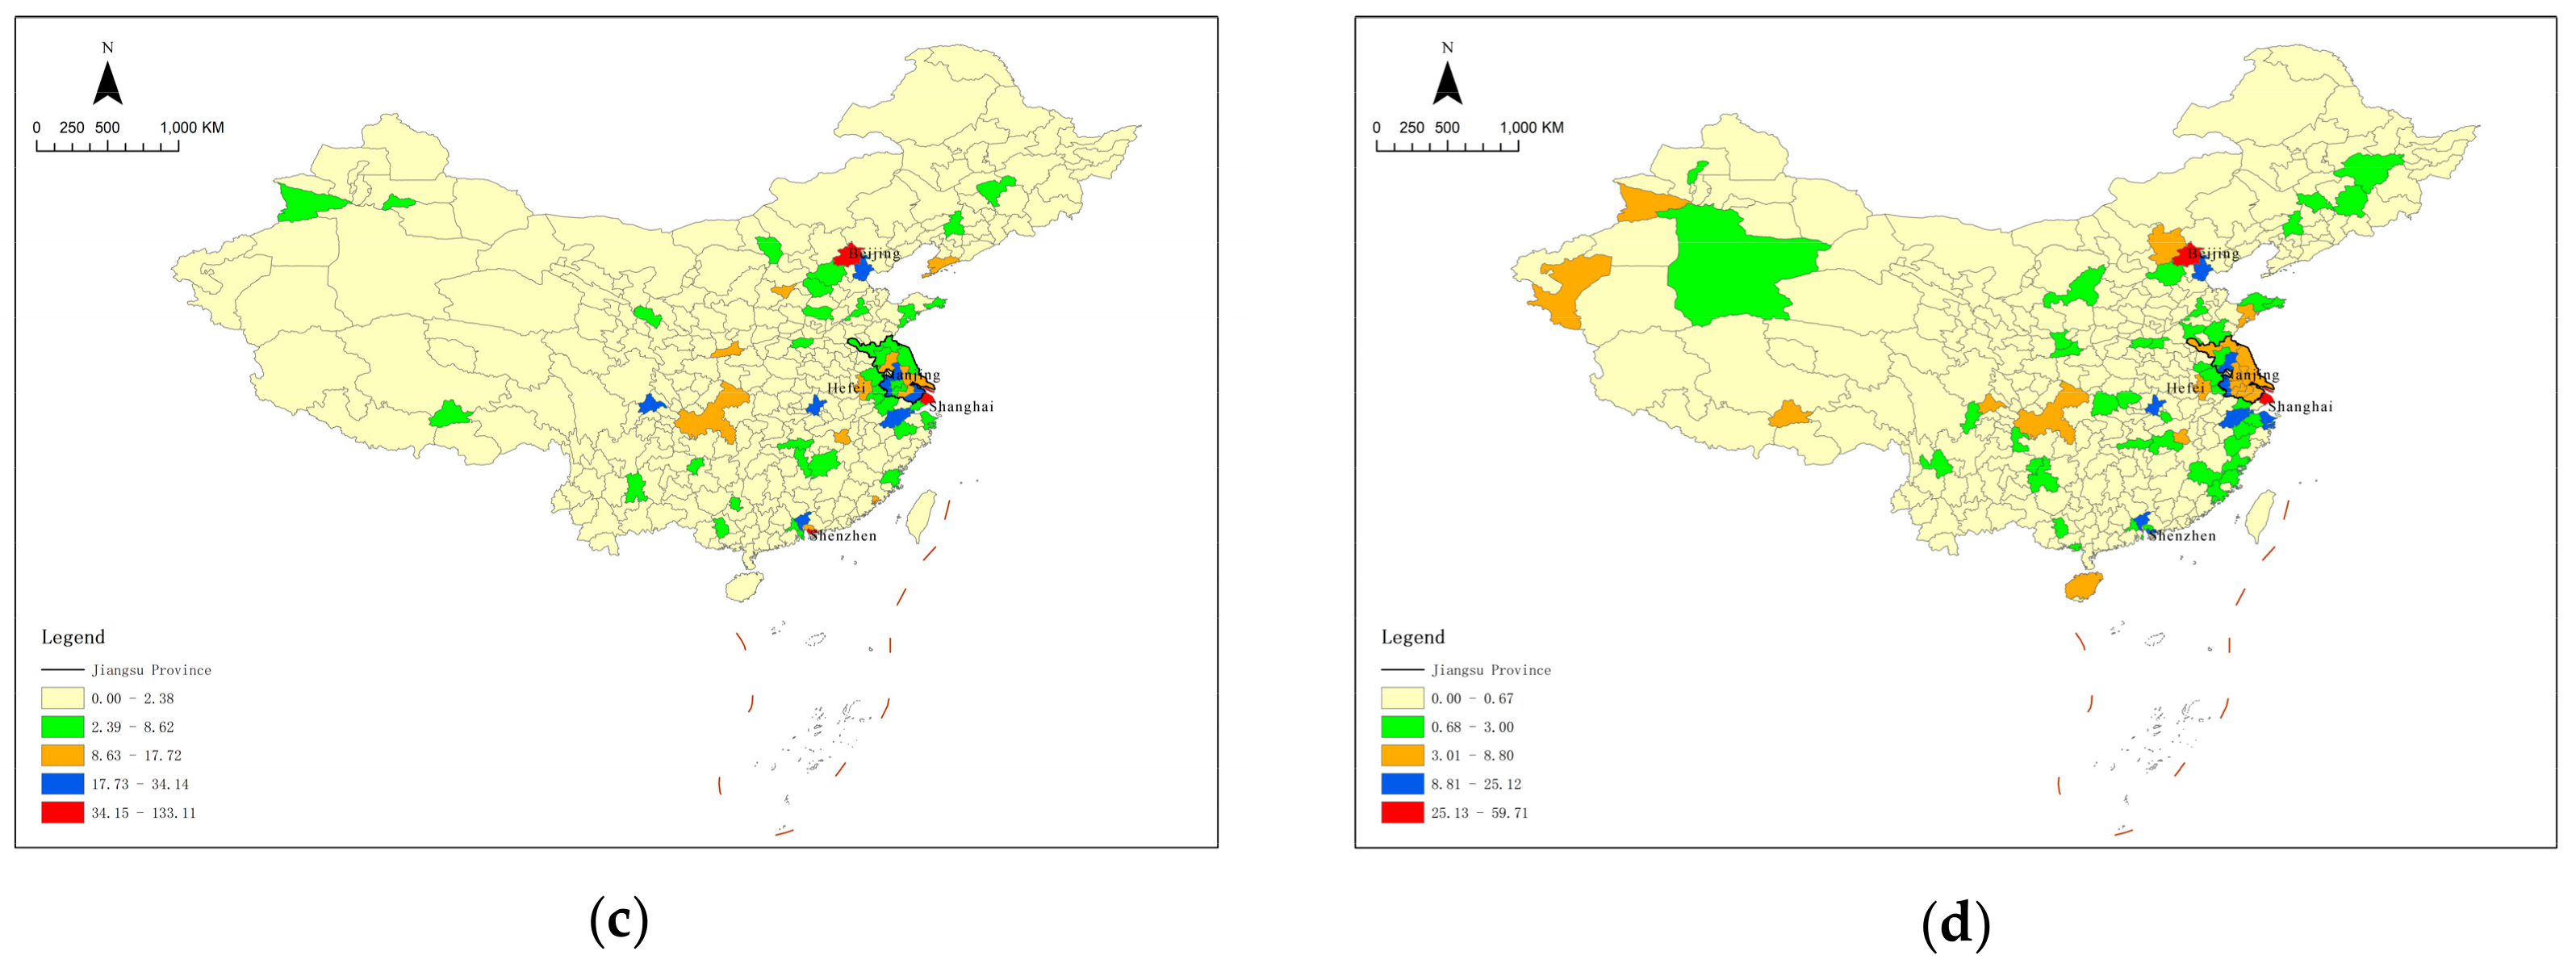
Figure 6 presents the node hierarchy of investment networks across different sectors. Overall, Shanghai and Beijing are the two top cities without any rival. Shanghai ranks first in manufacturing, wholesale and retail, and leasing and business services, while Beijing leads the scientific research and technology services sector with its outstanding educational and talent advantages. The node hierarchy of other cities differs significantly across different sectors. The node hierarchy of cities in manufacturing, wholesale and retail both reflect outstanding geographical proximity feature, and the degree of cities in Jiangsu Province is somewhat higher than other cities (Figure 6), but the reasons are different. In the former sector, the scale of Jiangsu’s manufacturing industry has remained the first in China for 8 consecutive years by 2018. The strong industry foundation and industry worker pool have successfully attracted most of the manufacturing investment. In the latter sector, affected by demands of immediate delivery of goods and regional consumption habits, a large number of first-tier and second-tier cities gather in and around Jiangsu Province. The node hierarchy of cities in scientific research and technology services is positively consistent with their administrative level, implying the significant role of state power in the allocation of public resources. In contrast, the invisible hand of the market influences more investment flows in the sector of leasing and business services. The number of nodes at the middle-level is large and the nodes are scattered in Hainan, Xinjiang and other areas where industry and urbanization has been developing rapidly.
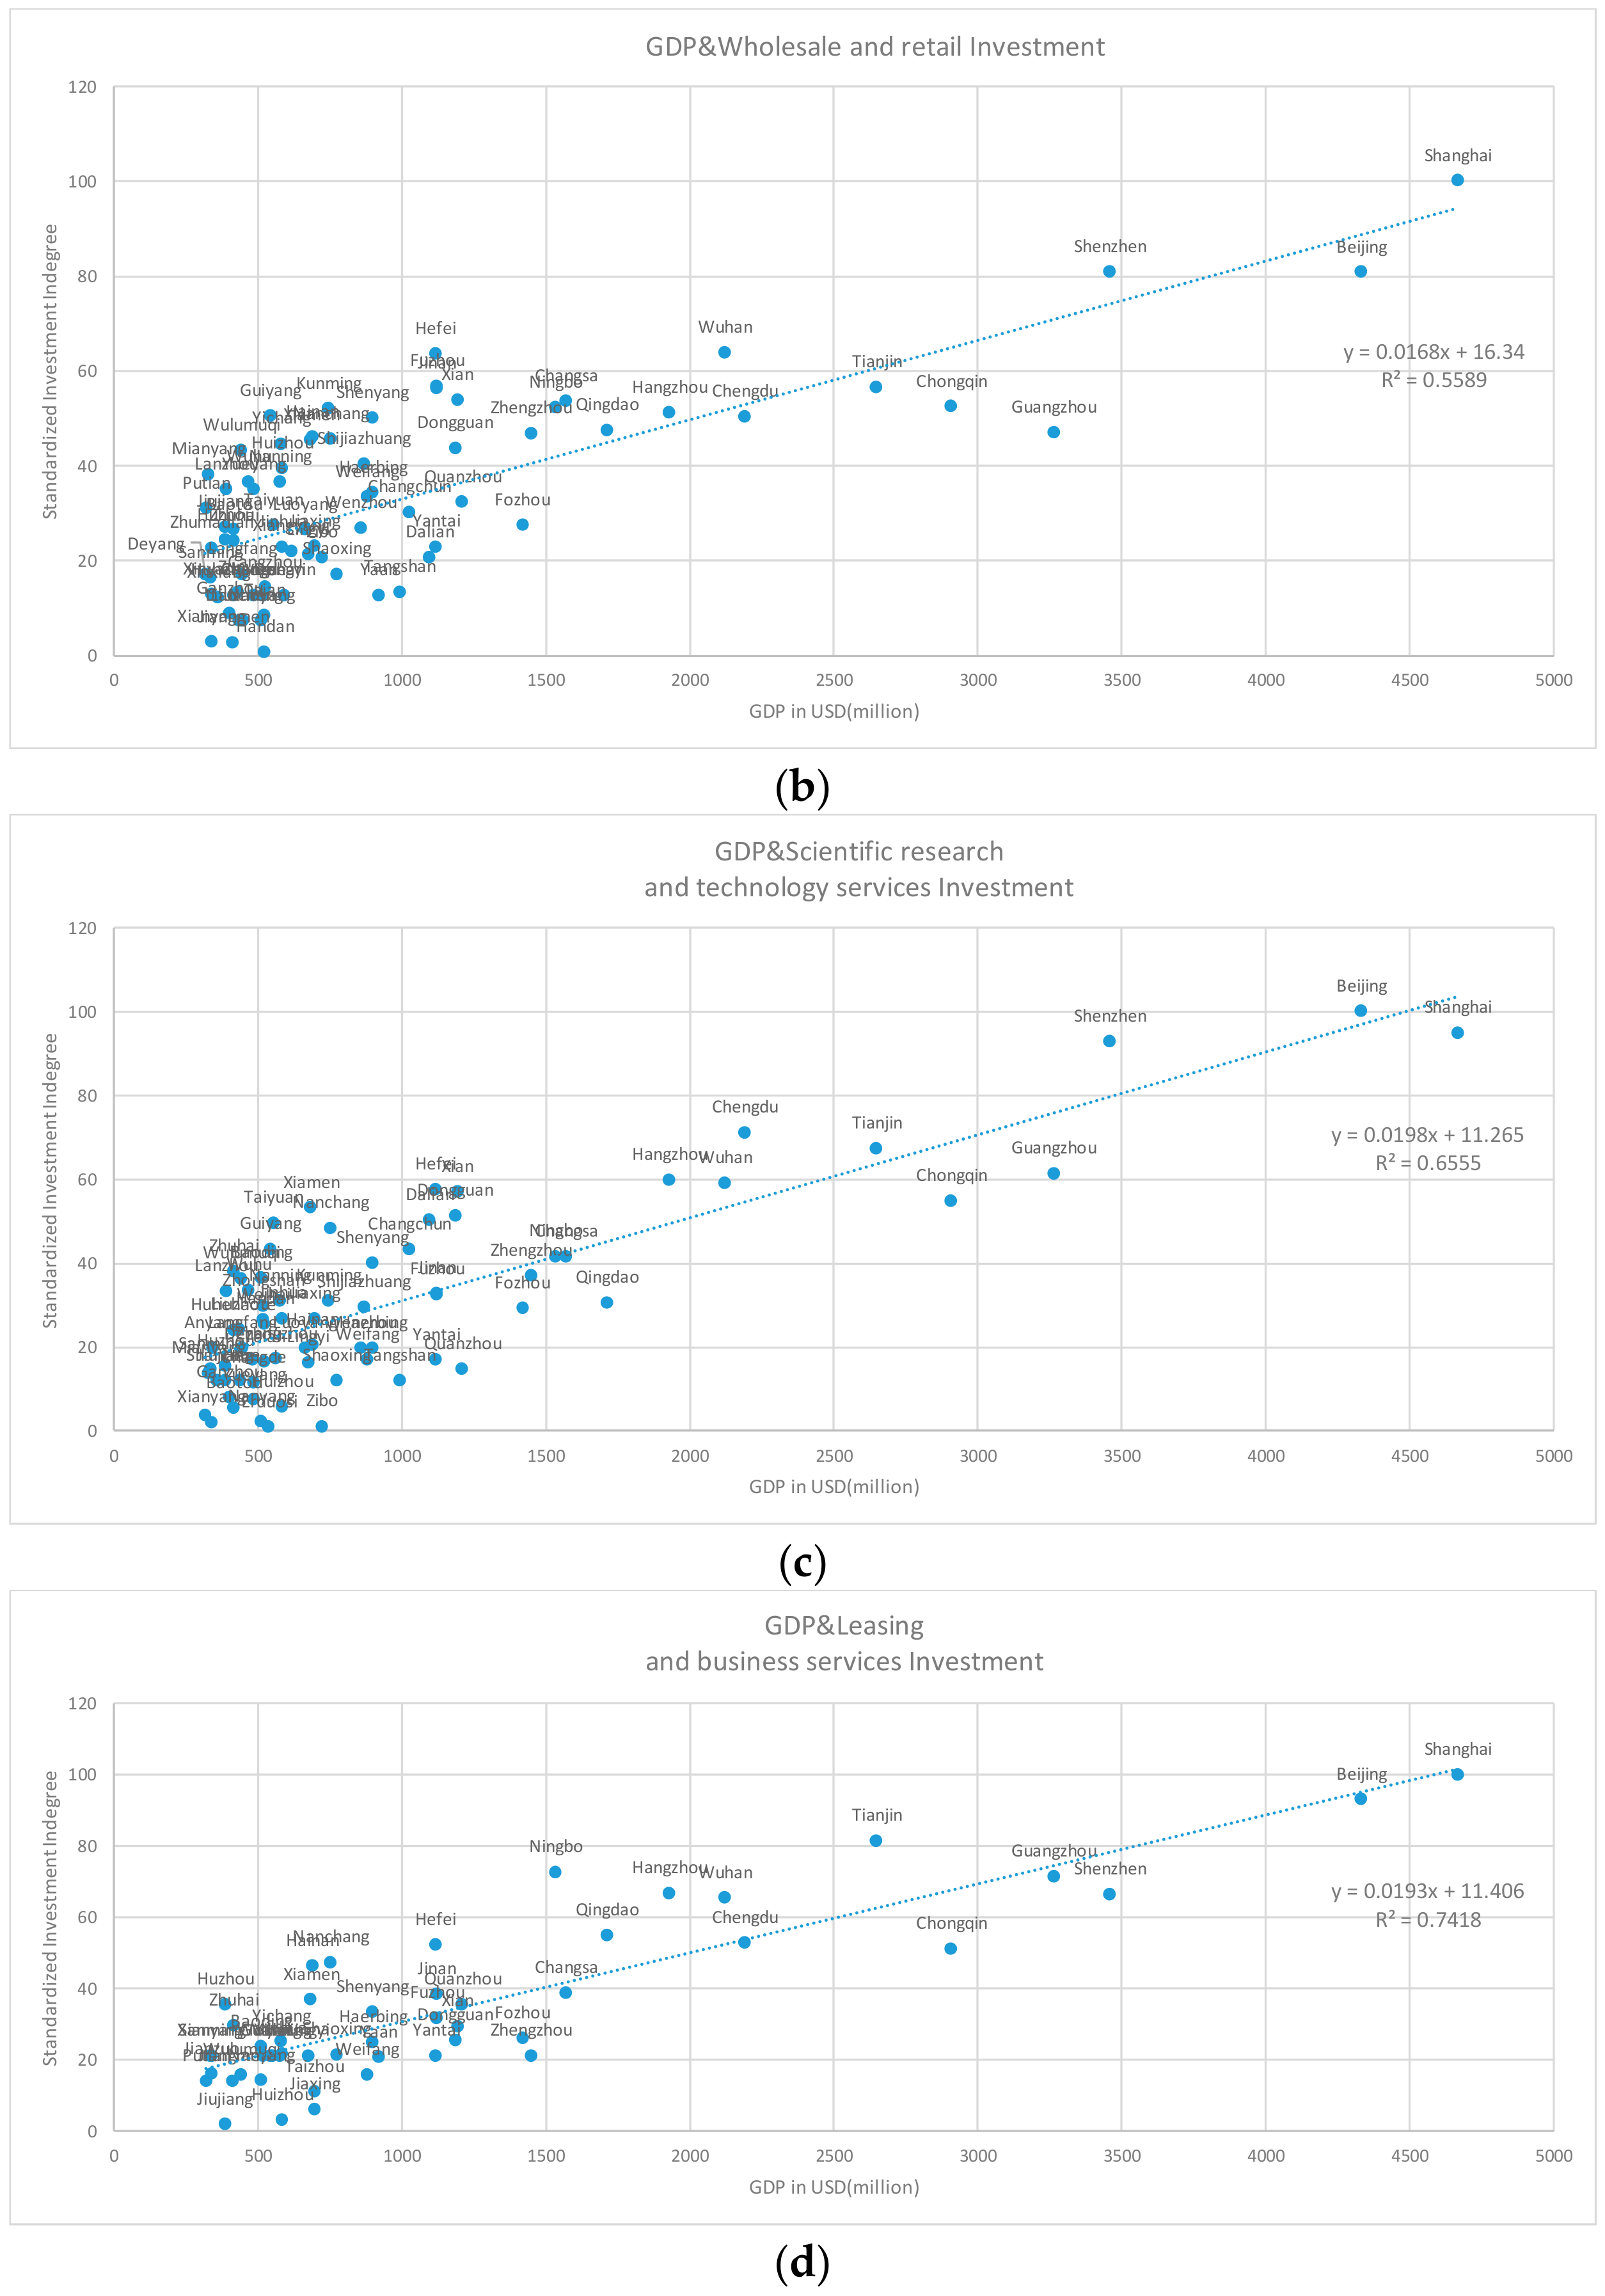
In addition to wholesale and retail, the R2 of correlation analysis between GDP and investment remains above 0.65 (Figure 7), indicating that GDP greatly affects the flow of investment. Focusing on the scattered distribution of the top cities in China’s GDP ranking, the characteristics of manufacturing, wholesale and retail industry are similar. Shanghai and Shenzhen fall above the fitting line, which is related to their important role in the global economic system. The investment inflow of Hangzhou, Ningbo, Wuhan and other neighboring cities around Jiangsu Province are also higher than the fitting value. The characteristics of scientific research and technology services, leasing and business services are basically the same. Hangzhou, Ningbo, Qingdao and other cities with GDP between USD 1500 billion and 2000 billion have sprung up. These cities are famous for their comfortable living environment, so they have great attraction to highly educated talents and real estate developers. Most of the Top 5 cities with positive residuals across industries are second and third tier cities in China, which is similar to the situation of the whole industry, reflecting the tendency of Jiangsu Province to invest in cities at the next economic level. It is worth noting that Hefei is listed across all subdivided industries (Table 4), suggesting that it plays a core role in the investment gathering in the west of the Yangtze River Delta. With Hefei being selected as the Comprehensive national science center (another three centers are Beijing, Shanghai and Shenzhen), the high-tech industry and scientific research of Hefei will be further improved in the future, and it will be more favored by investment.

4.2.2. Network Structure

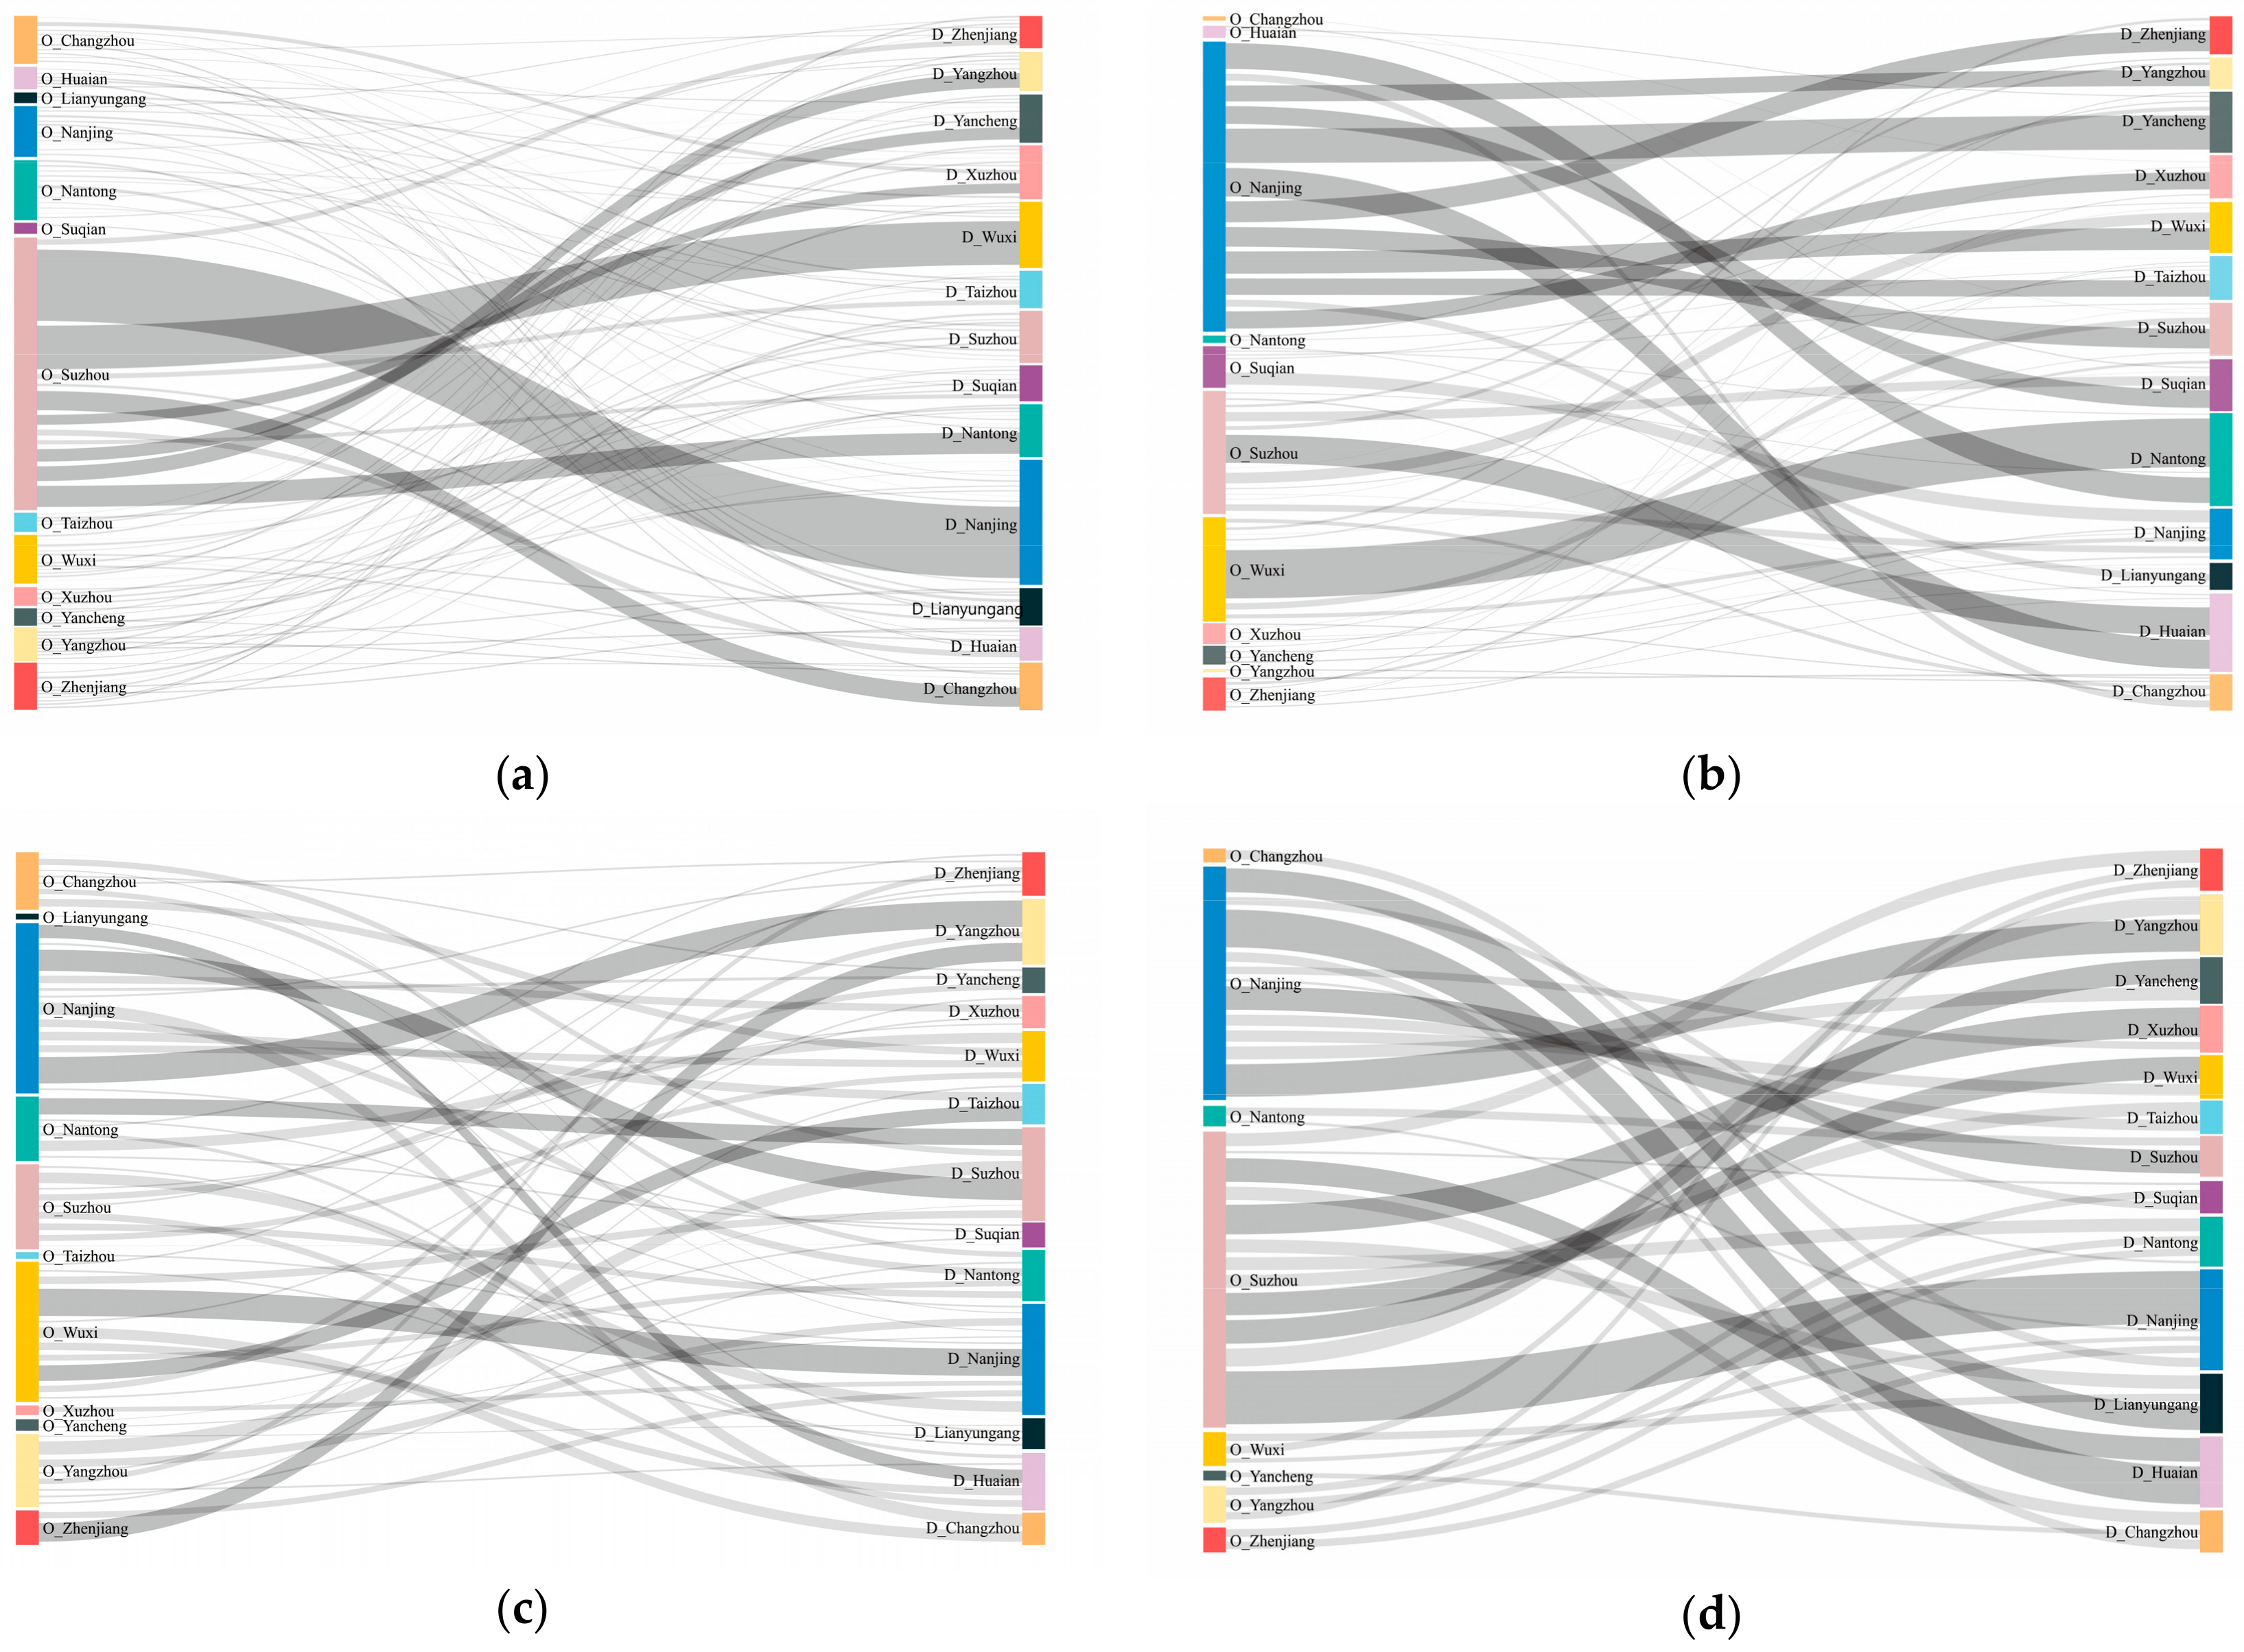
As shown in Figure 8, Suzhou and Nanjing are the cores of Jiangsu’s local investment flow network across different sectors. Suzhou is the main origin of investment outflows in the manufacturing sector, spreading investment throughout the entire province. The linkages between Suzhou-Nanjing and Suzhou-Wuxi are particularly strong. Nanjing plays a dominant role in the investment network of wholesale and retail. Compared with Suzhou, Nanjing’s investment outflow intensity is relatively uniform. Wuxi’s one-way investment in Nantong is the strongest linkage in the wholesale and retail sector. Investment flows of scientific research and technology services sector display an obvious network feature: Nanjing, the most important university agglomeration in Jiangsu, has a good performance in both the collection and the scatter of investment, and Suzhou, Wuxi, and Yangzhou have become the multi-cores of the investment network. Suzhou has regained its top spot in the investment outflow of the leasing and business services sector, and Nanjing has once again become the major investment destination of Suzhou. In general, Nanjing and Suzhou are the two main investment origins in Jiangsu. The difference is that Nanjing’s investment is more balanced in terms of spatial distribution, and Suzhou tends to interact directly with Nanjing.
Figure 9 illustrates that Shanghai, Beijing and Shenzhen are the constant centers of investment networks of subdivided industries. Their close connection with Nanjing and Suzhou presents an “arrow”-shaped pattern. Compared with the spatial pattern in the all-industry section, the network status of large cities along the Yangtze River is significantly weakened and replaced by a flexible multi-core pattern.
In the manufacturing part, investment not only flows from Jiangsu to economically developed but distant cities such as Tianjin and Chongqing to gain knowledge spillovers, but also favors neighboring cities in the Yangtze River Delta including Hefei and Ningbo where it benefits from the labor pool. In the investment network of wholesale and retail, with the exception of Beijing, Shanghai and Shenzhen, the role of cities is highly homogeneous. This is due to the fact that each city has local retail giants which have dispersed investment. The investment network of scientific research and technology services is clearly hierarchical, and Chengdu, Dalian, Xiamen and other cities with famous universities attract far more investments than other regions. When it comes to leasing and business services, the role of urban agglomerations becomes dominant. Specifically, Beijing, Tianjin and Zhangjiakou in Jing-Jin-Ji, Shanghai and Ningbo in the Yangtze River Delta, and Shenzhen and Guangzhou in the Pearl River Delta are the cores of the network. In general, investments in the four sectors are still concentrated in the eastern coastal region and form several spatially discontinuous high-intensity clusters.

4.2.3. Network Organization

Table 5 lists the 13 cities selected by cities in Jiangsu as the TOP 1 linkage nodes. Shanghai (22), Beijing (8), and Nanjing (5) are the top three cities. Shanghai is selected almost twice as often as the sum of Beijing and Nanjing, while the cumulative times of remaining TOP 1 linkage nodes selected is only 12. It can be said that Shanghai, as the leader of the Yangtze River Delta, is the premier linkage node of cities in Jiangsu.
In terms of different sectors, Shanghai’s advantages are evenly distributed, while Beijing and Nanjing have specific dominant areas. Shanghai is the most frequently linked city across sectors, and the number of times it was selected accounted for about 50% of the number of other TOP 1 cities in each industry. In contrast, Beijing’s influence is mainly reflected in scientific research and leasing. Specifically, Beijing was selected as the TOP 1 linkage city in scientific research and technology services by Xuzhou, Lianyungang, Taizhou and Huai’an, showing strong influence on the northern part of Jiangsu. When it comes to leasing and business services, Beijing’s influence in Jiangsu moves southward and becomes the TOP 1 linkage node for Nanjing, Changzhou and Yangzhou. Nanjing’s advantages are more focused, and being selected as the largest linkage node in the manufacturing sector four times is its rare highlight moment. Other TOP 1 cities appear mainly in the wholesale and retail sector, once again demonstrating the obvious tendency of localized management in this field.

5. Discussion and Conclusions

5.1. Discussion

Coordinating the analysis results of all-industry and subdivided-industry investment networks, we find that Nanjing and Suzhou are the dual cores in Jiangsu Province, and Shanghai, Beijing and Shenzhen are the top three nationwide centers. This finding is slightly different from the existing ranking of Chinese cities in the world economy [22,23]: Shanghai overtakes Beijing as the most influential node in investment networks. In fact, Shanghai is far ahead of Beijing in terms of both the intensity of investment inflows and the number of times it has been selected as the Top 1 linkage node by Jiangsu’s cities. As analyzed earlier, Shanghai’s leading position is due to its close geographical, heritage and cultural ties with Jiangsu. Although this study only analyzes the investment of Jiangsu’s listed firms, the decline of Beijing’s ranking has already been predicted. Existing studies verify that in order to enjoy the benefits of agglomeration economies and staying close to policy makers, headquarters and large companies extremely concentrated in a few major cities in China, and such concentration endows major cities with a dominant position in the financial interactions between cities [39]. However, due to the large number of state-owned bank headquarters and energy giants in Beijing, Beijing is neither considered as a globally nor even domestic leading financial center [40,41]. Instead, Hong Kong, Shanghai, and Shenzhen dominate the bulk of the domestic financial activities in China [40]. In addition, this study finds the rise of Shenzhen in China’s domestic economic exchanges, which is similar to that of Csomós’s [22] study: the Command and Control Index value of Shenzhen holds the greatest increase in China’s cities from 2006 to 2015. Undoubtedly, the rapid economic development of Shenzhen is inseparable from the support of national policies. As early as the 1980s, Shenzhen was selected as one of China’s five major special economic zones, and became the only city currently in the front line. Compared with other special economic zones, there are two reasons for Shenzhen’s success: first, the continuous national polices, including the comprehensive national science center, have produced a snowball effect in attracting capital; second, Shenzhen’s industrial transformation started early, and with its outstanding innovation ability, it has become an important space fulcrum for China to implement the latest national strategy: high-quality economic growth. In short, the analysis results of this study indicate the functional heterogeneity of the three major cities that participate in the world economic activities in China’s domestic economic system: closely connected to political world cities [42], Beijing dominates the flows of state-owned capital and public resources, Shanghai becomes the real capital center, and Shenzhen shows a strong momentum of growing into a new national economic benchmark.
Inside Jiangsu Province, Nanjing is often criticized by the public for not taking full advantage of being the provincial capital. However, our research finds that Nanjing is actively promoting the coordinated development of cities across Jiangsu. On the one hand, in addition to the wholesale and retail sector, the node level of Nanjing under each dimension remains the highest in Jiangsu, showing a strong capital attraction capability. On the other hand, in terms of organizing investment flows, Nanjing not only maintains close linkages with Suzhou, but also spreads a large amount of investment to Suqian, Huai’an, Lianyungang and other economically underdeveloped cities in northern Jiangsu. In contrast, as one of the most developed cities in China, Suzhou’s investment is more market-oriented, focusing on Nanjing and Wuxi which are both economically developed in order to maximize the return on investments. Moreover, in addition to Wuxi’s outstanding performance in the investment network of individual dimensions, other cities in Jiangsu are generally in a position of being dominated.
The impact of China’s state power on investment flows deserves great attention. At present, China is actively building urban agglomerations as an important platform to participate in international completion, and guiding development elements to gather in them. Beijing, Shanghai and Shenzhen, as the central cities of Jing-Jin-Ji, Yangtze River Delta and Pearl River Delta respectively, have attracted a large number of APS (Advanced Productive Service) firms, national financial regulation bodies, state-owned companies and multinationals [17]. Subsequently, the combination of the active financial market, the diverse economic entities, and the abundant infrastructure has enabled Jiangsu’s investments to break through spatial-temporal constraints and flow to the three major urban agglomerations in China. In addition, regional development polices also play a significant role on the economic exchanges between cities. For instance, Jiangsu is more inclined to invest in the regional central cities along the Yangtze River, which is in line with the national strategy of developing the Yangtze River Economic Belt. Based on the correlation analysis between GDP and investment inflows, it is concluded that Hefei ranks in the Top 5 in the positive residuals across sectors, and Hefei is exactly within the scope of two regional development strategies of Yangtze River Economic Belt and Yangtze River Delta urban agglomeration. The other evidence is that some remote cities with underdeveloped economy such as Ili Kazakh in Xinjiang and Lhasa in Tibet have been favored by Jiangsu’ investment to some extent. In fact, since the implementation of the national aid program for Xinjiang and Tibet, Jiangsu has exported a large number of enterprise manages, technical services and capital to the two areas.

5.2. Conclusions

There has been growing attention to applying inter-firm relationships to studying inter-city connections. Based on massive firm investment information, this study describes the mutual investment linkages between cities in Jiangsu and the investment relationships between Jiangsu’s cities and cities outside the province. Compared with China’s existing urban network research which applies the interlocking network model and the headquarter-subsidiary ownership model based on intra-firm structure data, this study identifies inter-city connections through real inter-firm ties, aiming to overcome the limitation of inaccurate and incomplete analysis results due to data and perspective constraints. This study also tries to combine the big data of investment with the small data of economic scale, and through exploratory correlation analysis, to interpret the relationship between GDP and investment inflows.
This study has found that as a result of the collective effects of the state and the market, Shanghai, Beijing, Shenzhen, Nanjing an Suzhou have become constant centers of multi-dimension investment networks. Among them, with the support of national development strategy, Shenzhen has been favored by listed companies in Jiangsu Province across industries, showing the trend of growing into a national economic benchmark. More importantly, this study indicates that there is a trade-off between geographical proximity and opportunity proximity: geographical proximity usually means historical, cultural, territorial and interpersonal ties, which provide the basis for exchanges between firms in different cities. Therefore, listed firms in Jiangsu Province have invested in almost all cities in the Yangtze River Delta region. However, the overall intensity of Jiangsu’s investment in Zhejiang and Anhui provinces is limited, suggesting that the intrinsic dynamics of market induce firms’ investment flowing to areas with high returns. High-intensity investment tends to flow to urban agglomerations with strong central cities, rich opportunities and superior investment environment (for example, Pearl River Delta), or to key areas of state aids, where there are tangible tax and land bonuses (for example, Xinjiang). It is found that the important influence of state power on investment flow, which is different from the conclusion drawn by Ma [28]. However, the strategies of the Rejuvenation of Old Industrial Bases in Northeastern China discussed in that paper has lost its practical effect due to the long history (published around 2000) and too large development scope. At the same time, it is also difficult to evaluate China’s current ‘point to area’ spatial development strategy by taking the province as the research unit, which is to say, the central city first gathers advantageous resources and subsequently radiates the surrounding areas. Another key era change is the rise of China’s internet industry and its deep integration with other sectors [43]. In the information age, citizens’ ways of communication and cooperation, shopping habits, and knowledge acquisition have all changed, and have improved the freedom of economic activities in time and space. In other words, cities locating far away can also be ideal sites for firms to invest.
Taylor [9] posited that urban networks are composed of actors (nodes) and social relations (edges). However, existing studies using firm locations to simulate inter-city connections often treat cities as stationary nodes rather than actors, thus ignoring real and dynamic social relations. In contrast, this study regards firms as individual actors. Through quantifying the real investment linkages between actors, this study makes it possible to discuss the actual economic interactions between cities across sectors. Undoubtedly, there is still a lot of room for information mining about actors’ economic activities, which will support the comparative analysis of different types of firms and the same firm in different periods. Specifically, the former means to distinguish state-owned firms, private firms and foreign-funded ones. Different from GaWC’s study of world city connectivity by mapping inter-city linkages produced by top APS firms or top 75 Forbes companies, a certain proportion of listed companies in Jiangsu have the background of sate-owned capital holding, which explains the important role of state power in their economic activities in this study. An interesting question is embedded in China’s firm networks, whether the investment of pure foreign-funded firms is also obviously affected by the state power; The latter can further derive two research perspectives: one is the influence of the prior origin of the firm on its economic activities; the other is the investment changes of firms before and after the promulgation of major national strategies. However, the premise of these assumptions is to improve the openness of data and collection technology. Moreover, although this study explores the correlation between cities’ GDP and indegree, a series of variables could be further incorporated into gravity model to study factors affecting investment nodes formation. In terms of gravity model, this study found that only incorporating the spatial geometric distance between cities will instead greatly reduce the correlation between GDP and investment inflow. In view of the interdependence between the city’s comprehensive competitiveness and city’s connectivity in diverse kinds of networks created by flows [44], it is believed that the future research on the formation mechanism of investment networks can be greatly promoted by using the city’s economy, human resources, infrastructure, international and other sub-dimension indicators or comprehensive evaluation index to represent the city scale in the gravity model. The key is on the basis of the research strategy of this paper, the future analysis of firm investment network on a wider spatial and industrial dimension is conducive to revealing the real economic status of Chinese cities, and guide local governments to improve the investment environment in more targeted way through summarizing the investment laws of firms and industries.

Author Contributions

Z.L., the first author, completed the research and manuscript under the supervision of Z.F.; Z.F. provides enlightening suggestions for the research ideas and meaningful guidance for the improvement of the article’s academic quality. All authors have read and agreed to the published version of the manuscript

Funding

This research was funded by [National Natural Science Foundation of China] grant number [41571146].

Conflicts of Interest

All authors declare no conflict of interest.

References

  1. Castells, M. The Rise of Network Society, 2nd ed.; Blackwell: Oxford, UK, 2001. [Google Scholar]
  2. Zhao, M.; Wu, K.; Liu, X.; Ben, D. A novel method for approximating intercity networks: An empirical comparison for validating the city networks in two Chinese city-regions. J. Geogr. Sci. 2015, 25, 337–354. (In Chinese) [Google Scholar] [CrossRef]
  3. Beaverstock, J.V.; Smith, R.G.; Taylor, P.J. A roster of world cities. Cities 1999, 16, 445–458. [Google Scholar] [CrossRef]
  4. Alderson, A.S.; Beckfield, J.; Sprague-Jones, J. Intercity relations and globalisation: The evolution of the global urban hierarchy, 1981–2007. Urban Stud. 2010, 47, 1899–1923. [Google Scholar] [CrossRef]
  5. Liu, X.; Derudder, B. Analyzing urban networks through the lens of corporate networks: A critical review. Cities 2013, 31, 430–437. [Google Scholar] [CrossRef] [Green Version]
  6. Feng, Z.; Xia, W.; Jun, Y.; Min, Z. An empirical study on Chinese city network pattern based on producer services. Chin. Geogr. Sci. 2013, 23, 274–285. [Google Scholar] [CrossRef] [Green Version]
  7. Mahutga, M.C.; Ma, X.; Smith, D.A.; Timberlake, M. Economic globalisation and the structure of the world city system: The case of airline passenger data. Urban Stud. 2010, 47, 1925–1947. [Google Scholar] [CrossRef]
  8. Sassen, S. The Global City. New York, London, Tokyo; Princeton University Press: Princeton, NJ, USA, 2001. [Google Scholar]
  9. Taylor, P. World City Network: A Global Urban Analysis; Routledge: London, UK, 2004. [Google Scholar]
  10. Rossi, E.C.; Taylor, P.J. Banking networks across brazilian cities: Interlocking cities within and beyond brazil. Cities 2005, 22, 381–393. [Google Scholar] [CrossRef]
  11. Musil, R. Global capital control and city hierarchies: An attempt to reposition vienna in a world city network. Cities 2009, 26, 255–265. [Google Scholar] [CrossRef]
  12. Neal, Z. Structural determinism in the interlocking world city network. Geogr. Anal. 2012, 44, 162–170. [Google Scholar] [CrossRef]
  13. Alderson, A.S.; Beckfield, J. Power and position in the world city system. Am. J. Sociol. 2004, 109, 811–851. [Google Scholar] [CrossRef] [Green Version]
  14. Rozenblat, C.; Pumain, D. Firm Linkages, Innovation and the Evolution of Urban Systems; Taylor, P.B., Ed.; Taylor & Francis Inc.: New York, NY, USA, 2007. [Google Scholar]
  15. Parnreiter, C. Global cities in global commodity chains: Exploring the role of Mexico city in the geography of global economic governance. Glob. Netw. 2010, 10, 35–53. [Google Scholar] [CrossRef]
  16. Godfrey, B.J.; Zhou, Y. Ranking world cities: Multinational corporations and the global urban hierarchy. Urban Geogr. 1999, 20, 268–281. [Google Scholar] [CrossRef]
  17. Wall, R.S. NETSCAPE: Cities and Global Corporate Networks; Erasmus University: Rotterdam, The Netherlands.
  18. Yeung, H.W.C. The firm as social networks: An organisational perspective. Growth Chang. 2005, 36, 307–328. [Google Scholar] [CrossRef]
  19. Pan, F.; Bi, W.; Lenzer, J.; Zhao, S. Mapping urban networks through inter-firm service relationships: The case of china. Urban Stud. 2017, 54, 3639–3654. [Google Scholar] [CrossRef]
  20. Nohria, N.; Ghoshal, S. The differentiated network: Organizing multinational corporations for value creation. J. Int. Bus. Stud. 1998, 29, 429–431. [Google Scholar] [CrossRef]
  21. Coe, N.M.; Hess, M.; Yeung, H.W.C.; Dicken, P.; Henderson, J. ‘Globalizing’ regional development: A global production networks perspective. Trans. Inst. Br. Geogr. 2004, 29, 468–484. [Google Scholar] [CrossRef]
  22. Csomós, G. Cities as command and control centres of the world economy: An empirical analysis, 2006–2015. Bull. Geogr. Socioecon. Ser. 2017, 38, 7–26. [Google Scholar] [CrossRef] [Green Version]
  23. Raźniak, P.; Dorocki, S.; Winiarczyk-Raźniak, A. Permanence of economic potential of cities based on sector development. Chin. Geogr. Sci. 2017, 1, 125–138. [Google Scholar]
  24. Derudder, B.; Cao, Z.; Liu, X.; Shen, W.; Dai, L.; Zhang, W.; Taylor, P.J. Changing connectivities of Chinese cities in the world city network, 2010–2016. Chin. Geogr. Sci. 2018, 28, 183–201. [Google Scholar] [CrossRef] [Green Version]
  25. Xi, G.; Zhen, F.; He, J.; Gong, Y. City networks of online commodity services in China: Empirical analysis of Tmall clothing and electronic retailers. Chin. Geogr. Sci. 2018, 28, 231–246. [Google Scholar] [CrossRef] [Green Version]
  26. Liang, S.; Cao, Y.; Wu, W.; Gao, J.; Liu, W.; Zhang, W. International Freight Forwarding Services Network in the Yangtze River Delta, 2005–2015: Patterns and Mechanisms. Chin. Geogr. Sci. 2019, 29, 112–126. [Google Scholar] [CrossRef] [Green Version]
  27. Battiston, S.; Rodrigues, J.F.; Zeytinoglu, H. The network of inter-regional direct investment stocks across Europe. Adv. Complex Syst. 2007, 10, 29–51. [Google Scholar] [CrossRef] [Green Version]
  28. Ma, Y.Y.; Zhuang, X.T.; Li, L.X. Research on the relationships of the domestic mutual investment of china based on the cross-shareholding networks of the listed companies. Phys. A Stat. Mech. Appl. 2011, 390, 749–759. [Google Scholar] [CrossRef]
  29. Jun, Y.; Feng, Z.; Chunhui, W. China’s city network pattern: An empirical analysis based on financial enterprises layout. Econ. Geogr. 2011, 31, 754–759. (In Chinese) [Google Scholar]
  30. Qian, C.; Li-zhen, S.; Feng, Z. Spatial evolution of China’s internet enterprises and the characteristics of city network. Hum. Geogr. 2018, 33, 97–105. (In Chinese) [Google Scholar]
  31. Li, X.D. Spatial structure of the Yangtze river delta urban network based on the pattern of listed companies network. Prog. Geogr. 2014, 33, 1587–1600. (In Chinese) [Google Scholar]
  32. Lei, Y.E.; Xuejun, D.U. City network structure of the Yangtze River Delta region based on logistics enterprise network. Prog. Geogr. 2016, 35, 622–631. (In Chinese) [Google Scholar]
  33. Yaling, Y.E.; Bofei, Y.A.; Ziyun, H.E.; Beini, Z.E.; Fenghua, P.A.; Cheng, F.A. Spatial structure of urban network based on Chinese A-share listed medicine enterprise network. Prog. Geogr. 2018, 37, 1096–1105. (In Chinese) [Google Scholar]
  34. Yexi, Z.; Yu, F.; Zhizhou, Z.; Xiaojing, W. Network structure of listed companies based on the relationship of parent and subsidiary enterprises: A case of the middle Yangtze urban agglomeration. Resour. Environ. Yangtze Basin 2018, 27, 1725–1734. (In Chinese) [Google Scholar]
  35. Bingquan, L.; Renxu, G.; Hao, M. Comparative study on spatial expansion of automobile enterprises of different ownerships in east China. Econ. Geogr. 2019, 39, 30–39. (In Chinese) [Google Scholar]
  36. Zilai, T.; Tao, L.; Can, L. Research on the interlocking network of major cities in China. City Plan. Rev. 2017, 1, 28–40. (In Chinese) [Google Scholar]
  37. Leng, B.; Yang, Y.; Li, Y.; Zhao, S. Spatial characteristics and complexity analysis of urban economic network structure in China. Acta Geogr. Sin. 2011, 66, 199–211. (In Chinese) [Google Scholar]
  38. Nazarczuk, J.M.; Umiński, S.; Brodzicki, T. Determinants of the spatial distribution of exporters in regions: The role of ownership. In The Annals of Regional Science; Springer: Olsztyn, Poland, 2019; pp. 1–28. [Google Scholar] [CrossRef] [Green Version]
  39. Pan, F.; Xia, Y. Location and agglomeration of headquarters of publicly listed firms within china’s urban system. Urban Geogr. 2014, 35, 757–779. [Google Scholar] [CrossRef]
  40. Lai, K. Differentiated markets: Shanghai, Beijing and Hong Kong in china\s financial centre network. Urban Stud. 2012, 49, 1275–1296. [Google Scholar] [CrossRef]
  41. Chen, K.; Chen, G. The rise of international financial centers in mainland china. Cities 2015, 47, 10–22. [Google Scholar] [CrossRef]
  42. Taylor, P.; Derudder, B.; Hoyler, M.; Ni, P.; Witlox, F. City-Dyad Analyses of China’s Integration into the World City Network. Urban Stud. 2014, 51, 868–882. [Google Scholar] [CrossRef] [Green Version]
  43. Feng, Z.; Bo, W.; Zongcai, W. The rise of the internet city in China: Production and consumption of internet information. Urban Stud. 2014, 52, 2313–2329. [Google Scholar] [CrossRef]
  44. Zherui, L.; Feng, Z.; Gang, H.; Xiao, Q. Measurement of Urban Centrality Based on Multi-Source Data and Its Planning Application—A Case Study of Changzhou. Urban Plan. Forum 2019, 250, 111–118. (In Chinese) [Google Scholar]
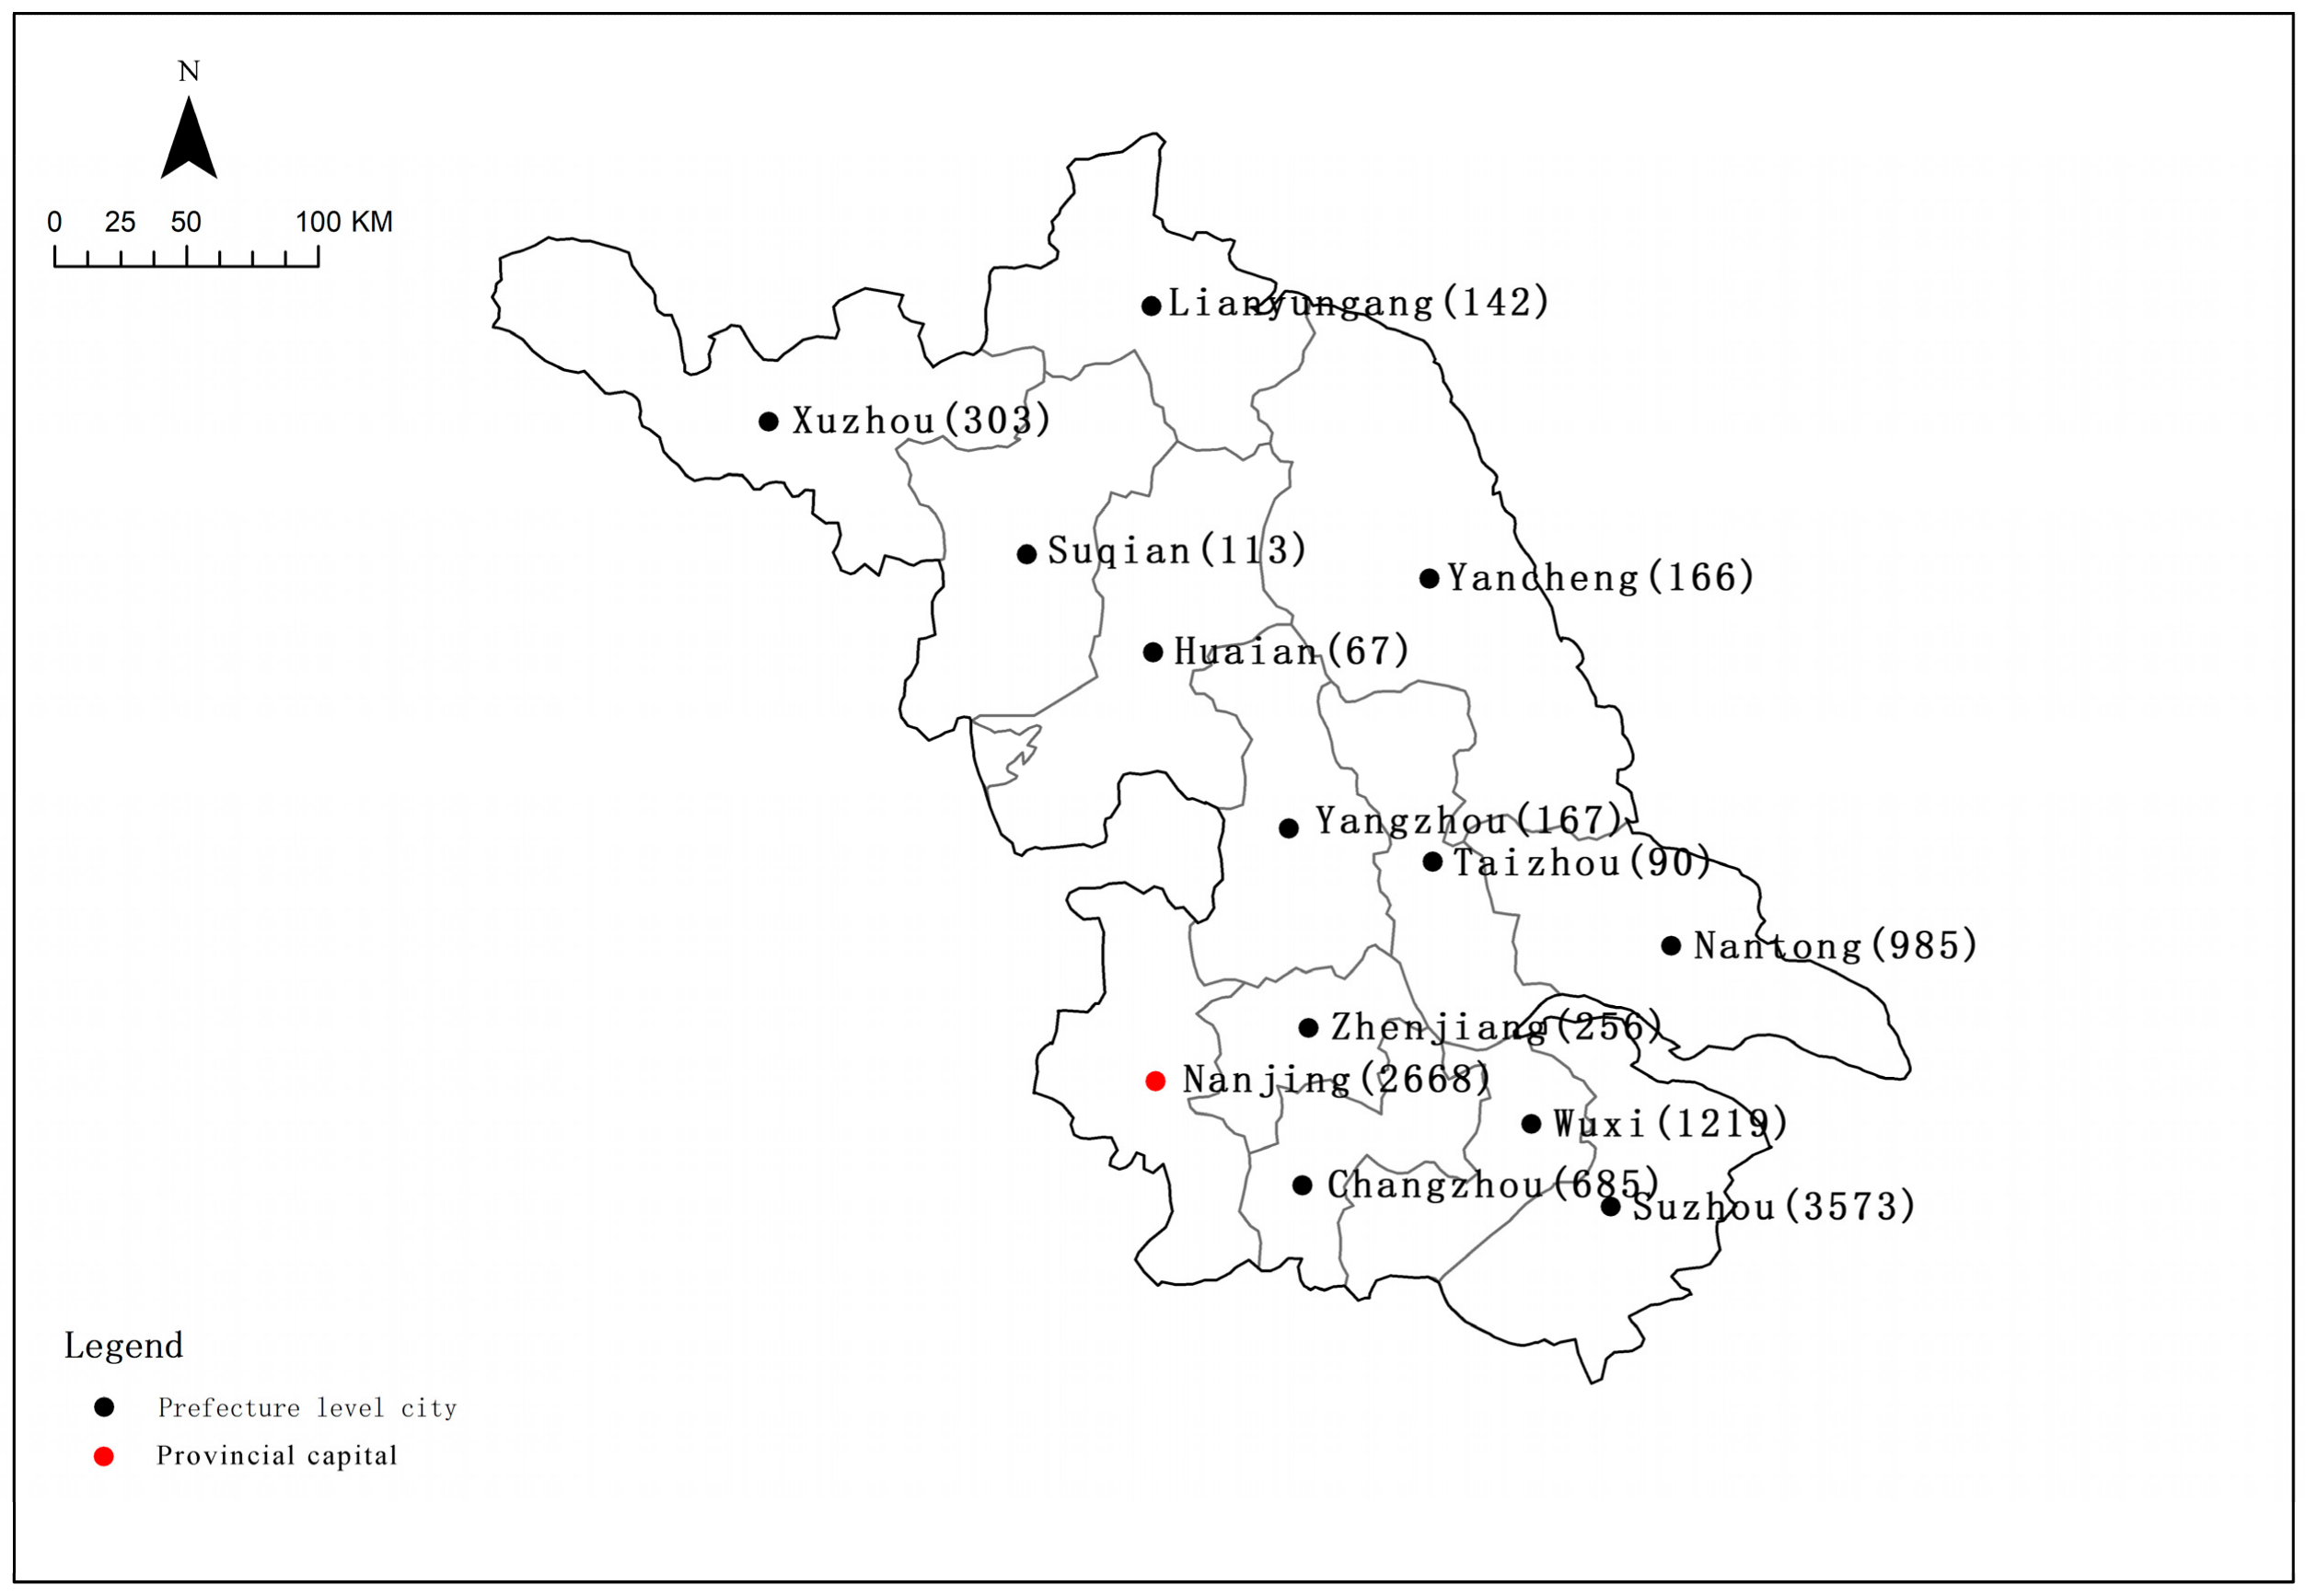
Figure 1. Geographical distribution of cross-city investment outflow. Source: Drawn by authors.
Sustainability 12 00089 g001
Figure 2. Node hierarchy of all-industry investment networks. Source: Drawn by authors.
Sustainability 12 00089 g002
Figure 3. Correlation analysis between GDP and all-industry investment. Source: Drawn by authors.
Sustainability 12 00089 g003
Figure 4. Investment flows of all-industry between cities in Jiangsu Province (the left column lists investment origins and the right column refers to destinations). Source: Drawn by authors.
Sustainability 12 00089 g004
Figure 5. Investment flows of all-industry between cities in and outside Jiangsu Province. Source: Drawn by authors.
Sustainability 12 00089 g005
Figure 6. Node hierarchy of subdivided industry investment networks. Source: Drawn by authors. (a) Manufacturing; (b) Wholesale and retail; (c) Scientific research and technology services; (d) Leasing and business services.
Sustainability 12 00089 g006aSustainability 12 00089 g006b
Figure 7. Correlation analysis between GDP and the investment of subdivided industries. Source: Drawn by authors. (a) Manufacturing; (b) Wholesale and retail; (c) Scientific research and technology services; (d) Leasing and business services.
Sustainability 12 00089 g007aSustainability 12 00089 g007b
Figure 8. Node hierarchy of subdivided industry investment networks. Source: Drawn by authors. (a) Manufacturing; (b) Wholesale and retail; (c) Scientific research and technology services; (d) Leasing and business services.
Sustainability 12 00089 g008
Figure 9. Investment flows of subdivided industry between cities in and outside Jiangsu Province. Source: Drawn by authors. (a) Manufacturing; (b) Wholesale and retail; (c) Scientific research and technology services; (d) Leasing and business services.
Sustainability 12 00089 g009
Table 1. Industrial distribution of cross-city investment linkages based on origins.
IndustryNumber of Investment Linkages
Manufacture3928
Wholesale and retail 2203
Scientific Research and Technology Services1587
Leasing and Business Services 678
Information transmission, software and technology services348
Electricity, Thermal, Gas and Water Production and Supply 316
Finance288
Water Conservancy, Environment and Public Facilities Management260
Transportation, Warehousing and Postal Service236
Real Estate225
Construction212
Culture, Sports and Entertainment45
Agriculture, forestry, animal husbandry and fishery 39
Education19
Health and social work7
Resident Services, Repair and Other Services3
Total10394
Source: Drawn by authors.
Table 2. Top 5 cities with positive residuals in all industry.
IndustryCityResiduals
AllHefei28.80
Wuhu19.69
Guiyang19.56
Xiamen18.84
Xian18.75
Source: Drawn by authors.
Table 3. TOP 1 linkage nodes of cities in Jiangsu Province.
City in JiangsuTOP 1 Linkage City
SuzhouShanghai
NanjingShenzhen
WuxiShanghai
NantongShanghai
ChangzhouShanghai
XuzhouShanghai
ZhenjiangShanghai
YangzhouShanghai
YanchengShanghai
LianyungangNingbo
SuqainNanjing
TaizhouShanghai
HuaianNanjing
Source: Drawn by authors.
Table 4. Top 5 cities with positive residuals in subdivided industries.
IndustryCityResiduals
ManufacturingHefei31.52
Dongguan26.00
Zhuhai19.50
Shenyang18.53
Weifang14.68
Wholesale and
Retail
Hefei28.63
Guiyang25.13
Kunming23.33
Fuzhou21.79
Jinan21.21
Scientific research and
technology services
Xiamen28.31
Taiyuan27.30
Hefei24.25
Xian22.19
Nanchang22.12
Leasing and
Business services
Ningbo31.33
Nanchang21.35
Hefei19.10
Tianjin18.36
Hangzhou17.75
Source: Drawn by authors.
Table 5. TOP 1 nodes linked by cities of Jiangsu.
zManufacturingWholesale and RetailScientific Research
and Technology Services
Leasing and
Business Services
SuzhouNanjingShanghaiShanghaiShanghai
NanjingShenzhenShanghaiShenzhenBeijing
WuxiShanghaiNantongShanghaiHangzhou
NantongShanghaiShanghaiShanghaiShanghai
ChangzhouShanghaiSuzhouShanghaiBeijing
XuzhouShanghaiYichangBeijing-
ZhenjiangShanghaiShanghaiYangzhouShanghai
YangzhouNanjingShanghaiSuzhouBeijing
YanchengShanghaiXuzhouShanghaiGuangzhou
LianyungangShanghaiNingboBeijingShanghai
SuqainNanjingNanjing--
TaizhouBeijingHefeiBeijing-
HuaianNanjingShanghaiBeijing-
Source: Drawn by authors.