Abstract
Rwanda has experienced accelerated soil erosion as a result of unsustainable human activities and changes in land use. Therefore, this study aimed at applying the RUSLE (Revised Universal Soil Loss Equation) model using GIS (Geographical Information System) and remote sensing to assess water erosion in Rwanda, focusing on the erosion-prone lands for the time span 2000 to 2015. The estimated mean annual soil losses were 48.6 t ha−1 y−1 and 39.2 t ha−1 y−1 in 2000 and 2015, respectively, resulting in total nationwide losses of approximately 110 and 89 million tons. Over the 15 years, 34.6% of the total area of evaluated LULC (land use/land cover) types have undergone changes. The highest mean soil loss of 91.6 t ha−1 y−1 occurred in the area changing from grassland to forestland (0.5%) while a mean soil loss of 10.0 t ha−1 y−1 was observed for grassland converting to cropland (4.4%). An attempt has been made to identify the embedded driving forces of soil erosion in Rwanda. As a result, we found that mean soil loss for Rwanda’s districts in 2015 was significantly correlated with poverty (r = 0.45, p = 0.013), increased use of chemical fertilizers (r = 0.77, p = 0.005), and especially was related to extreme poverty (r = 0.77, p = 0.000). The soil conservation scenario analysis for Rwanda’s cropland in 2015 revealed that terracing could reduce the soil loss by 24.8% (from 14.6 t ha−1 y−1 to 11.7 t ha−1 y−1). Most importantly, the study suggests that (1) terracing integrated with mulching and cover crops could effectively control water erosion while ameliorating soil quality and fertility, and (2) reforestation schemes targeting the rapid-growing tree species are therefore recommended as an important feature for erosion control in the study area.
1. Introduction
Soil erosion is currently the major contributor to the degradation of the global soil resource [1]. A recent study conducted by Borrelli et al. [2] reported that a soil erosion rate of 35.9 Pg yr−1 occurred worldwide. The on-site and off-site effects attributed to soil erosion include decline of soil productivity [3], and environmental damage through sedimentation, pollution and increased flooding [4]. The loss of soil due to water erosion degrades the arable land and eventually renders it unproductive [5], consequently resulting in a drop in potential agricultural productivity and giving rise to concerns about food security [6]. Humans worldwide obtain more than 99.7% of their food (calories) from the land and less than 0.3% from the oceans and other aquatic ecosystems [7]; however, about 10 million ha of cropland are lost each year due to soil erosion [8]. Humans have increased the sediment transported by global rivers through soil erosion by 2.3 ± 0.6 billion metric tons per year [9,10]. So, the consequences of soil erosion for society could be severe [6]. Though soil erosion occurs gradually through the process of detachment, transport and deposition of soil particles due to rainfall and runoff, erosion becomes problematic when it is accelerated [11]. Accelerated soil erosion is primarily driven by modifications in land use and management [2], generally attributed to human and policy interventions since social, economic and policy causes influence the type of land use and management [4].
Land use/land cover change (LULCC) remains a global challenge: one estimate indicates that 109 hectares of natural ecosystems may be converted to agriculture by 2050 [12]. In addition, forests cover nearly one-third of the Earth’s land area [13] and experienced a total loss of 2.3 million km2 from 2000 to 2012 due to disturbance [14]. Clearance of forest and the related natural vegetation on steep topography can dramatically enhance the risk of soil erosion. Globally, Rwanda is among the two countries most highly susceptible to water erosion [2], mainly driven by a rapidly growing population with limited economic and agricultural options elsewhere in the nation [15], a fragile soil [16], steep slopes and intense rainfall [17]. Rwanda is prone to natural hazards including mass wasting, especially landslides [18], dominating in the western, northern and southern provinces [19], thereby exposing soils to erosion. In 2005, about 77% of Rwanda’s total surface area was threatened by soil erosion, of which 38% of the land had to be safeguarded from erosion and 39% was considered to be at high risk [20,21]. To cope with this erosion, efforts for erosion control have been made since the 1930s [22]. For instance, in 2006, many districts and Non-Governmental Organizations [23] have created bench terraces on large areas in all Agro-Ecological Zones (AEZs) of Rwanda [24]. Nevertheless, soil erosion continues to persist in Northern Rwanda because of over-cultivation on small farmlands with steep slopes, insufficient soil conservation (SC) techniques, limited financial capacity and inadequate practical training to maintain existing SC techniques [20]. The total contribution of agriculture on Gross Domestic Product (GDP) increased from 29% in 2016 to 31% in 2017 [25], indicating that agriculture remains the main activity for the majority of the Rwandan population. According to previous researchers [26,27], about 83.4% of the population is dependent on subsistence agriculture. Thus, with the current population density of 467 people/km2 [25], land scarcity has led to the abandonment of fallow periods and the rural population density of >700% people per km2 has pushed small-holder farmers to cultivate the steep slopes [28]. Crop productivity in Rwanda is declining [29] as a result of over-cultivation and soil erosion [17]. Responding to this, local farmers are supplied with inorganic fertilizers through the government’s support of subsidized prices. Presently, NPK (Nitrogen-Phosphorus and Potassium), DAP (Di-Ammonium Phosphate), Urea and KCL (Potassium Chloride) + Blend are the most widely used types of fertilizers, estimated to be 60,903 metric tons in 2018–2019, of which 17,133 and 43,770 metric tons was applied on cash and food crops, respectively [30].
In situ measurement of soil erosion is expensive and time-consuming on a large scale. Therefore, advances in technology, such as development of erosion models and increases in computation power for spatial analysis, have assisted in making soil erosion modeling faster and more accurate [31]. In a previous study, Karydas et al. [32] identified 82 water-erosion models and classified them based on their spatial/temporal scale and spatial methodologies. The most extensively used erosion model is the USLE (Universal Soil Loss Equation model) [33] and its revised version (RUSLE) [34]. Some attempts have been made to spatially assess erosion at a national scale [26,35] and at a local level in Rwanda [9,28,29,36,37]. However, the impacts of land use change (LUC) on water erosion have not been documented, since accelerated soil erosion is primarily driven by modifications in land use (LU) and management [2]. Moreover, examining soil loss in relation to changing LU is of great importance for adoption of proper LU planning and the development of soil conservation practices. One way to investigate the effect of LUC on soil erosion involves using historic or temporal satellite images to analyze the LULCC in relation to changes in soil erosion [38,39]. Therefore, the objectives of this research were: (a) to explicitly assess soil loss caused by rill and interrill erosion in Rwanda for the time span 2000 to 2015, using the RUSLE model; (b) to examine the impacts of LULCC in relation to estimated changes in soil erosion over the last 15 years; and (c) to identify the driving forces of soil erosion in the study area.
2. Materials and Methods
2.1. Study Area
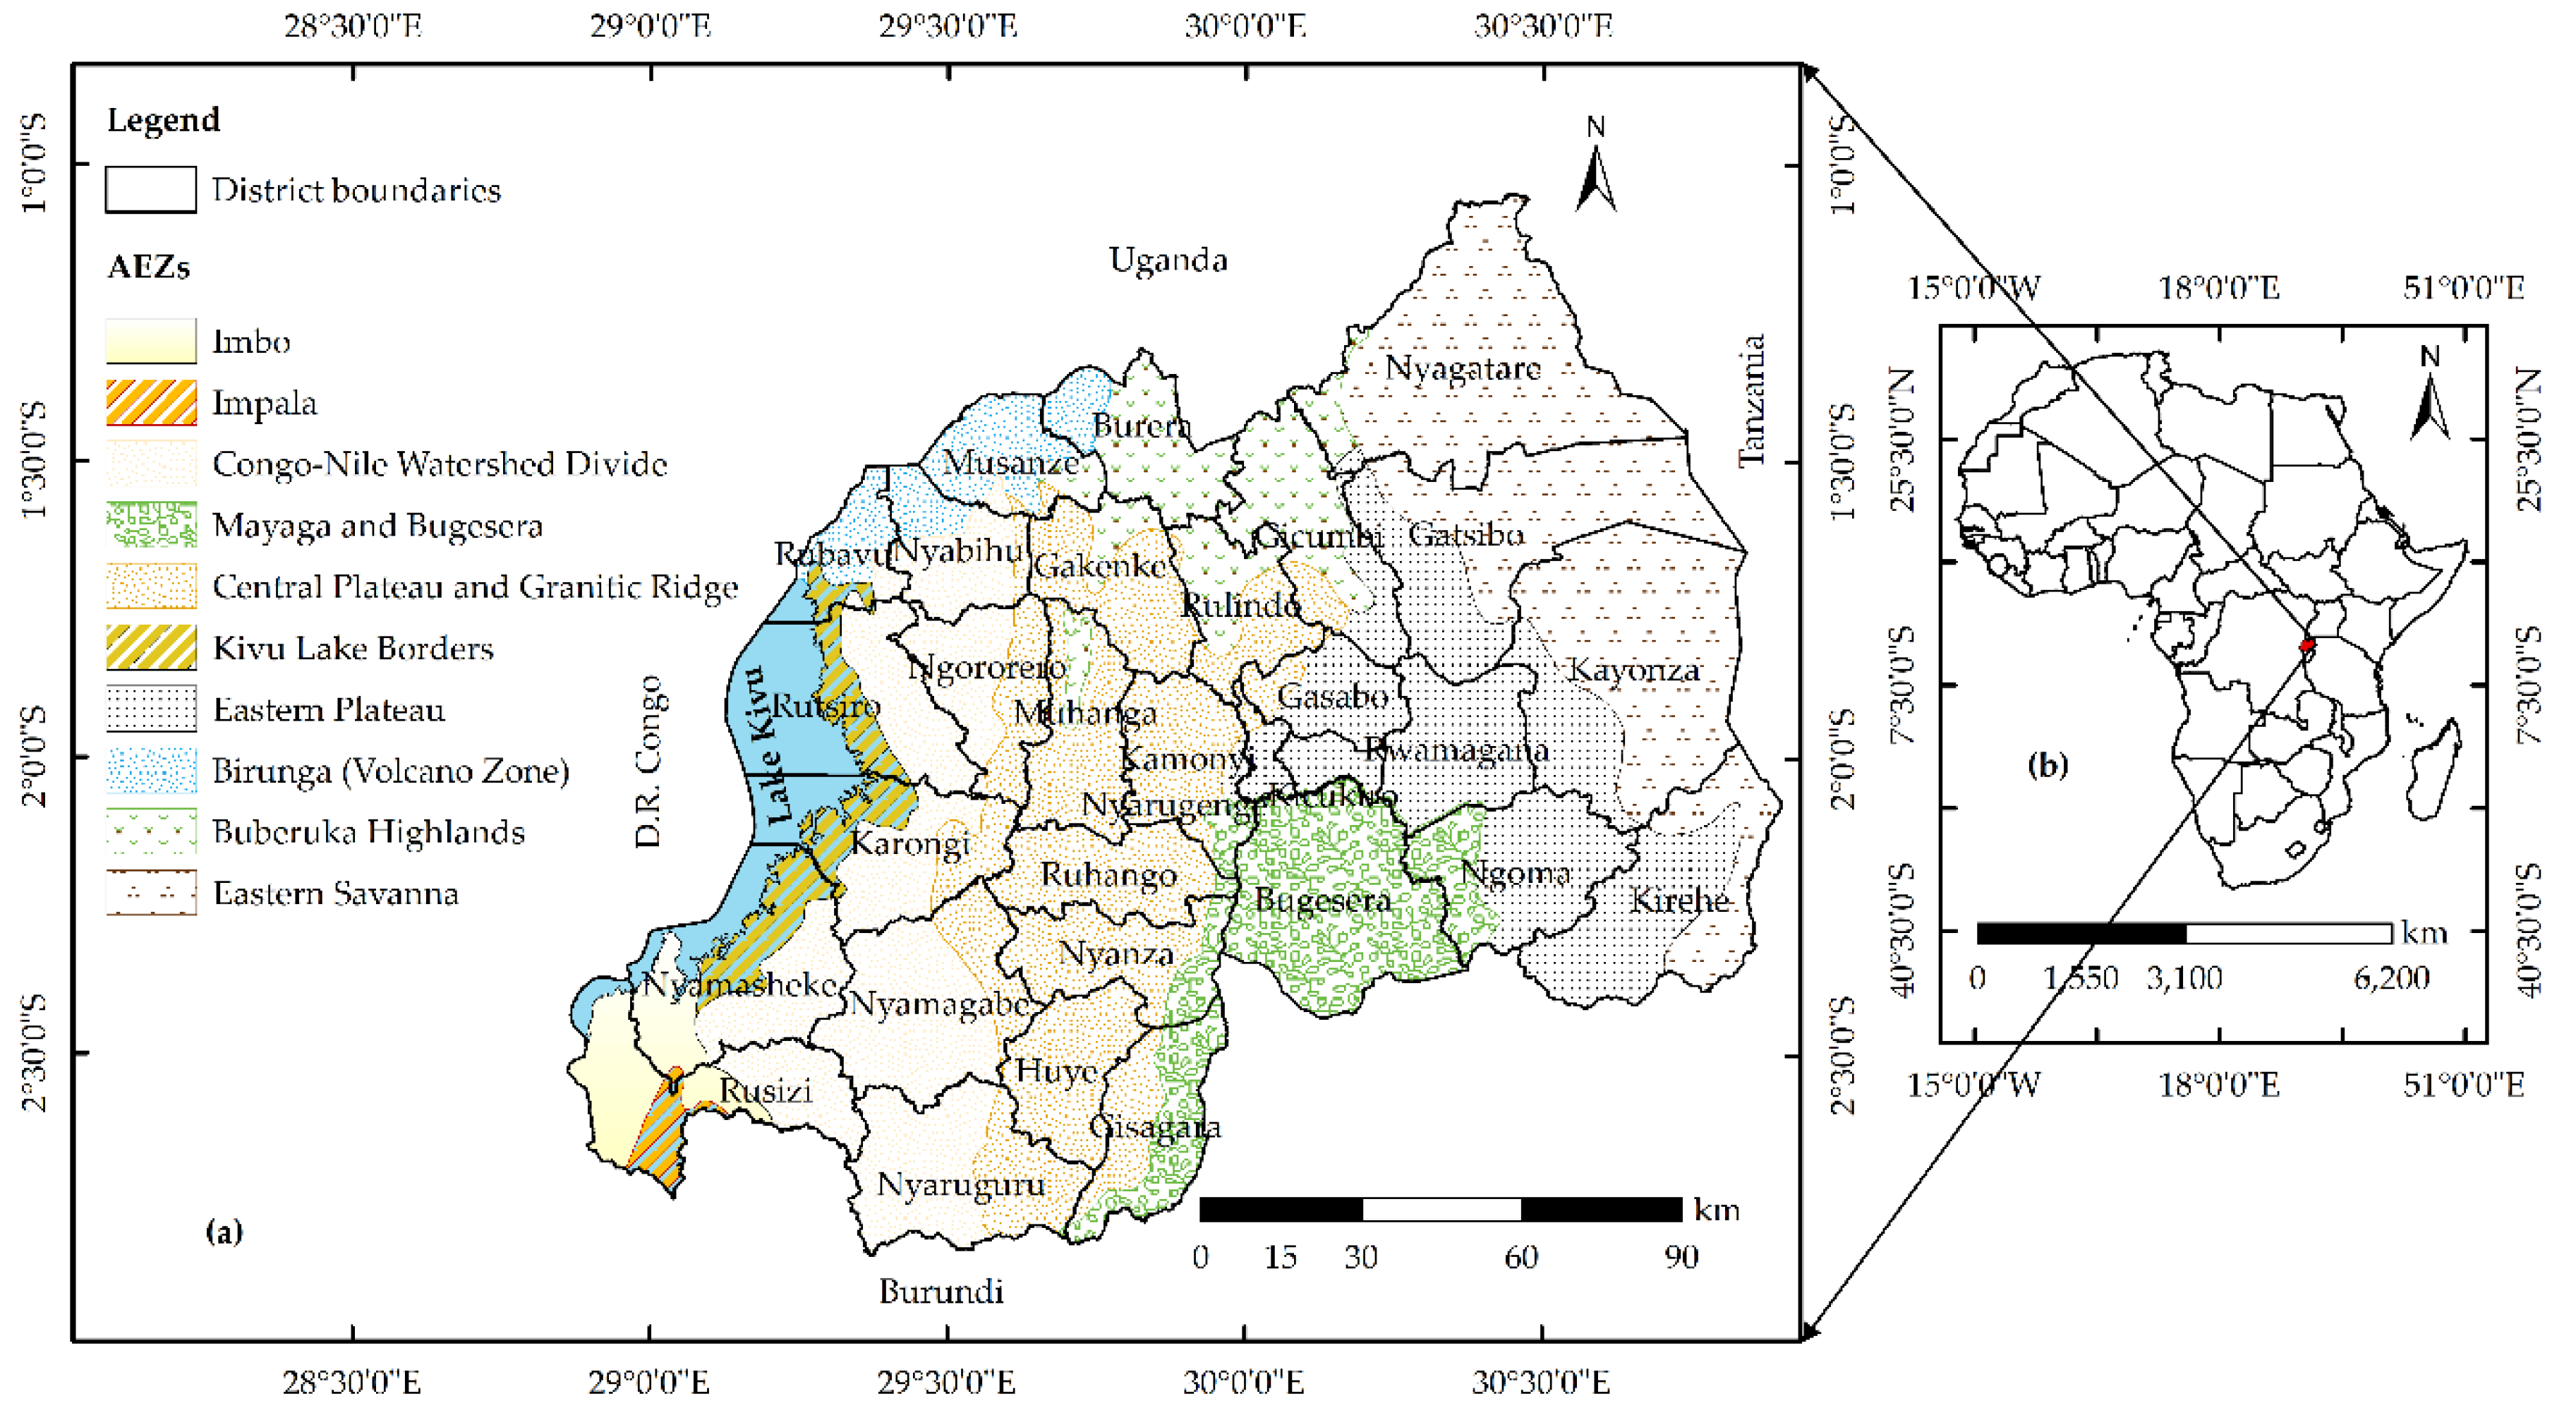
This study focuses on Rwanda, a landlocked country geographically located in East Africa with a total surface area of 26,338 km2, of which 2120 km2 is occupied by water and swamps [40]. The country lies between 1°4′ and 2°51′ south latitude and 28°45′ and 31°15′ east longitude, and it is bordered by Uganda to the north, Burundi to the south, Tanzania to the east and the Democratic Republic of the Congo (D.R. Congo) to the west (Figure 1).
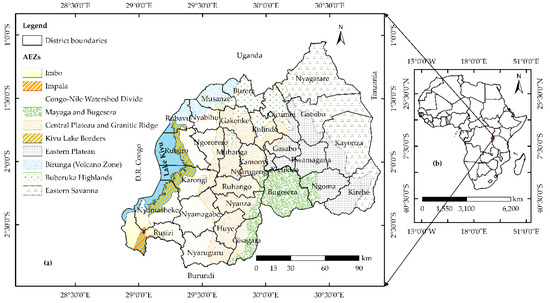
Figure 1.
Map of the study area: (a) administrative districts and agro-ecological zones of Rwanda; and (b) its location on the African continent.
Rwanda has ten agro-ecological zones [41], and the country is made up of 30 administrative subdivisions locally known as districts (Figure 1). Despite its proximity to the equator, Rwanda enjoys a tropical climate moderated by hilly topography [42], lying at an altitude ranging between 915 and 4486 m above sea level (m.a.s.l.) [43] which increases from east to west. The climate is typically made up of four seasons, of which two wet seasons (March–May and September–December) alternate with two dry seasons (January–February and June–August) [28,43].
The country’s relief features contribute to differences in weather patterns [44]. The eastern lowlands region is the driest and warmest (and topographically lowest) part of Rwanda, while the mountains along the Nile-Congo divide represent the wettest and coldest (and topographically highest) region [45]. Regarding rainfall and temperature distributions, the highlands include the Congo-Nile Ridge and Volcanic Chains of Birunga (2000 to 4500 m.a.s.l.) which benefit from annual rainfall ranging between 1300 and 1550 mm, and mean annual temperatures of between 10 and 14 °C [46]. The lowlands, the most vulnerable region to drought due to low amount of rainfall [16], receive rainfall varying between 740 and 1100 mm annually [47], and mean annual temperatures ranging from 19 to 22 °C [48]. In addition, the region around Lake Kivu and the plateau region to the east of the Nile-Congo divide are at intermediate elevation, temperature and precipitation levels [49].
The Rwandan soils are naturally fragile, derived from physico-chemical alteration of basic schistose, gneissic, quartzite, granite and volcanic rocks [16,26]. With a total population of about 11.263 million in 2015 [40], projected to be 15.655 million in 2025 and 22.046 million in 2050 [50], Rwanda is one of the most densely populated countries in Africa [26]. The economy is largely based on rain-fed agricultural production from small, semi-subsistence, and increasingly fragmented farms [51], where more than 60%, 50% and 25% of the farming households cultivate less than 0.7, 0.5 and 0.2 ha of land, respectively [52]. Intensive farming practices on steep slopes across the country, which lead to soil loss and declining soil fertility [17], have put high pressure on land resources [26]. Currently, maize, rice, wheat, Irish potato, beans and cassava are the priority crops grown in Rwanda, aligning within the policy of the Crop Intensification Programme (CIP) initiated by the government in 2007 [53].
2.2. Land Use/Land Cover (LULC) of Rwanda
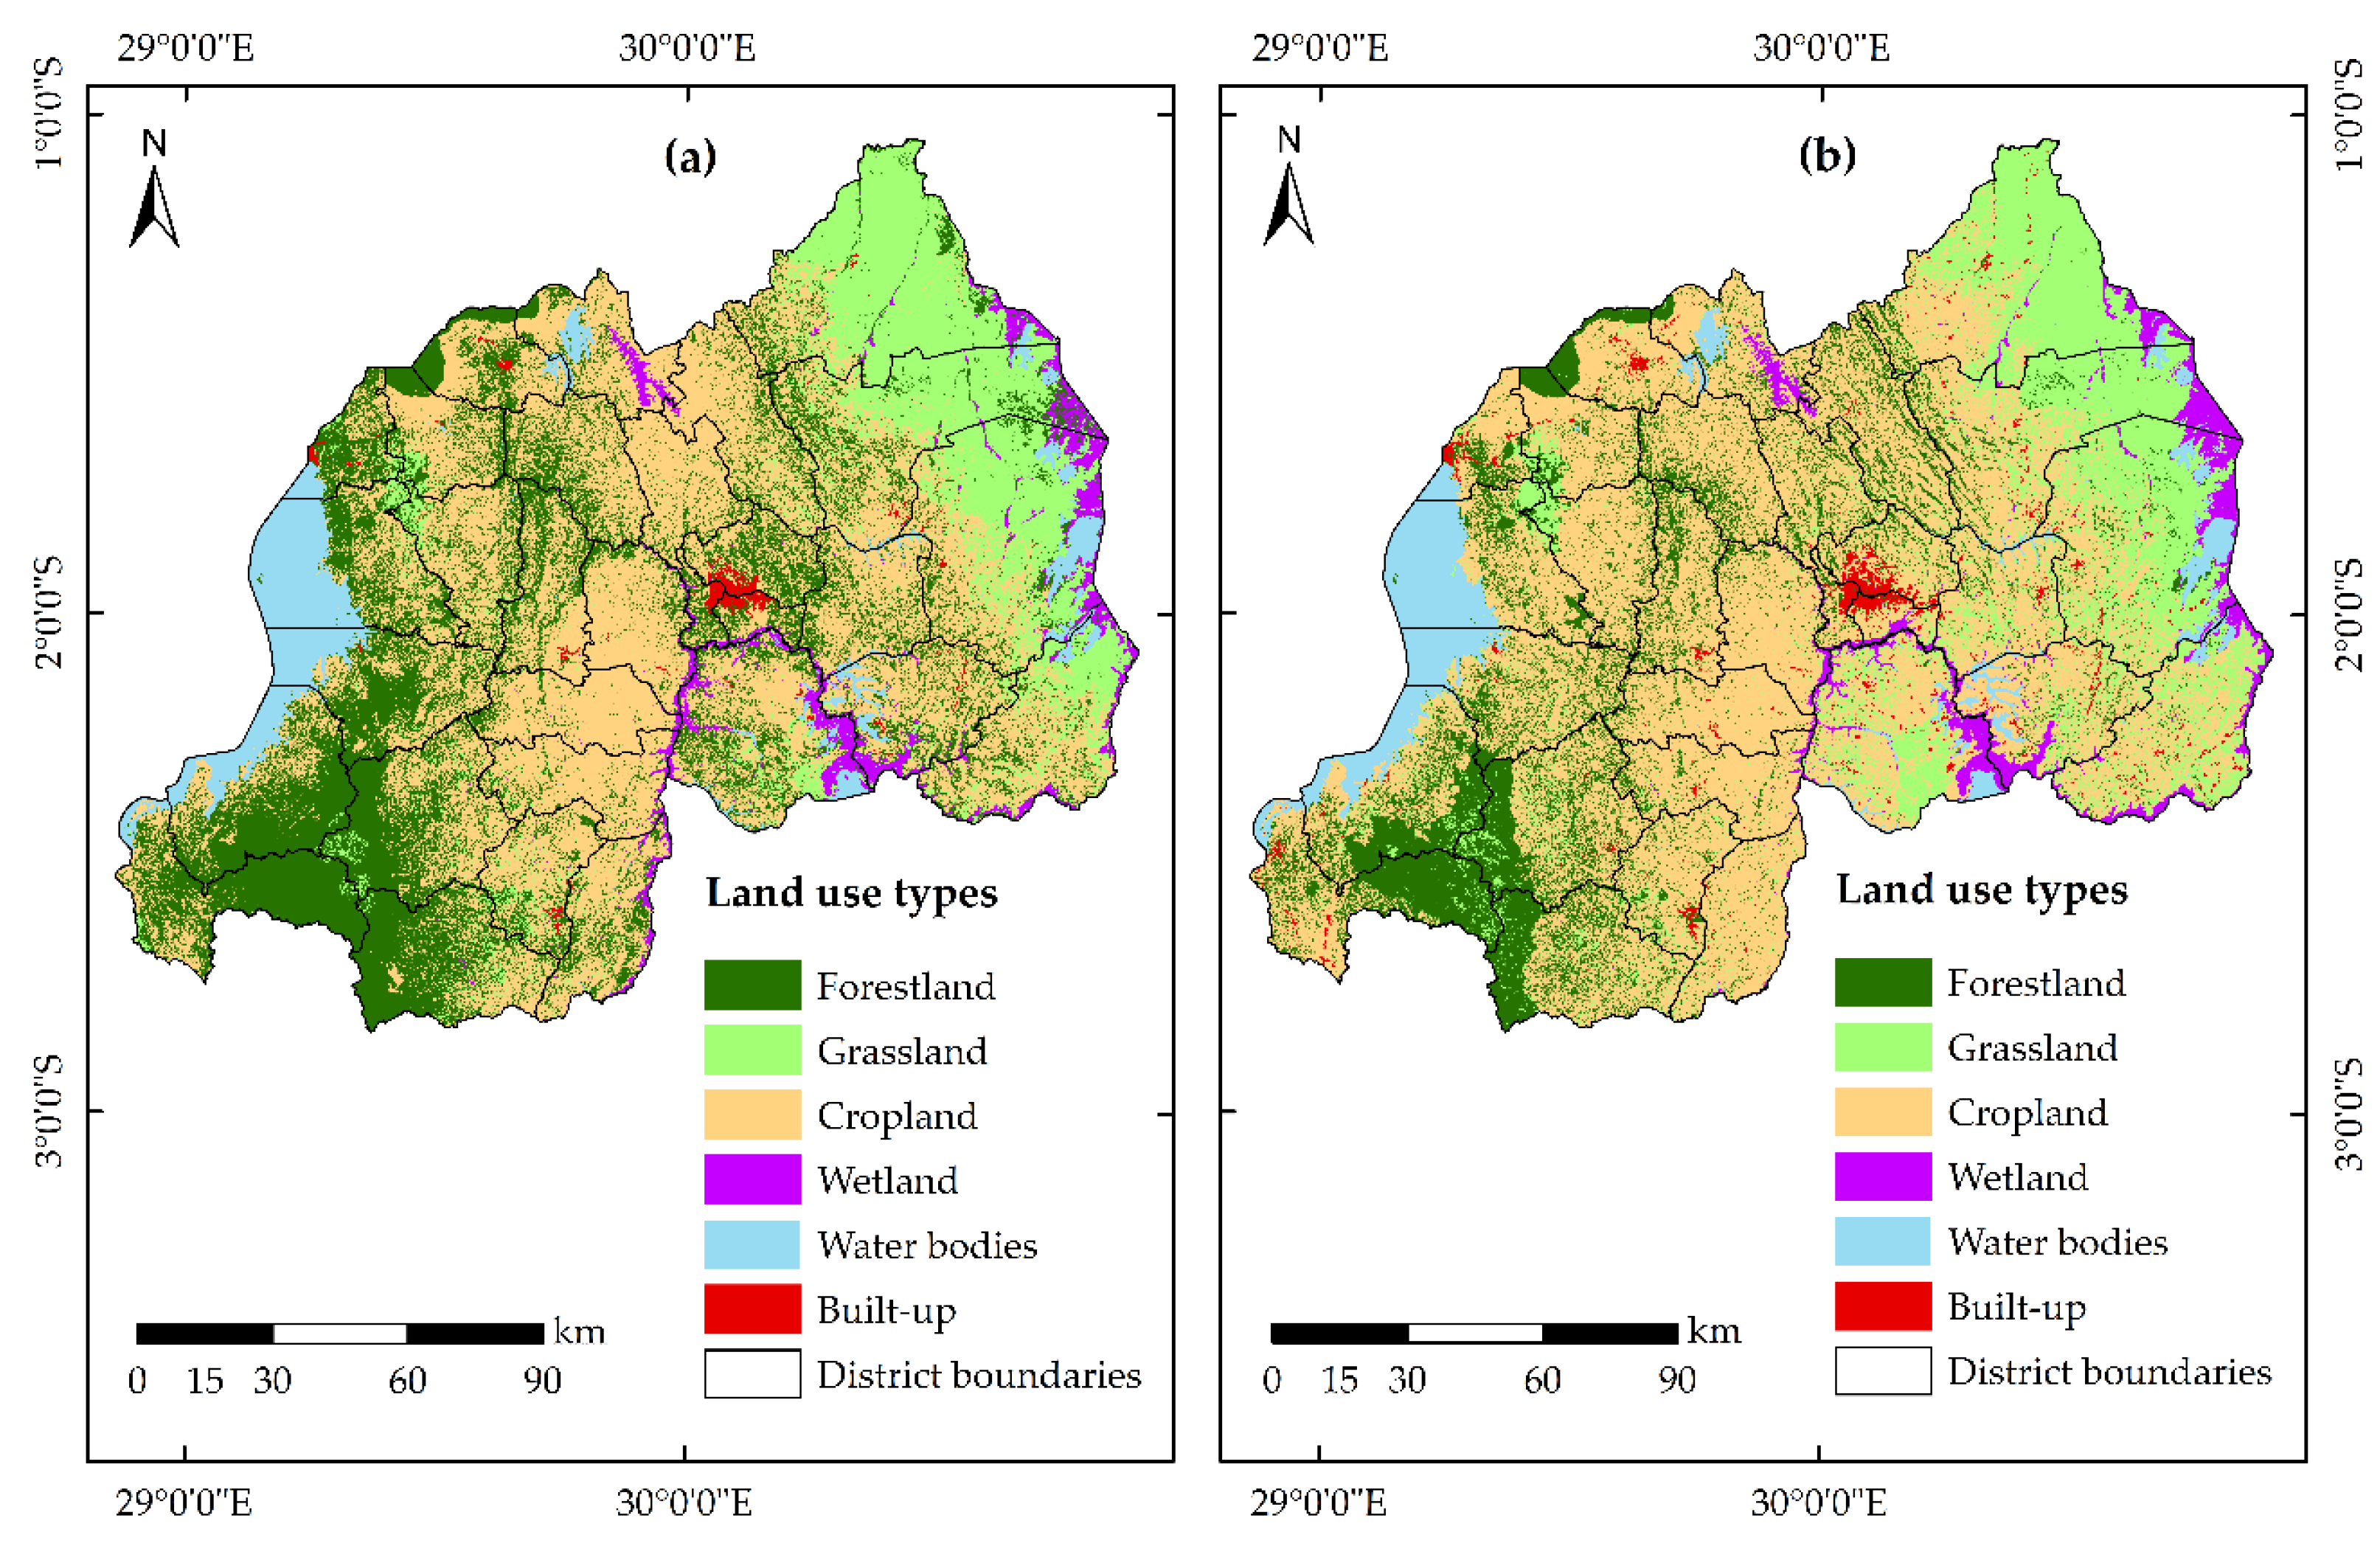
Previous studies indicated that the rates of soil erosion are generally different for various types of LULC [54,55,56]. Related to this, the surface areas that are not prone to soil erosion, such as urban areas, bare rocks, glaciers, wetlands, lakes, rivers, inlands waters and marine waters [54,57], were not considered in this study. Therefore, the LULC maps of Rwanda for 2000 and 2015 (Figure 2) provided by the Regional Centre for Mapping of Resources for Development (RCMRD) [58] at 30 m resolution were used to separate erosion-prone (forestland, grassland and cropland) and non-erosion prone areas (wetland, water bodies and built-up) in ArcGIS.
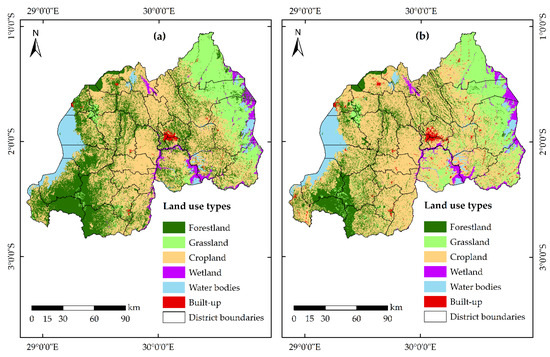
Figure 2.
Land use/land cover distribution maps for Rwanda: (a) 2000 and (b) 2015.
Based on the land use maps of Rwanda (Figure 2), this research considered the erosion-prone lands, occupying a total surface area of about 22,789.7 km2 (86.5%); the remaining 3548.3 km2 (13.5%) was covered by non-erodible lands. Within the erosion-prone lands, a total area of 7475.0 km2 (32.8%), 4056.6 km2 (17.8%) and 11,258.1 km2 (49.4%) was covered by forestland, grassland and cropland in 2000, respectively. In 2015, estimates were 4352.8 km2 (19.1%) for forestland, 4854.2 km2 (21.3%) for grassland and 13,582.7 km2 (59.6%) for cropland.
The humid natural forest, eucalyptus plantations and degraded natural forest are the dominant forest types across Rwanda [59]. Natural events, such as landslides [19] and human causes, including cropland expansion, timber harvesting, charcoal and firewood demands, logging operations, and illegal mining activities in forestland without appropriate technology for forest protection, constitute unsustainable practices posing serious disturbances on forest ecosystems [26,28,59,60]. Therefore, impacts arising from human disturbances, coupled with natural hazards, can reduce forest sustainability and soil productivity [61].
2.3. The RUSLE Model
The RUSLE [34], derived from the USLE [33], is an empirically-based modeling approach developed for estimating long-term mean annual soil loss due to rill and interrill erosion (Equation (1)). The model was originally designed at the agricultural plot scale for farmland in the United States of America [36] but it has since been applied in many other countries, at many other scales, and in many other geo-climatic regions [31].
where A = Annual average soil loss (t ha−1 y−1); R = Rainfall erosivity factor (MJ mm ha−1 h−1 y−1); K = Soil erodibility factor (t ha h ha−1 MJ−1 mm−1); LS = Slope length and slope steepness factor (dimensionless); C = Cover management factor (dimensionless); and P = Support practice factor (dimensionless).
All the datasets (Table 1) with resolutions ≥250 m were first geo-registered to the same Universal Transverse Mercator (UTM) coordinate system, then harmonized to 30 m resolution using the Inverse Distance Weighted (IDW) interpolation technique in ArcGIS 10.5 software, for the purpose of producing the high-resolution soil loss maps. In this research, the RUSLE model was run to quantify soil loss for Rwanda in 2000 and 2015.

Table 1.
Model input datasets with corresponding geospatial resolution and source.
2.3.1. Rainfall Erosivity (R) Factor
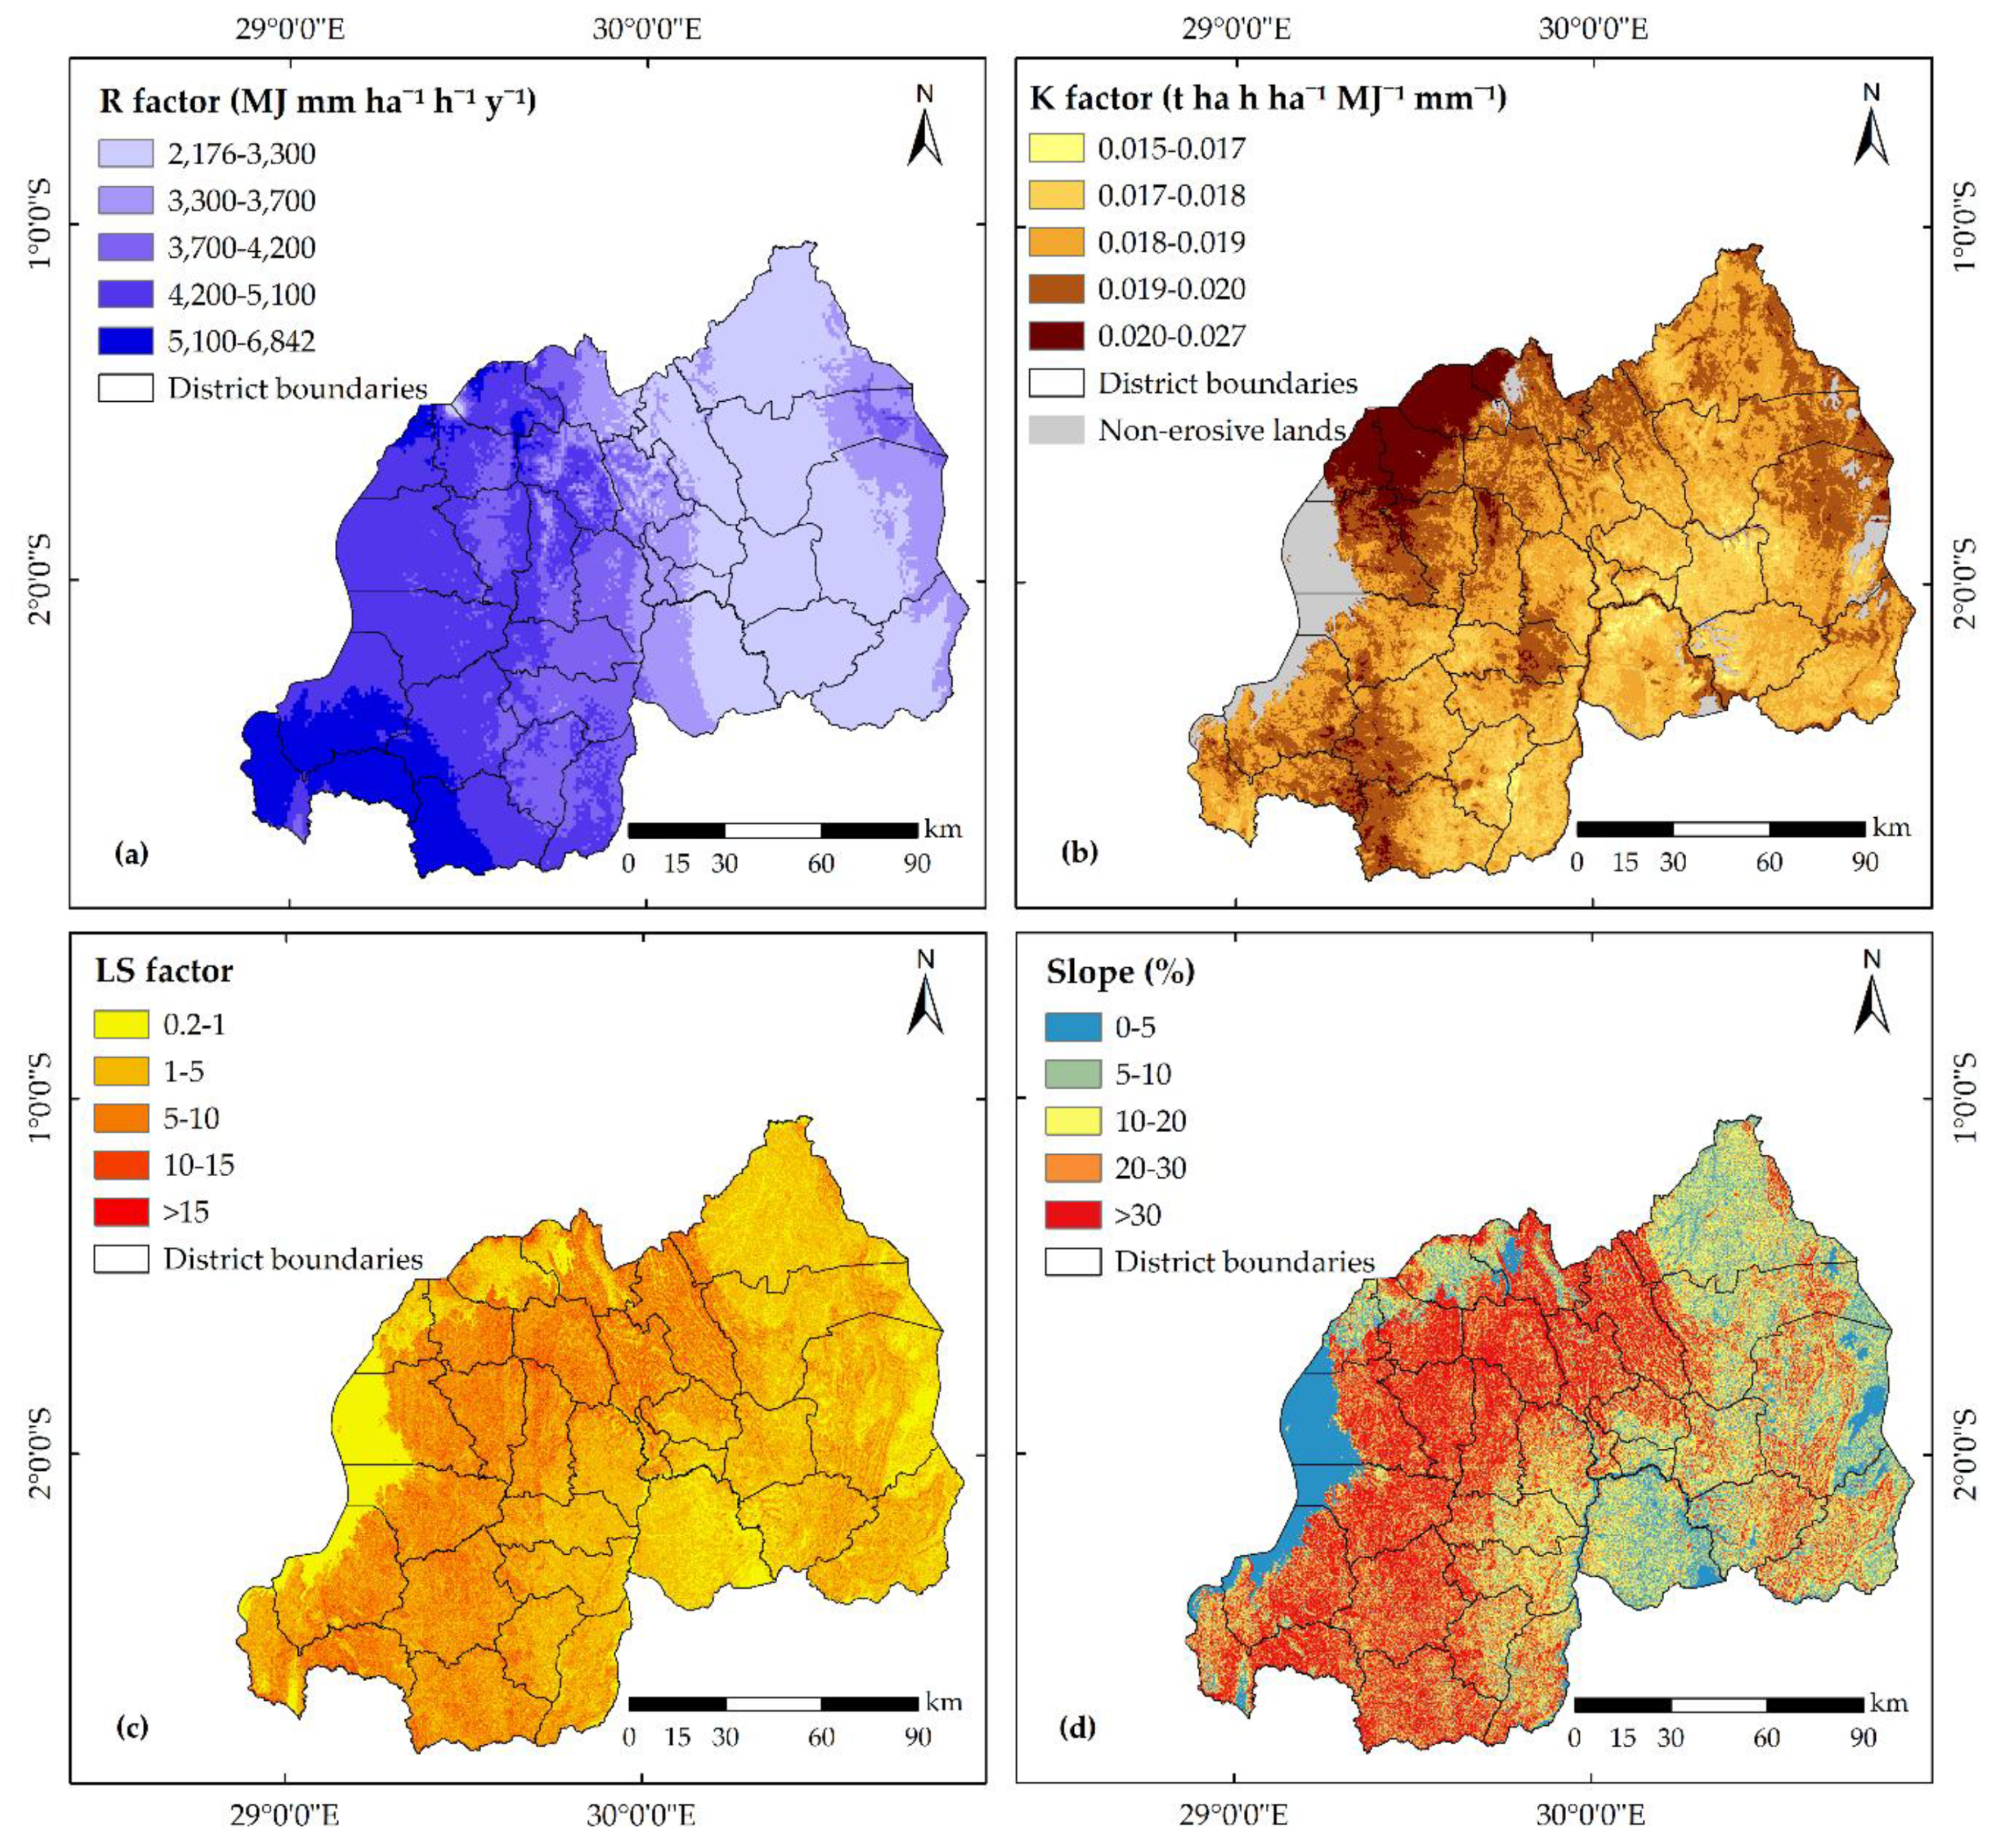
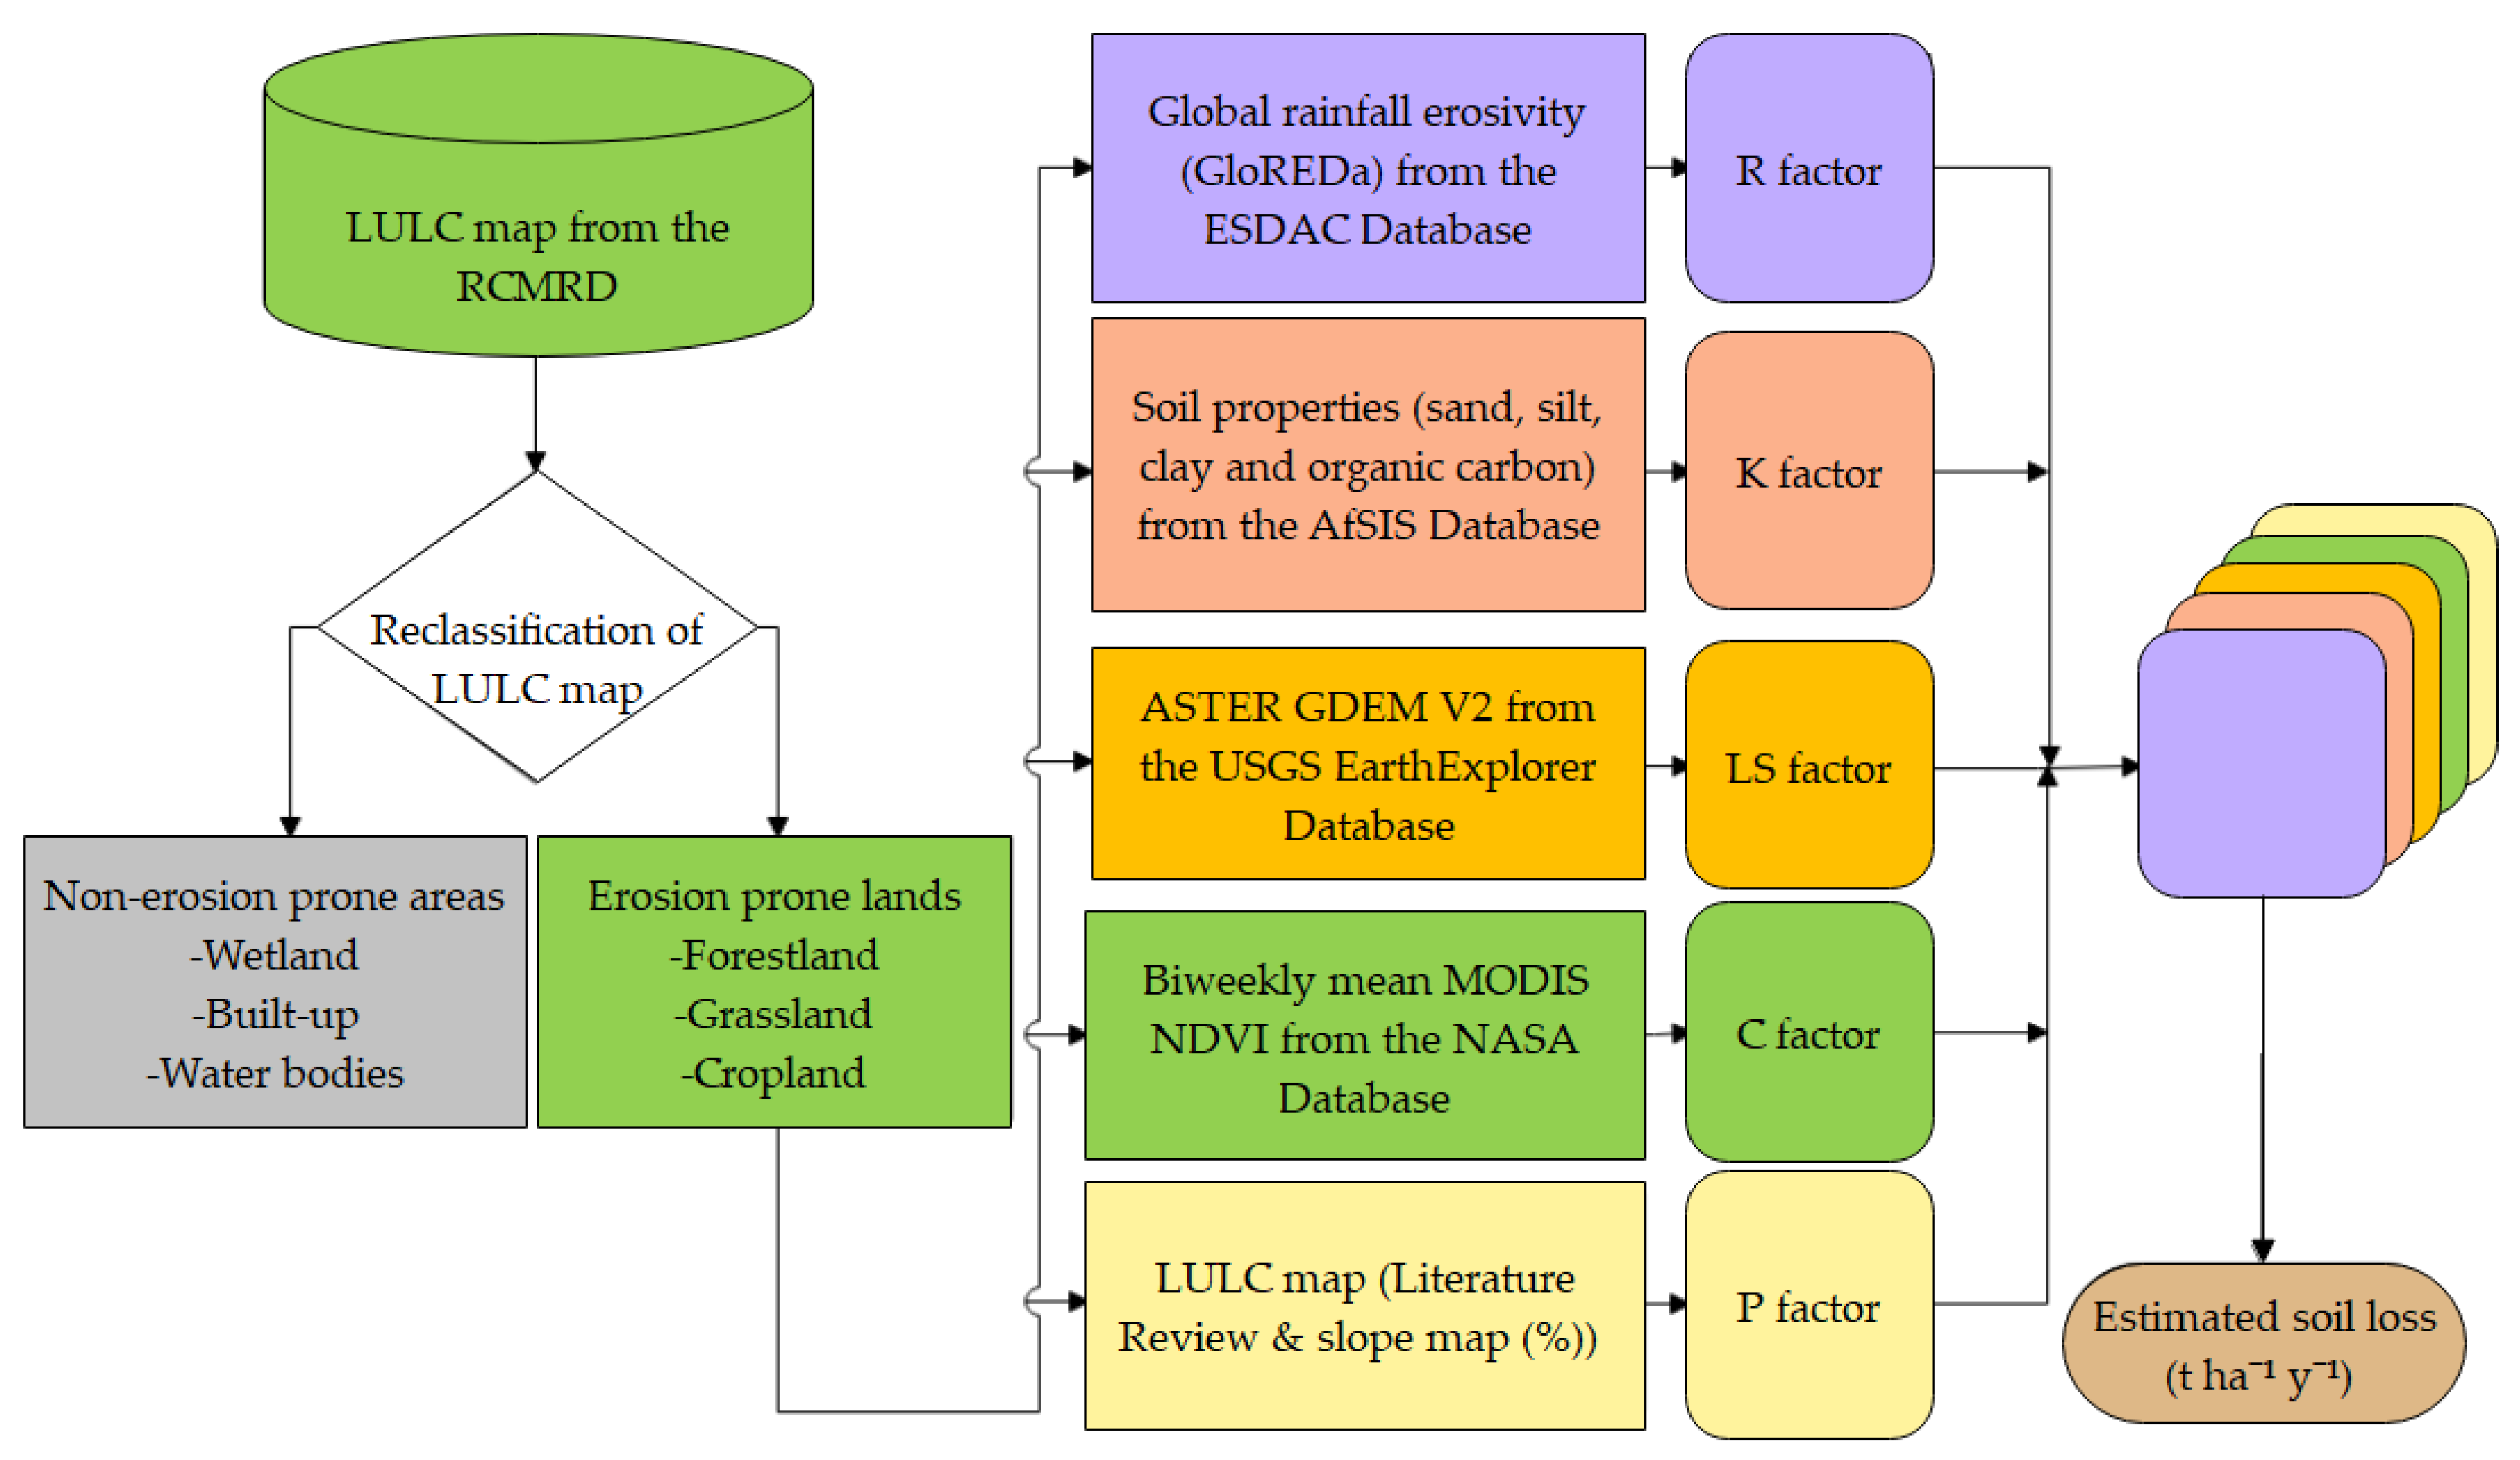
The R factor represents the ability of rainfall to cause soil erosion [66]. In RUSLE, the rainfall erosivity is usually calculated as an average of the long-term mean individual storm erosivity index (EI) values measured over 20 years to accommodate apparent cyclical rainfall patterns [67,68]. Since the study area did not have this data, the R factor map (Figure 3a) was derived from the global rainfall erosivity dataset provided by the ESDAC [66].
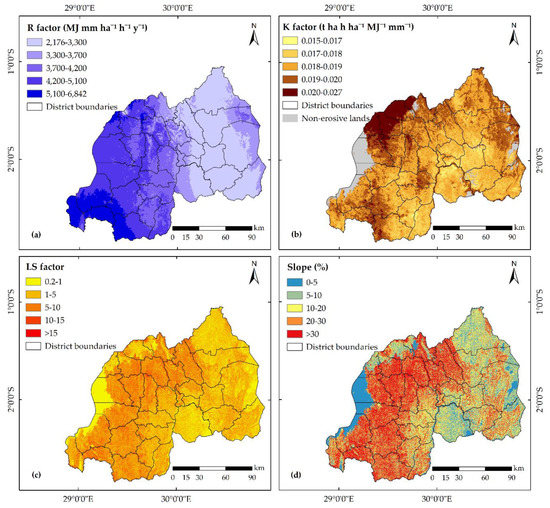
Figure 3.
Maps of the RUSLE (Revised Universal Soil Loss Equation model) factors for Rwanda: (a) rainfall erosivity; (b) soil erodibility; (c) slope length and steepness; and (d) slope (%).
2.3.2. Soil Erodibility (K) Factor
The K factor reflects the susceptibility of soil to erosion [34]. The RUSLE estimates soil erodibility factor using soil properties which are closely correlated with soil erodibility [34,69]. Soil properties (fraction of sand, silt, clay and organic carbon) acquired from the AfSIS database [63] at 250 m resolution were employed in this study to determine the K factor for Rwanda (Figure 3b), applying the algorithm (Equation (A1) in Appendix A) developed in the Erosion Productivity Impact Calculator (EPIC) model [70].
2.3.3. Slope Length and Steepness (LS) Factor
The LS factor is a product of slope length (L factor) and slope steepness (S factor). The LS factor (Figure 3c) was estimated using the ASTER GDEM V2 (30 m resolution) provided by the USGS [62]. From here, the L factor was computed following Equation (2) proposed by Desmet and Govers [71]. The algorithm (Equation (3)) recommended by McCool et al. [72] was used to calculate the S factor [28,73,74]. Finally, the L and S factor were multiplied to derive the LS factor for Rwanda (Figure 3c).
where L and S indicates slope length and steepness factor (dimensionless); is the slope length (in meters); m = variable exponent according to β; while β represents the rill to interrill erosion ratio; and θ is the slope angle (in degrees) [34,73].
2.3.4. Cover Management (C) Factor
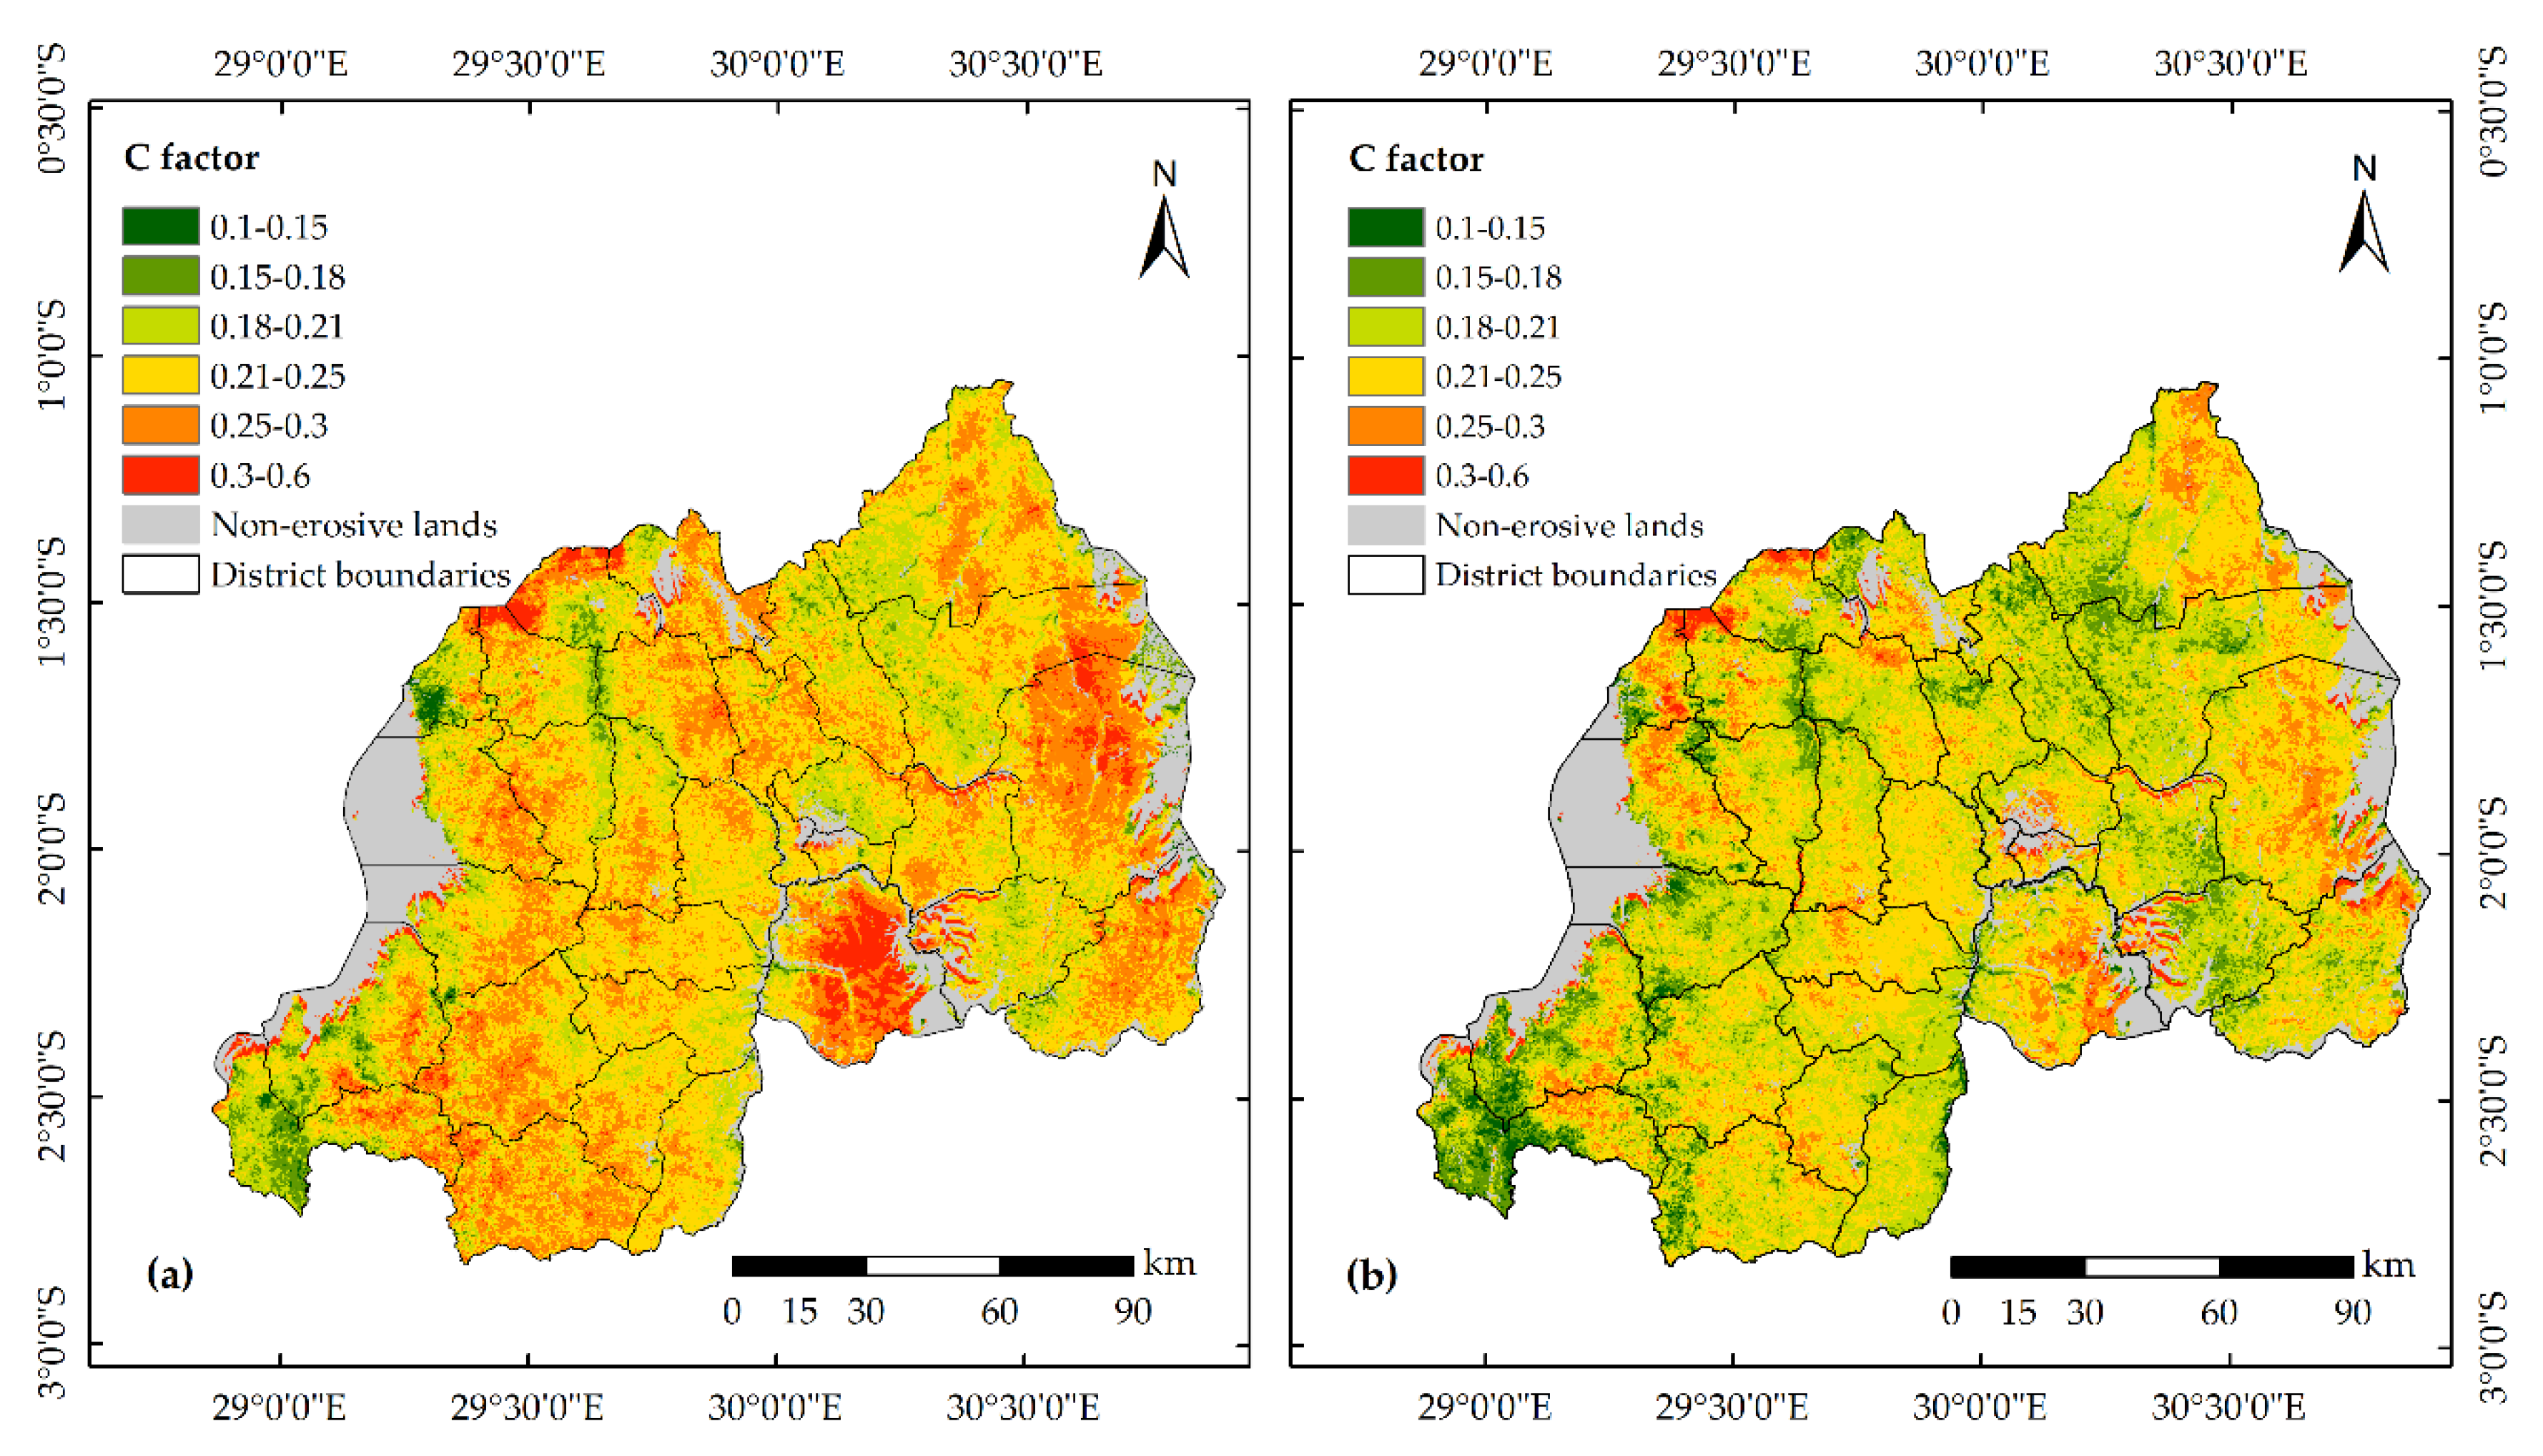
The C factor reflects the impact of management practices on soil erosion magnitude [33]. An approach (Equation (4)) proposed by Durigon et al. [75], and recommended for use in tropical regions [76], was adopted in the present study. The biweekly mean MODIS NDVI (250 m resolution) for the rainy seasons in Rwanda (March-May and September–December) for 2000 and 2015 provided by the NASA [64] were employed to estimate the C-factors (Figure 4) of the study area.
where; Cr stands for cover management factor and NDVI is the Normalized Difference Vegetation Index.
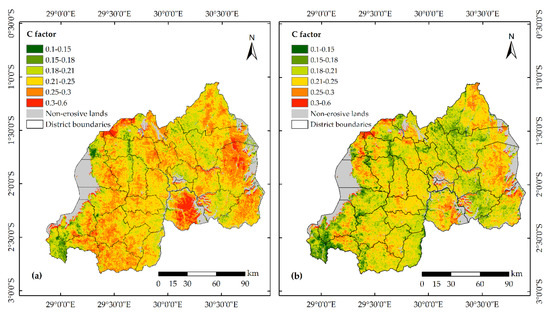
Figure 4.
The RUSLE cover management factor for Rwanda: (a) 2000 and (b) 2015.
2.3.5. Support Practice (P) Factor
The P factor accounts for the impact of anti-erosion techniques, such as contour farming, strip cropping, terracing and subsurface drainage on reduction of soil loss through their influences on drainage pattern, runoff concentration, runoff velocity and hydraulic forces exerted on the soil surface [77]. The P factor can be estimated for agricultural land of different slope classes, but non-arable lands are aggregated together [33]. Within the study area, there exists a broad series of both mechanical, biological and agronomic measures for erosion control include terracing, infiltration ditches, contour bunds, trenches, hedgerows, intercropping, mulching and agroforestry techniques [23,24]. Since it is not feasible to quantify the impact of different support practices applied on a large scale [78], this research adopted the P factor values (Table 2) suggested by Wischmeier and Smith [33] which considers only two types of land uses—agricultural and other—and land slopes [79,80]. Accordingly, the LULC map for 2000 and 2015 (Figure 5) was reclassified as agricultural (cropland) and other lands (forestland and grassland) (Table 2). Using ArcGIS 10.5 software, cropland and forestland and grassland were overlapped with the slope classes (%) and assigned the corresponding P factor values.

Table 2.
The P factor values for land use types with their respective slope classes (%) (Figure 3d).
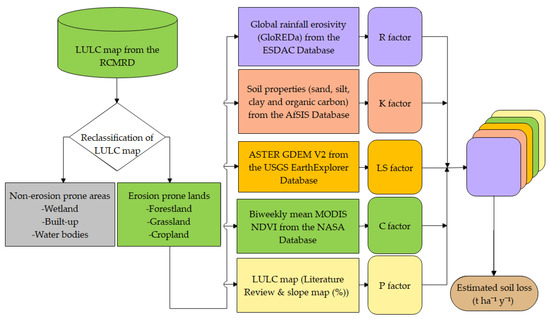
Figure 5.
Flowchart employed for modeling soil loss caused by rill and interrill erosion in Rwanda.
For the purpose of understanding how changing conservation practices could either mitigate or exacerbate soil erosion in Rwanda, this research further adopted the P factors (Table 3) of the three most commonly known conservation measures for Rwanda’s cropland in 2015 (13,582.7 km2).

Table 3.
The P factor values for conservation support practices with their respective slope (1).
2.4. Estimated Soil Loss and Social Drivers
Using survey data for 2016/2017 provided by the National Institute of Statistics of Rwanda [82], this research attempted to correlate the districts’ mean soil losses in 2015 (Table A2) with percent rate of poverty, extreme poverty and households (HHs) incurring expenditure on chemical fertilizers (HHs using chemical fertilizers) per district.
3. Results
3.1. Estimated Soil Erosion Rates in Rwanda
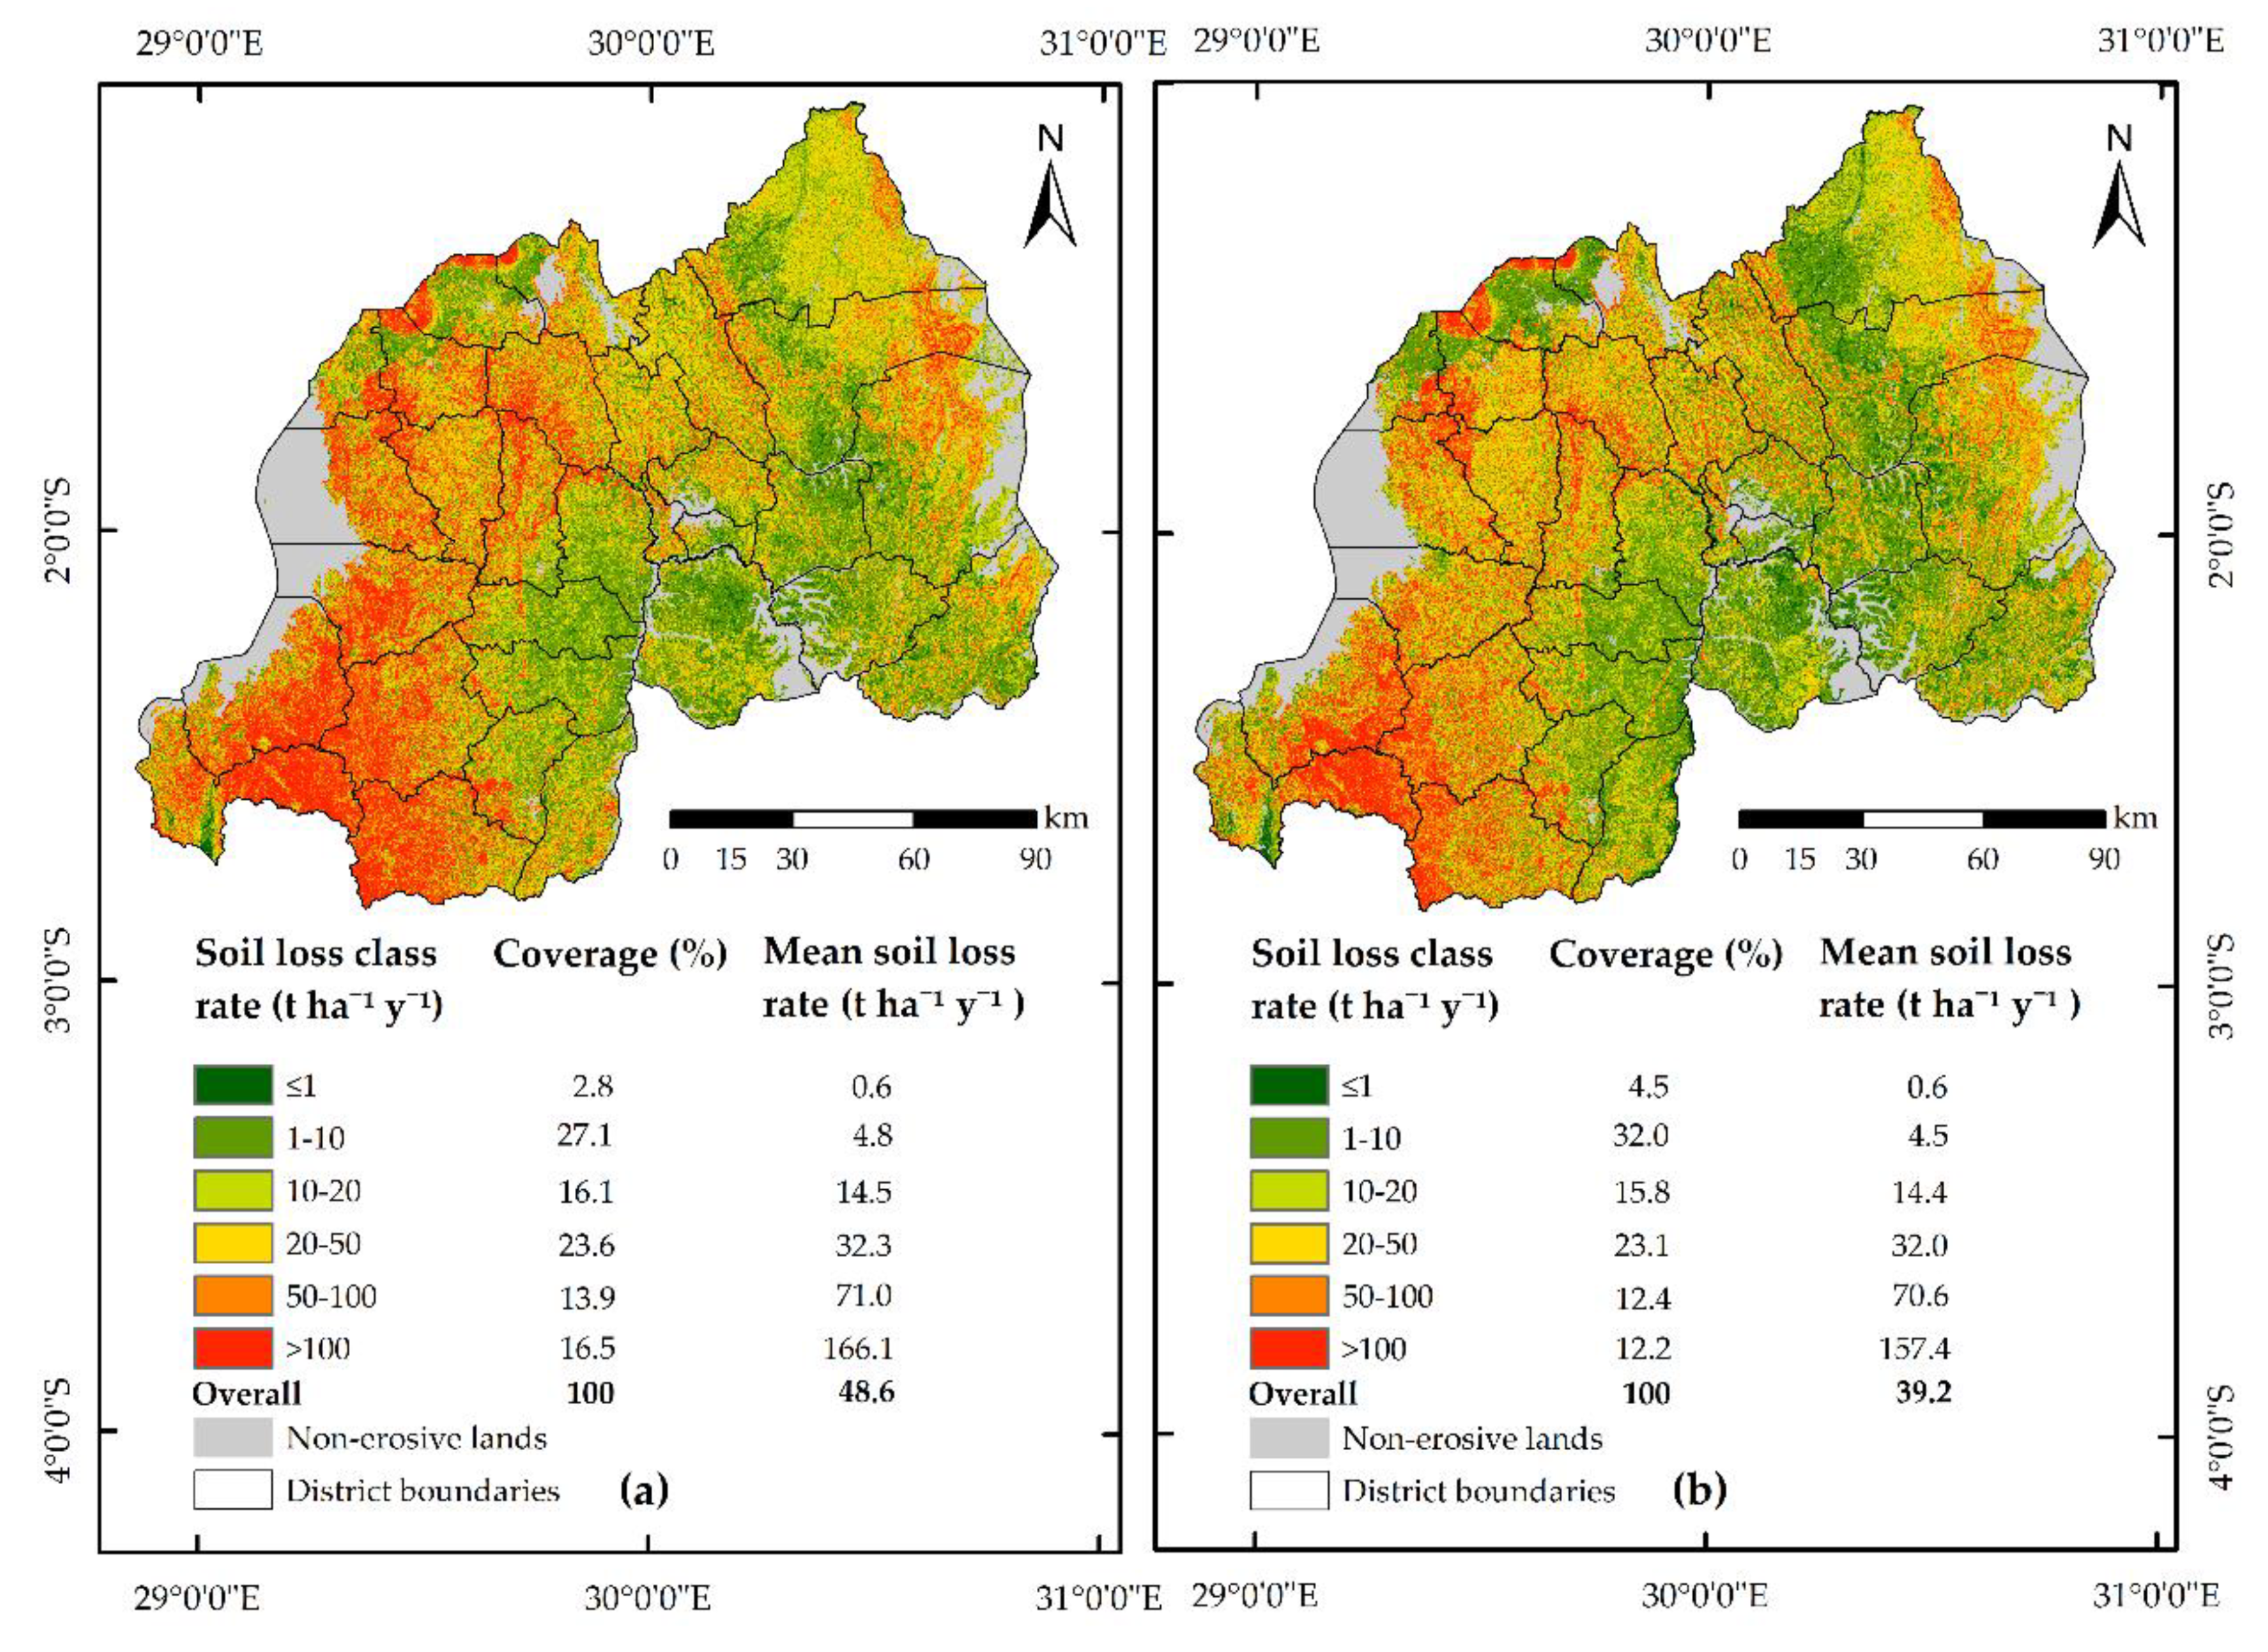
The resultant soil loss rates (Figure 6) were derived at a 30 m cell size as the most suitable grid resolution, falling between the resolutions of the input datasets used to achieve the RUSLE factors (Figure 3,4). The erosion maps were classified into six categories in order to facilitate the analysis. This study considered 2000 as the base year, being when the biweekly mean MODIS NDVI data employed to estimate the C factor was first available. Moreover, aligning within the Millennium Development Goals (MDGs) 2000–2015, this is the period during which different national policies and programs were put in place. These were intended to ensure environmental sustainability through establishing a number of erosion control measures. The findings of this research (Figure 6) indicate that a mean soil loss in Rwanda was estimated to be 48.6 t ha−1 y−1 in 2000 and 39.2 t ha−1 y−1 in 2015, resulting in total national losses of about 110 and 89 million t of soil, respectively.
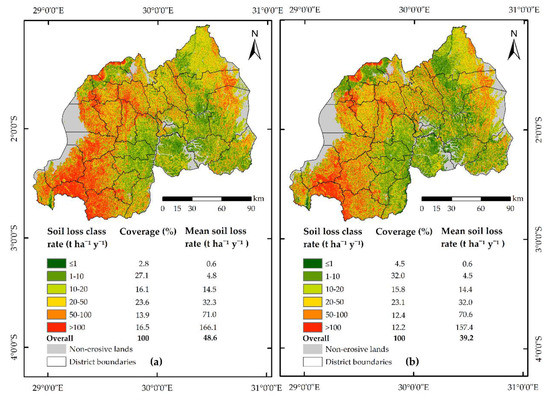
Figure 6.
Distribution of the estimated soil loss rates for Rwanda: (a) 2000 and (b) 2015.
In this study, an estimated soil loss rate ≤1 t ha−1 y−1 is considered as a tolerable soil erosion rate, whereas an area which experienced soil erosion rates >10 t ha−1 y−1 represents highly erosion-susceptible areas that urgently need the intervention of erosion control practices. Analyses indicated that an area of about 638.1 km2 (2.8%) in 2000 and 1025.5 km2 (4.5%) in 2015 had a sustainable soil erosion rate (≤1 t ha−1 y−1), but 15,975.6 km2 (70.1%) in 2000 and 14,471.4 km2 (63.5%) in 2015 experienced unsustainable soil losses (>10 t ha−1 y−1). Although the decline in national annual mean soil loss by nearly 24% (48.6 t ha−1 y−1 to 39.2 t ha−1 y−1) was not statistically significant, the estimates showed soil losses within the Rwanda’s AEZs (Table A1) revealed a significant decreasing trend. As a result, a decline was reported to be 63.8% (48.5 t ha−1 y−1 to 29.6 t ha−1 y−1) for Imbo; 44.1% (86.2 t ha−1 y−1 to 59.8 t ha−1 y−1) for Impala; 42.2% (74.4 t ha−1 y−1 to 52.3 t ha−1 y−1) for Kivu Lake Borders; 35.0% (15.8 t ha−1 y−1 to 11.7 t ha−1 y−1) for Mayaga and Bugesera; and 31.0% (107.5 t ha−1 y−1 to 82.1 t ha−1 y−1) for the Congo-Nile Watershed Divide. However, soil erosion was predicted to persist in the Eastern Plateau, Eastern Savanna, Central Plateau and Granitic Ridge and possibly increase in the Buberuka Highlands. The five districts with the highest mean soil loss in 2015 were Rusizi (89.3 t ha−1 y−1), Nyamasheke (82.5 t ha−1 y−1), Nyaruguru (72.8 t ha−1 y−1), Nyamagabe (69.3 t ha−1 y−1) and Rutsiro (60.1 t ha−1 y−1) (Table A2).
3.2. Land Use/Land Cover Change and Soil Erosion in Rwanda
Comparing the soil loss estimates (Table 4) between changes in LULC types (Figure 7), the findings suggest a decrease in mean soil loss from forestland to grassland and cropland in both years. A significant decline by 39% in soil loss rate from cropland contrasted with an increase in soil loss rate of approximately 14% from forestland and 4.8% from grassland. In 2000, the estimated mean rate of soil loss from forestland (93.9 t ha−1 y−1) was almost five times higher than the average loss from cropland (20.3 t ha−1 y−1). The increase in soil erosion rate from forestland (109.2 t ha−1 y−1) was around seven times higher than the mean from cropland (14.6 t ha−1 y−1) in 2015. Although forestland decreased from 7475.0 km2 (32.8%) in 2000 to 4352.8 km2 (19.1%) in 2015, it was found in the areas with steeper topography (with a mean slope of 29.2% in 2000 and 35.2% in 2015) than other examined LULC categories.

Table 4.
Estimated mean soil loss (t ha−1 y−1) per LULCC (Land use/land cover change) category (2000–2015) for forestland, grassland and cropland.
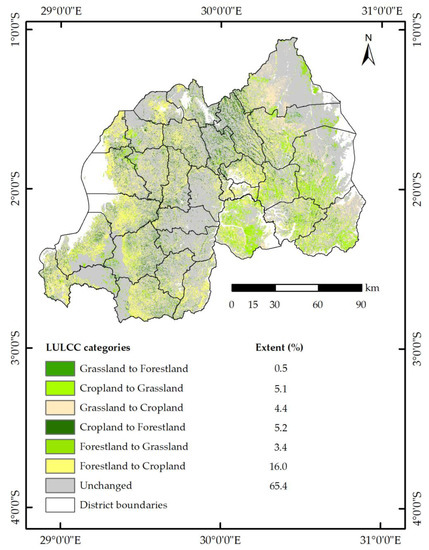
Figure 7.
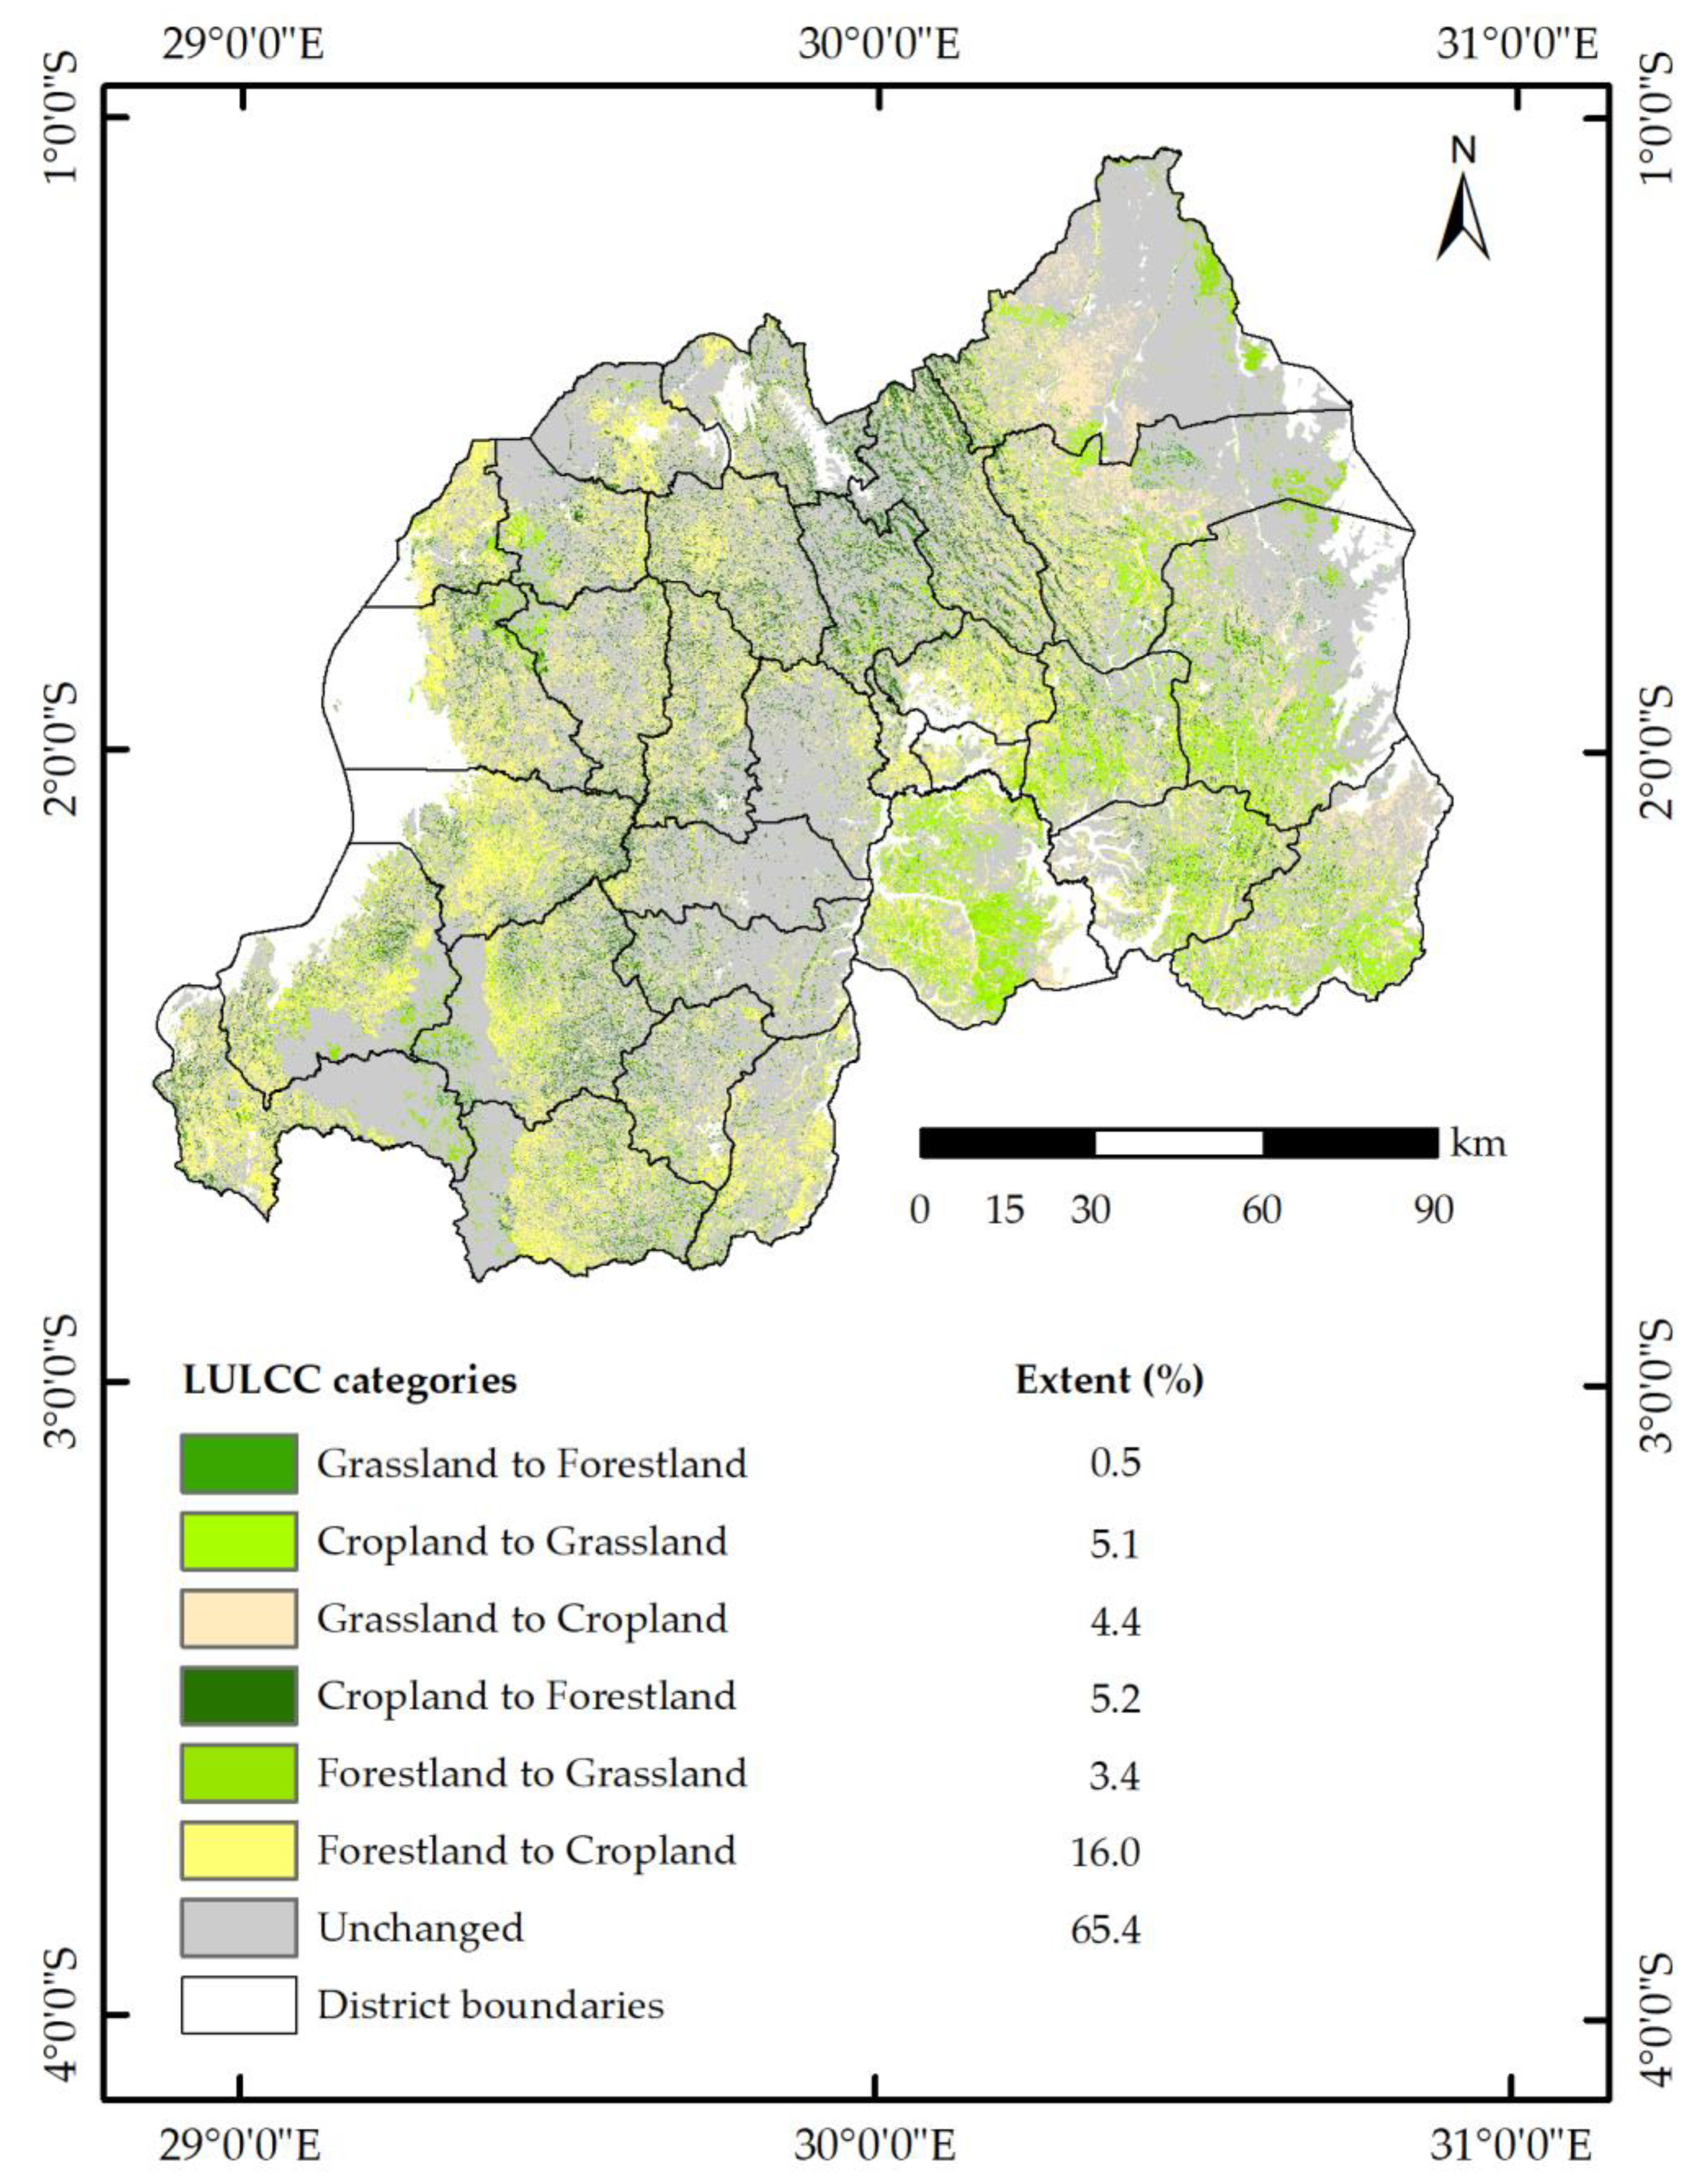
Change in LULC categories for erosion-prone lands (2000–2015).
From 2000 to 2015, LULCC occurred in the area of about 7885.2 km2 (34.6%), while 14,904.5 km2 (65.4%) remained unchanged. Figure 7 shows that more than half the total area experiencing conversions in LULC types occurred in the forestland (19.4%), of which most converted to cropland (16.0%), with the remaining 3.4% being replaced by grassland. In contrast, the least LULCC was estimated for grassland being substituted by forestland (0.5%). LULCC contributed to increased soil losses in the order of grassland to cropland (10.0 t ha−1 y−1), forestland to cropland (20.6 t ha−1 y−1), cropland to grassland (43.6 t ha−1 y−1), forestland to grassland (67.3 t ha−1 y−1), cropland to forestland (88.9 t ha−1 y−1) and grassland to forestland (91.6 t ha−1 y−1) (Table 4). Following a similar order, this study further estimated a mean slope of 17.0%, 25.8%, 20.6%, 25.0%, 35.2% and 32.3% from the previously stated LULCC categories.
The distribution of LULCC in relation to soil erosion at a district level (Table A3) indicates the highest soil loss estimates in Rulindo (72.2 t ha−1 y−1) and Nyabihu (68.1 t ha−1 y−1), located in highland areas with a mean slope of 38.7% and 36.5%, respectively. Conversely, Bugesera and Kayonza, situated in low topographic landscape in eastern Rwanda (with a mean slope of 11.2% for Bugesera and 18.0% for Kayonza), experienced the greatest LULCC, but had a mean soil loss of 15.0 t ha−1 y−1 and 27.3 t ha−1 y−1, respectively. Of the two districts undergoing the least LULCC (0.2%), Kicukiro with a mean slope of 15.0% experienced a mean soil loss of 14.1 t ha−1 y−1, while Nyarugenge (with a mean slope of 26.4%) had an average soil loss of 28.3 t ha−1 y−1.
3.3. Driving Forces of Soil Erosion in Rwanda
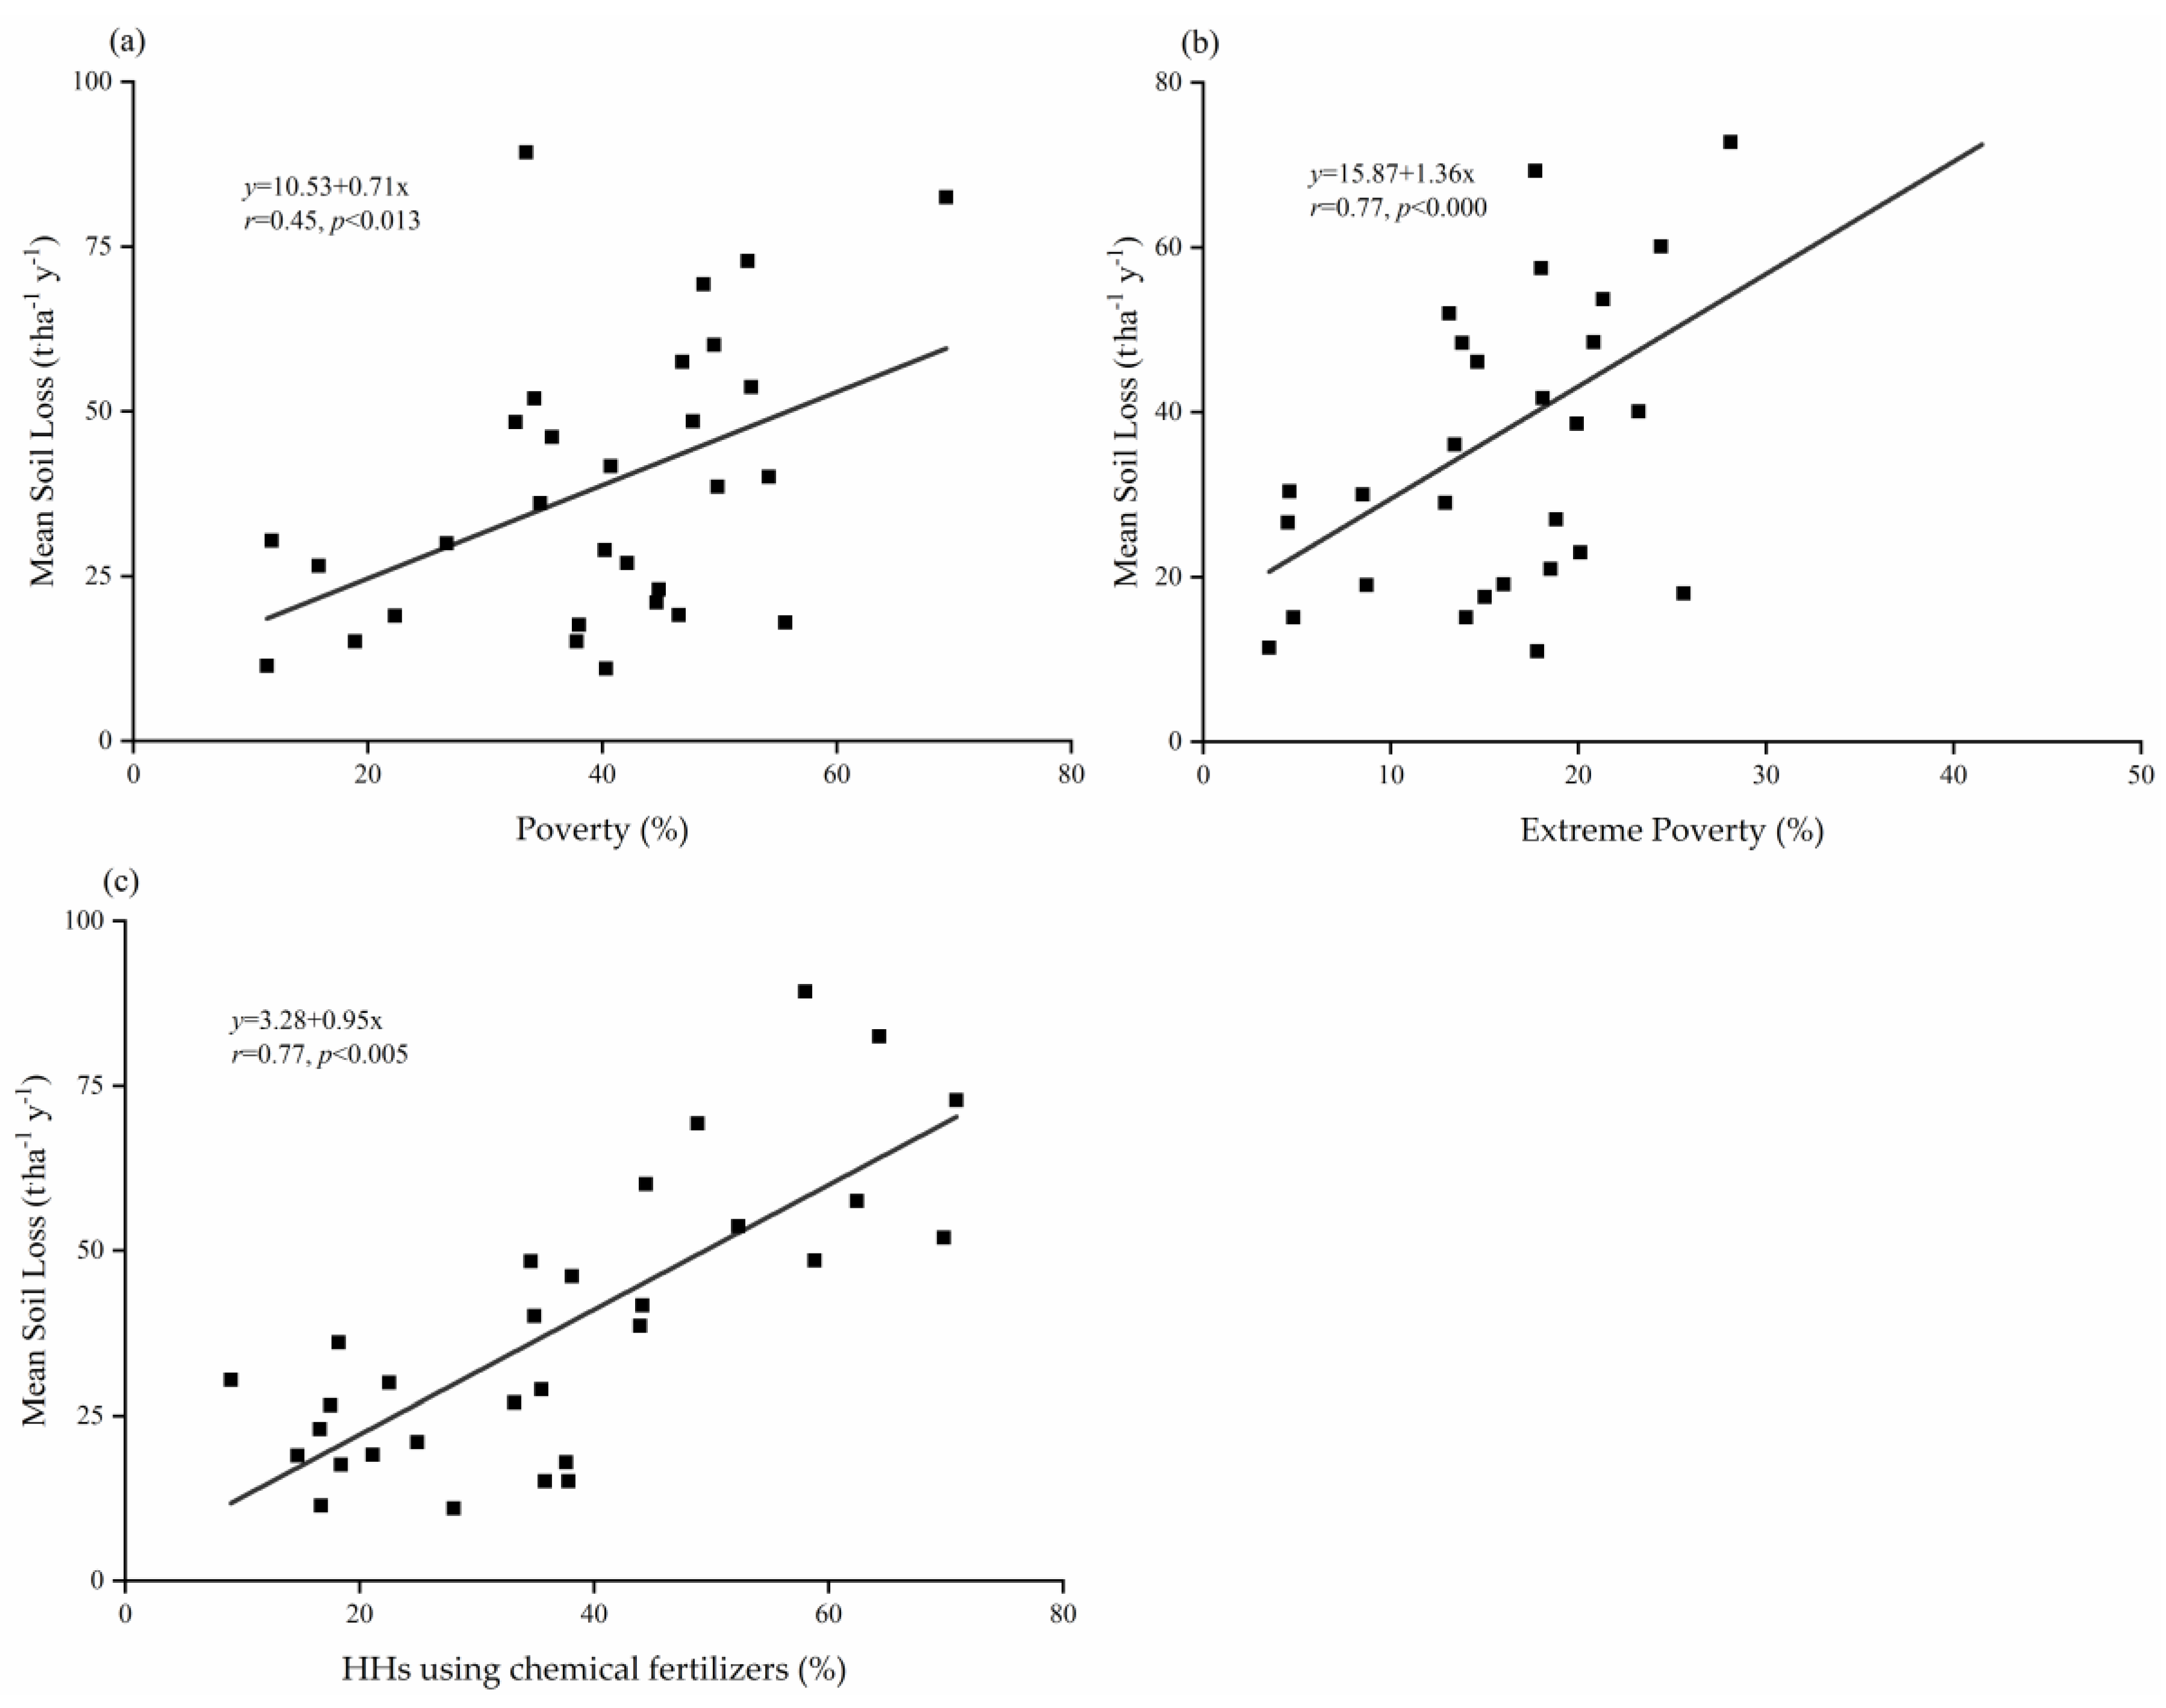
Despite the influence of biophysical factors on the rate and extent of soil erosion in Rwanda, this study showed that socio-economic causes are one of the major driving forces of accelerated soil erosion. Using SPSS 16.0 for Windows, Pearson’s correlation suggested that the mean soil loss in 2015, per district (Table A2), was significantly correlated with poverty (r = 0.45, p = 0.013) (Figure 8a) and HHs using chemical fertilizers (r = 0.77, p = 0.005) (Figure 8c), and especially related to extreme poverty (r = 0.77, p = 0.000) (Figure 8b).
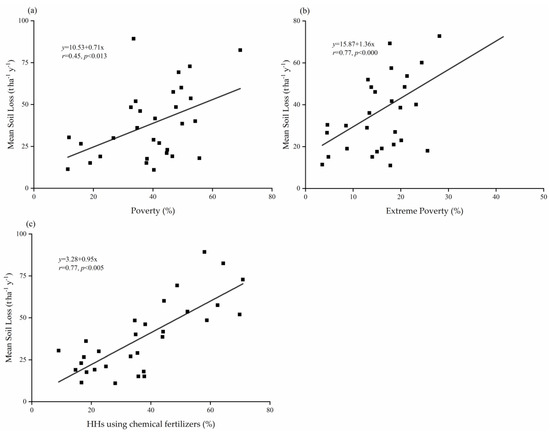
Figure 8.
Relationships between estimated mean soil loss rates in Rwanda’s districts (n = 30) and (a) poverty; (b) extreme poverty; and (c) HHs using chemical fertilizers.
4. Discussion
4.1. Perspective of Soil Erosion by Water in Rwanda
The mean estimates of 39.2 t ha−1 y−1 of soil eroded in 2015 (Figure 6b) and 41.4 t ha−1 y−1 from Buberuka highlands AEZ (Table A1) are in accordance with the work of Kagabo et al. [29], Kabirigi et al. [36] and Karamage et al. [37], but far less from the results reported by Karamage et al. [9,26] (Table 5). In addition, our findings are relatively comparable with a recent study conducted over the entire East Africa region with a mean soil loss of 34.2 t ha−1 y−1 for Rwanda [83], and in line with mean soil erosion rates ranging between 35 t ha−1 y−1 and 75 t ha−1 y−1 predicted in Sub-Saharan Africa [84]. Comparing the results of Karamage et al. [9,26] (Table 4) with the findings of this study and other studies carried out in Rwanda and in the region, suggests that their results may be overestimates, an issue previously highlighted by Kabirigi et al. [36].

Table 5.
Previous erosion rate estimates reported in the study area.
In both years, the highest soil loss estimates from evaluated LULC types (Table 4) are in the order of forestland > grassland > cropland and are in agreement with the work of Nyesheja et al. [28] in the Congo Nile Ridge region of Rwanda, whose findings show a similar trend of forestland (104.93 t ha−1 y−1) > grassland (64.55 t ha−1 y−1) > cropland (19.1 t ha−1 y−1). Previous studies highlighted that soil erosion could surge from less than 1 t ha−1 y−1 in undisturbed forests to over 100 t ha−1 y−1 in disturbed forests [54,61,86]. In this study, the main reason for excessive soil loss observed in the forestland was primarily attributed by its exposure on steep slopes, consistent with results from the Lebir catchment in Malaysia, where the highest erosion rate (87.63 t ha−1 y−1) occurred in the high conservation value forests due to steep topography [87]. Despite unwise land use practices, human and policy interventions can also lead to positive and desirable changes in land use (e.g., rehabilitation or conservation practices). Table 4 shows a significant decrease in mean soil loss from cropland by 39% (20.3 t ha−1 y−1 in 2000 to 14.6 t ha−1 y−1 in 2015), due to erosion control practices formally practiced across Rwanda, which is confirmed by the national statistics showing that 78.1% of agricultural land is protected from erosion [88].
Over the 15 years, the greatest LULCC occurred in the area changing from forestland to cropland (16.0%), while the least change in LULC (0.5%) was observed for grassland converting to forestland (Figure 7). The changes in LULC were associated with mean soil loss which increased in the order of grassland to cropland (10.0 t ha−1 y−1) > forestland to cropland (20.6 t ha−1 y−1) > cropland to grassland (43.6 t ha−1 y−1) > forestland to grassland (67.3 t ha−1 y−1) > cropland to forestland (88.9 t ha−1 y−1) > grassland to forestland (91.6 t ha−1 y−1). The extremely high soil erosion rate estimated in the areas where cropland and grassland were converted to forestland was almost nine times higher than the major soil erosion threshold (>10 t ha−1 y−1), mainly due to their location in the highland areas with mean slope exceeding 30%.
The results of LULCC distributions and corresponding mean soil losses (Table A3) suggest that all the 30 districts of Rwanda experienced changes in LULC, of which the five topmost districts (Bugesera, Kayonza, Gatsibo, Kirehe and Nyagatare) were found in the low topographic landscape of eastern Rwanda. In districts with steep slopes (Rulindo, Nyabihu, Nyamagabe, Burera and Gakenke), average soil erosion rates ranged from 6 to 7 times higher than the major soil erosion threshold (10 t ha−1 y−1) (Table A3). LULCC on steep slopes are likely to increase the risk of soil erosion, with mean soil loss per district in 2015 (Table A2) being significantly related to poverty (Figure 8a), extreme poverty (Figure 8b) and increasing use of chemical fertilizers explaining the ongoing over-cultivation practice (Figure 8c).
Borrelli et al. [2] pointed out that the poorest tropical countries are the most susceptible to high levels of soil erosion, but investing in conservation measures may be constrained by the socio-economic capacity of the local community. For example, it has been reported that over-cultivation on small farmlands with steep slopes, insufficient soil conservation (SC) techniques, limited financial capacity and inadequate practical training to maintain the existing SC techniques constitute the main causes of erosion persistence in Gatebe sector located in northern Rwanda [20]. In both the north and the south, farmers’ inability to invest in maintenance of existing terraces may explain their reluctance to adopt new terraces [21]. Poverty may also result in destructive environmental practices. In Rwanda, high poverty levels, high population densities and land fragmentation contribute to deforestation and forest disturbance [89].
The Congo-Nile Watershed Divide zone recorded the highest mean soil loss in both 2000 and 2015 but registered the largest decline in mean soil loss. Only the Buberuka Highlands had increased soil erosion (Table A1). At a district level, Kicukiro and Gisagara indicated a significant decline of more than 60% of mean soil loss from 2000 to 2015, while both Rulindo and Gicumbi are the only two districts experiencing an increase in soil erosion (Table A2).
Inorganic fertilizers are most commonly recognized as enhancing high crop yields in the short-term but not being effective in the long-run since their excessive use causes serious environmental degradation [90]. Previous study on the impact of fertilizer use in Rwanda (Rweru-Mugesera wetland complex) reported that although some farmers indicated they still use organic fertilizers, many more abandoned use of organic manure when they adopted mineral fertilizers [91], explaining how the growing interest in using chemical fertilizers has dramatically led to underuse of organic fertilizers in some parts of the country. Researchers further noticed that the mineral fertilizers’ use, application mode and rates were the same across different terrain [91]. As they are readily available, less expensive and sustain soil fertility status, organic fertilizers could be both effective and efficient in enhancing agricultural productivity while improving soil quality. Therefore, adoption of organic materials such as manure, encouraged by the government’s programme of One Cow per Poor Family which contributes to manure production, could be supplemented by proper use of mineral fertilizers and would potentially support long-term agricultural productivity while ensuring environmental sustainability.
Increasing use of chemical fertilizers in Rwanda is considered an indicator of on-going over-cultivation and is closely related to soil erosion; however, more studies are needed to explicitly examine the inter-relationship between inorganic fertilizer use and over-cultivation, and their effects on water erosion.
4.2. Impact Assessment of Soil Conservation Practices
The loss of soil may have a negative impact on both quantity and quality of soil ecosystem services [92], and this may affect the livelihoods of society. For Rwanda, the estimates of 945,200 t of organic materials, 41,210 t of nitrogen, 200 t of phosphorus and 3055 t of potash are predicted to erode annually, due to water erosion [27]. Consequently, this depletes the topsoil nutrients that ultimately leads to decline in crop productivity, with substantial implication for food security. Rwanda, as a developing country in which the national economy is largely based on rain-fed agricultural production of small, semi-subsistence and increasingly fragmented farms [51], has to take serious measures to conserve soil from erosion.
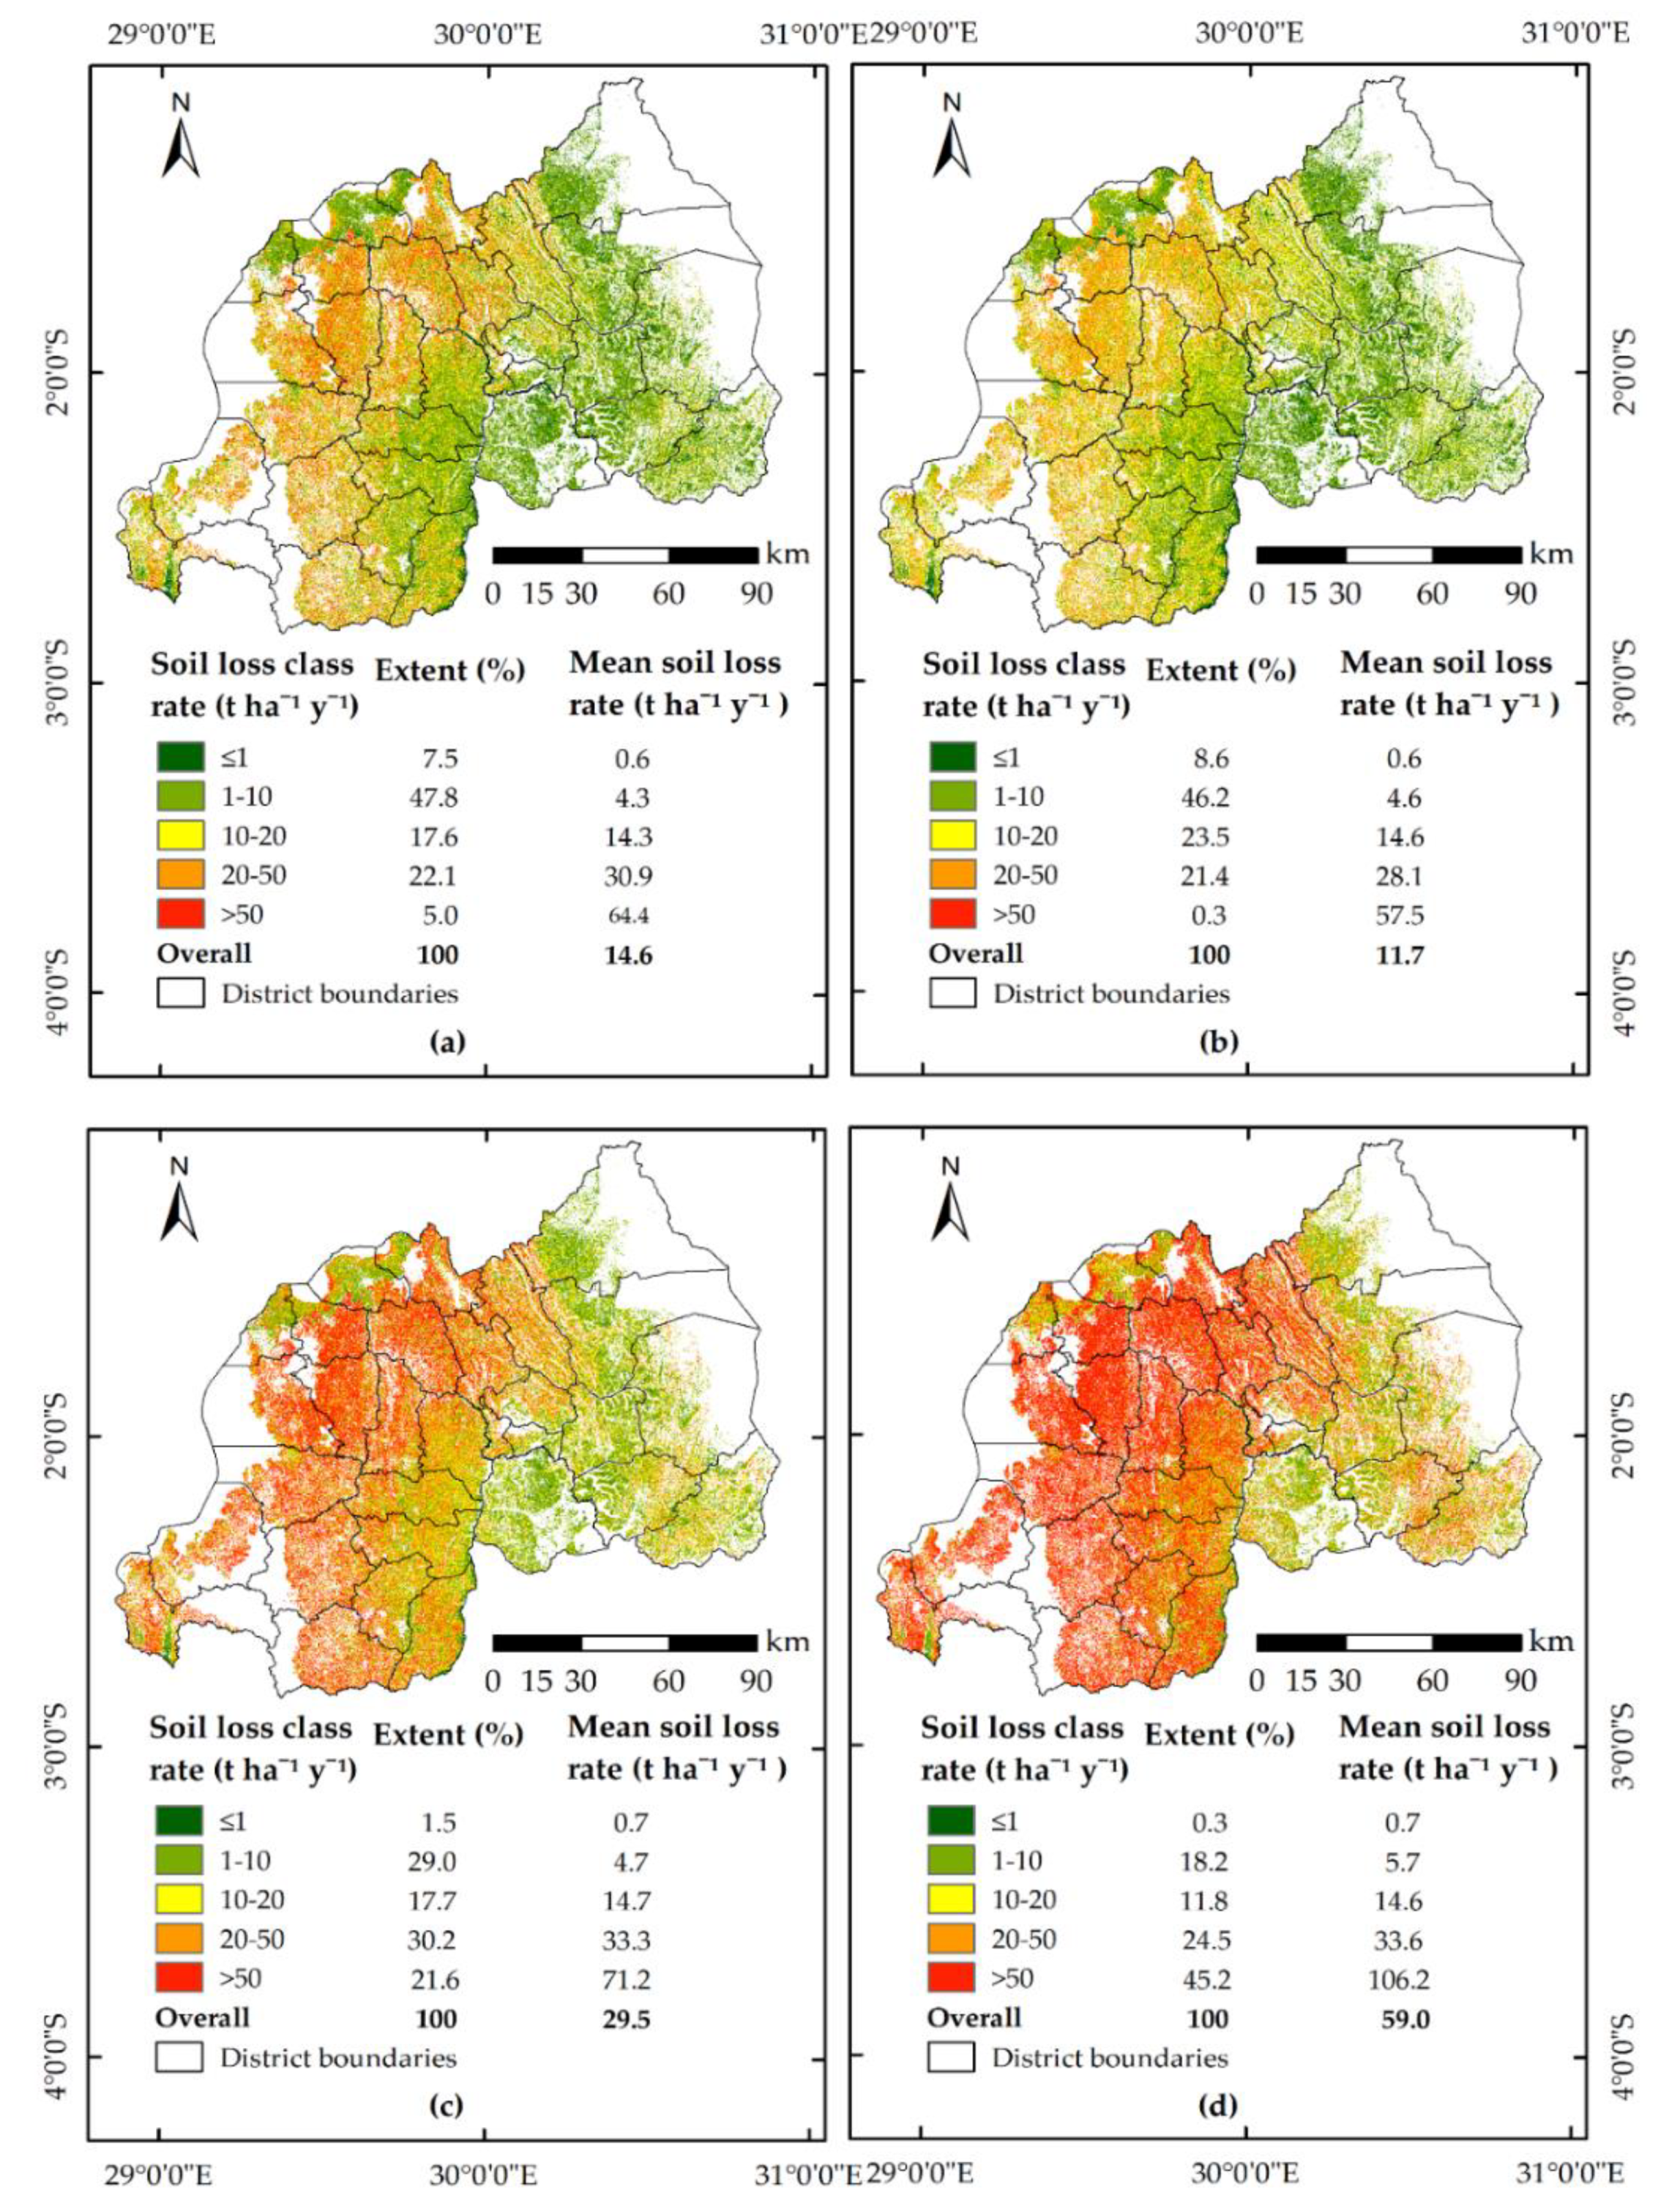
To minimize soil loss to a tolerable erosion threshold while alleviating its associated effects, soil conservation practices [11] have the potential to restore degraded soils, as well as improving water quality [3]. Practices such as terracing, contouring, and strip-cropping are the most commonly known conservation techniques established to mitigate water erosion [3,54]. Figure 9a shows that an area of 1018.7 km2 of total cropland (13,582.7 km2) in 2015 had a sustainable soil erosion rate (≤1 t ha−1 y−1), while 6071.5 km2 (44.7%) suffered from damaging soil erosion rates (>10 t ha−1 y−1). After incorporating the expected support practices (Table 3), the study predicted a reduction in mean soil loss rate of 24.8% (from 14.6 t ha−1 y−1 to 11.7 t ha−1 y−1) under terracing intervention. However, about 6139.4 km2 (45.2%), with mean slopes ranging from 28.5% to 85%, recorded a continuation of high erosion rates >10 t ha−1 y−1. Therefore, terracing could have a great impact on reducing soil erosion in areas with a mean slope <28.5%, but about 45.2% of the total area of cropland in Rwanda would remain under severe erosion. Moreover, analyses demonstrated that strip-cropping and contouring would exacerbate soil loss rate, by approximately two and four times higher than the estimated 2015 mean soil loss, respectively (Figure 9c,d). For this reason, both strip-cropping and contouring are not recommended as erosion control practices in the area of study.
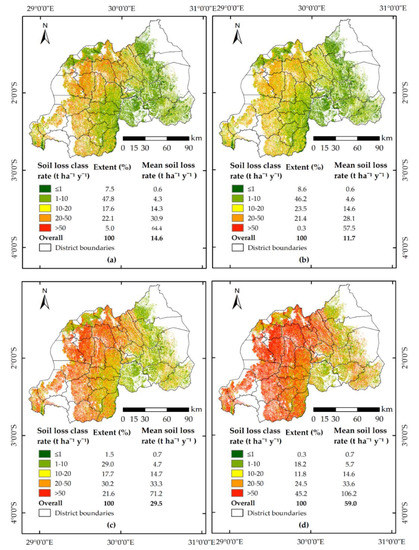
Figure 9.
Predicted soil loss rates for Rwanda’s cropland (13,582.7 km2) under diverse conservation practices: (a) baseline scenario in 2015; (b) terracing; (c) strip-cropping; and (d) contouring.
In soils with steep slopes, residue mulching and cover crops can fail to control runoff flow but are effective at mitigating rill and interrill erosion [11]. Terraces play an important role in intercepting surface runoff water and diverting it across the slope to an outlet [3]; however, unprotected terrace risers can be the source of most of the erosion in terraced systems [93]. Therefore, surface residue mulching (e.g., wheat straw in particular) and crop covers such as the varieties (e.g., beans and peas) that the smallholders can grow and may have economic return [3], integrated with terracing could effectively reduce soil loss caused by rill and interrill erosion. On the other hand, reforestation schemes, targeting the rapid-growing tree species are therefore recommended as an important feature for erosion control in the study area.
Terracing is the most widely used technique in many parts of the world for mitigating soil erosion and stabilizing hillslopes [94]. Researchers noticed that terraces facilitated improvement of soil management in the eastern Ugandan hills [95], and increasing their number (or narrowing the spacing between terraces) was reported to counter soil erosion and improve on-site soil conservation in the Minchtet catchment of Ethiopian Highlands [96]. Regardless of their anticipated benefits, abandonment of terraced landscapes guarantees an increase of erosion and geomorphological risk [97]. Tarolli et al. [94] found that lack of terrace maintenance in Cinque Terre, Chianti Classico and Amalfi coast in Italy increased land degradation problems in the areas. Therefore, construction of terraces should be carefully planned and built according to sustainable design criteria [98].
5. Conclusions
Soil erosion assessment and mapping erosion-prone areas are important tools for policy and decision-making when considering development of conservation practices and allocation of resources, particularly for Rwanda as a developing country. Through integrating RUSLE, GIS and remote sensing techniques, the findings revealed that the country experienced an estimated mean soil loss of 48.6 t ha−1 y−1 in 2000 and 39.2 t ha−1 y−1 in 2015, primarily driven by unsustainable LULCC on steep slopes, poverty, extreme poverty and over-cultivation practice. Over the 15-year period, the highest mean soil loss of 91.6 t ha−1 y−1 was estimated for the smallest area of the total studied lands exposed to LULCC where grassland had been converted to forestland, which occurred on steep topography subjected to human-induced disturbances. The lowest mean rate of soil loss (10.0 t ha−1 y−1) was found in the area with the lowest slope where grassland had been changed to cropland.
This study demonstrated that terracing integrated with surface residue mulching and crop cover could reduce soil loss associated to rill and interrill erosion in Rwanda’s cropland. However, both strip-cropping and contouring are not recommended in the study area since they could increase soil erosion in cropland by approximately two and four times above the mean soil loss in 2015. Adoption of organic materials such as manure, encouraged by the government’s programme of One Cow per Poor Family which contributes to manure production, could be supplemented by proper use of mineral fertilizers, and would potentially support long-term agricultural productivity while ensuring environmental sustainability, especially for developing countries such as Rwanda with scarce land resources. On the other hand, reforestation schemes targeting fast growing multipurpose tree species are therefore recommended as an important feature for erosion control, particularly in the highland areas with mean slope exceeding 30%.
Author Contributions
Conceptualization, J.d.D.N., X.H. and J.Z.; data curation, J.d.D.N.; formal analysis, J.d.D.N. and M.F.J.; funding acquisition, X.H.; methodology, J.d.D.N., X.H. and J.Z.; supervision, X.H. and J.Z.; writing—original draft, J.d.D.N.; writing—review & editing, J.d.D.N., X.H., J.Z., M.F.J., J.L., D.K., R.M. and G.N. All authors have read and agreed to the published version of the manuscript.
Funding
This research was funded by the National Natural Science Foundation of China (Grant nos. 41771320, 41771321, and 41977075).
Acknowledgments
The authors are very grateful to the editor and anonymous reviewers for their pertinent comments and suggestions to improve the quality of this paper. J.d.D.N. would like to acknowledge the study funding provided by the Chinese Academy of Sciences “The Belt and Road Master Fellowship Programme.”
Conflicts of Interest
The authors declare no conflict of interest.
Appendix A
Equation (A1). A method used for estimating K-factor (Figure 3b) proposed by Williams [70].
where SAN denotes the percentage of the sand content (0.05–2.00 mm diameter); SIL stands for the percentage of the silt content (0.002–0.05 mm diameter); CLA represents the percentage of the clay content (<0.002 mm diameter); C stands for the percentage of the organic carbon content; and SN1 = 1 − (SAN/100). The constant value of 0.1317 is used for conversion of K factor from the American unit system to International/metric unit system [34,54].

Table A1.
Estimated mean soil loss per Rwanda’s AEZ of erosion-prone lands between 2000 and 2015 (“extent” refers to % total area of erosion-prone lands).
Table A1.
Estimated mean soil loss per Rwanda’s AEZ of erosion-prone lands between 2000 and 2015 (“extent” refers to % total area of erosion-prone lands).
| AEZ Names | 2000 | 2015 | Net Change in Soil Loss (2000–2015) | ||
|---|---|---|---|---|---|
| Extent (%) | Mean Soil Loss (t ha−1 y−1) | Extent (%) | Mean Soil Loss (t ha−1 y−1) | ||
| Imbo | 0.7 | 48.5 | 0.7 | 29.6 | −18.9 |
| Impala | 2.8 | 86.2 | 2.8 | 59.8 | −26.4 |
| Kivu Lake Borders | 3.3 | 74.4 | 3.1 | 52.3 | −22.1 |
| Birunga/Volcano | 3.8 | 45.4 | 3.8 | 38.0 | −7.4 |
| Congo-Nile Watershed Divide | 17.2 | 107.5 | 17.4 | 82.1 | −25.4 |
| Buberuka highlands | 7.1 | 40.7 | 7.1 | 41.4 | 0.7 |
| Central Plateau and Granitic Ridge | 23.1 | 42.8 | 23.4 | 34.6 | −8.2 |
| Mayaga and Bugesera | 7.7 | 15.8 | 8.0 | 11.7 | −4.1 |
| Eastern Plateau | 15.8 | 23.4 | 15.5 | 20.6 | −2.8 |
| Eastern Savanna | 18.5 | 30.0 | 18.2 | 26.4 | −3.6 |
| Overall | 100 | 48.6 | 100 | 39.2 | −9.4 |

Table A2.
Distribution of mean soil loss per district of erosion-prone lands between 2000 and 2015.
Table A2.
Distribution of mean soil loss per district of erosion-prone lands between 2000 and 2015.
| District Names | 2000 | 2015 | Net Change in Soil Loss (2000–2015) | ||
|---|---|---|---|---|---|
| Extent (%) | Mean Soil Loss (t ha−1 y−1) | Extent (%) | Mean Soil Loss (t ha−1 y−1) | ||
| Nyarugenge | 0.4 | 43.2 | 0.4 | 30.4 | −12.8 |
| Gasabo | 1.7 | 32.7 | 1.6 | 26.6 | −6.1 |
| Kicukiro | 0.5 | 18.3 | 0.5 | 11.4 | −6.9 |
| Nyanza | 2.9 | 20.2 | 3.0 | 19.1 | −1.1 |
| Gisagara | 2.8 | 30.1 | 3.0 | 18.1 | −12.0 |
| Nyaruguru | 4.4 | 106.0 | 4.5 | 72.8 | 33.2 |
| Huye | 2.5 | 37.6 | 2.5 | 29.0 | −8.6 |
| Nyamagabe | 4.8 | 90.0 | 4.8 | 69.3 | −20.7 |
| Ruhango | 2.7 | 19.7 | 2.7 | 17.6 | −2.1 |
| Muhanga | 2.8 | 61.3 | 2.8 | 48.4 | −12.9 |
| Kamonyi | 2.8 | 23.6 | 2.8 | 18.9 | −4.7 |
| Karongi | 3.4 | 84.5 | 3.5 | 53.7 | −30.8 |
| Rutsiro | 2.9 | 80.7 | 3.0 | 60.1 | −20.6 |
| Rubavu | 1.4 | 56.0 | 1.4 | 46.1 | −9.9 |
| Nyabihu | 2.3 | 67.8 | 2.4 | 57.5 | −10.3 |
| Ngororero | 2.9 | 63.9 | 3.0 | 48.5 | −15.4 |
| Rusizi | 4.0 | 111.3 | 4.0 | 89.3 | −22.0 |
| Rulindo | 2.5 | 36.6 | 2.5 | 40.1 | 3.5 |
| Gakenke | 3.1 | 67.1 | 3.1 | 52.0 | −15.1 |
| Musanze | 2.2 | 49.4 | 2.1 | 41.7 | −7.7 |
| Burera | 2.3 | 40.1 | 2.3 | 38.6 | −1.5 |
| Gicumbi | 3.6 | 34.4 | 3.6 | 36.1 | 1.7 |
| Rwamagana | 2.8 | 15.7 | 2.8 | 15.1 | −0.6 |
| Nyagatare | 8.1 | 25.4 | 8.0 | 23.0 | −2.4 |
| Gatsibo | 6.5 | 31.7 | 6.3 | 26.9 | −4.8 |
| Kayonza | 7.1 | 32.4 | 7.1 | 30.0 | −2.4 |
| Kirehe | 4.7 | 24.2 | 4.5 | 21.0 | −3.2 |
| Ngoma | 3.2 | 16.5 | 3.1 | 15.1 | −1.4 |
| Bugesera | 4.6 | 12.7 | 4.6 | 10.9 | −1.8 |
| Nyamasheke | 4.1 | 103.8 | 4.1 | 82.5 | −21.3 |
| Overall | 100 | 48.6 | 100 | 39.2 | −9.4 |

Table A3.
Estimated mean soil loss and mean slope per district of erosion-prone areas experiencing LULCC between 2000 and 2015.
Table A3.
Estimated mean soil loss and mean slope per district of erosion-prone areas experiencing LULCC between 2000 and 2015.
| District Names | Extent (%) | Mean Soil Loss (t ha−1 y−1) | Mean Slope (%) |
|---|---|---|---|
| Nyarugenge | 0.2 | 28.3 | 26.4 |
| Gasabo | 0.8 | 26.1 | 23.7 |
| Kicukiro | 0.2 | 14.1 | 15.0 |
| Nyanza | 0.5 | 43.3 | 24.3 |
| Gisagara | 1.0 | 24.8 | 22.3 |
| Nyaruguru | 1.7 | 54.8 | 31.5 |
| Huye | 0.8 | 38.4 | 25.2 |
| Nyamagabe | 1.7 | 66.5 | 34.3 |
| Ruhango | 0.4 | 41.7 | 25.5 |
| Muhanga | 1.0 | 53.8 | 35.2 |
| Kamonyi | 0.5 | 35.8 | 26.7 |
| Karongi | 1.6 | 48.4 | 34.9 |
| Rutsiro | 1.3 | 56.4 | 33.4 |
| Rubavu | 0.7 | 33.2 | 19.8 |
| Nyabihu | 0.7 | 68.1 | 36.5 |
| Ngororero | 1.0 | 57.7 | 36.5 |
| Rusizi | 1.3 | 45.7 | 27.8 |
| Rulindo | 0.7 | 72.2 | 38.7 |
| Gakenke | 1.0 | 60.4 | 39.3 |
| Musanze | 0.5 | 25.0 | 17.3 |
| Burera | 0.5 | 62.5 | 34.4 |
| Gicumbi | 1.3 | 53.2 | 36.1 |
| Rwamagana | 1.2 | 23.0 | 18.4 |
| Nyagatare | 2.0 | 17.8 | 15.4 |
| Gatsibo | 2.2 | 21.6 | 18.7 |
| Kayonza | 2.4 | 27.3 | 18.0 |
| Kirehe | 2.1 | 21.6 | 18.5 |
| Ngoma | 1.4 | 22.8 | 20.1 |
| Bugesera | 2.4 | 15.0 | 11.2 |
| Nyamasheke | 1.5 | 57.7 | 30.7 |
| Overall | 34.6 | 38.6 | 25.4 |
References
- Bridges, E.M.; Oldeman, L.R. Global Assessment of Human-Induced Soil Degradation. Arid Soil Res. Rehabil. 1999, 13, 319–325. [Google Scholar] [CrossRef]
- Borrelli, P.; Robinson, D.A.; Fleischer, L.R.; Lugato, E.; Ballabio, C.; Alewell, C.; Meusburger, K.; Modugno, S.; Schütt, B.; Ferro, V.; et al. An assessment of the global impact of 21st century land use change on soil erosion. Nat. Commun. 2017, 8, 2013. [Google Scholar] [CrossRef] [PubMed]
- Morgan, R.P.C. Soil Erosion and Conservation, 3rd ed.; Blackwell Publishing: Oxford, UK, 2005. [Google Scholar]
- Lal, R. Soil degradation by erosion. Land Degrad. Dev. 2001, 12, 519–539. [Google Scholar] [CrossRef]
- Pimentel, D.; Harvey, C.; Resosudarmo, P.; Sinclair, K.; Kurz, D.; McNair, M.; Crist, S.; Shpritz, L.; Fitton, L.; Saffouri, R.; et al. Environmental and Economic Cost of Soil Erosion and Conservation Benefits. Science 1995, 267, 1117–1123. [Google Scholar] [CrossRef] [PubMed]
- Panagos, P.; Standardi, G.; Borrelli, P.; Lugato, E.; Montanarella, L.; Bosello, F. Cost of agricultural productivity loss due to soil erosion in the European Union: From direct cost evaluation approaches to the use of macroeconomic models. Land Degrad. Dev. 2018, 29, 471–484. [Google Scholar] [CrossRef]
- Pimentel, D.; Burgess, M. Soil Erosion Threatens Food Production. Agriculture 2013, 3, 443–463. [Google Scholar] [CrossRef]
- Pimentel, D. Soil Erosion: A Food and Environmental Threat. Environ. Dev. Sustain. 2006, 8, 119–137. [Google Scholar] [CrossRef]
- Karamage, F.; Zhang, C.; Kayiranga, A.; Shao, H.; Fang, X.; Ndayisaba, F.; Nahayo, L.; Mupenzi, C.; Tian, G. USLE-Based Assessment of Soil Erosion by Water in the Nyabarongo River Catchment, Rwanda. Int. J. Environ. Res. Public Health 2016, 13, 835. [Google Scholar] [CrossRef]
- Syvitski, J.; Vörösmarty, C.J.; Kettner, A.; Green, P. Impact of humans on the flux of terrestrial sediment to the global coastal ocean. Science 2005, 308, 376–380. [Google Scholar] [CrossRef]
- Baumhardt, R.L.; Blanco-Canqui, H. Soil: Conservation Practices. In Encyclopedia of Agriculture and Food Systems; Alfen, N.V., Ed.; Elsevier: San Diego, CA, USA, 2014; Volume 5, pp. 153–165. [Google Scholar]
- Tilman, D.; Fargione, J.; Wolff, B.; D’Antonio, C.; Dobson, A.; Howarth, R.; Schindler, D.W.; Schlesinger, W.; Simberloff, D.; Swackhamer, D. Forecasting Agriculturally Driven Global Environmental Change. Science 2001, 292, 281–284. [Google Scholar] [CrossRef]
- Justine, M.; Wanqin, Y.; Wu, F.; Tan, B.; Khan, M.; Zhao, Y. Biomass Stock and Carbon Sequestration in a Chronosequence of Pinus massoniana Plantations in the Upper Reaches of the Yangtze River. Forests 2015, 6, 3665–3682. [Google Scholar] [CrossRef]
- Hansen, M.C.; Potapov, P.; Moore, R.; Hancher, M.; Turubanova, S.; Tyukavina, A.; Thau, D.; Stehman, S.; Goetz, S.; Loveland, T.; et al. High-Resolution Global Maps of 21st-Century Forest Cover Change. Science 2013, 342, 850–853. [Google Scholar] [CrossRef] [PubMed]
- Lewis, L. Terracing and accelerated soil loss on Rwandian steeplands: A preliminary investigation of the implications of human activities affecting soil movement. Land Degrad. Dev. 1992, 3, 241–246. [Google Scholar] [CrossRef]
- Twagiramungu, F. Environmental Profile of Rwanda; European Commission: Kigali, Rwanda, 2006; Available online: https://europa.eu/capacity4dev/file/33001/download?token=bYDSWAeT (accessed on 29 July 2019).
- Clay, D.C.; Lewis, L.A. Land Use, Soil Loss, and Sustainable Agriculture in Rwanda. In Case Studies in Human Ecology; Bates, D.G., Lees, S.H., Eds.; Springer: Boston, MA, USA, 1996; pp. 271–287. [Google Scholar]
- Nsengiyumva, J.B.; Luo, G.; Amanambu, A.C.; Mind’je, R.; Habiyaremye, G.; Karamage, F.; Ochege, F.U.; Mupenzi, C. Comparing probabilistic and statistical methods in landslide susceptibility modeling in Rwanda/Centre-Eastern Africa. Sci. Total Environ. 2019, 659, 1457–1472. [Google Scholar] [CrossRef]
- Nsengiyumva, J.B.; Luo, G.; Nahayo, L.; Huang, X.; Cai, P. Landslide Susceptibility Assessment Using Spatial Multi-Criteria Evaluation Model in Rwanda. Int. J. Environ. Res. Public Health 2018, 15, 243. [Google Scholar] [CrossRef]
- Nahayo, A.; Pan, G.-X.; Joseph, S. Factors influencing the adoption of soil conservation techniques in Northern Rwanda. J. Plant Nutr. Soil Sci. 2016, 179, 367–375. [Google Scholar] [CrossRef]
- Bizoza, A.R. Three-stage analysis of the adoption of soil and water conservation in the highlands of Rwanda. Land Degrad. Dev. 2014, 25, 360–372. [Google Scholar] [CrossRef]
- Bizoza, A.R.; De Graaff, J. Financial cost–benefit analysis of bench terraces in Rwanda. Land Degrad. Dev. 2012, 23, 103–115. [Google Scholar] [CrossRef]
- Bizoza, A.R. Institutions and the Adoption of Technologies: Bench Terraces in Rwanda. In Challenges and Opportunities for Agricultural Intensification of the Humid Highland Systems of Sub-Saharan Africa; Vanlauwe, B., van Asten, P., Blomme, G., Eds.; Springer: Cham, Switzerland, 2014; pp. 335–354. [Google Scholar]
- Rushemuka, P.; Bock, L.; Mowo, J.G. Soil science and agricultural development in Rwanda: State of the art. A review. Biotechnol. Agron. Soc. Environ. 2014, 18, 142–154. [Google Scholar]
- National Institute of Statistics of Rwanda. Rwanda Statistical YearBook 2018; National Institute of Statistics of Rwanda: Kigali, Rwanda, 2018. Available online: http://www.statistics.gov.rw/publication/statistical-yearbook-2018 (accessed on 11 December 2019).
- Karamage, F.; Zhang, C.; Ndayisaba, F.; Shao, H.; Kayiranga, A.; Fang, X.; Nahayo, L.; Muhire Nyesheja, E.; Tian, G. Extent of cropland and related soil erosion risk in Rwanda. Sustainability 2016, 8, 609. [Google Scholar] [CrossRef]
- Mupenzi, J.; Li, L.; Jiwen, G.; Habumugisha, J.; Dieu, D.; Habiyaremye, G.; Jean, N.; Innocent, B. Radical Terraces in Rwanda. East Afr. J. Sci. Technol. 2012, 1, 53–58. [Google Scholar]
- Nyesheja, E.M.; Chen, X.; El-Tantawi, A.M.; Karamage, F.; Mupenzi, C.; Nsengiyumva, J.B. Soil erosion assessment using RUSLE model in the Congo Nile Ridge region of Rwanda. Phys. Geogr. 2018, 40, 339–360. [Google Scholar] [CrossRef]
- Kagabo, D.; Stroosnijder, L.; Visser, S.M.; Moore, D. Soil erosion, soil fertility and crop yield on slow-forming terraces in the highlands of Buberuka, Rwanda. Soil Till. Res. 2013, 128, 23–29. [Google Scholar] [CrossRef]
- Ministry of Agriculture and Animal Resources. Annual Report 2018–2019; Ministry of Agriculture and Animal Resources: Kigali, Rwanda, 2019. Available online: https://www.minagri.gov.rw/fileadmin/user_upload/documents/AnnualReports/Minagri_Annual_Report_2018-19.pdf (accessed on 11 December 2019).
- Benavidez, R.; Jackson, B.; Maxwell, D.; Norton, K. A review of the (Revised) Universal Soil Loss Equation ((R) USLE): With a view to increasing its global applicability and improving soil loss estimates. Hydrol. Earth Syst. Sci. 2018, 22, 6059–6086. [Google Scholar] [CrossRef]
- Karydas, C.; Panagos, P.; Gitas, I. A classification of water erosion models according to their geospatial characteristics. Int. J. Digit. Earth 2014, 7, 229–250. [Google Scholar] [CrossRef]
- Wischmeier, W.H.; Smith, D.D. Predicting Rainfall Erosion Losses—A Guide to Conservation Planning; USDA: Washington, DC, USA, 1978. [Google Scholar]
- Renard, K.G.; Foster, G.R.; Weesies, G.; McCool, D.; Yoder, D. Predicting Soil Erosion by Water: A Guide to Conservation Planning with the Revised Universal Soil Loss Equation (RUSLE); United States Department of Agriculture: Washington, DC, USA, 1997. [Google Scholar]
- Lewis, L.A.; Clay, D.C.; Dejaegher, Y.M.J. Soil loss, agriculture, and conservation in Rwanda: Toward sound strategies for soil management. J. Soil Water Conserv. 1988, 43, 418–421. [Google Scholar]
- Kabirigi, M.; Mugambi, S.; Musana, B.; Ngoga, G.; Muhutu, J.C.; Rutebuka, J.; Ruganzu, V.; Nzeyimana, I.; Nabahungu, N. Estimation of soil erosion risk, its valuation and economic implications for agricultural production in western part of Rwanda. J. Exp. Biol. Agric. Sci. 2017, 5, 525–536. [Google Scholar] [CrossRef]
- Karamage, F.; Shao, H.; Chen, X.; Ndayisaba, F.; Nahayo, L.; Kayiranga, A.; Omifolaji, K.J.; Liu, T.; Zhang, C. Deforestation Effects on Soil Erosion in the Lake Kivu Basin, D.R. Congo-Rwanda. Forests 2016, 7, 281. [Google Scholar] [CrossRef]
- Jordan, G.; Van Rompaey, A.; Szilassi, P.; Csillag, G.; Mannaerts, C.M.; Woldai, T. Historical land use changes and their impact on sediment fluxes in the Balaton basin (Hungary). Agric. Ecosyst. Environ. 2005, 108, 119–133. [Google Scholar] [CrossRef]
- Sharma, A.; Tiwari, K.N.; Bhadoria, P. Effect of land use land cover change on soil erosion potential in an agricultural watershed. Environ. Monit. Assess. 2010, 173, 789–801. [Google Scholar] [CrossRef]
- National Institute of Statistics of Rwanda. Rwanda Statistical YearBook 2017; National Institute of Statistics of Rwanda: Kigali, Rwanda, 2017. Available online: http://statistics.gov.rw/publication/statistical-yearbook-2017 (accessed on 7 September 2019).
- Nzeyimana, I.; Hartemink, A.E.; Geissen, V. Correction: GIS-based multi-criteria analysis for Arabica coffee expansion in Rwanda. PLoS ONE 2016, 11, e0149239. [Google Scholar] [CrossRef]
- Ndayisaba, F.; Guo, H.; Bao, A.; Guo, H.; Karamage, F.; Kayiranga, A. Understanding the Spatial Temporal Vegetation Dynamics in Rwanda. Remote Sens. 2016, 8, 129. [Google Scholar] [CrossRef]
- Karamage, F.; Zhang, C.; Fang, X.; Liu, T.; Ndayisaba, F.; Nahayo, L.; Kayiranga, A.; Nsengiyumva, J.B. Modeling rainfall-runoff response to land use and land cover change in Rwanda (1990–2016). Water 2017, 9, 147. [Google Scholar] [CrossRef]
- Mind’je, R.; Li, L.; Amanambu, A.C.; Nahayo, L.; Nsengiyumva, J.B.; Gasirabo, A.; Mindje, M. Flood susceptibility modeling and hazard perception in Rwanda. Int. J. Disaster Risk Reduct. 2019, 38, 101211. [Google Scholar] [CrossRef]
- Siebert, A.; Dinku, T.; Vuguziga, F.; Twahirwa, A.; Kagabo, D.; delCorral, J.; Robertson, A.W. Evaluation of ENACTS-Rwanda; A New Multi-Decade, High-Resolution Rainfall and Temperature Dataset: Climatology. Int. J. Climatol. 2019, 39, 3104–3120. [Google Scholar] [CrossRef]
- Muhire, I.; Ahmed, F.; Abd Elbasit, M. Spatio-temporal variations of rainfall erosivity in Rwanda. J. Soil Sci. Environ. Manag. 2015, 6, 72–83. [Google Scholar]
- Muhire, I.; Ahmed, F.; Abutaleb, K. Relationships between Rwandan seasonal rainfall anomalies and ENSO events. Theor. Appl. Climatol. 2014, 122, 271–284. [Google Scholar] [CrossRef]
- Muhire, I.; Ahmed, F. Spatiotemporal trends in mean temperatures and aridity index over Rwanda. Theor. Appl. Climatol. 2015, 123, 399–414. [Google Scholar] [CrossRef]
- Henninger, S. Does the global warming modify the local Rwandan climate? Nat. Sci. 2013, 5, 124–129. [Google Scholar] [CrossRef]
- Meigh, J.R.; McKenzie, A.A.; Sene, K.J. A Grid-Based Approach to Water Scarcity Estimates for Eastern and Southern Africa. Water Resour. Manag. 1999, 13, 85–115. [Google Scholar] [CrossRef]
- Stage, J.; Uwera, C. Prospects for establishing environmental satellite accounts in a developing country: The case of Rwanda. J. Clean. Prod. 2018, 200, 219–230. [Google Scholar] [CrossRef]
- Ministry of Agriculture and Animal Resources. Strategic Plan for the Transformation of Agriculture in Rwanda—Phase II (PSTA II); Final Report; Ministry of Agriculture and Animal Resources: Kigali, Rwanda, 2009. Available online: https://www.minagri.gov.rw/fileadmin/user_upload/documents/RWANDA_SAKSS/PSTA_II__2008-12_.pdf (accessed on 15 July 2019).
- Ministry of Agriculture and Animal Resources. Strategies for Sustainable Crop Intensification in Rwanda – Shifting Focus From Producing Enough to Producing Surplus; Ministry of Agriculture and Animal Resources: Kigali, Rwanda, 2011. Available online: http://www.gakenke.gov.rw/fileadmin/templates/DOCUMENT_Z_ABAKOZI/abakozi/CIP_Strategies_2011.pdf (accessed on 30 July 2019).
- Karamage, F.; Zhang, C.; Liu, T.; Maganda, A.; Isabwe, A. Soil Erosion Risk Assessment in Uganda. Forests 2017, 8, 52. [Google Scholar] [CrossRef]
- Maetens, W.; Poesen, J.; Vanmaercke, M. How effective are soil conservation techniques in reducing plot runoff and soil loss in Europe and the Mediterranean? Earth-Sci. Rev. 2012, 115, 21–36. [Google Scholar] [CrossRef]
- Maetens, W.; Vanmaercke, M.; Poesen, J.; Jankauskas, B.; Jankauskiene, G.; Ionita, I. Effects of land use on annual runoff and soil loss in Europe and the Mediterranean A meta-analysis of plot data. Prog. Phys. Geogr. 2012, 36, 599–653. [Google Scholar] [CrossRef]
- Panagos, P.; Borrelli, P.; Poesen, J.; Ballabio, C.; Lugato, E.; Meusburger, K.; Montanarella, L.; Alewell, C. The new assessment of soil loss by water erosion in Europe. Environ. Sci. Policy 2015, 54, 438–447. [Google Scholar] [CrossRef]
- Regional Centre For Mapping Resource For Development. Land Cover Viewer: Eastern & Southern Africa. Available online: http://apps.rcmrd.org/landcoverviewer/ (accessed on 6 April 2019).
- Rwanda Environment Management Authority. Chap 6. Forest and Protected Areas; Rwanda Environment Management Authority: Kigali, Rwanda, 2009. Available online: https://www.rema.gov.rw/soe/chap6.pdf (accessed on 31 July 2019).
- Akinyemi, F. Land change in the central Albertine rift: Insights from analysis and mapping of land use-land cover change in north-western Rwanda. Appl. Geogr. 2017, 87, 127–138. [Google Scholar] [CrossRef]
- Elliot, W.J.; Page-Dumroese, D.; Robichaud, P.R. The Effects of Forest Management on Erosion and Soil Productivity. In Soil Quality and Soil Erosion; Lal, R., Ed.; St. Lucie Press: Boca Raton, FL, USA, 1998; pp. 195–209. [Google Scholar]
- United States Geological Survey. U.S. Geological Survey Earthexplorer (ee) Tool. Available online: http://earthexplorer.usgs.gov/ (accessed on 19 August 2018).
- Hengl, T.; Heuvelink, G.; Kempen, B.; Leenaars, J.G.B.; Walsh, M.; Shepherd, K.; Sila, A.; Macmillan, R.A.; Mendes de Jesus, J.; Tamene, L.; et al. Mapping Soil Properties of Africa at 250 m Resolution: Random Forests Significantly Improve Current Predictions. PLoS ONE 2015, 10, e0125814. [Google Scholar] [CrossRef]
- NASA Goddard Space Flight Center. MOD13Q1—MODIS/Terra Vegetation Indices 16-Day L3 Global 250m SIN Grid. Available online: https://ladsweb.modaps.eosdis.nasa.gov/ (accessed on 6 April 2019).
- Panagos, P.; Borrelli, P.; Meusburger, K.; Yu, B.; Klik, A.; Jae Lim, K.; Yang, J.E.; Ni, J.; Miao, C.; Chattopadhyay, N.; et al. Global rainfall erosivity assessment based on high-temporal resolution rainfall records. Sci. Rep. 2017, 7, 4175. [Google Scholar] [CrossRef]
- Nearing, M.A.; Yin, S.-q.; Borrelli, P.; Polyakov, V.O. Rainfall erosivity: An historical review. Catena 2017, 157, 357–362. [Google Scholar] [CrossRef]
- Angima, S.; Stott, D.; O’neill, M.; Ong, C.; Weesies, G. Soil erosion prediction using RUSLE for central Kenyan highland conditions. Agric. Ecosyst. Environ. 2003, 97, 295–308. [Google Scholar] [CrossRef]
- Renard, K.G.; Freimund, J.R. Using monthly precipitation data to estimate the R-factor in the revised USLE. J. Hydrol. 1994, 157, 287–306. [Google Scholar] [CrossRef]
- Yang, D.; Kanae, S.; Oki, T.; Koike, T.; Musiake, K. Global potential soil erosion with reference to land use and climate changes. Hydrol. Process. 2003, 17, 2913–2928. [Google Scholar] [CrossRef]
- Williams, J.R. The EPIC Model; Computer Models of Watershed Hydrology Water Resources Publications: Highlands Ranch, CO, USA, 1995; pp. 909–1000. [Google Scholar]
- Desmet, P.J.J.; Govers, G. A GIS procedure for automatically calculating the USLE LS factor on topographically complex landscape units. J. Soil Water Conserv. 1996, 51, 427–433. [Google Scholar]
- McCool, D.K.; Brown, L.; Foster, G.; Mutchler, C.; Meyer, L. Revised Slope Length Factor for the Universal Soil Loss Equation. Trans. ASAE 1987, 30, 1387–1396. [Google Scholar] [CrossRef]
- Rodríguez José, L.G.; Suárez Martín, C.G. Estimation of slope length value of RUSLE factor L using GIS. J. Hydrol. Eng. 2010, 15, 714–717. [Google Scholar] [CrossRef]
- McCool, D.K.; Foster, G.R.; Mutchler, C.K.; Meyer, L.D. Revised Slope Length Factor for the Universal Soil Loss Equation. Trans. ASAE 1989, 32, 1571–1576. [Google Scholar] [CrossRef]
- Durigon, V.L.; Carvalho, D.F.; Antunes, M.A.H.; Oliveira, P.T.S.; Fernandes, M.M. NDVI time series for monitoring RUSLE cover management factor in a tropical watershed. Int. J. Remote Sens. 2014, 35, 441–453. [Google Scholar] [CrossRef]
- Phinzi, K.; Ngetar, N.S. The assessment of water-borne erosion at catchment level using GIS-based RUSLE and remote sensing: A review. Int. Soil Water Conserv. Res. 2019, 7, 27–46. [Google Scholar] [CrossRef]
- Renard, K.G.; Foster, G.R.; Weesies, G.A.; Porter, J.P. RUSLE: Revised universal soil loss equation. J. Soil Water Conserv. 1991, 46, 30–33. [Google Scholar]
- Panagos, P.; Borrelli, P.; Meusburger, K.; van der Zanden, E.H.; Poesen, J.; Alewell, C. Modelling the effect of support practices (P-factor) on the reduction of soil erosion by water at European scale. Environ. Sci. Policy 2015, 51, 23–34. [Google Scholar] [CrossRef]
- Asmamaw, L.B.; Mohammed, A.A. Identification of soil erosion hotspot areas for sustainable land management in the Gerado catchment, North-eastern Ethiopia. Remote Sens. Appl. Soc. Environ. 2019, 13, 306–317. [Google Scholar] [CrossRef]
- Bewket, W.; Teferi, E. Assessment of soil erosion hazard and prioritization for treatment at the watershed level: Case study in the Chemoga watershed, Blue Nile basin, Ethiopia. Land Degrad. Dev. 2009, 20, 609–622. [Google Scholar] [CrossRef]
- Shin, G. The analysis of soil erosion analysis in watershed using GIS. Ph.D. Thesis, Department of Civil Engineering, Gang-won National University, Chuncheon, Korea, 1999. [Google Scholar]
- National Institute of Statistics of Rwanda. EICV5 District Profiles; National Institute of Statistics of Rwanda: Kigali, Rwanda. Available online: https://www.statistics.gov.rw/publication/eicv5-district-profiles (accessed on 3 June 2019).
- Almaw Fenta, A.; Tsunekawa, A.; Haregeweyn, N.; Poesen, J.; Tsubo, M.; Borrelli, P.; Panagos, P.; Vanmaercke, M.; Broeckx, J.; Yasuda, H.; et al. Land susceptibility to water and wind erosion risks in the East Africa region. Sci. Total Environ. 2019, 703, 135016. [Google Scholar] [CrossRef] [PubMed]
- Tamene, L.; Le, Q.B. Estimating soil erosion in sub-Saharan Africa based on landscape similarity mapping and using the revised universal soil loss equation (RUSLE). Nutr. Cycl. Agroecosys. 2015, 102, 17–31. [Google Scholar] [CrossRef]
- Lewis, L.A.; Nyamulinda, V. The critical role of human activities in land degradation in Rwanda. Land Degrad. Dev. 1996, 7, 47–55. [Google Scholar] [CrossRef]
- Xu, C.; Yang, Z.; Qian, W.; Chen, S.; Liu, X.; Lin, W.; Xiong, D.; Jiang, M.; Chang, C.-T.; Huang, J.-C.; et al. Runoff and soil erosion responses to rainfall and vegetation cover under various afforestation management regimes in subtropical montane forest. Land Degrad. Dev. 2019, 30, 1711–1724. [Google Scholar] [CrossRef]
- Mohamad, N.A.; Nainar, A.; Annammala, K.V.; Sugumaran, D.; Jamal, M.H.; Yusop, Z. Soil erosion in disturbed forests and agricultural plantations in tropical undulating terrain: In situ measurement using a laser erosion bridge method. J. Water Clim. Chang. 2019. [Google Scholar] [CrossRef]
- National Institute of Statistics of Rwanda. Integrated Household Living Conditions Survey 3 (EICV 3) Thematic Report-Agriculture. Kigali, Rwanda, 2012. Available online: http://statistics.gov.rw/sites/default/files/publications/b47656a4-4b61-4a47-9438-7a2f9938b023/EICV3_ThematicReport_Agriculture.pdf (accessed on 6 September 2019).
- Rwanda Environment Management Authority. Rwanda-State of Environment and Outlook Report 2015; Rwanda Environment Management Authority: Kigali, Rwanda, 2015; Available online: https://www.nmbu.no/sites/default/files/pdfattachments/state_of_environment_and_outlook_report_2015.pdf (accessed on 5 November 2019).
- Rahman, M.A.K.; Zhang, D. Effects of Fertilizer Broadcasting on the Excessive Use of Inorganic Fertilizers and Environmental Sustainability. Sustainability 2018, 10, 759. [Google Scholar] [CrossRef]
- Rwanda Environment Management Authority. Impact of fertilizer use in Rwanda (Rweru—Mugesera Wetland Complex); Green World Consult Ltd.: Kigali, Rwanda, 2014; Available online: https://www.unpei.org/sites/default/files/e_library_documents/Impact_of_Fertlizer_use_in_Rwanda_2014.pdf (accessed on 4 November 2019).
- Muñoz-Rojas, M.; Pereira, P.; Brevik, E.C.; Cerdà, A.; Jordán, A. Chapter 6—Soil Mapping and Processes Models for Sustainable Land Management Applied to Modern Challenges. In Soil Mapping and Process Modeling for Sustainable Land Use Management; Pereira, P., Brevik, E.C., Muñoz-Rojas, M., Miller, B.A., Eds.; Elsevier: Amsterdam, The Netherlands, 2017; pp. 151–190. [Google Scholar]
- Critchley, W.; Bruijnzeel, L. Terrace risers: Erosion control or sediment source. In Sustainable Reconstruction of Highland and Headwater Regions; Singh, R.B.A., Haigh, M.J., Eds.; Oxford and IBH Publishing: New Delhi, India, 1995; pp. 529–541. [Google Scholar]
- Tarolli, P.; Preti, F.; Romano, N. Terraced landscapes: From an old best practice to a potential hazard for soil degradation due to land abandonment. Anthropocene 2014, 6, 10–25. [Google Scholar] [CrossRef]
- McDonagh, J.; Lu, Y.; Semalulu, O. Adoption and adaptation of improved soil management practices in the eastern Ugandan hills. Land Degrad. Dev. 2014, 25, 58–70. [Google Scholar] [CrossRef]
- Subhatu, A.; Lemann, T.; Hurni, K.; Portner, B.; Kassawmar, T.; Zeleke, G.; Hurni, H. Deposition of eroded soil on terraced croplands in Minchet catchment, Ethiopian Highlands. Int. Soil Water Conserv. Res. 2017, 5, 212–220. [Google Scholar] [CrossRef]
- Paliaga, G.; Giostrella, P.; Faccini, F. Terraced landscape as cultural and environmental heritage at risk: An example from Portofino park (Italy). ANNALES-Anal. Istrske Mediter. Studije-Ser. Hist. Sociol. 2016, 26, 513–522. [Google Scholar]
- Lesschen, J.P.; Cammeraat, E.L.H.; Nieman, T. Erosion and terrace failure due to agricultural land abandonment in semi-arid environment. Earth Surf. Process. Landf. 2008, 33, 1574–1584. [Google Scholar] [CrossRef]
© 2019 by the authors. Licensee MDPI, Basel, Switzerland. This article is an open access article distributed under the terms and conditions of the Creative Commons Attribution (CC BY) license (http://creativecommons.org/licenses/by/4.0/).

