A Summary on Research of Household Energy Consumption: A Bibliometric Analysis


Abstract
1. Introduction
2. Materials and Methods
2.1. Collaboration Degree
2.2. Comprehensive Strength
2.3. Co-Word and Co-Cited
3. Results
3.1. Number of Publications by Countries
3.2. Author Statistics
3.3. Institution Statistics
3.4. Academic Collaboration
3.5. National Comprehensive Strength in the Field of Household Energy Consumption
3.6. Co-Word and Co-Cited Analysis
4. Discussion
5. Conclusions
Author Contributions
Funding
Conflicts of Interest
References
- Hertwich, E.G.; Peters, G.P. Carbon Footprint of Nations: A Global, Trade-Linked Analysis. Technol. Environ. Sci. 2009, 43, 6414–6420. [Google Scholar] [CrossRef]
- Stoppok, M. Of culture, consumption and cost: A comparative analysis of household energy consumption in Kenya, Germany and Spain. Energy Res. Soc. Sci. 2018, 40, 127–139. [Google Scholar] [CrossRef]
- Xia, C.; Li, W.; Chang, X.; Delicato, F.C.; Zomaya, A. Computational Intelligence for Pervasive Systems. In Proceedings of the 4th International Conference on Big Data Intelligence and Computing and Cyber Science and Technology Congress (DASC/PiCom/DataCom/CyberSciTech), Athens, Greece, 12–15 August 2018. [Google Scholar]
- Korzeniowska-Ginter, R. Energy consumption by cooking appliances used in Polish households. IOP Conf. Ser. Earth Environ. Sci. 2019, 214, 012096. [Google Scholar] [CrossRef]
- World Energy Balances 2019. IEA (International Energy Agency), 2019. Available online: https://www.iea.org/data-and-statistics (accessed on 14 September 2019).
- CCC. Building a Low-Carbon Economy-the UK’s Contribution to Tacking Climate Change; Committee on Climate Change: London, UK, 2008. [Google Scholar]
- Cong, R.G.; Wei, Y.-M. Experimental comparison of impact of auction format on carbon allowance market. Renew. Sustain. Energy Rev. 2012, 16, 4148–4156. [Google Scholar] [CrossRef]
- Herendeen, R. Total energy cost of household consumption in Norway, 1973. Energy 1973, 3, 615–630. [Google Scholar] [CrossRef]
- Pachauri, S. An analysis of cross-sectional variations in total household energy requirements in India using micro survey data. Energy Policy 2004, 32, 1723–1735. [Google Scholar] [CrossRef]
- Xiaohua, W.; Xianrong, H.; Ling, J. Study on rural household energy consumption in China based on household investigation from typical counties. Trans. Chin. Soc. Agric. Eng. (Trans. CSAE) 2014, 30, 206–212. (In Chinese) [Google Scholar]
- Baiocchi, G.; Minx, J.; Hubacek, K. The Impact of Social Factors and Consumer Behavior on Carbon Dioxide Emissions in the United Kingdom. J. Ind. Ecol. 2010, 14, 50–72. [Google Scholar] [CrossRef]
- Fertahi, S.E.-D.; Jamil, A.; Kousksou, T.; Benbassou, A. Energy performance enhancement of a collective hot water production process equipped with a centralized storage tank. J. Energy Storage 2019, 25, 100849. [Google Scholar] [CrossRef]
- Pochwat, K.; Kordana, S.; Starzec, M.; Słyś, D. Comparison of two-prototype near-horizontal Drain Water Heat Recovery units on the basis of effectiveness. Energy 2019, 173, 1196–1207. [Google Scholar] [CrossRef]
- Mathews, G.E.; Mathews, E.H. A Cost Comparison of Different Energy Saving Measures in a Household. In Proceedings of the 2017 International Conference on the Domestic Use of Energy (DUE), Cape Town, South Africa, 4–5 April 2017. [Google Scholar]
- Kastner, I.; Stern, P.C. Examining the decision-making processes behind household energy investments: A review. Energy Res. Soc. Sci. 2015, 10, 72–89. [Google Scholar] [CrossRef]
- Oladokun, M.G.; Odesola, I.A. Household energy consumption and carbon emissions for sustainable cities—A critical review of modelling approaches. Int. J. Sustain. Built Environ. 2015, 4, 231–247. [Google Scholar] [CrossRef][Green Version]
- Abrahamse, W.; Steg, L.; Vlek, C.; Rothengatter, T. A review of intervention studies aimed at household energy conservation. J. Environ. Psychol. 2005, 25, 273–291. [Google Scholar] [CrossRef]
- Du, H.; Li, B.; Brown, M.A.; Mao, G.; Rameezdeen, R.; Chen, H. Expanding and shifting trends in carbon market research: A quantitative bibliometric study. J. Clean. Prod. 2015, 103, 104–111. [Google Scholar] [CrossRef]
- Cañas-Guerrero, I.; Mazarrón, F.R.; Calleja-Perucho, C.; Pou-Merina, A. Bibliometric analysis in the international context of the “Construction & Building Technology” category from the Web of Science database. Constr. Build. Mater. 2014, 53, 13–25. [Google Scholar]
- Kiriyama, E.; Kajikawa, Y.; Fujita, K.; Iwata, S. A lead for transvaluation of global nuclear energy research and funded projects in Japan. Appl. Energy 2013, 109, 145–153. [Google Scholar] [CrossRef]
- Sanz-Casado, E.; Lascurain-Sánchez, M.L.; Serrano-Lopez, A.E.; Larsen, B.; Ingwersen, P. Production, consumption and research on solar energy: The Spanish and German case. Renew. Energy 2014, 68, 733–744. [Google Scholar] [CrossRef]
- Montoya, F.G.; Montoya, M.G.; Gómez, J.; Manzano-Agugliaro, F.; Alameda-Hernández, E. The research on energy in spain: A scientometric approach. Renew. Sustain. Energy Rev. 2014, 29, 173–183. [Google Scholar] [CrossRef]
- Cohen, C.; Lenzen, M.; Schaeffer, R. Energy requirements of households in Brazil. Energy Policy 2005, 33, 555–562. [Google Scholar] [CrossRef]
- Zheng, X.; Wei, C. Household Energy Consumption in China: 2016 Report; Springer: Singapore, 2019. [Google Scholar]
- Liao, C.H.; Yen, H.R. Quantifying the degree of research collaboration: A comparative study of collaborative measures. J. Informetr. 2012, 6, 27–33. [Google Scholar] [CrossRef]
- Yu, H.; Wei, Y.-M.; Tang, B.-J.; Mi, Z.; Pan, S.-Y. Assessment on the research trend of low-carbon energy technology investment: A bibliometric analysis. Appl. Energy 2016, 184, 960–970. [Google Scholar] [CrossRef]
- Duan, L. Analysis of the relationship between international cooperation and scientific publications in energy R&D in China. Appl. Energy 2011, 88, 4229–4238. [Google Scholar]
- Zhao, W.; Han-shi, Q.; Li-shan, L.; Peng, W.; Dai-qing, Z. Emission Trading Research Trend Analysis Based on Bibliometric. J. Circuits Syst. 2016, 4, 417–424. (In Chinese) [Google Scholar]
- Callon, M.; Courtial, J.P.; Laville, F. Co-word analysis as a tool for describing the network of interactions between basic and technological research: The case of polymer chemsitry. Scientometrics 1991, 22, 155–205. [Google Scholar] [CrossRef]
- Chen, C. The Centrality of Pivotal Points in the Evolution of Scientific Networks. Intelligence 2005, 98–105. [Google Scholar] [CrossRef]
- Braam, R.R.; Moed, H.F.; Raan, A.F.J.V. Mapping of science by combined co-citation and word analysis: II: Dynamical aspects. J. Am. Soc. Inf. Sci. 1991, 42, 252–266. [Google Scholar] [CrossRef]
- Garfield, E.; Pudovkin, A.; Istomin, V.S. Algorithmic Citation-Linked Historiography—Mapping the Literature of Science. Proc. Am. Soc. Inf. Sci. Technol. 2005, 39, 14–24. [Google Scholar] [CrossRef]
- De Solla Price, D.J. Little Science, Big Science; Columbia University Press: New York, NY, USA, 1963. [Google Scholar]
- Yiming, W.; Zhifu, M.; Hao, Z. Review on climate policy modeling: An analysis based on bibliometrics method. Adv. Earth Sci. 2013, 28, 930–938. (In Chinese) [Google Scholar]
- Malik, V.S.; Popkin, B.M.; Bray, G.A.; Després, J.P.; Willett, W.C.; Hu, F.B. Sugar-sweetened beverages and risk of metabolic syndrome and type 2 diabetes: A meta-analysis. Diabetes Care 2010, 33, 2477–2483. [Google Scholar] [CrossRef]
- Pakula, C.; Stamminger, R. Electricity and water consumption for laundry washing by washing machine worldwide. Energy Effic. 2010, 3, 365–382. [Google Scholar] [CrossRef]
- Monteiro, C.A.; Levy, R.B.; Claro, R.M.; de Castro, I.R.R.; Cannon, G. Increasing consumption of ultra-processed foods and likely impact on human health: Evidence from Brazil. Public Health Nutr. 2011, 14, 5–13. [Google Scholar] [CrossRef]
- Moubarac, J.C.; Martins, A.P.B.; Claro, R.M.; Levy, R.B.; Cannon, G.; Monteiro, C.A. Consumption of ultra-processed foods and likely impact on human health. Evidence from Canada. Public Health Nutr. 2013, 16, 2240–2248. [Google Scholar] [CrossRef] [PubMed]
- Hubacek, K.; Feng, K.; Chen, B. Changing Lifestyles Towards a Low Carbon Economy: An IPAT Analysis for China. Energies 2011, 5, 22–31. [Google Scholar] [CrossRef]
- Xiaohua, W.; Kunquan, L.; Hua, L.; Di, B.; Jingru, L. Research on China’s rural household energy consumption—Household investigation of typical counties in 8 economic zones. Renew. Sustain. Energy Rev. 2017, 68, 28–32. [Google Scholar] [CrossRef]
- Saidur, R.; Masjuki, H.H.; Jamaluddin, M.Y.; Ahmed, S. Energy and associated greenhouse gas emissions from household appliances in Malaysia. Energy Policy 2007, 35, 1648–1657. [Google Scholar] [CrossRef]
- Treloar, G.; Fay, R.; Love, P.E.D.; Iyerraniga, U. Analysing the life-cycle energy of an Australian residential building and its householders. Build. Res. Inf. 2000, 28, 184–195. [Google Scholar] [CrossRef]
- Vringer, K.; Blok, K. Long-term trends in direct and indirect household energy intensities: A factor in dematerialisation? Energy Policy 2000, 28, 713–727. [Google Scholar] [CrossRef]
- Kayser, H.A. Gasoline demand and car choice: Estimating gasoline demand using household information. Energy Econ. 2000, 22, 331–348. [Google Scholar] [CrossRef]
- Mahlia, T.M.I.; Masjuki, H.H.; Saidur, R.; Amalina, M.A. Cost–benefit analysis of implementing minimum energy efficiency standards for household refrigerator-freezers in Malaysia. Energy Policy 2004, 32, 1819–1824. [Google Scholar] [CrossRef]
- Kramer, K.J. Greenhouse gas emissions related to Dutch food consumption. Energy Policy 1999, 27, 203–216. [Google Scholar] [CrossRef]
- Du, S.; Lu, B.; Zhai, F.; Popkin, B.M. A new stage of the nutrition transition in China. Public Health Nutr. 2002, 5, 169–174. [Google Scholar] [CrossRef] [PubMed]
- Drewnowski, A. Obesity and the food environment: Dietary energy density and diet costs. Am. J. Prev. Med. 2004, 27 (Suppl. 3), 154–162. [Google Scholar] [CrossRef] [PubMed]
- Bowman, S.A.; Gortmaker, S.L.; Ebbeling, C.B.; Pereira, M.A.; Ludwig, D.S. Effects of fast-food consumption on energy intake and diet quality among children in a national household survey. Pediatrics 2004, 113 Pt 1, 112–118. [Google Scholar] [CrossRef] [PubMed]
- Hann, C.; Rock, C.; King, I.; Drewnowski, A. Validation of the Healthy Eating Index with use of plasma biomarkers in a clinical sample of women. Am. J. Clin. Nutr. 2001, 74, 479. [Google Scholar] [CrossRef] [PubMed]
- Florencio, T.T.; Ferreira, H.S.; Cavalcante, J.C.; Luciano, S.M.; Sawaya, A.L. Food consumed does not account for the higher prevalence of obesity among stunted adults in a very-low-income population in the Northeast of Brazil (Maceio, Alagoas). Eur. J. Clin. Nutr. 2003, 57, 1437–1446. [Google Scholar] [CrossRef] [PubMed]
- Dendukuri, G.; Mittal, J.P. Household energy needs of a village in the Rayalaseema area of In addition, hra Pradesh, India. Energy Convers. Manag. 1993, 34, 1273–1286. [Google Scholar] [CrossRef]
- Sanchez, M.C.; Koomey, J.G.; Moezzi, M.M.; Meier, A.; Huber, W. Miscellaneous electricity in US homes: Historical decomposition and future trends. Energy Policy 1998, 26, 585–593. [Google Scholar] [CrossRef]
- Hertwich, E.G. Life cycle approaches to sustainable consumption: A critical review. Environ. Sci. Technol. 2005, 39, 4673–4684. [Google Scholar] [CrossRef]
- Gatersleben, B. Sustainable household consumption and quality of life: The acceptability of sustainable consumption patterns and consumer policy strategies. Int. J. Environ. Pollut. 2001, 15, 200–216. [Google Scholar] [CrossRef]
- Indra Mahlia, T.M.; Masjuki, H.H.; Choudhury, I.; Saidur, R. Potential CO2 reduction by implementing energy efficiency standard for room air conditioner in Malaysia. Energy Convers. Manag. 2001, 42, 1673–1685. [Google Scholar] [CrossRef]
- Mahlia, T.M.I.; Masjuki, H.H.; Saidur, R.; Amalina, M.A. Viewpoint: Mitigation of emissions through energy efficiency standards for room air conditioners in Malaysia. Energy Policy 2004, 32, 1783–1787. [Google Scholar] [CrossRef]
- Judson, R.A.; Schmalensee, R.; Stoker, T.M. Economic Development and the Structure of the Demand for Commercial Energy. Energy 1999, 20, 29–57. [Google Scholar] [CrossRef]
- Wang, X.; Feng, Z.; Gao, X.; Jiang, K. On household energy consumption for rural development: A study on Yangzhong county of China. Energy 1999, 24, 493–500. [Google Scholar] [CrossRef]
- Mills, B.; Schleich, J. What’s driving energy efficient appliance label awareness and purchase propensity? Energy Policy 2010, 38, 814–825. [Google Scholar] [CrossRef]
- Athukorala, P.P.A.W.; Wilson, C. Estimating short and long-term residential demand for electricity: New evidence from Sri Lanka. Energy Econ. 2010, 32, S34–S40. [Google Scholar] [CrossRef]
- Deutsch, M. Life Cycle Cost Disclosure, Consumer Behavior, and Business Implications. J. Ind. Ecol. 2010, 14, 103–120. [Google Scholar] [CrossRef]
- Ueno, T.; Sano, F.; Saeki, O.; Tsuji, K. Effectiveness of an energy-consumption information system on energy savings in residential houses based on monitored data. Appl. Energy 2006, 83, 166–183. [Google Scholar] [CrossRef]
- Ouyang, J.; Hokao, K. Energy-saving potential by improving occupants’ behavior in urban residential sector in Hangzhou City, China. Energy Build. 2009, 41, 711–720. [Google Scholar] [CrossRef]
- Shan, H.; Da, Y.; Guo, S.; Ying, C.; Bing, D. A survey on energy consumption and energy usage behavior of households and residential building in urban China. Energy Build. 2017, 148, 366–378. [Google Scholar]
- Brounen, D.; Kok, N.; Quigley, J.M. Residential energy use and conservation: Economics and demographics. Eur. Econ. Rev. 2012, 56, 931–945. [Google Scholar] [CrossRef]
- Tiefenbeck, V.; Staake, T.; Roth, K.; Sachs, O. For better or for worse? Empirical evidence of moral licensing in a behavioral energy conservation campaign. Energy Policy 2013, 57, 160–171. [Google Scholar] [CrossRef]
- Martin-Biggers, J.; Spaccarotella, K.; Berhaupt-Glickstein, A.; Hongu, N.; Worobey, J.; Byrd-Bredbenner, C. Come and get it! A discussion of family mealtime literature and factors affecting obesity risk. Adv. Nutr. 2014, 5, 235. [Google Scholar] [CrossRef] [PubMed]
- Malik, V.S.; Willett, W.C.; Hu, F.B. Global obesity: Trends, risk factors and policy implications. Nat. Rev. Endocrinol. 2013, 9, 13–27. [Google Scholar] [CrossRef] [PubMed]
- Bouzarovski, S.; Petrova, S. A global perspective on domestic energy deprivation: Overcoming the energy poverty–fuel poverty binary. Energy Res. Soc. Sci. 2015, 10, 31–40. [Google Scholar] [CrossRef]
- Edwards, P.; Roberts, I. Population adiposity and climate change. Int. J. Epidemiol. 2009, 38, 1137–1140. [Google Scholar] [CrossRef]
- Higgins, P.A.T. Exercise-based transportation reduces oil dependence, carbon emissions and obesity. Environ. Conserv. 2005, 32, 197–202. [Google Scholar] [CrossRef]
- Herendeen, R.; Tanaka, J. Energy cost of living. Energy 1976, 1, 165–178. [Google Scholar] [CrossRef]
- Kok, R.; Benders, R.M.J.; Moll, H.C. Measuring the environmental load of household consumption using some methods based on input–output energy analysis: A comparison of methods and a discussion of results. Energy Policy 2006, 34, 2744–2761. [Google Scholar] [CrossRef]
- Druckman, A.; Jackson, T. The carbon footprint of UK households 1990–2004: A socio-economically disaggregated, quasi-multi-regional input–output model. Ecol. Econ. 2009, 68, 2066–2077. [Google Scholar] [CrossRef]
- Willis, L.D. Tax Policy: Effects of the Alcohol Fuels Tax Incentives; U.S. Government Accountability Office: Washington, DC, USA, 1997.
- Zha, D.; Dequn, Z.; Peng, Z. Driving forces of residential CO2 emissions in urban and rural China: An index decomposition analysis. Energy Policy 2010, 38, 3377–3383. [Google Scholar]
- Duarte, R.; Mainar, A.; Sánchez-Chóliz, J. The impact of household consumption patterns on emissions in Spain. Energy Econ. 2010, 32, 176–185. [Google Scholar] [CrossRef]
- Ekholm, T.; Krey, V.; Pachauri, S.; Riahi, K. Determinants of household energy consumption in India. Energy Policy 2010, 38, 5696–5707. [Google Scholar] [CrossRef]
- Berkhout, P.H.G.; Muskens, J.C.; Velthuijsen, J.W. Defining the rebound effect. Energy Policy 2000, 28, 425–432. [Google Scholar] [CrossRef]
- Hertwich, E. Consumption and the rebound effect. J. Ind. Ecol. 2005, 9, 85–98. [Google Scholar] [CrossRef]
- Chitnis, M.; Sorrell, S. Living up to expectations: Estimating direct and indirect rebound effects for UK households. Energy Econ. 2015, 52, S100–S116. [Google Scholar] [CrossRef]
- Fischer, C. Feedback on household electricity consumption: A tool for saving energy? Energy Effic. 2008, 1, 79–104. [Google Scholar] [CrossRef]
- Carrico, A.R.; Riemer, M. Motivating energy conservation in the workplace: An evaluation of the use of group-level feedback and peer education. J. Environ. Psychol. 2011, 31, 1–13. [Google Scholar] [CrossRef]
- Asensio, O.I.; Delmas, M.A. Nonprice incentives and energy conservation. Proc. Natl. Acad. Sci. USA 2015, 112, 510–515. [Google Scholar] [CrossRef]


| Rank | Authors | Country | TP | CF | CPP | Article |
|---|---|---|---|---|---|---|
| 1 | Popkin | USA | 27 | 51 | 1.89 | [35] |
| 2 | Stamminger | Germany | 25 | 91 | 3.64 | [36] |
| 3 | Levy | Brazil | 20 | 105 | 5.25 | [37] |
| 4 | Claro | Brazil | 19 | 95 | 5.00 | [38] |
| 5 | Monteiro | Brazil | 19 | 88 | 4.63 | [37] |
| 6 | Hubacek | England | 15 | 235 | 15.67 | [39] |
| 7 | Wang | China | 15 | 171 | 11.40 | [40] |
| 8 | Masjuki | Malaysia | 14 | 60 | 4.29 | [41] |
| Rank | Institution | Countries | TP | CF | TP RC (%) | TP RW (%) |
|---|---|---|---|---|---|---|
| 1 | Chinese Acad Sci | China | 91 | 399 | 14.02 | 1.95 |
| 2 | Univ Cambridge | England | 62 | 260 | 11.72 | 1.33 |
| 3 | Univ Calif Berkeley | USA | 57 | 294 | 5.92 | 1.22 |
| 4 | Tsinghua Univ | China | 55 | 169 | 8.47 | 1.18 |
| 5 | Univ Sao Paulo | Brazil | 54 | 126 | 41.54 | 1.16 |
| 6 | Univ N Carolina | USA | 51 | 66 | 5.30 | 1.09 |
| 7 | Univ Leeds | England | 45 | 290 | 8.51 | 0.97 |
| 8 | Beijing Inst Technol | China | 39 | 285 | 6.01 | 0.84 |
| 9 | UCL | England | 38 | 146 | 7.18 | 0.82 |
| 10 | Delft Univ Technol | Netherlands | 36 | 176 | 18.00 | 0.77 |
| 11 | Univ Oxford | England | 36 | 128 | 6.81 | 0.77 |
| Rank | Countries | TP | Authors | I | TMPC | TMAC | TMIC | TC | TSS | |||||||
|---|---|---|---|---|---|---|---|---|---|---|---|---|---|---|---|---|
| X | S | X | S | X | S | X | S | X | S | X | S | X | S | |||
| 1 | USA | 963 | 4.21 | 9 | 1.44 | 21 | 3.78 | 18 | 3.22 | 19 | 3.42 | 33 | 4.78 | 3300 | 3.67 | 24.52 |
| 2 | China | 649 | 2.83 | 45 | 5.11 | 18 | 3.27 | 7 | 1.41 | 12 | 2.25 | 7 | 1.34 | 2208 | 2.46 | 18.67 |
| 3 | UK | 529 | 2.30 | 7 | 1.23 | 11 | 2.08 | 20 | 3.55 | 16 | 2.92 | 14 | 2.26 | 2690 | 2.99 | 17.34 |
| 4 | Netherland | 200 | 0.86 | 4 | 0.93 | 3 | 0.71 | 15 | 2.73 | 0 | 0.24 | 7 | 1.34 | 1817 | 2.03 | 8.83 |
| 5 | Australia | 275 | 1.19 | 4 | 0.93 | 9 | 1.73 | 3 | 0.75 | 5 | 1.08 | 3 | 0.81 | 992 | 1.12 | 7.61 |
| 6 | Norway | 94 | 0.39 | 2 | 0.72 | 2 | 0.54 | 7 | 1.41 | 14 | 2.58 | 1 | 0.54 | 632 | 0.73 | 6.92 |
| 7 | Germany | 296 | 1.28 | 2 | 0.72 | 5 | 1.05 | 3 | 0.75 | 1 | 0.41 | 7 | 1.34 | 993 | 1.12 | 6.68 |
| 8 | Brazil | 130 | 0.55 | 7 | 1.23 | 4 | 0.88 | 1 | 0.42 | 6 | 1.24 | 3 | 0.81 | 409 | 0.48 | 5.62 |
| 9 | Japan | 189 | 0.81 | 3 | 0.83 | 6 | 1.22 | 3 | 0.75 | 0 | 0.24 | 2 | 0.68 | 900 | 1.02 | 5.55 |
| 10 | Canada | 170 | 0.73 | 2 | 0.72 | 3 | 0.71 | 1 | 0.42 | 7 | 1.41 | 2 | 0.68 | 550 | 0.64 | 5.31 |
| Cluster # | Label | Main Research Content | Representative Literature |
|---|---|---|---|
| 0 | Consumption | Biofuel consumption, electricity consumption, consumption patterns and energy intensity | [42,43] |
| 1 | GHG emission | Energy saving in refrigerators, gasoline prices and taxes, household energy use | [44,45] |
| 2 | China | Household energy consumption, rural residents | [46,47] |
| 3 | Consumption | Residents’ health, food consumption | [48,49] |
| 4 | Validation | Healthy diet | [50,51] |
| 5 | India | Population, direct and indirect energy consumption | [9,52] |
| 6 | Logistics | Power consumption | [53] |
| 7 | Sustainable development | Sustainable development, low-carbon economy, rural Emission reduction, regional development | [54,55] |
| 8 | Room air condition | Residential building, life cycle | [56,57] |
| 9 | Development | Economic development, energy demand | [58,59] |
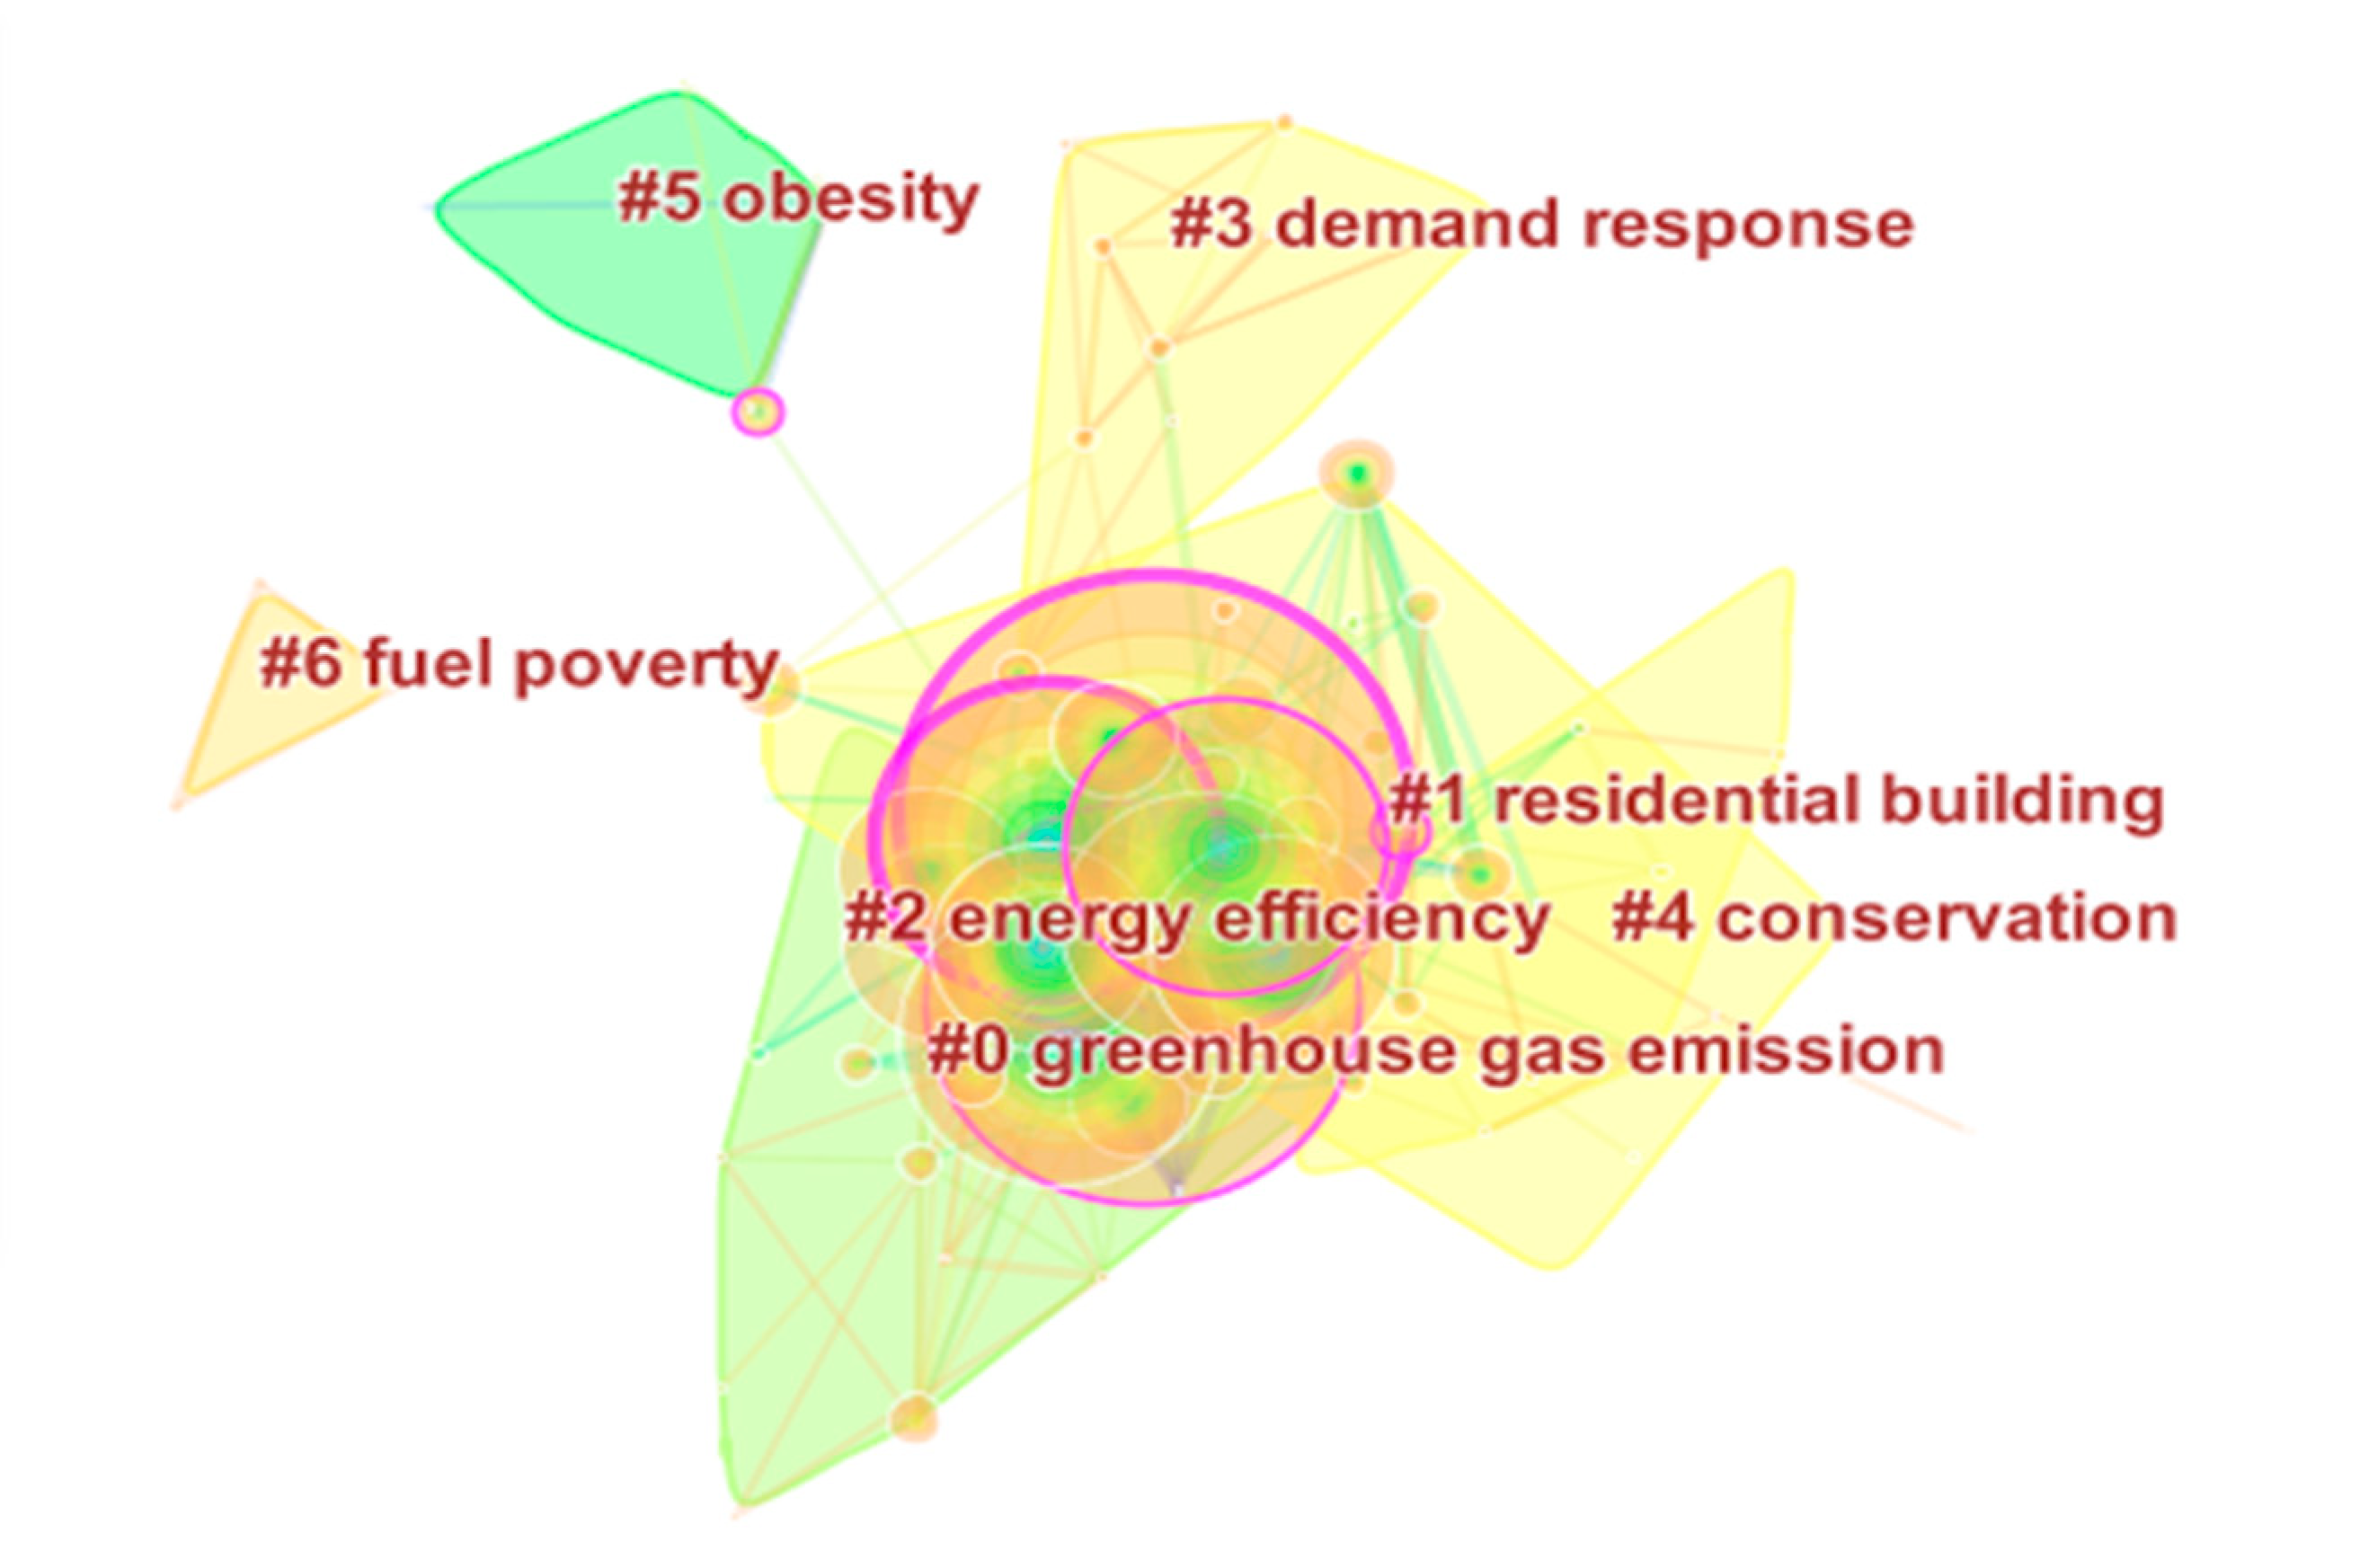
| Cluster # | Label | Main Research Content | Representative Literature |
|---|---|---|---|
| 0 | GHG emission | Natural gas, electricity consumption, household income | [11,60] |
| 1 | Residential building | Household income, GHG, energy consumption patterns | [61,62] |
| 2 | Energy efficiency | Rebound effect, residential behavior, energy supply and demand | [63] |
| 3 | Demand response | Home energy management, household behavior | [64,65] |
| 4 | Conservation | Home energy saving, environmental protection | [66,67] |
| 5 | Obesity | Healthy diet | [68,69] |
| 6 | Fuel poverty | Energy supply and demand, energy poverty | [70] |
© 2019 by the authors. Licensee MDPI, Basel, Switzerland. This article is an open access article distributed under the terms and conditions of the Creative Commons Attribution (CC BY) license (http://creativecommons.org/licenses/by/4.0/).
Share and Cite
Ma, X.; Wang, M.; Li, C. A Summary on Research of Household Energy Consumption: A Bibliometric Analysis. Sustainability 2020, 12, 316. https://doi.org/10.3390/su12010316
Ma X, Wang M, Li C. A Summary on Research of Household Energy Consumption: A Bibliometric Analysis. Sustainability. 2020; 12(1):316. https://doi.org/10.3390/su12010316
Chicago/Turabian StyleMa, Xiaowei, Mei Wang, and Chuandong Li. 2020. "A Summary on Research of Household Energy Consumption: A Bibliometric Analysis" Sustainability 12, no. 1: 316. https://doi.org/10.3390/su12010316
APA StyleMa, X., Wang, M., & Li, C. (2020). A Summary on Research of Household Energy Consumption: A Bibliometric Analysis. Sustainability, 12(1), 316. https://doi.org/10.3390/su12010316