1. Introduction
Urbanization is accompanied by the rapid development of both the surface and subsurface of urban areas and impacts the environment in various ways. Rapid urbanization and expanding land usage have increased damage to subsurface infrastructures such as sewer and water pipelines, which results in pipeline leakage. The increasing leakage from sewer and water pipelines and ground collapse in urban areas due to excavation, pipe aging, underground construction [
1], and tree root growth has resulted in damaging the underground infrastructures and water pipelines and hence causing leakage, which results in ground subsidence and sinkholes. The different types of tunneling methods that have been adopted for the construction of various underground subways in urban areas have a huge impact on the nearby utilities such as sewer and water pipelines [
2]. A sinkhole is a cavity in the ground that is formed by underground erosion and depression of the ground surface. There are two types of sinkholes: natural and manmade. Manmade sinkholes are associated with leakage from sewer and water pipelines and soil erosion.
Manmade sinkholes due to water leakage from underground sewer and/or water pipelines have become a critical concern of water management authorities in both developed and developing countries around the world. According to Kang et al. (2017) [
3], most manmade sinkholes or ground subsidence result from leaking underground sewer pipelines. Due to rapidly increasing cases and reports in metropolises and cities, sinkholes have become recognized as a primary hazard that can cause massive infrastructure and financial losses to society [
4]. Sinkholes can occur very suddenly and lead to extensive damage, especially in urban areas. From 2006 to 2010, the Florida Office of Insurance Regulation in the USA registered over 24,671 cases of sinkholes that caused financial damage of around 1.4 billion USD [
5]. Factors such as groundwater extraction, construction in adjoining areas, and leakage from underground pipelines are the driving causes of sinkholes in urban areas [
6]. The size of a sinkhole can range from 2 m deep and 1.5 m wide [
7] to enormous scales of up to 15 m deep and 30 m wide [
8], as reported in Jeju, South Korea, and southwest Japan. In the USA, manmade sinkholes have been reported in San Antonio, Texas, [
9], Oakwood, Georgia, and Tracer, Colorado [
10]. These incident have caused immense economic damage while also claiming human lives.
Some of the most complex civil engineering problems stemming from the interaction between water and soil are sinkholes and ground subsidence. Sinkholes induced by leaking underground pipelines have become a significant challenge that needs to be intensively studied. Previous research has concentrated on natural sinkholes and primarily observed regions with large deposits of salt, limestone, and carbonate rocks. Accurately predicting the sinkhole location and time of occurrence is rather difficult [
11]. As urban areas grow, they increasingly require buried pipeline systems to supply water and provide drainage. These issues further exacerbate the infrastructure and environmental conditions that underpin human socioeconomic activities. Applying a monitoring method (e.g., conventional or wireless sensor networks) along the pipeline network of a metropolitan city can be costly, energy-intensive, time-consuming, and complicated. Hence, it is essential to predict the areas with a high risk of sinkholes and ground subsidence first and to monitor these high-risk areas to save time, energy, and money.
Natural and manmade sinkholes cannot be directly detected. The development of a sinkhole risk index (SRI) or sinkhole risk prediction should help correlate the leakage from pipelines with sinkhole detection. Researchers have considered developing an SRI to determine risk elements for sinkhole occurrence and ground subsidence [
12]. For a long time, researchers have been working on hazard and risk assessment of sinkhole formation, especially natural sinkholes.
Table 1 presents the research contributions to sinkhole risk assessment for natural and manmade sinkholes and their limitations. According to
Table 1, four out of eight contributions are related to manmade sinkholes. Only four research contributions [
12,
13,
14,
15] focused on predicting the risk of manmade sinkhole formation. Two contributions [
12,
13] concentrated only on manmade sinkholes due to leakage from underground sewer and water pipelines. In most previous research, authors only focused on karstic soil profiles (i.e., soil profiles with carbonate rock and limestone). This indicates that less work has been done on the risk prediction of manmade sinkholes (due to leakage in underground water pipelines), as presented in
Table 1.
Among those two contributions [
12,
13], the authors in [
12] only considered the deflection of water pipelines after leakage as a factor for sinkhole risk prediction. Other than that, this study [
12] is just limited to soil profiles with karstic soil profiles. Kwak et al. (2015) [
13] contributed toward the risk assessment of sinkholes due to leakage from underground sewer or water pipelines; however, their risk assessment model is still under development.
Ali and Choi (2019) [
18] showed that many methods such as the application of aquatic sensors, vibration sensors, GIS, robotic devices, thermal images, and conventional methods are available for sewer pipeline inspection. However, little research has focused on addressing sinkholes due to leakage from underground pipelines. Thus, more research is needed on the risk assessment and prediction of manmade sinkholes, more specifically manmade sinkholes, due to leakage in underground water pipelines [
18]. The above literature review showed that one of the main factors accelerating sinkhole or ground subsidence is the soil strata beneath the leakage point [
15]. Other factors includes the type of flow of water inside the pipeline and the location of the leakage. These factors can potentially be used as indicators for the risk level of a sinkhole due to leakage [
12]. The subsurface soil profile varies with the area and is characterized by its unique geomorphology and hydrology [
16]. The effect of water leaking from a sewer or water pipeline on surrounding soil differs according to the subsurface soil profile.
The objectives and outcomes of previous relevant sinkhole models and experimental studies are presented in
Table 2. These models have been mainly developed for naturally occurring sinkholes. In addition, each research group focused on one type of soil profile, and no study considered the effect of the type of water flow or the leakage position on the sinkhole occurrence. On the basis of the literature review, the authors in this study came to know that no research considered manmade sinkhole, and subsurface soil profile, type of water flow, and leakage position in the pipeline as the factors affecting the sinkhole due to leakage in underground pipelines. Hence, in this study, the authors considered all these factors to study and understand the mechanism of manmade sinkhole because of leakage in underground pipelines in different types of subsurface soil profiles.
The aim of this study was to evaluate and predict the risk level of sinkhole occurrence under different subsurface soil conditions after leakage from underground water pipelines. The behavior (failure) of soil surrounding the leaking pipeline was dependent on the type of soil profile and the type of flow inside the pipeline. Various soil profiles were used in laboratory experiments to simulate diverse geological subsurface conditions such as soil profile with a cavity or a soil profile having lime stone or carbonate rocks. Thirteen scaled physical models were developed for experiments to understand the effects, risk, and mechanism of sinkhole occurrence due to leakage from underground water pipelines. The risk level in each scenario was predicted on the basis of settlement in each case, and a soil profile having lime stone and carbonate rocks with a non-continuous flow in pipeline was found to the most risky. A system was designed to measure the settlement rate over time under various conditions for the subsurface soil, water flow, and leakage position. The results should help with predicting potential high-risk zones in urban areas based on dynamic changes in critical factors such as the type of subsurface soil, type of water flow inside a pipeline, and leakage location on pipeline.
2. Experimental Method
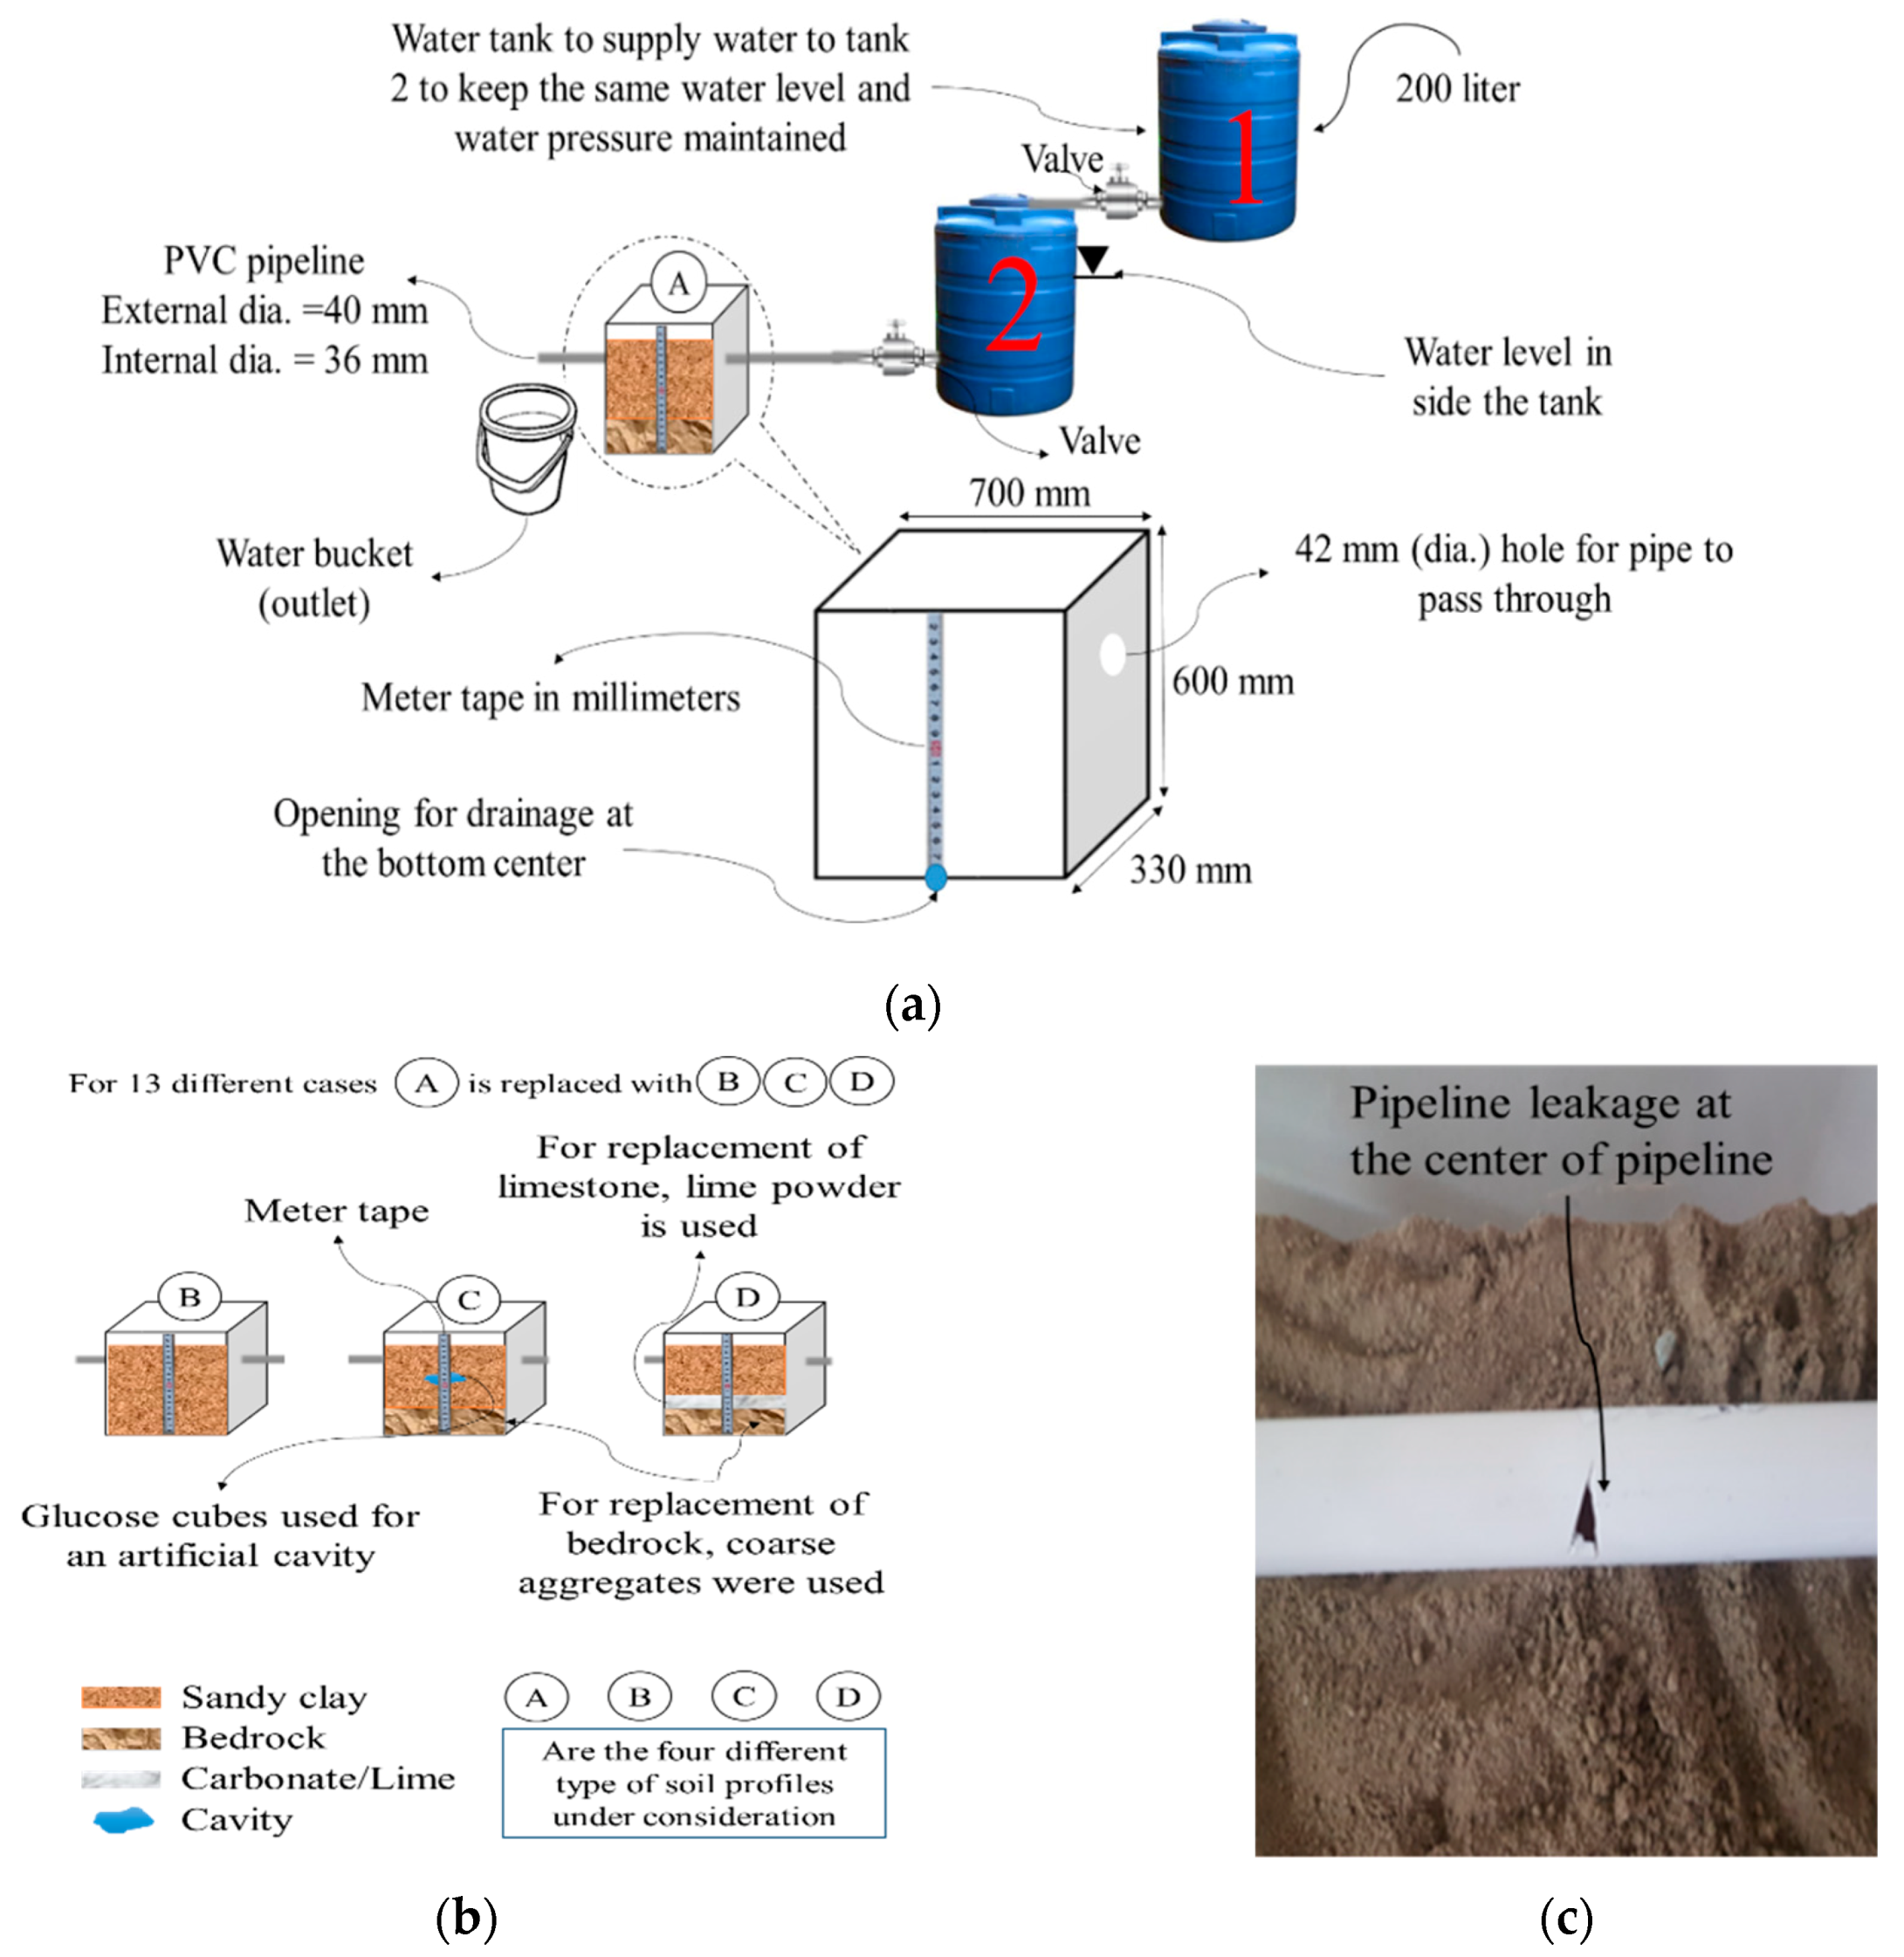
The first stage of the experiment was to design the architecture in the laboratory. The overall architecture of the experimental setup is shown in
Figure 1a. Water was supplied to the system from a water tank (Tank 2) with a capacity of 227 liters. The water passing through the pipeline was collected at the other end (outlet). The collected water at the outlet lets the authors know about the quantity of water, which is seeped into the model box through the leakage. In total, 200 liters of water were inside the water tank for each case. The pressure of the water flow declines steadily with the water level inside the water tank (inlet), so another water tank (Tank 1) was used to maintain the water level in Tank 2 to control the drop in water pressure, as shown in
Figure 1a. A solenoid valve was fixed at the bottom of each water tank to manually control the flow of water inside the pipeline. A PVC (Polyvinyl Chloride) pipeline with an external diameter of 40 mm and internal diameter of 36 mm was used. Artificial leakage was created by making a hole in the pipeline, as shown in
Figure 1c. The model box used for the experiment had dimensions of 700 mm (width) × 600 mm (length) × 330 mm (height) with a hole at the center of the bottom for drainage. The different subsurface soil profiles considered in this study comprised bedrock, carbonate rock, cavities, sand, and clay.
Four soil profiles were considered: sandy clay (SC), sandy clay–bedrock (SC-BR), sandy clay–cavity–bedrock (SC-C-BR), and sandy clay–limestone–bedrock (SC-LS-BR). In addition, two water flows in the pipeline were considered: continuous and cyclic. The materials adopted for the 13 different soil profile models in the laboratory included sandy clay, limestone, sugar cubes, and gravel. Coarse aggregate (gravel) was used to represent bedrock, limestone powder was used to represent limestone, and sugar cubes were used to represent artificial cavities as shown in
Figure 1b. In
Figure 1a,b, the four different soil profiles under consideration in this study are represented as A, B, C, and D. In each of the 13 cases, the soil was compacted in two layers that were each 160 mm in thickness. The soil was compacted manually with a brick having dimensions of 20 cm × 6.3 cm × 5 cm, and 20 vertical blows were used for each case. To measure the settlement in each case, a meter tape was attached vertically to the center of each model box, and the reading was recorded in millimeters (see
Figure 1a). A camera was used to capture images of the experiment at the beginning and end of each case.
The physical and mechanical properties of sandy clay used in this experiment are presented in
Table 3.
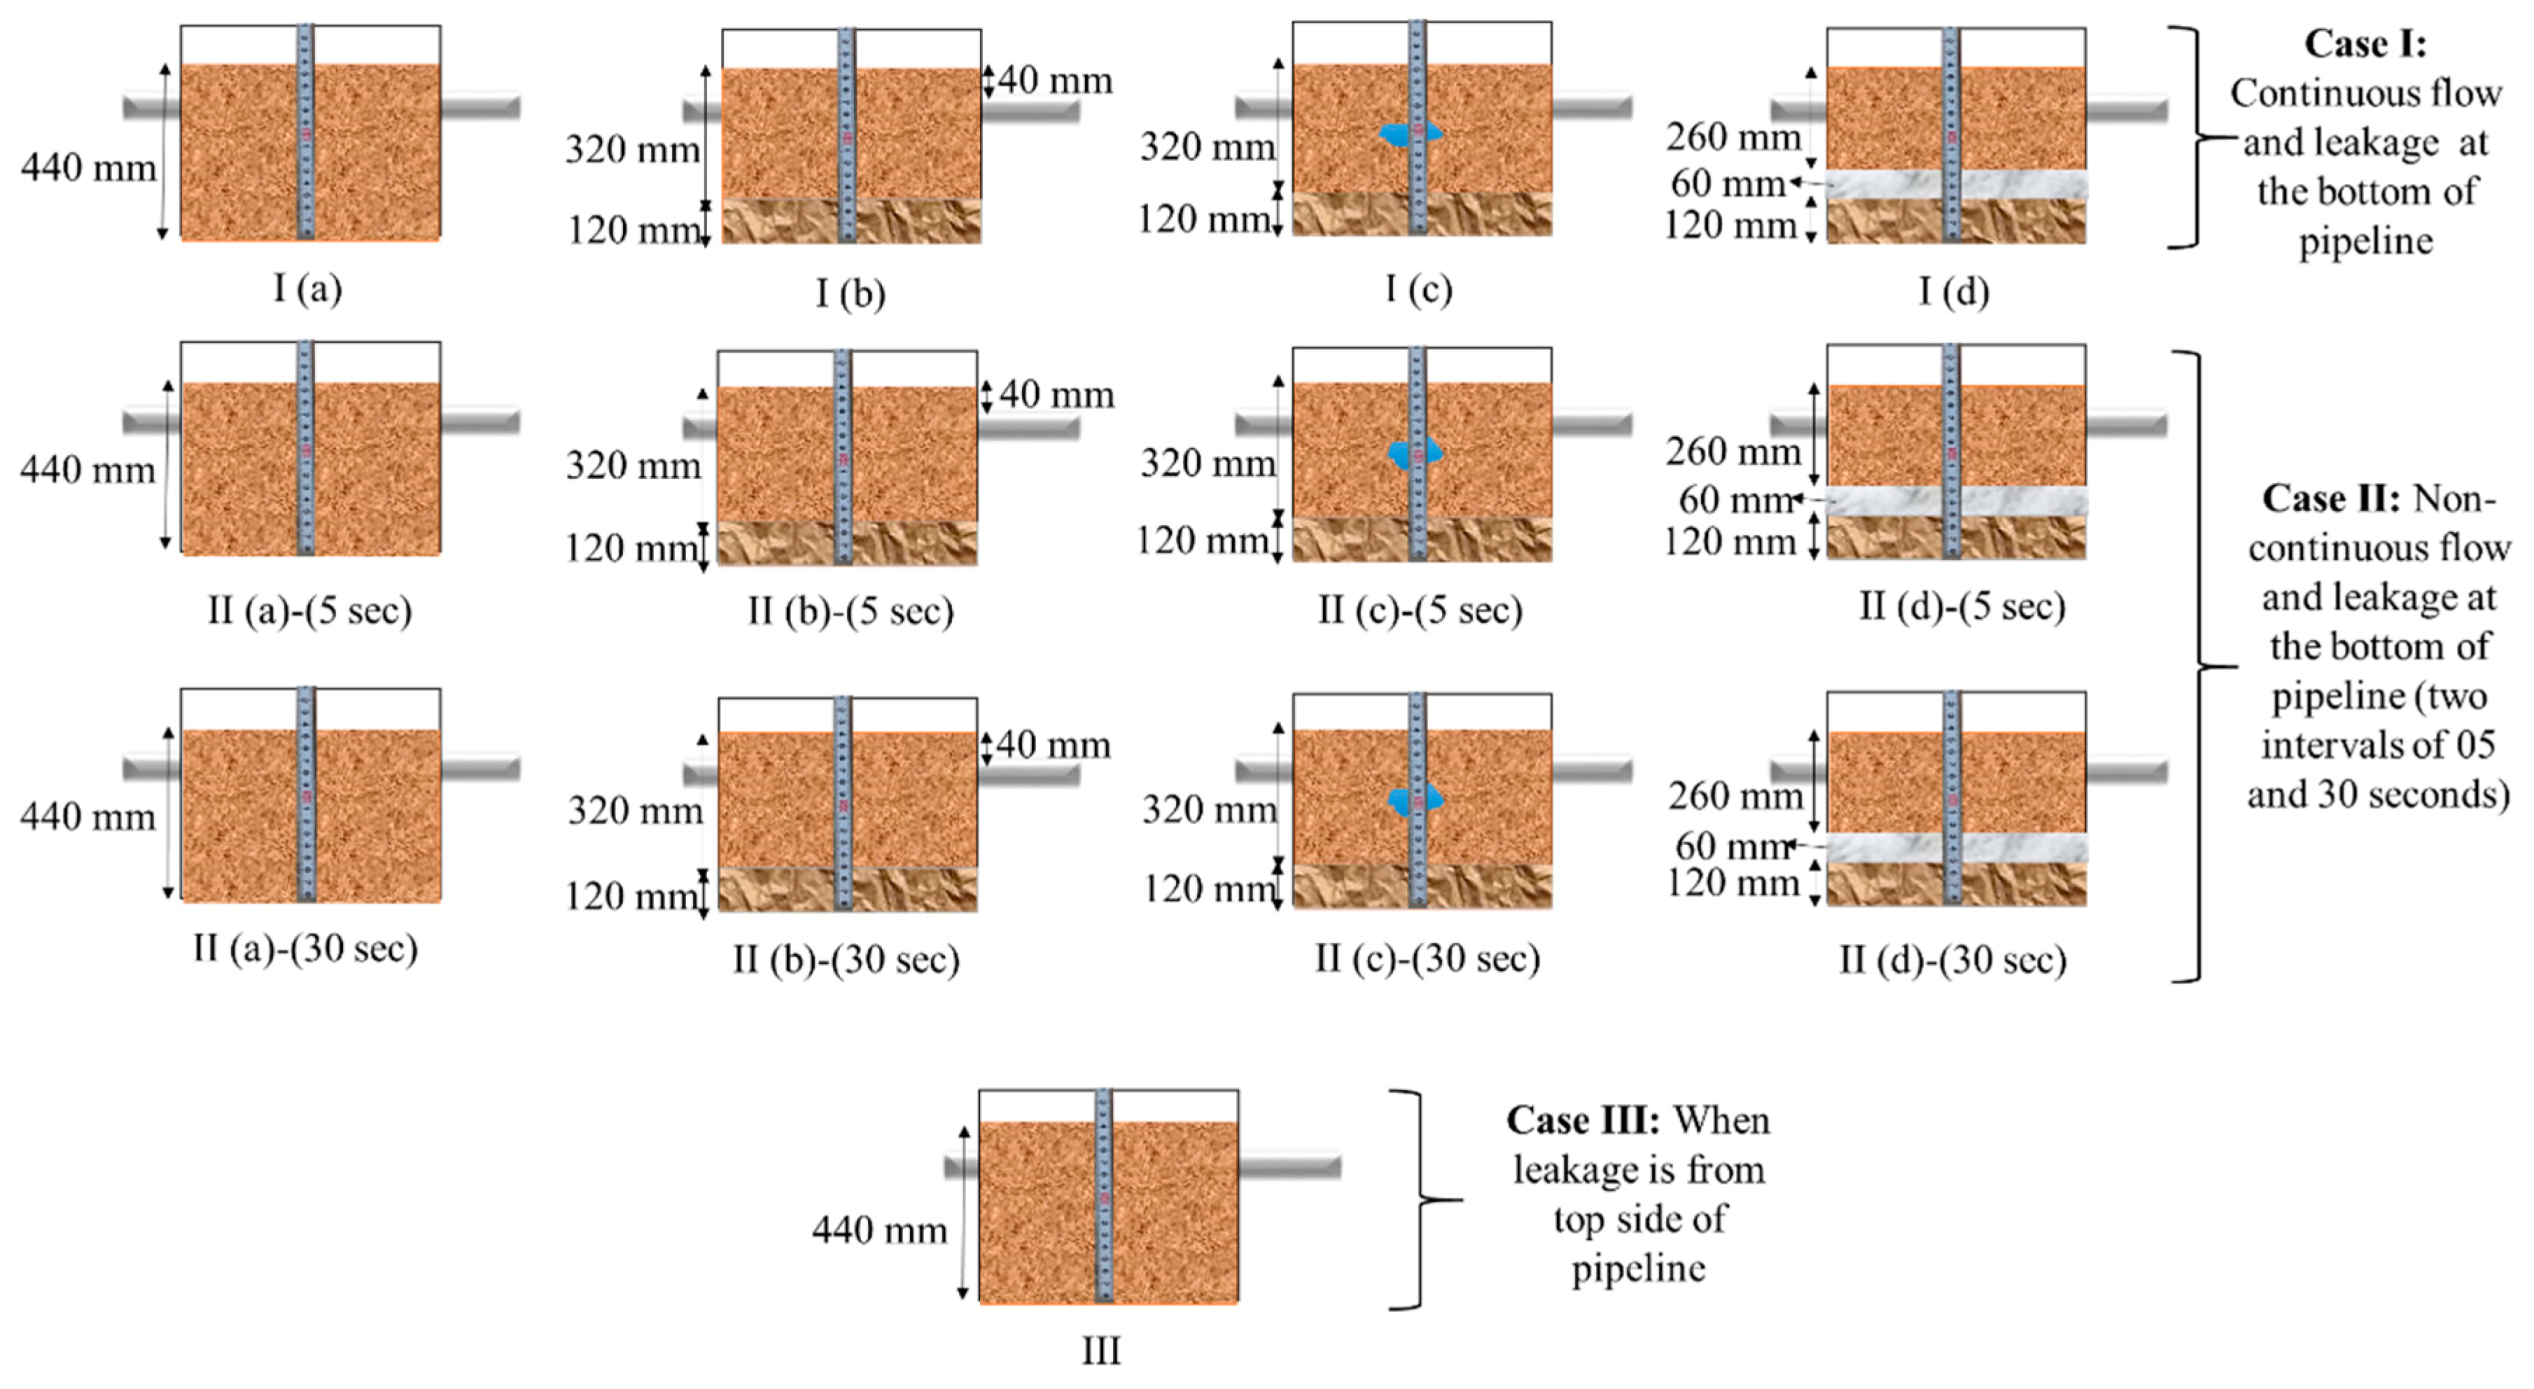
The 13 subsurface soil profiles considered in this laboratory experiment were organized into three different cases based on the type of water flow and location of leakage in the pipeline. Case I comprised four different subsurface soil profiles. The flow inside the pipeline was continuous, and the leakage in the pipeline was from the bottom side of the pipeline, which was in contact with the flowing water. Case II used the same soil profiles and leakage position as Case I, but the flow of water inside the pipeline was cyclic. In this case, each of the four soil profiles was tested separately for two different cyclic flows: a time interval of 5 s and a time interval of 30 s. In both scenarios, the cyclic flow was controlled by manually closing and opening the valve for the given time interval. In Case III, the flow of water was continuous, and the leakage was at the top of the pipeline, which was not in contact with the water flow. In this case, only one soil profile was considered, because only the soil above the pipeline would influence the occurrence of a sinkhole when the pipeline is leaking from the top. All three cases described previously are illustrated in
Figure 2.
In this study, the two types of flow of water inside a water pipeline were adopted by considering the real scenarios. As in real scenarios, the water pipelines may have continuous or cyclic flow inside a pipeline; either it is water or sewer pipeline. Karoui et al. (2018) [
25] also showed that the ground subsidence is more rapid for cyclic flow compared to continuous flow. The authors in [
25] performed physical modeling of a sewer pipe defect in a silica sand model box in a laboratory to understand the sinkhole mechanism and the effect of water. Similarly, when real scenarios are considered, the leakage position in a water pipeline can be either at the top (the surface of pipeline that is not in contact with water) or at the bottom (the surface of the pipeline that is in contact with water) of a water pipeline. Hence, the authors considered two different types of flows of water inside a water pipeline and leakage locations on a water pipeline.
During the experiments, the flow of water (i.e., cyclic or continuous) was controlled manually by a solenoid valve fixed at the bottom of each water tank. For the laboratory experiments, the huge volumes of the sewer pipeline and water inside the pipeline would not allow the use of the sewer pipeline and water inside the pipeline for indoor laboratory experiments. Instead, a PVC pipeline and tap water were used throughout the experiments. The internal friction of the pipeline was neglected because of the smooth internal surface of the PVC pipeline and smaller distance between the leakage point and water inlet. The artificial leakage in the pipeline was created by making a hole, as shown in
Figure 1b. Then, the pipeline was passed through the model box and buried in the soil.
For each case, the surface settlement or occurrence of a sinkhole was observed visually for around 30 min. The complete experimental setup is shown in
Figure 1, and all the cases considered in this study are shown in
Figure 2. The objective of the experiments was to develop an understanding of the phenomena that occur when a sinkhole is created by the failure of an underground water pipeline.
2.1. Case I: Different Subsurface Soil Profiles with Continuous Flow and Leakage from the Bottom of the Pipeline
In Case I, the leakage was at the bottom of the pipeline (i.e., in contact with water), and the water flow inside the pipeline was continuous. Hence, the water leaking from the pipeline was also continuous. Water flowed continuously through the pipeline for 30 min at a constant pressure, and the settlement was recorded each minute. The four soil profiles used are listed below:
Case I(a): SC
Case I(b): SC-BR
Case I(c): SC-C-BR
Case I(d): SC-LS-BR
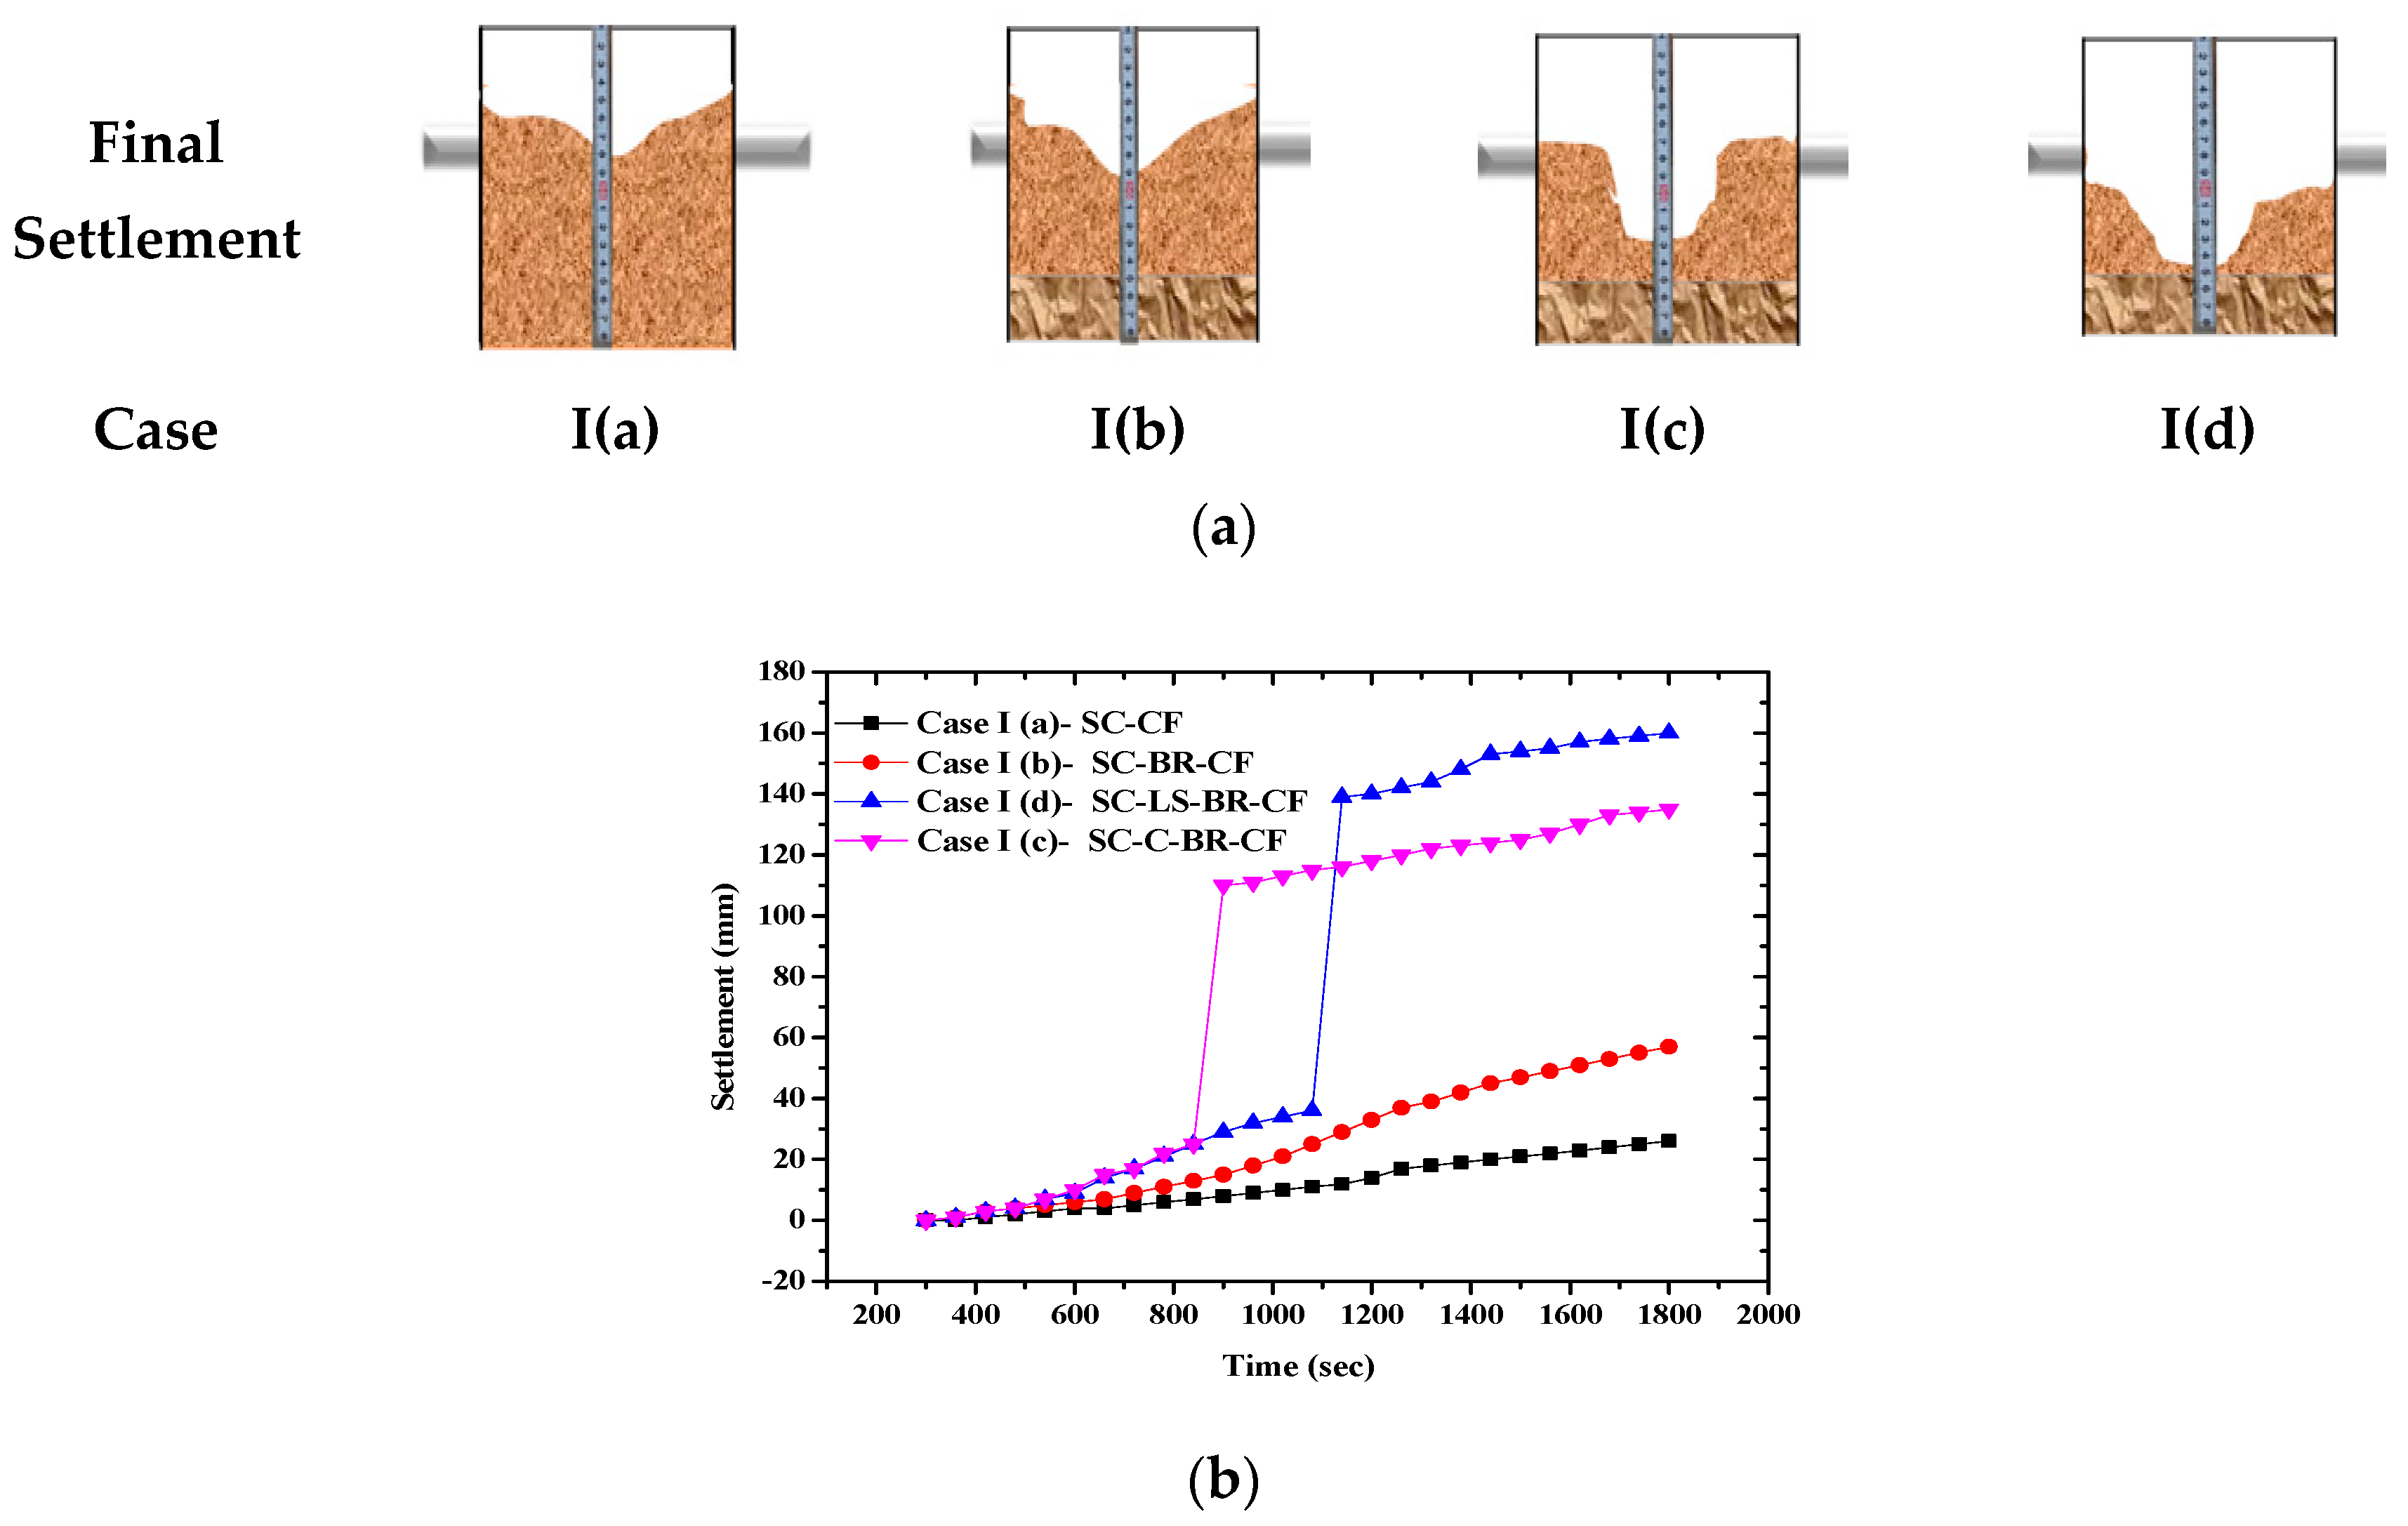
For Case I(a), the pipeline leaking from the bottom passed through the SC soil profile. The maximum settlement was 26 mm at 30 min. For Case I(b), the leaking pipeline passed through the model box with the SC-BR soil profile. The bedrock layer at the bottom of the model box was 120 mm thick, and the top layer of sandy clay was 450 mm thick, as shown in
Figure 2. The maximum settlement was recorded at the center and was 57 mm at 30 min. For both Cases I(a) and I(b), the soil in the model box just settled downward.
For Case I(c), the model box had two soil layers with the same thickness as Case I(b). However, it also included a cavity in the soil profile. The artificial cavity was created by placing 1600 mm
3 of sugar cubes at the center of the model box immediately below the leakage position. The sugar cubes dissolved when they encountered water from the leak, which ultimately created a cavity. Afterward, the water flowed through the leaking pipeline for 30 min. The maximum settlement was 135 mm at 30 min. In Case I(d), the soil strata had three layers: a bottom layer of bedrock (120 mm), a top layer of sandy clay (260 mm), and a middle layer of limestone (60 mm). The maximum settlement was 160 mm at the center of the model box. In Cases I(c) and I(d), after some time, the soil profile collapsed and created a sinkhole, as shown in
Figure 3a.
The graphical representation
Figure 3b shows that in Cases I(a) and I(b), there was no collapse; the soil profile simply settled downward with time. In Cases I(c) and I(d), after some time, the soil profile rapidly collapsed to create a sinkhole. These collapses were due to the presence of a cavity and limestone in the soil profile. However, the collapse time and depth of the sinkhole differed for the two soil profiles.
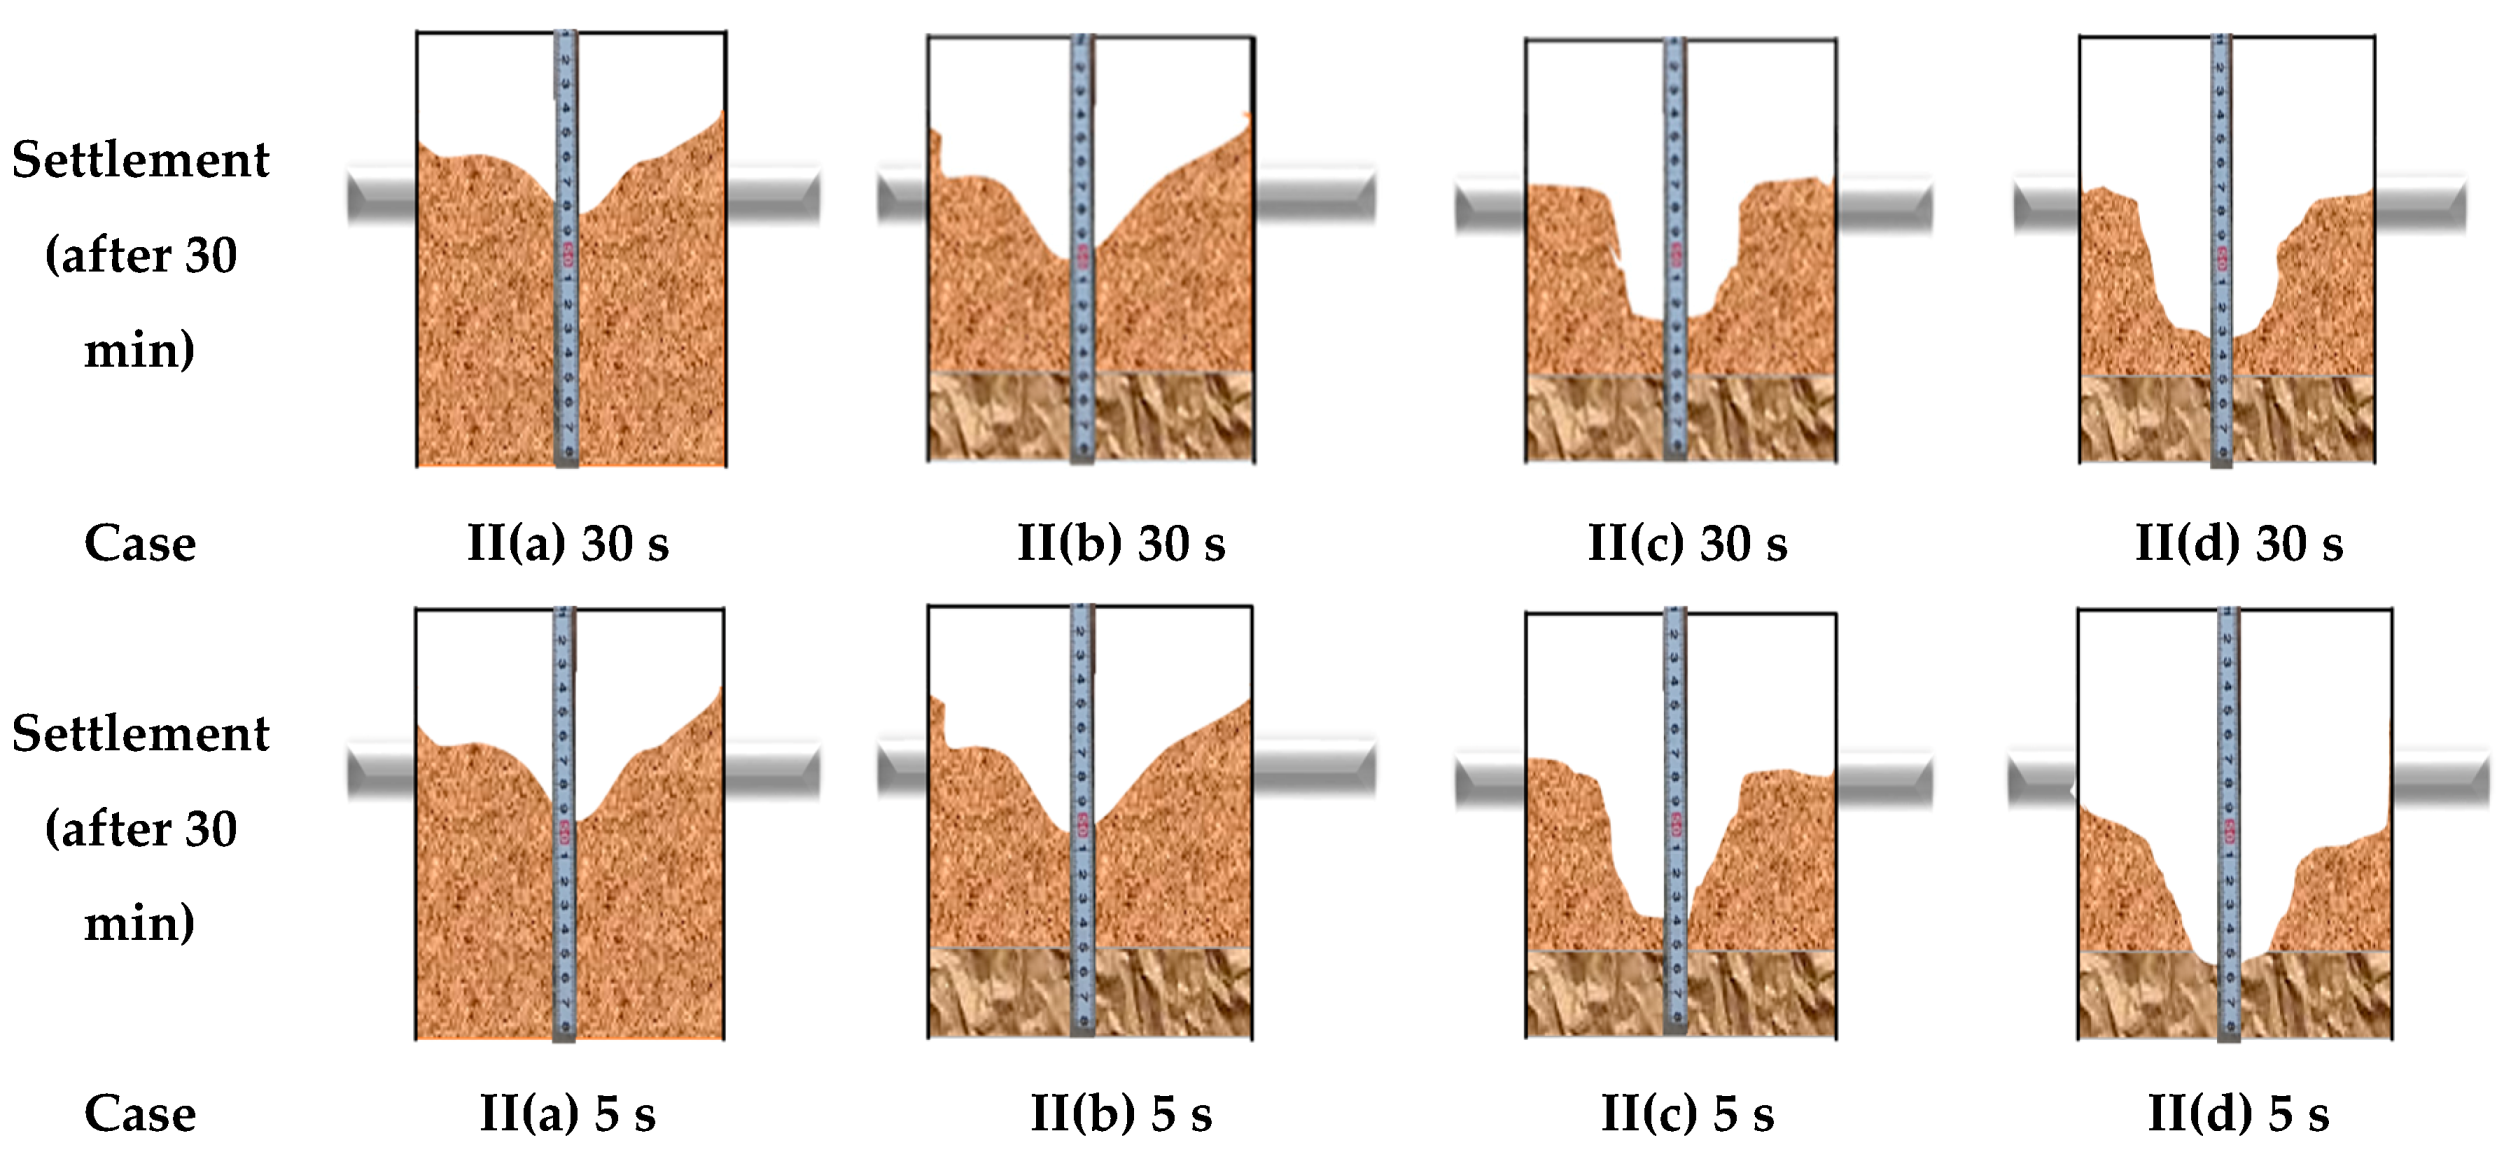
2.2. Case II: Leakage from the Bottom Side of a Sewer Pipeline with Cyclic Flow
In real scenarios, the flow in a sewer pipeline is not always continuous. Thus, cyclic flow was considered in Case II with two different time intervals: 5 and 30 s. The cyclic flow in the pipeline was achieved by manual control of the valve. For the first cyclic flow, the valve was opened and then closed every 5 s. For the second cyclic flow, the valve was opened and then closed every 30 s. The results are shown in
Figure 4. For Case II(a), the two cyclic flows were tested with the SC soil profile to observe the settlement rate. For the 5-s cycle, the maximum settlement was 32 mm; for the 30-s cycle, the maximum settlement was 30 mm. Case II(b) used the SC-BR soil profile; this time, the maximum settlements for the 5-s and 30-s cyclic flow were 66 and 62 mm, respectively. No collapse was noted for either the SC or SC-BR soil profile with the two cyclic flows. Case II(c) used the SC-C-BR soil profile and had maximum settlements of 156 and 150 mm for 5 s and 30 s, and Case II(d) used the SC-LS-BR soil profile and had maximum settlements of 183 and 175 mm for the two cycles, respectively. In Cases II(c) and II(d), both soil profiles collapsed after some time, as shown in
Figure 5.
To further confirm the significance of the results, a paired t-test was carried out on the continuous and cyclic settlement data. The statistical significance of the soil settlement data for the cyclic flow was evaluated with respect to the data for the continuous flow. The outcomes are listed in
Table 4 and show that the data were statistically significant with
p-value less than 0.05 (95% significance) in each case.
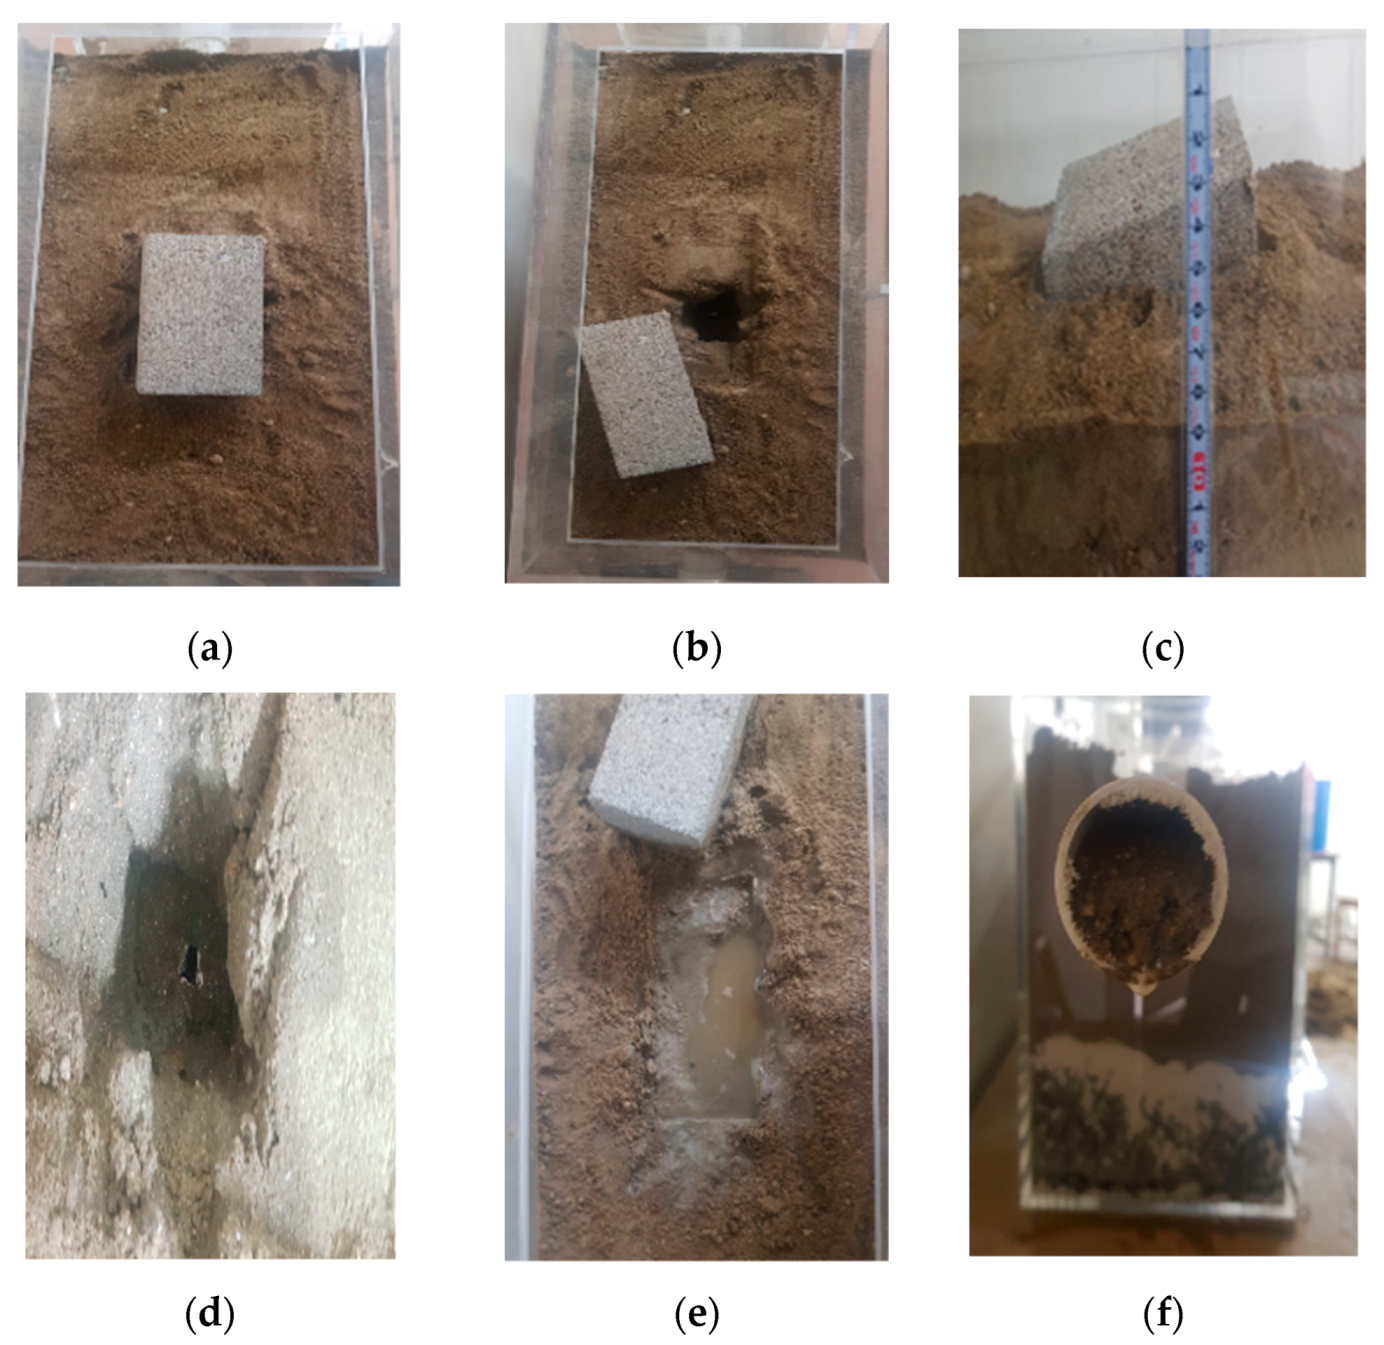
2.3. Case III: Leakage from the Top of the Sewer Pipeline
In Case III, the soil above the PVC pipeline was sandy clay, as shown in
Figure 2. Only the soil above the pipeline influenced sinkhole occurrence or settlement because it sank through the hole in the pipeline.
Hence, only the SC-BR soil profile was considered to assess the impact of leakage from the top.
Figure 6 shows the stepwise effects when leakage was from the top of the pipeline. When water started to flow in the pipeline, initially there was no soil penetration (
Figure 6a). With time the soil above started to penetrate the pipeline over time through the hole (
Figure 6b), which generated a cavity.
Over time, the size of the cavity increased, and the load (brick) above the leakage collapsed downward (
Figure 6c). The condition of the soil collapse is shown in
Figure 6d after removing the load (brick). Then, the pipeline became blocked by the continuous intrusion of soil (
Figure 6f). After the pipeline was blocked, water started to come out from the leakage point where the sinkhole was created (
Figure 6e).
3. Results and Discussion
The experimental results for Case I showed that a pipeline with continuous flow and leaking in the SC and SC-BR soil profiles only caused settlement over time. However, if the soil strata had a cavity or had limestone or carbonate rock present, then the ground would rapidly collapse at a certain point, and a sinkhole would occur.
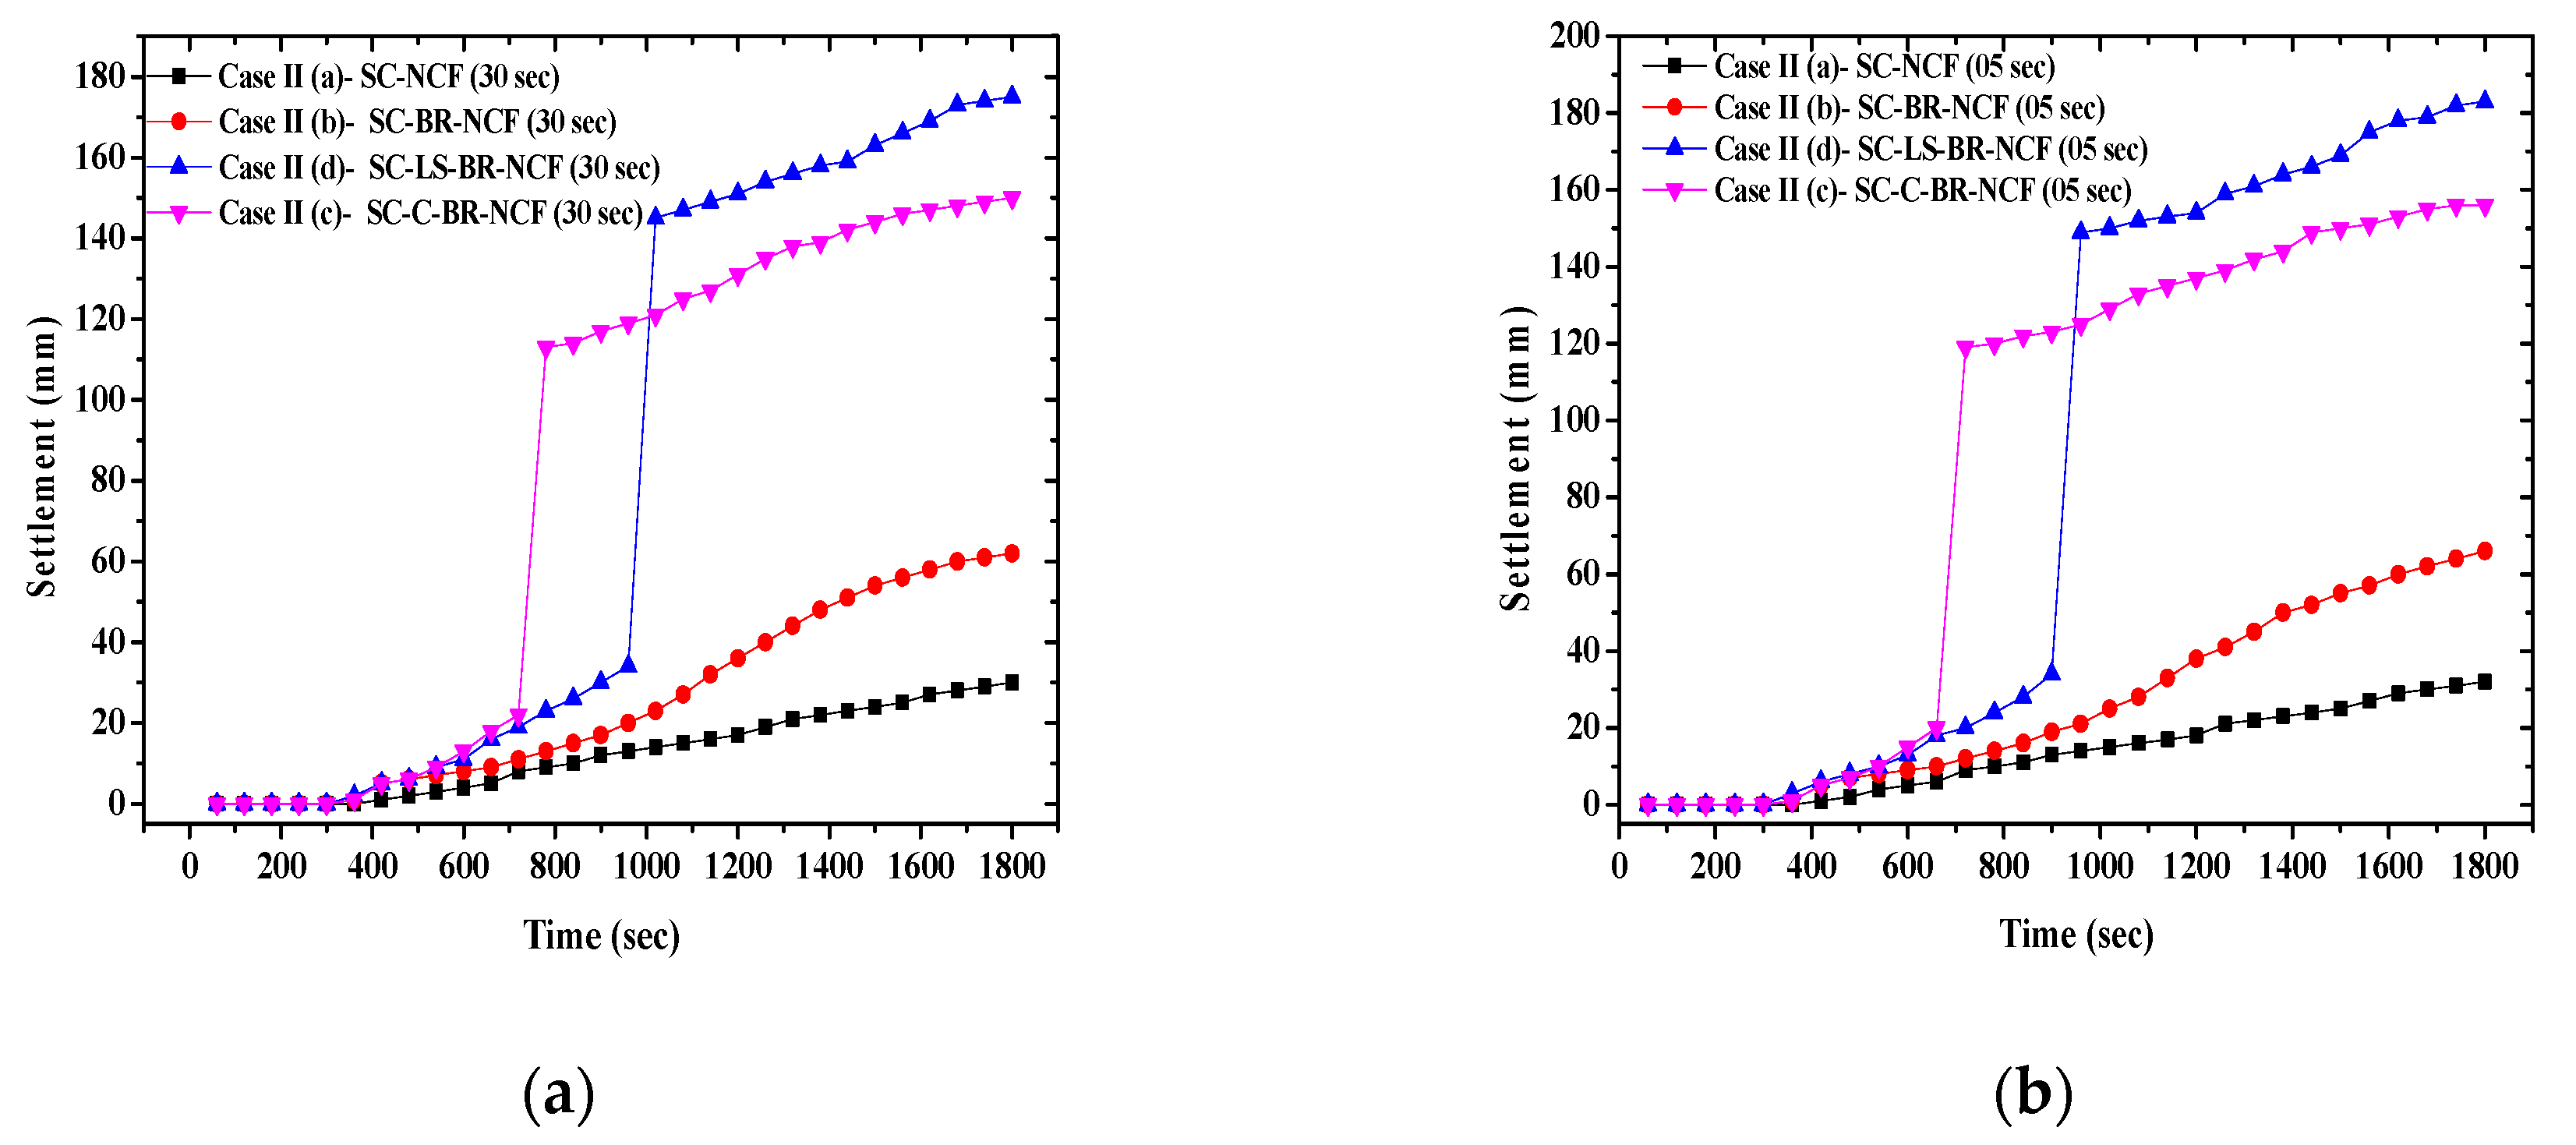
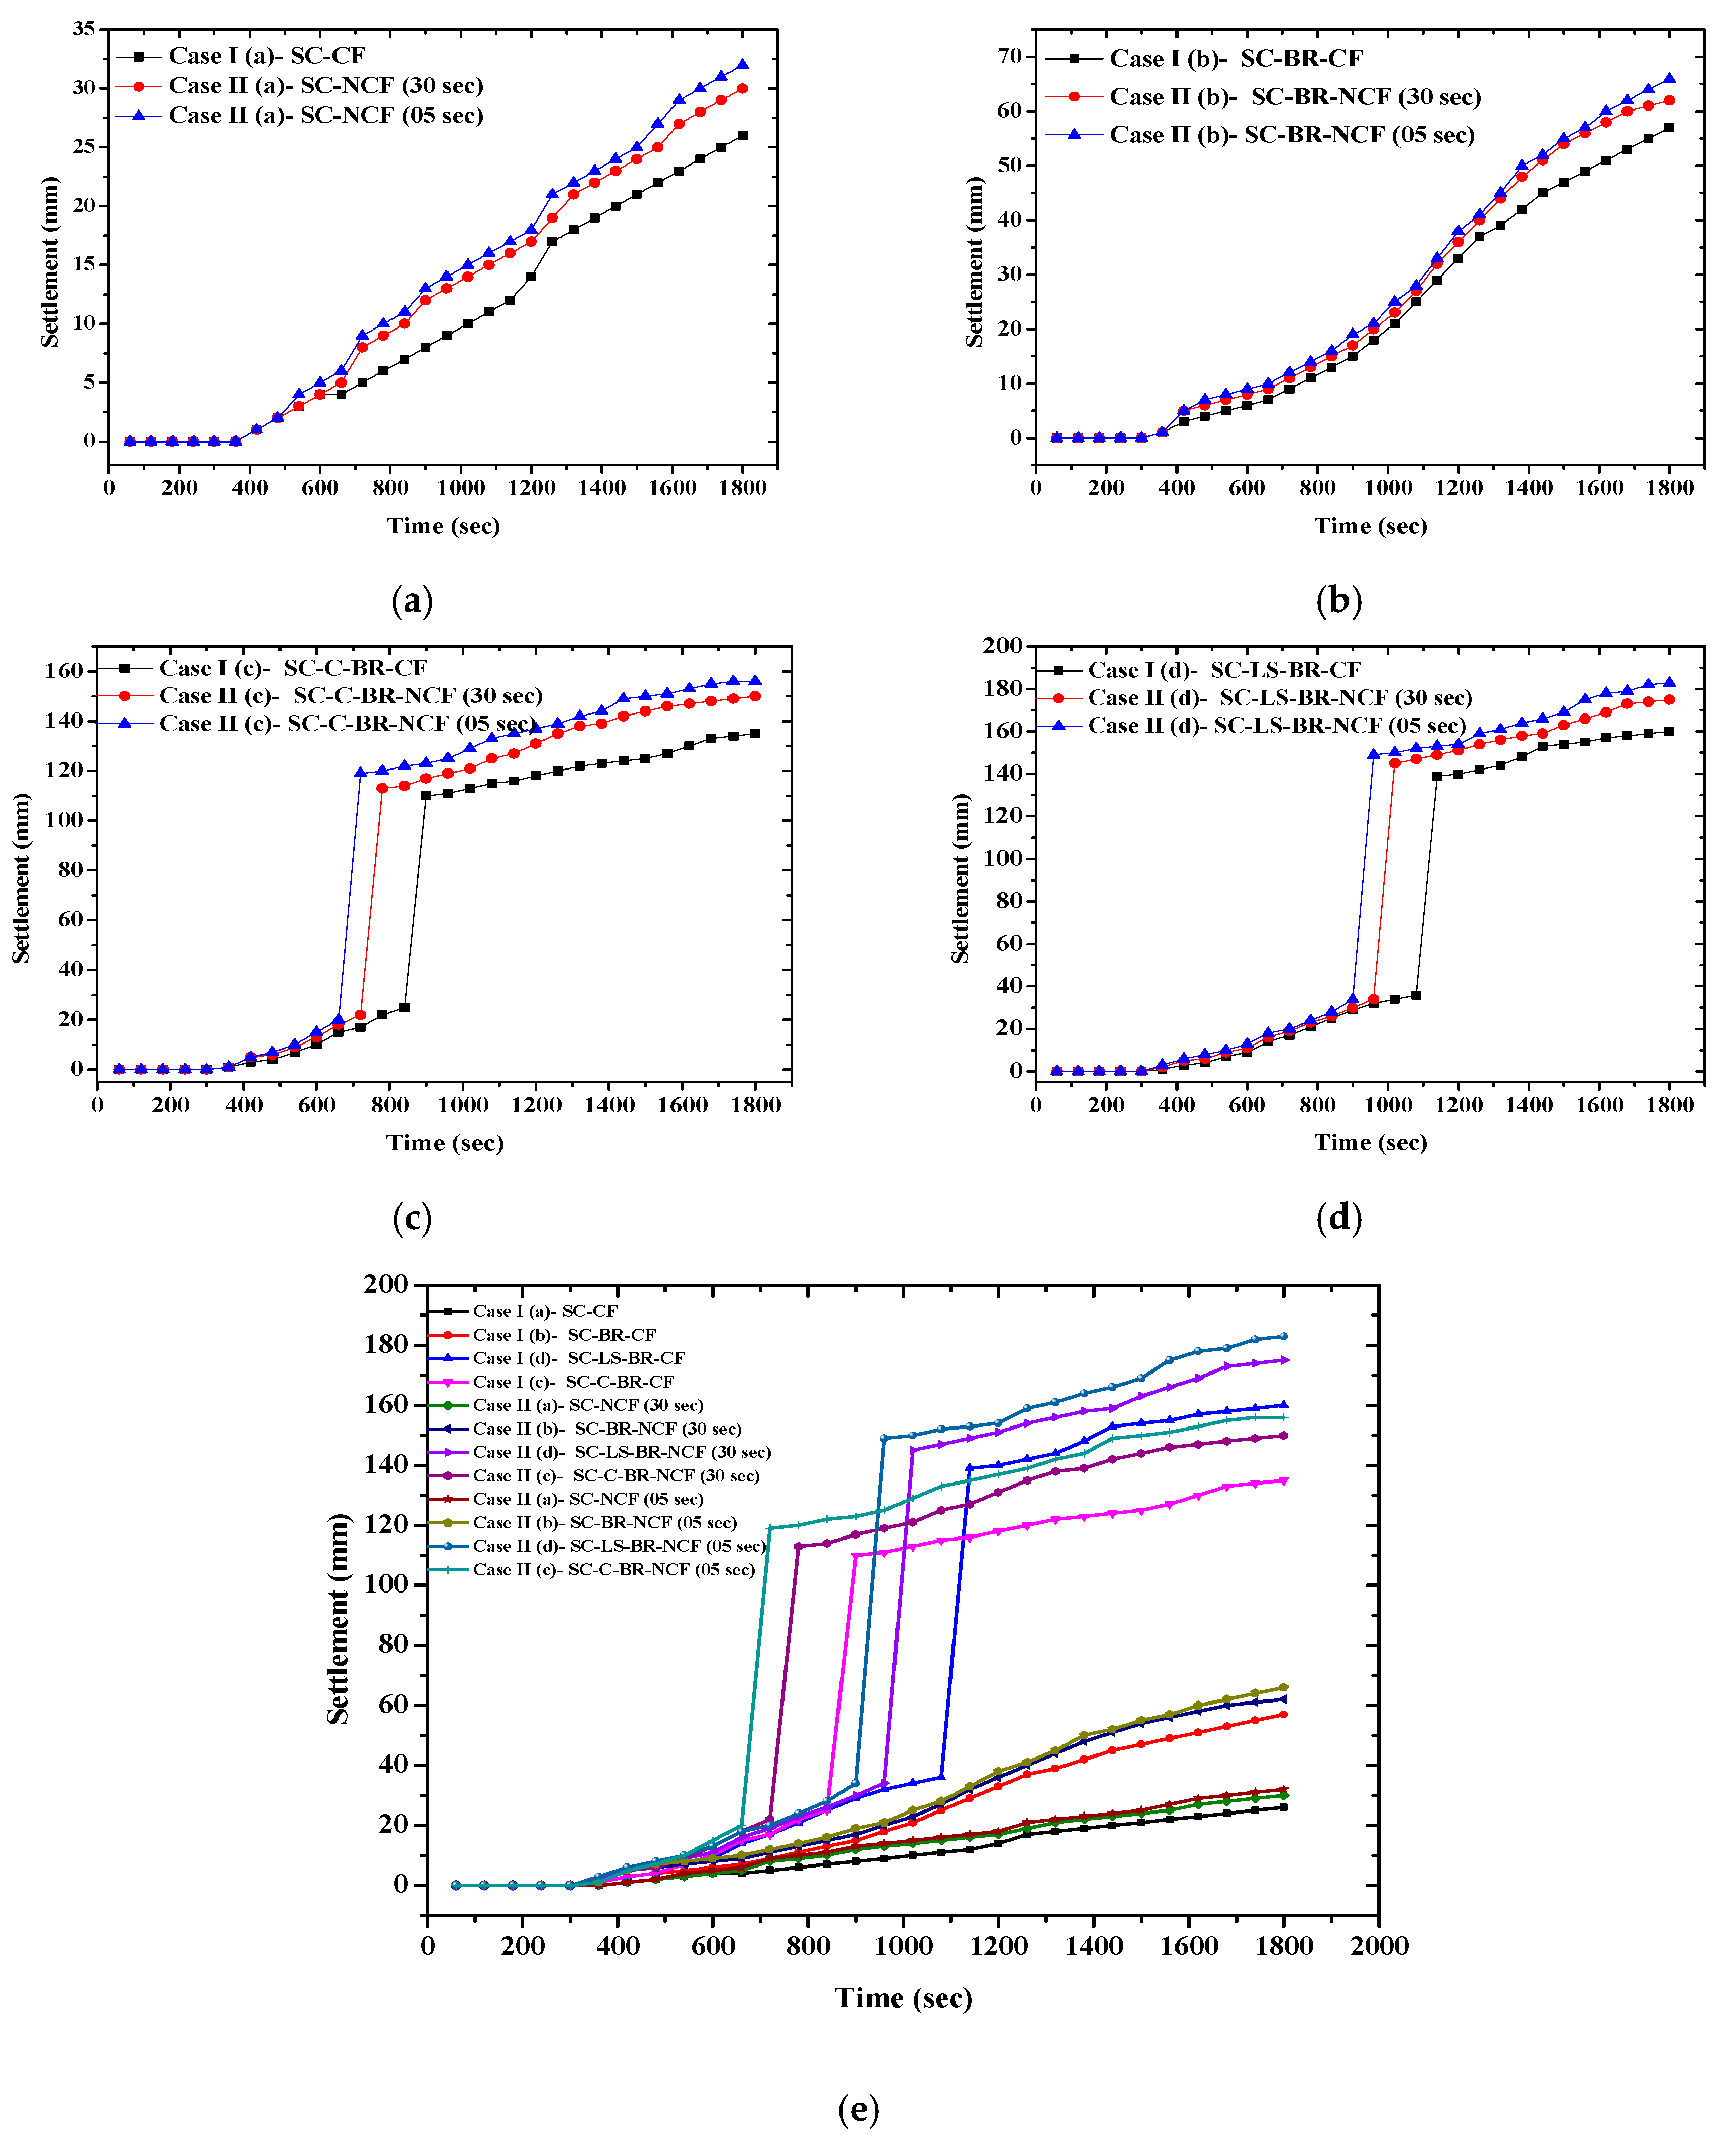
For Case II, the settlement results with the two cyclic flows over time are presented in
Figure 7a–d for each soil profile of SC, SC-BR, SC-C-BR, and SC-LS-BR, respectively. It can be noticed that in each case, the 5-s cyclic flow caused more settlement than the 30-s cyclic flow for each soil profile as illustrated in
Figure 7a–d. The cyclic flows also caused more settlement than the continuous flow for each soil profile.
3.1. Experimental Results
These results show that parameters such as the soil profile and position of the leakage significantly influence the speed of the occurrence of a sinkhole or ground subsidence. Hence, the data showed that cyclic flow in a pipeline is significant for any soil strata. However, the influence of the cyclic flow on sinkhole occurrence is meager compared to the influence of the subsurface soil strata, as illustrated in the combined graph of all cases in
Figure 7e. To clearly demonstrate the relationship between the settlements for all considered soil profiles and water flows, the results for all cases shown in
Figure 7a–d are combined in
Figure 7e. Similarly, for Case III, when the pipeline was leaking from the top, the settlement in the soil profile was noted to be quicker compared to other cases when the pipeline was leaking form the bottom. However, the volume of settlement in Case III was less compared to the previous cases two cases (Cases I and II) when the pipeline was leaking from the bottom.
3.2. Regression Analysis
Three factors were found to influence the settlement for any soil profile with respect to the time: the type of soil strata, type of water flow, and time interval in a cyclic flow. All the mentioned factors are related to the occurrence of a sinkhole and ground settlement due to leakage from underground water or sewer pipelines. The influence of all the considered factors on the settlement in any underground soil profile is analyzed by regression analysis using the R language. A regression model is developed to understand the significance of each factor on the settlement. The variables, type of soil profile (SP), type of flow in the pipeline (FT), the time interval of cyclic flow (TI), and time (t) were considered as independent variables. Settlement (output) is the dependent variable in the model. Each regression coefficient represents the change in settlement relative to a one-unit change in the respective independent variable. Hence from
Table 5, it can be noticed that the variable SP has a highest coefficient value of 25.5, and remaining coefficients have values of 16.1, 0.075, and −0.81, respectively. Hence, the soil strata have a more significant influence than the other factors on sinkhole occurrence. The variables can be listed in order of significance as SP, FT, TI, and t (25.5, 16.1, 0.075, and −0.81) respectively, as shown in
Table 5. The negative value (−0.81) of the coefficient with the variable TI is showing that the time interval in a cyclic flow has an inverse relation with the settlement in any subsurface soil strata after the leakage in an underground sewer or water pipeline. The graphical representation in
Figure 7e also supports the inverse relation shown by regression analysis. As it can be noticed in the
Figure 7e, the settlement for the 5-s time interval is higher compared to the time interval of 30 s. Hence, with the increase in the time interval of a cyclic flow, the settlement rate decreases. Equation (1) elaborates the results of regression analysis and allows us to estimate the association between the dependent variable (settlement) and all the independent variables.
whereas, SP = soil profile, FT = flow type, TI = time interval for cyclic flow (seconds), and t = time (seconds)
The R-square values of the regression analysis are 0.6838 (multiple R-square) and 0.6802 (adjusted R-square). R-square represents the proportion of variance, in the outcome variable settlement, that may be predicted by knowing the value of all the independent variables [
26]. An R-square value close to 1 indicates that the model explains a large portion of the variance in the outcome variable. In this study, considering all 12 cases with all predictor variables, the R-square is equal to 0.6839, meaning that 68.39% of the variance in the settlement can be predicted by considering all variables at the same time. Adding more variables can increase the R-square value, since the R-square variable represents the proportion of variance in the outcome variable [
26]. However, in this study, each variable considered has a more or less significant effect on the output variable. Assessing the
p-values in the regression model suggests that all the independent variables considered in this study are statistically significant. Hence, this model can be used as a significant regression model even with a small R-square value of 0.6838.
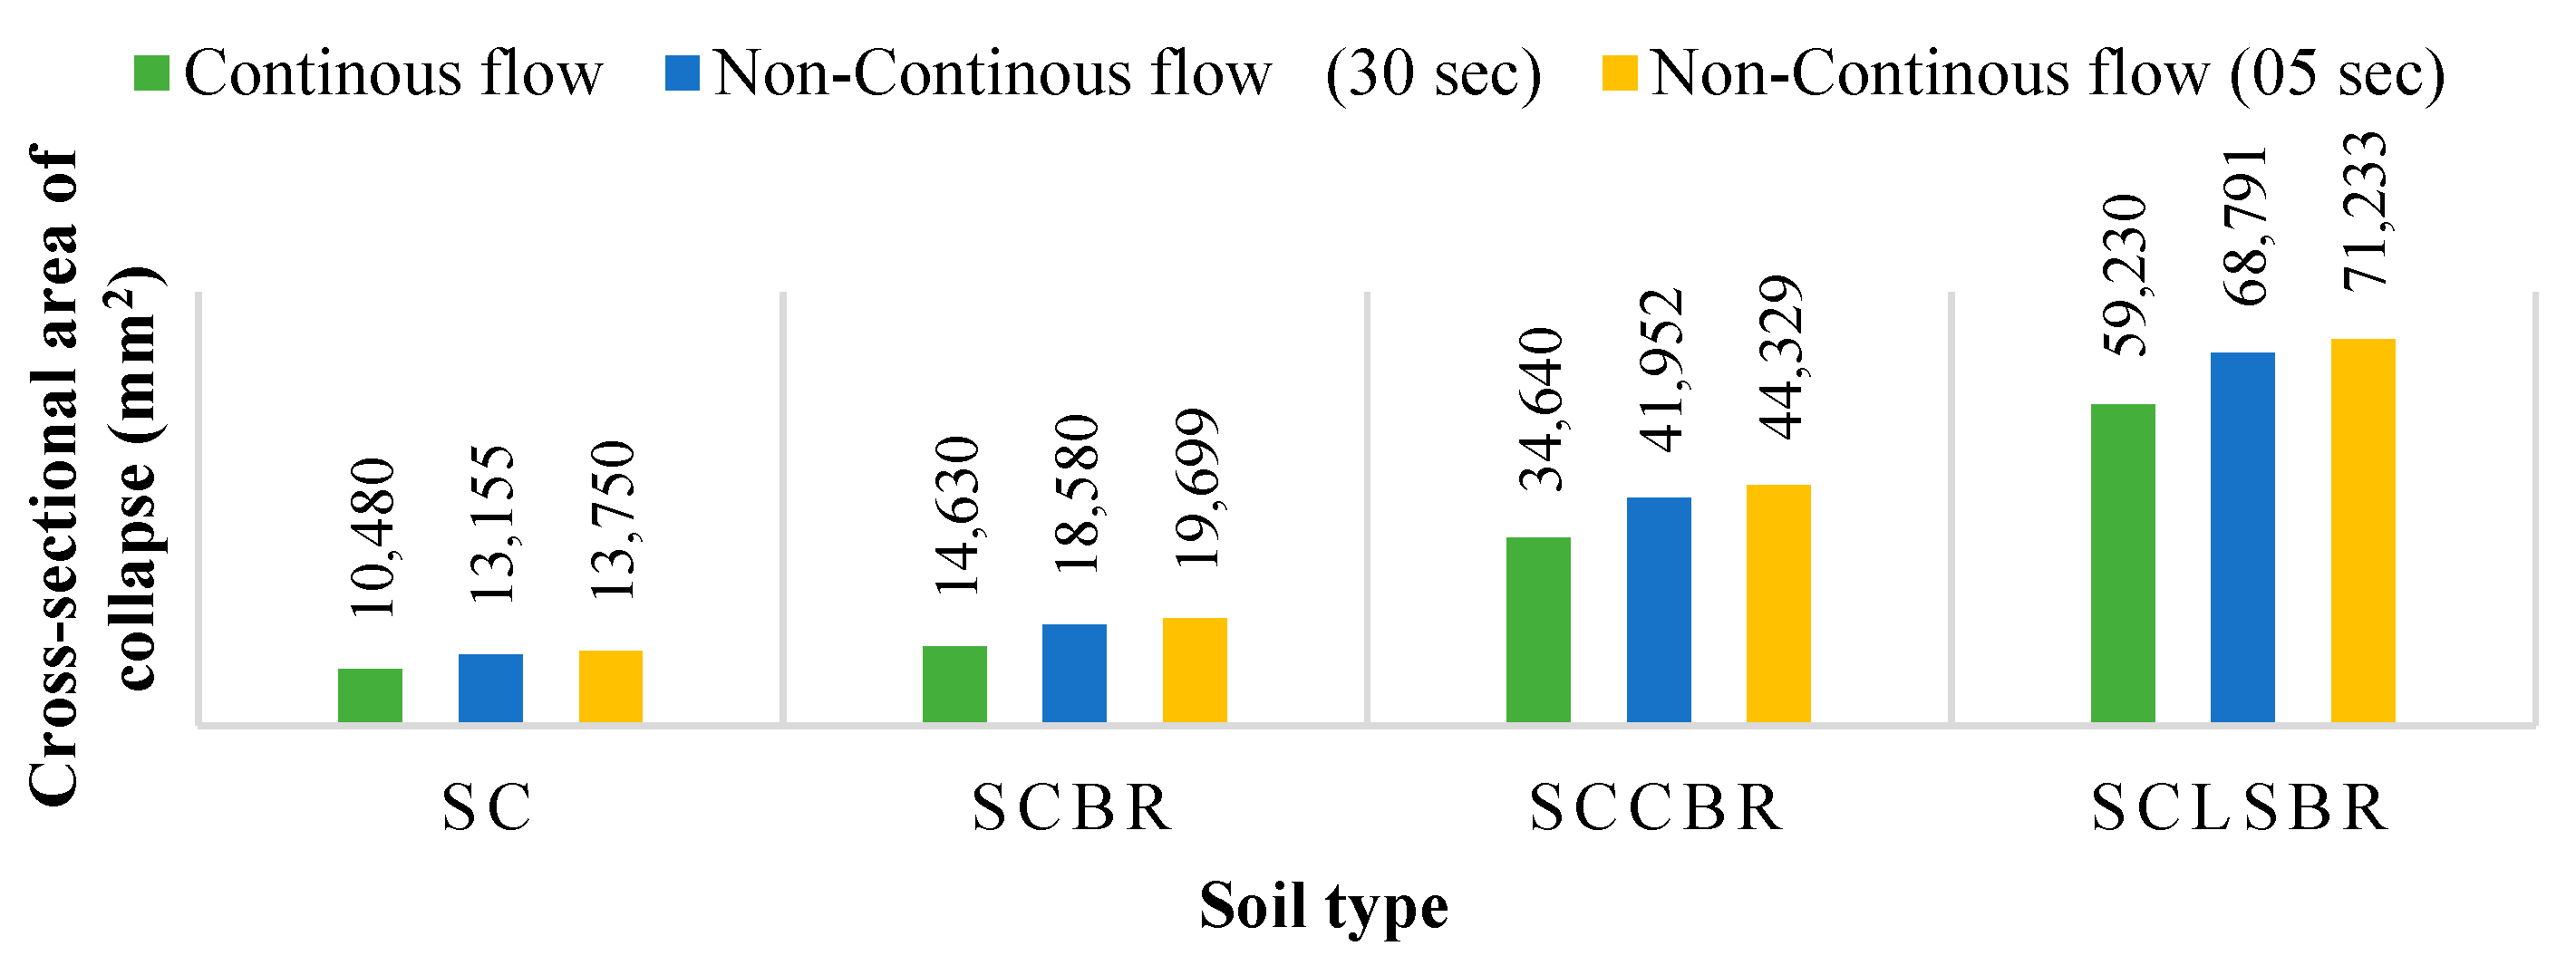
The area of settlement or collapse was also noted to vary for each case under different conditions, as given in
Table 6. The histogram in
Figure 8 also clearly shows that the SC-LS-BR soil profile had the largest area of collapse under the various conditions.
The results of the study were compiled into the manmade sinkhole risk prediction table (HM-SRPT), which is given in
Table 7. The HM-SRPT indicates that a sinkhole will occur for the first five scenarios, while the soil profile will only settle downward for the next four scenarios without any collapse or occurrence of a sinkhole, as presented in
Table 7. The criteria followed for the arrangement of the risk intensity in different soil profiles are leakage in water pipeline is based on the depth of settlement. As shown in the
Table 7 under the column “Maximum settlement (mm)”, 183 mm is the maximum settlement in the soil profile SC-LS-BR at 30 min, 160 mm, 156 mm, 135 mm, and so on for other soil profiles and water flow conditions. Similarly, in the case of the pipeline leaking from the top, the risk intensity is kept very high (VH), because the soil profile was collapsed much earlier as compared to the other soil profiles when the pipeline was leaking from the bottom. Hence, the risk intensity is the highest for soil profiles when the leakage is from the top of the pipeline and for the SC-LS-BR soil profile when the pipeline leaks from the bottom.
The results showed that the most important factor for sinkhole occurrence or settlement is the type of subsurface soil profile. A cyclic flow in a leaking pipeline was found to have a greater impact than a continuous flow. For cyclic flows, a shorter time interval has a greater impact than a longer time interval. The volume and depth of collapse or settlement were the greatest with the SC-LS-BR soil profile and smallest for the SC soil profile when the pipeline was leaking from the bottom. Among the cases considered, sinkhole occurrence was fastest when the pipeline leaked from the top.
Currently, ground penetrating radar [
27], image processing and 3D visualization [
28], trenching, and other methods are used to monitor sinkholes, ground collapse, and ground settlement. However, these practices are energy-intensive, time-consuming, and costly. In addition, these methods cannot monitor urban sinkholes in real time. Hence, urban areas first need to be divided into zones based on the risk level.
Risk prediction can help public and private maintenance authorities such as urban water management authorities and geological departments take action as soon as possible to prevent accidents due to leaking underground sewer and/or water pipelines. In such cases, the regression model developed in this study can be helpful for the public and private authorities to predict and decide the zones in urban areas that need urgent monitoring to overcome any settlement or collapse due to leakage in an underground pipeline. However, many experiments need to be performed to determine the characteristics and develop adequate guidelines. There is a notable lack of manmade sinkhole models that consider various factors for risk prediction. The experimental results for different subsurface profiles in this study can be used to determine the sinkhole risk in different areas and help divide an area into zones based on the subsurface soil profile. Manmade sinkholes in urban areas occur due to leakage in underground sewer and water pipelines, tunneling, deep foundations, mining, and underground water table. However, in this study, the authors only considered the manmade sinkholes due to leakage in underground sewer and water pipelines. In the future, the results can be used to develop an SRI by considering other various aspects of manmade sinkholes in urban areas such as tunneling, deep foundations, mining, and the underground water table.


