Article

An Improved Transit Signal Priority Strategy for Real-World Signal Controllers that Considers the Number of Bus Arrivals

1
College of Transportation and Civil Engineering, Fujian Agriculture and Forestry University, Fuzhou 350002, China
2
College of Metropolitan Transportation, Beijing University of Technology, Beijing 100124, China
3
Department of Information Technology, University of Wisconsin, Madison, WI 53706, USA
*
Author to whom correspondence should be addressed.
Sustainability 2020, 12(1), 287; https://doi.org/10.3390/su12010287
Submission received: 31 August 2019 / Revised: 24 December 2019 / Accepted: 26 December 2019 / Published: 30 December 2019

Abstract

:
Active transit signal priority (TSP) is used more conveniently and widely than the other strategies for real-world signal controllers. However, the active TSP strategies of real-world signal controllers use the first-come-first-served rule to respond to any active TSP request and are not effective at responding to the number of bus arrivals. With or without the green extension strategy, the active TSP has little impact on the final green time of priority phase, even in the case where more buses arrive during the priority phase. The reduced green time of early green strategy is relatively large when a bus arrives, and it would be worse when more buses arrive, the active TSP has a big adverse impact on the final green time of the non-priority phase. Therefore, the active TSP strategies of real-world signal controllers cannot handle the downtown intersection where many bus lines converge or where many buses arrive in a signal cycle during the evening rush hour. Traffic engineers need to do much work to optimize the TSP parameters before field application. Consequently, it is necessary to improve the TSP strategy of the real-world signal controllers for the intersections with a lot of bus arrivals. In order to achieve that objective, the authors present the CNOB (cumulative number of buses) TSP strategy based on the Siemens 2070 signal controller. The TSP strategy extends the max call time according to the number of buses in the arrival section when priority phases are active. The TSP strategy truncates the green time according to the number of buses in the storage section when non-priority phases are active. The experiment’s result shows that the CNOB TSP strategy can not only significantly reduce the average delay per person without using TSP optimization but can also reduce the adverse impact on the general vehicles of non-bus-priority approaches for the intersections with a lot of bus arrivals. Additionally, because the system dynamically adjusts, traffic engineers do not need to do much optimization work before the TSP implementation.

1. Introduction

Traffic congestion is already one of the greatest issues in many cities [1,2]. An efficient public transit system has great potential to reduce traffic congestion, vehicle emissions, and energy consumption in urban areas [3]. However, the uncertainty of the travel time of buses that may be caused by the uncertainty of dwell time for passenger loading and unloading, the delay of traffic signal control at an intersection, and the delay of traffic congestion along the bus routes will affect the service level of public transit systems [4]. Transit signal priority (TSP) is regarded as a cost-effective way to solve the current congestion in urban areas [5,6]. TSP is a control strategy that provides priority for buses through signalized intersections while minimizing the adverse impacts of the non-bus-priority approaches [5,7,8,9]. It is widely accepted as a viable solution to reduce the delay of buses and ensure bus schedule adherence [1,5,10,11].
TSP strategies can be divided into passive priority, active priority, and real-time priority [12]. Passive priority strategy only optimizes the off-line timing program and does not need to detect whether there is a bus arrival. Active priority strategy checks whether there is a bus arrival and determines whether to give a priority signal. In real-time priority strategy, bus priority signal is given based on real-time detection data, including bus data and general vehicle data, and an objective function is developed to optimize a signal timing plan. So far, active priority is used more conveniently and widely than the other strategies for real-world signal controllers [5].
Different active TSP strategies have a different impact on the TSP implementation efficiency [13,14,15,16,17,18,19,20,21,22,23,24,25,26,27,28,29]. Therefore, there are many studies that try to improve the TSP implementation efficiency for active TSP strategy. The improvement measures for active TSP strategy have been discussed in four aspects. Firstly, transit schedule information and transit priority weight are used to give active TSP to the late public traffic vehicles [13,14,15,16,17]. Saturation degree restriction of non-bus-priority approaches is considered to give active TSP to buses [18,19,20]. The bus information, general vehicle information, and passenger information are calculated to give active TSP to buses [14,21,22]. Lockout rules which will stop responding to any priority request after accepting a successful priority request are applied to give active TSP to buses [23,24]. With these conditional or partial priority improvements, the active TSP can significantly improve the bus travel times with little effect on crossing street delays. Secondly, the signal compensation strategy for non-priority approaches is considered after giving active TSP to buses [19,25,26]. With green time compensation, the service level of non-bus-priority approaches will be maintained at an acceptable level. Thirdly, bus information, general vehicle information, arterial phase design, arterial signal timing, and green time compensation after giving active TSP to buses are considered to keep the arterial coordination control [21,25,27]. With the algorithm improvements, the active TSP can apply for arterial coordination control to meet the traffic demands of buses and general vehicles. Finally, the factors such as detector location, detection time prediction for buses, and mechanisms for providing green extension are considered to improve the active TSP control logic [14,18,28,29]. With the control logic improvements, the execution efficiency of active TSP can be significantly improved.
Although the improvement studies for active TSP are many, relatively few studies focus on the control logics and parameters of real-world signal controllers. For example, there are three problems for SIESC2070 (abbreviations refer to Siemens signal controller 2070, which is produced by Siemens Energy&Automation Co., Ltd., Chicago, IL, USA).
Firstly, according to the requirements for providing priority, the TSP type of the SIESC2070 is classified as an unconditional priority. SIESC2070 only accepts bus detection impulses to run the TSP control logic. The conditional TSP information, such as transit schedule information, general vehicle information, saturation degree restriction of non-bus-priority approaches is not used to run the TSP control logic. Under this condition, the TSP strategy of SIESC2070 may adversely impact the general vehicles of non-bus-priority approaches. On the other hand, the real-world signal controllers like SIESC2070 or Hisense SC3080 (abbreviations refer to Hisense signal controller 3080, which is produced by Hisense Network Technology Co., Ltd., Qingdao, China) use the first-come-first-served (FCFS) rule to respond to any active TSP request and do not use the cumulative number of bus arrivals [23]. For the intersections with a lot of bus arrivals, giving an active TSP to a late bus will affect the other buses which run normally, especially when non-priority phases are active. Therefore, limiting the number of TSP requests and only sending the TSP requests for the late buses cannot effectively improve the schedule adherence of all buses at the intersections with a lot of bus arrivals.
Secondly, if the buses arrive and pass the stop line during the minimum green time of the priority phase, they do not need to send a priority request to trigger the green extension strategy. If the buses arrive but cannot pass the stop line during the end of minimum green time when the priority phase is active, they need to send a priority request to trigger the green extension strategy. Therefore, the trigger probability that the final green time exceeds the minimum green time is relatively low when the priority phase is active [30]. From the hardware-in-the-loop simulation for SIESC2070, the times that the final green time exceeds the minimum green time are relatively small even in the case of more buses arriving during the period of the priority phase [12,23,31,32]. Therefore, with or without the green extension strategy, the active TSP has little impact on the final green time of the priority phase. The green extension strategy of SIESC2070 cannot effectively adjust the green time of the priority phase to match the random arrival of buses, especially for the intersections with a lot of arriving buses. Therefore, the green extension strategy of SIESC2070 often fails to offer an efficient solution to reduce the average delay per person at the intersection [33].
Thirdly, for the early green strategy of SIESC2070, if a bus arrives and is detected during a non-priority phase, the final green time of this non-priority phase will be reduced to its minimum green time if the elapsed time of this non-priority phase is smaller than its minimum green time, or this non-priority phase will be switched to the next phase immediately if the elapsed time of this non-priority phase is larger than its minimum green time. And more importantly, for all the subsequent non-priority phases, their final green time will be reduced to their minimum green time whether a bus arrives or not. Therefore, the reduced green time of the early green strategy is relatively large when a bus arrives, and it would be worse when more buses arrive. The early green strategy of SIESC2070 will cause a big adverse impact on the general vehicles of non-bus-priority approaches [33].
Letting more buses pass the stop line during the end of the green time period when the priority phase is active will significantly reduce the average delay per person at the intersection, and limiting the reduced green time of non-priority phases reasonably will reduce the adverse impact on the general vehicles of non-bus-priority approaches. However, from the above analysis, it is difficult for the TSP strategy of real-world signal controllers to achieve these two control objectives at the downtown intersections where many bus lines converge or where many buses arrive in a signal cycle during the evening rush hour. Traffic engineers need to do much work to optimize the TSP parameters before field application. Consequently, it is necessary to improve the TSP strategy of the real-world signal controllers for the intersections with a lot of bus arrivals.
This paper presents an improved TSP strategy based on the Siemens 2070 signal controller for the intersections with a lot of bus arrivals. Considering the detection and operation cost for the active TSP module, the improved TSP strategy only adds two more bus detections than the previous TSP strategy for every bus arrival. The improved TSP strategy considers the cumulative number of buses to run the TSP control logic, so the improved TSP strategy is named as CNOB TSP strategy. The CNOB TSP strategy extends the max call time according to the number of buses in the arrival section when priority phases are active. This improvement can effectively adjust the max call time of the priority phase to match the random arrival of buses and improve the efficiency of the green extension strategy. The CNOB TSP strategy truncates the green time according to the number of buses in the storage section when non-priority phases are active. This improvement can reasonably control the reduced green time of non-priority phases and improve the rationality of the early green strategy. With these settings, the CNOB TSP strategy can take advantage of active priority and real-time priority. The CNOB TSP strategy can not only significantly reduce the average delay per person without using TSP optimization but can also reduce the adverse impact on the general vehicles of non-bus-priority approaches for the intersections with a lot of bus arrivals. Traffic engineers do not need to do much optimization work before TSP implementation.
According to the respond mode for active TSP requests, this paper calls the previous TSP strategy as the FCFS TSP strategy. The remainder of this paper is organized as follows. Section 2 analyzes the structures and parameters of the FCFS TSP strategy and CNOB TSP strategy. Section 3 describes the experiment design for testing the new TSP strategy, and Section 4 analyzes and discusses the experiment results. Finally, the conclusions and limitations of the work are discussed in Section 5.

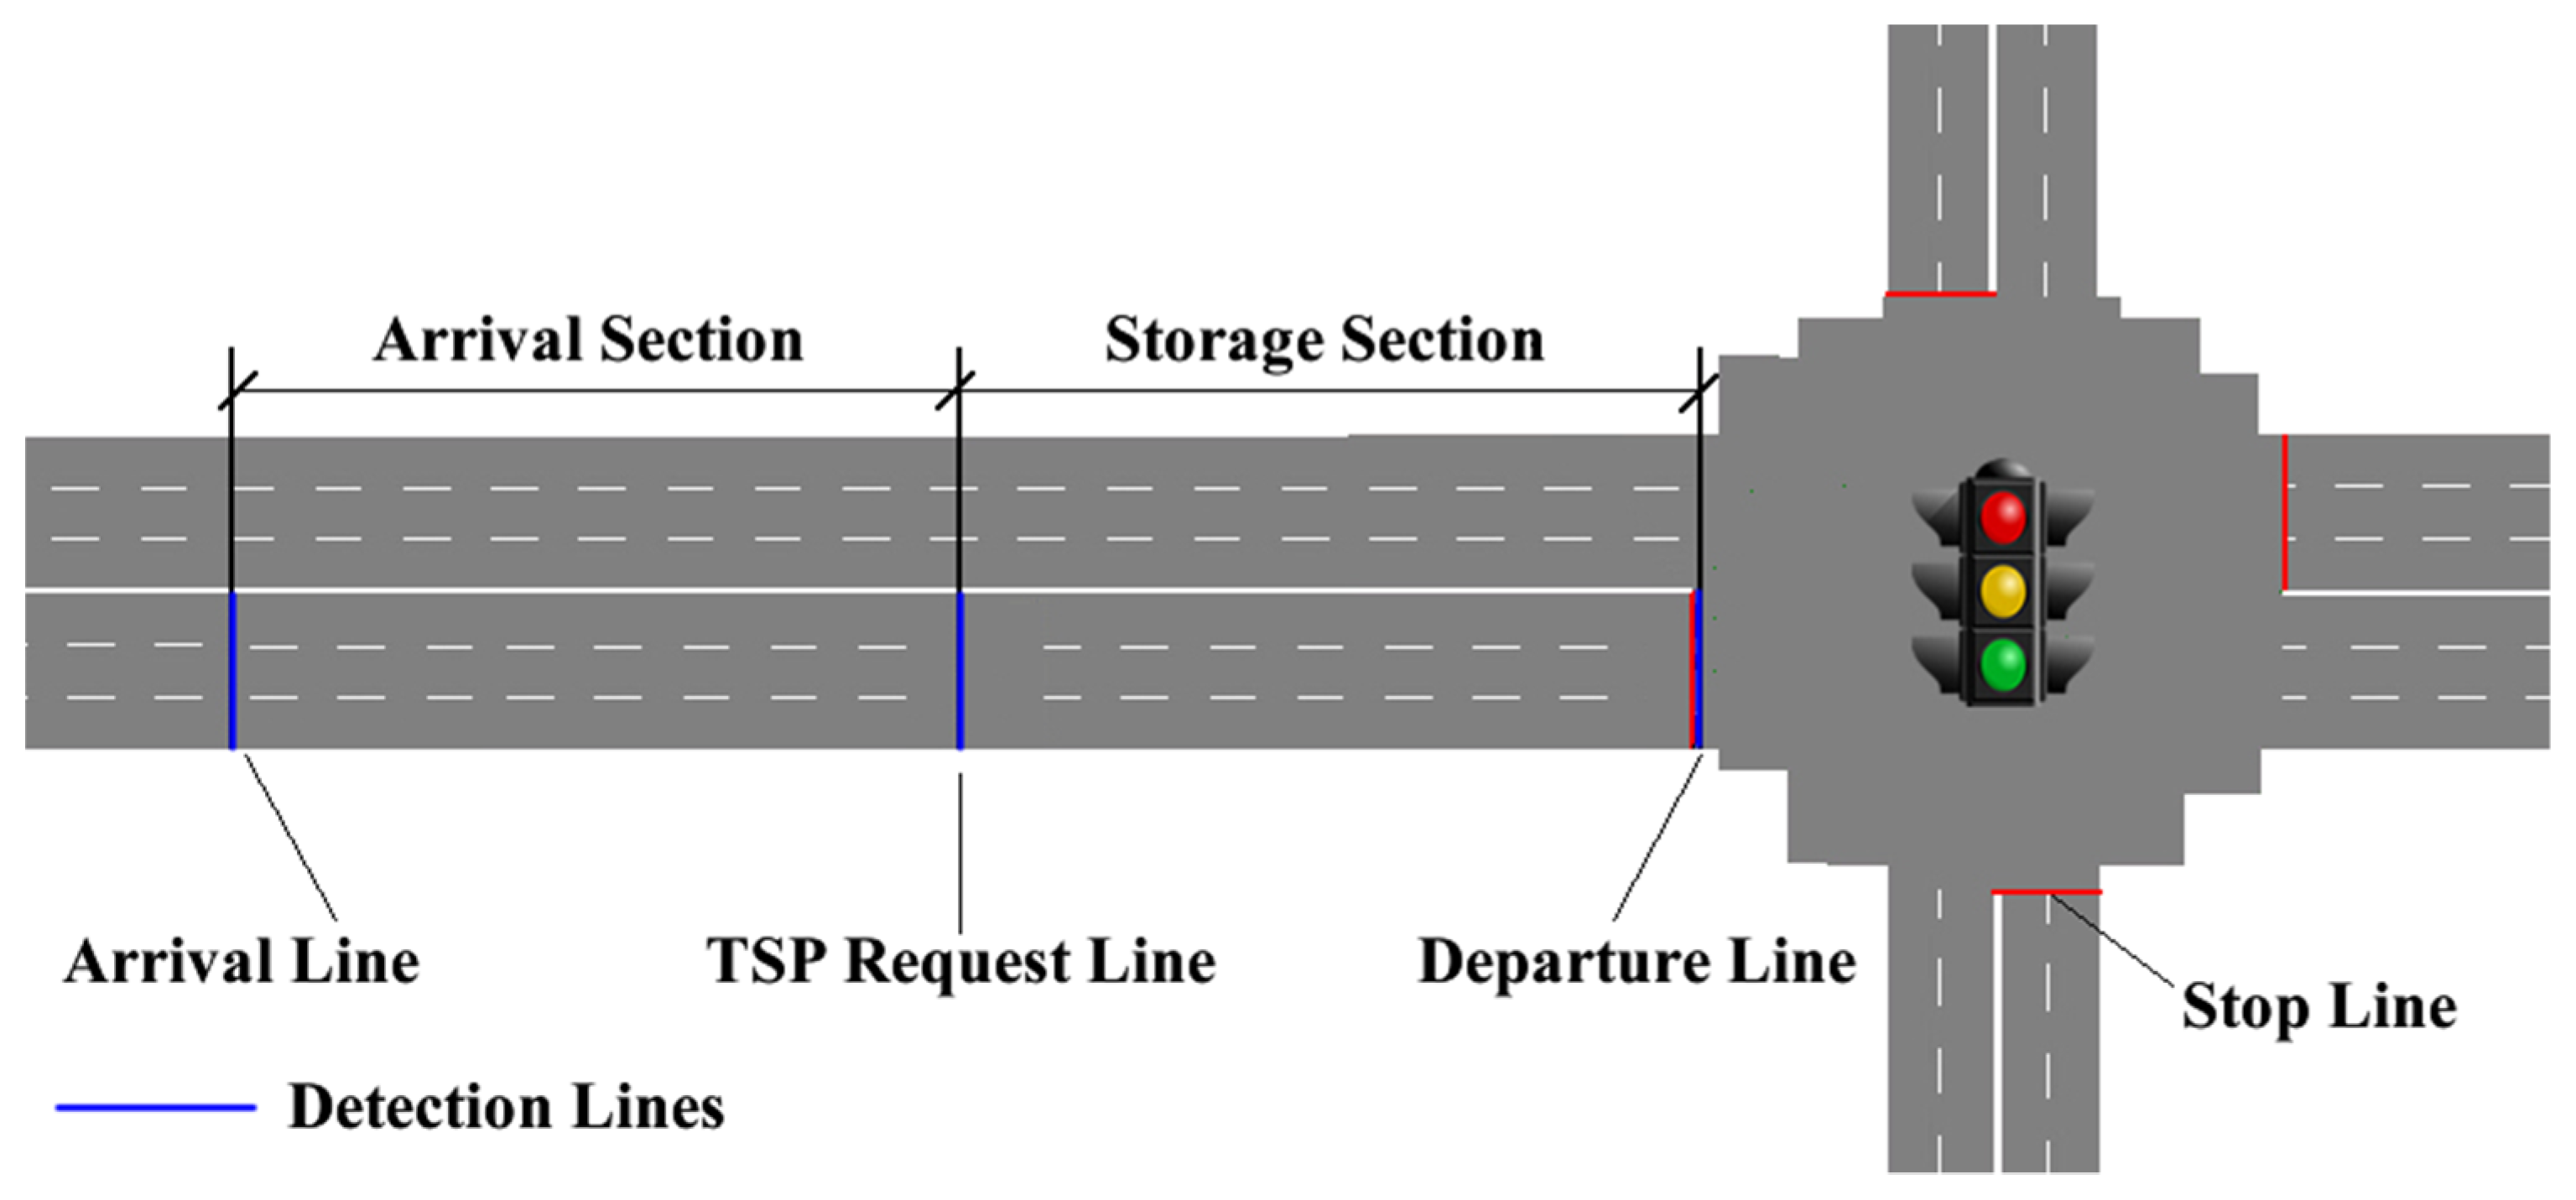
2. TSP Strategy Analysis

The CNOB TSP strategy (shown in Figure 1) is based upon the TSP strategy structure available in the Siemens 2070 signal controller. The TSP strategy of the Siemens 2070 is an active priority strategy. It uses the green extension strategy and early green strategy.

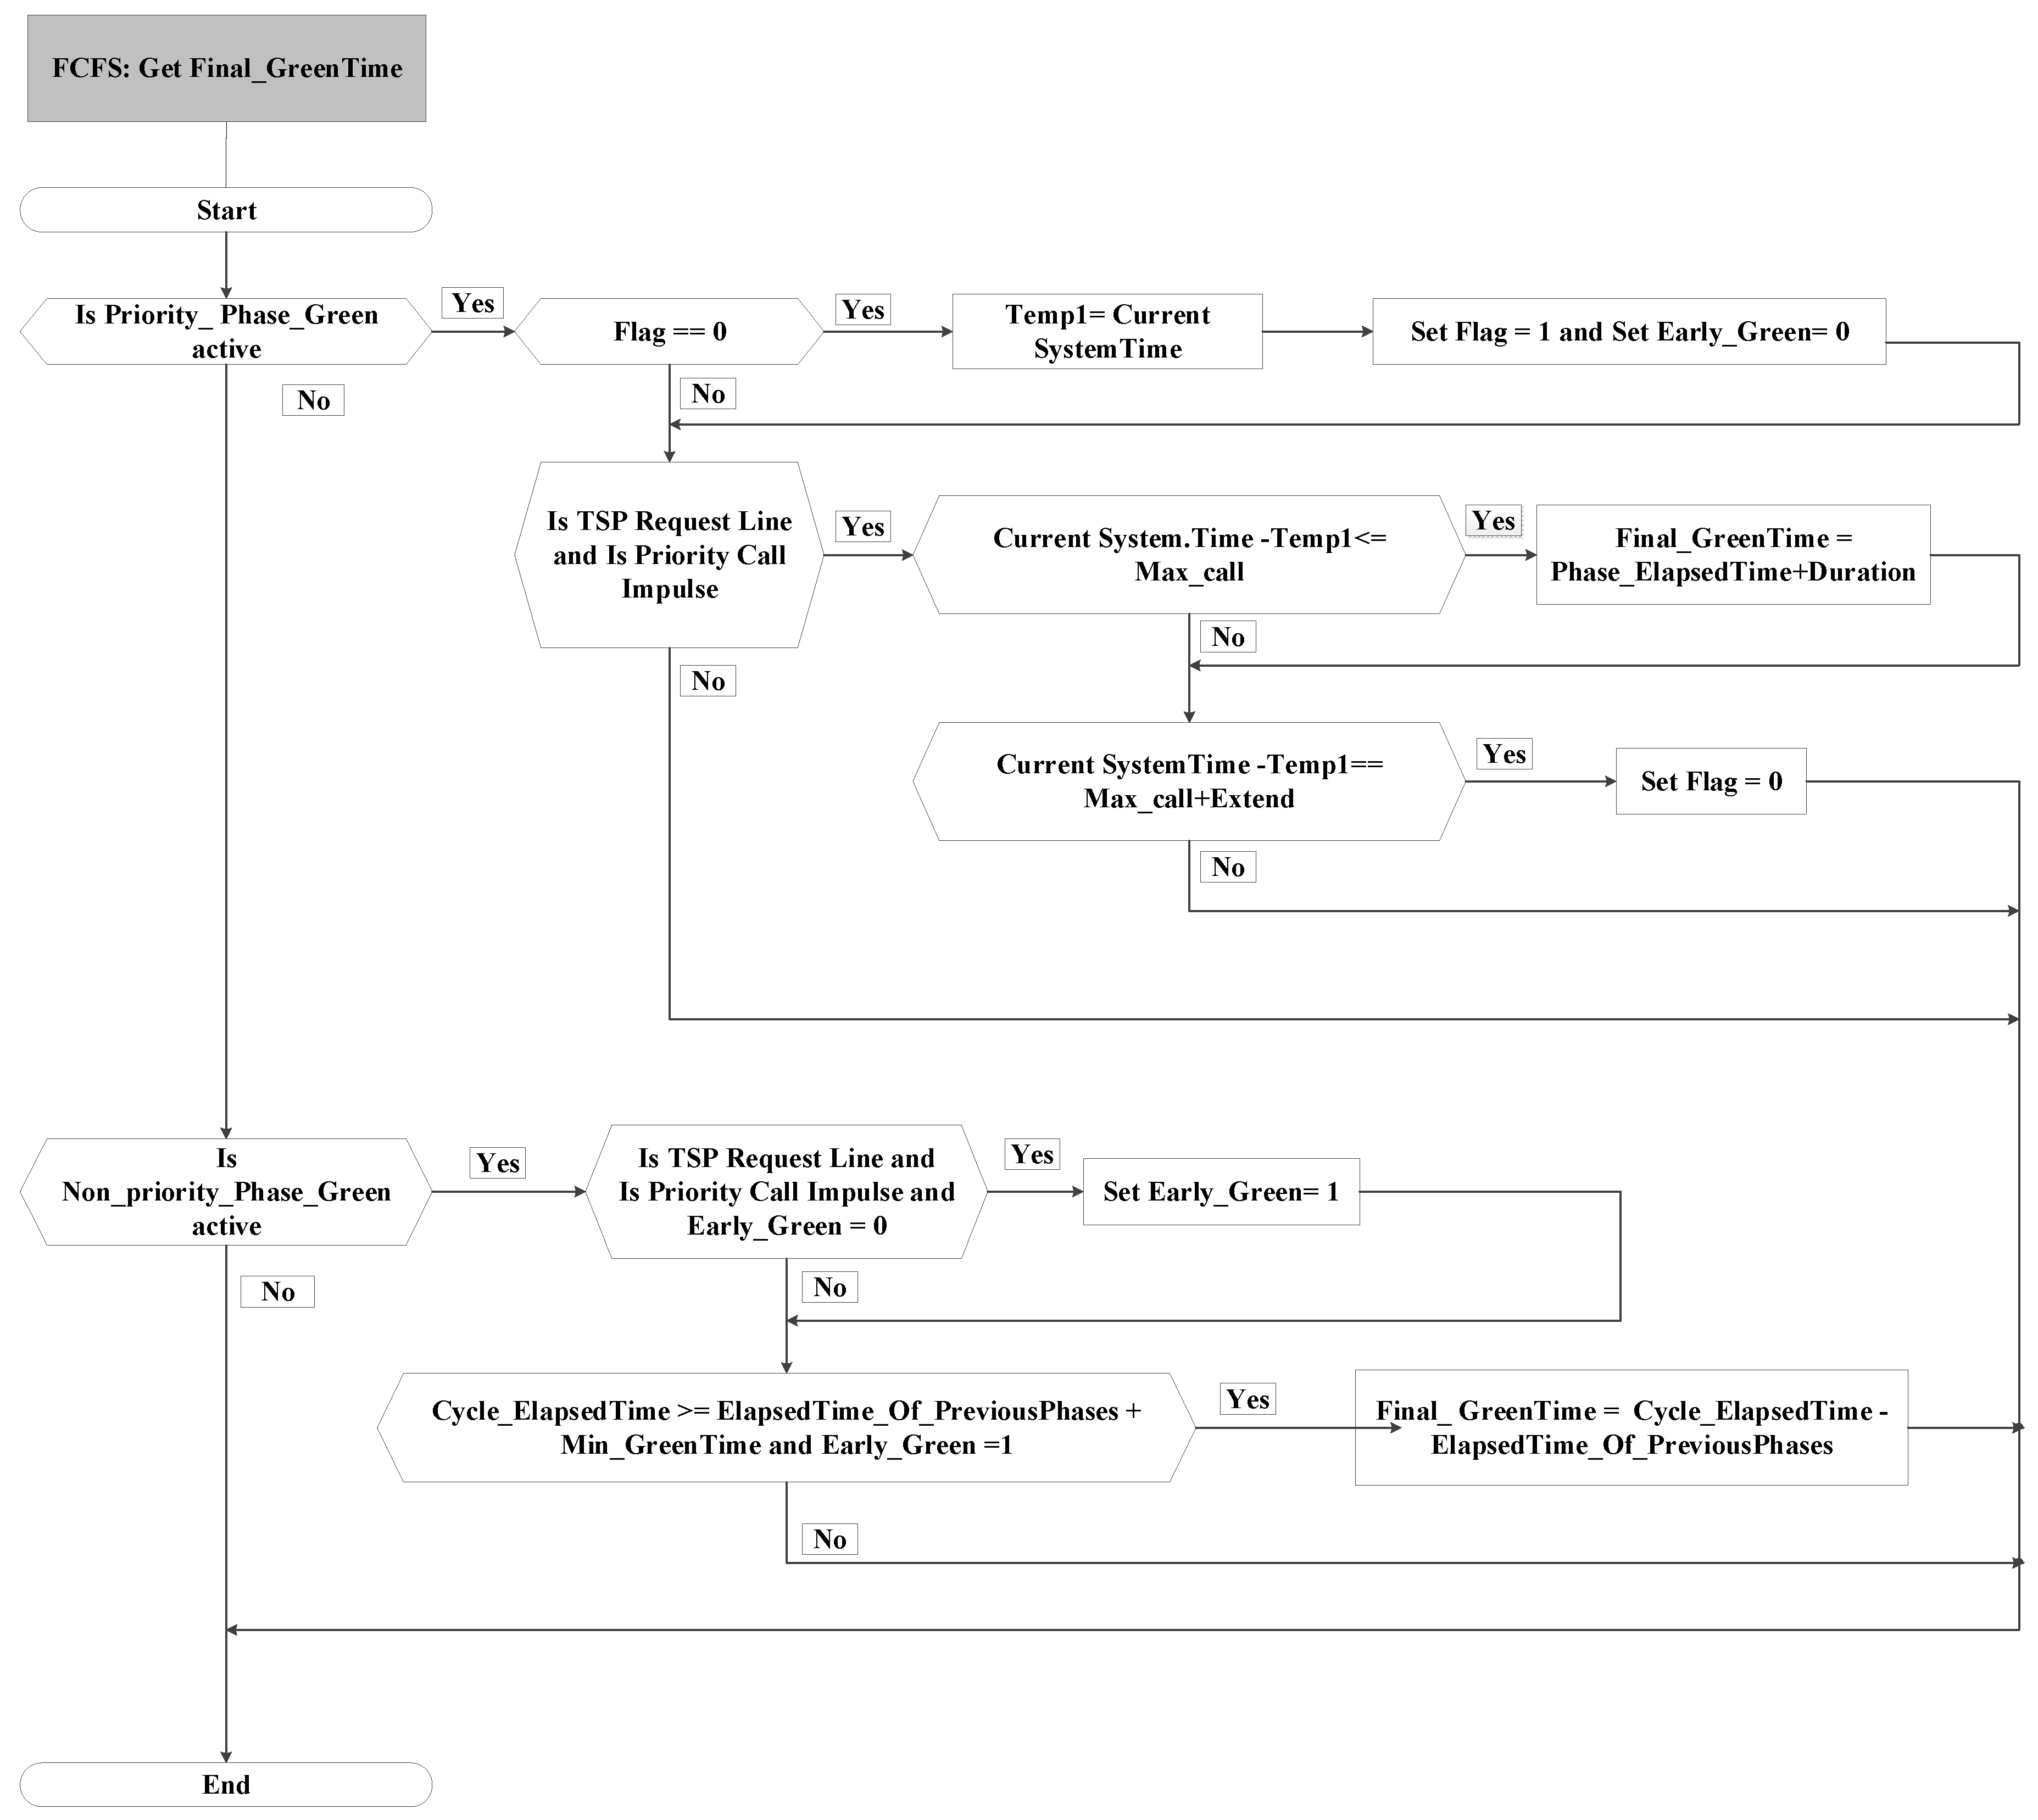
2.1. FCFS TSP Strategy

The FCFS TSP strategy contains two sub-strategies. One is the green extension strategy for the priority phase, and the other is the early green strategy for the non-priority phase.

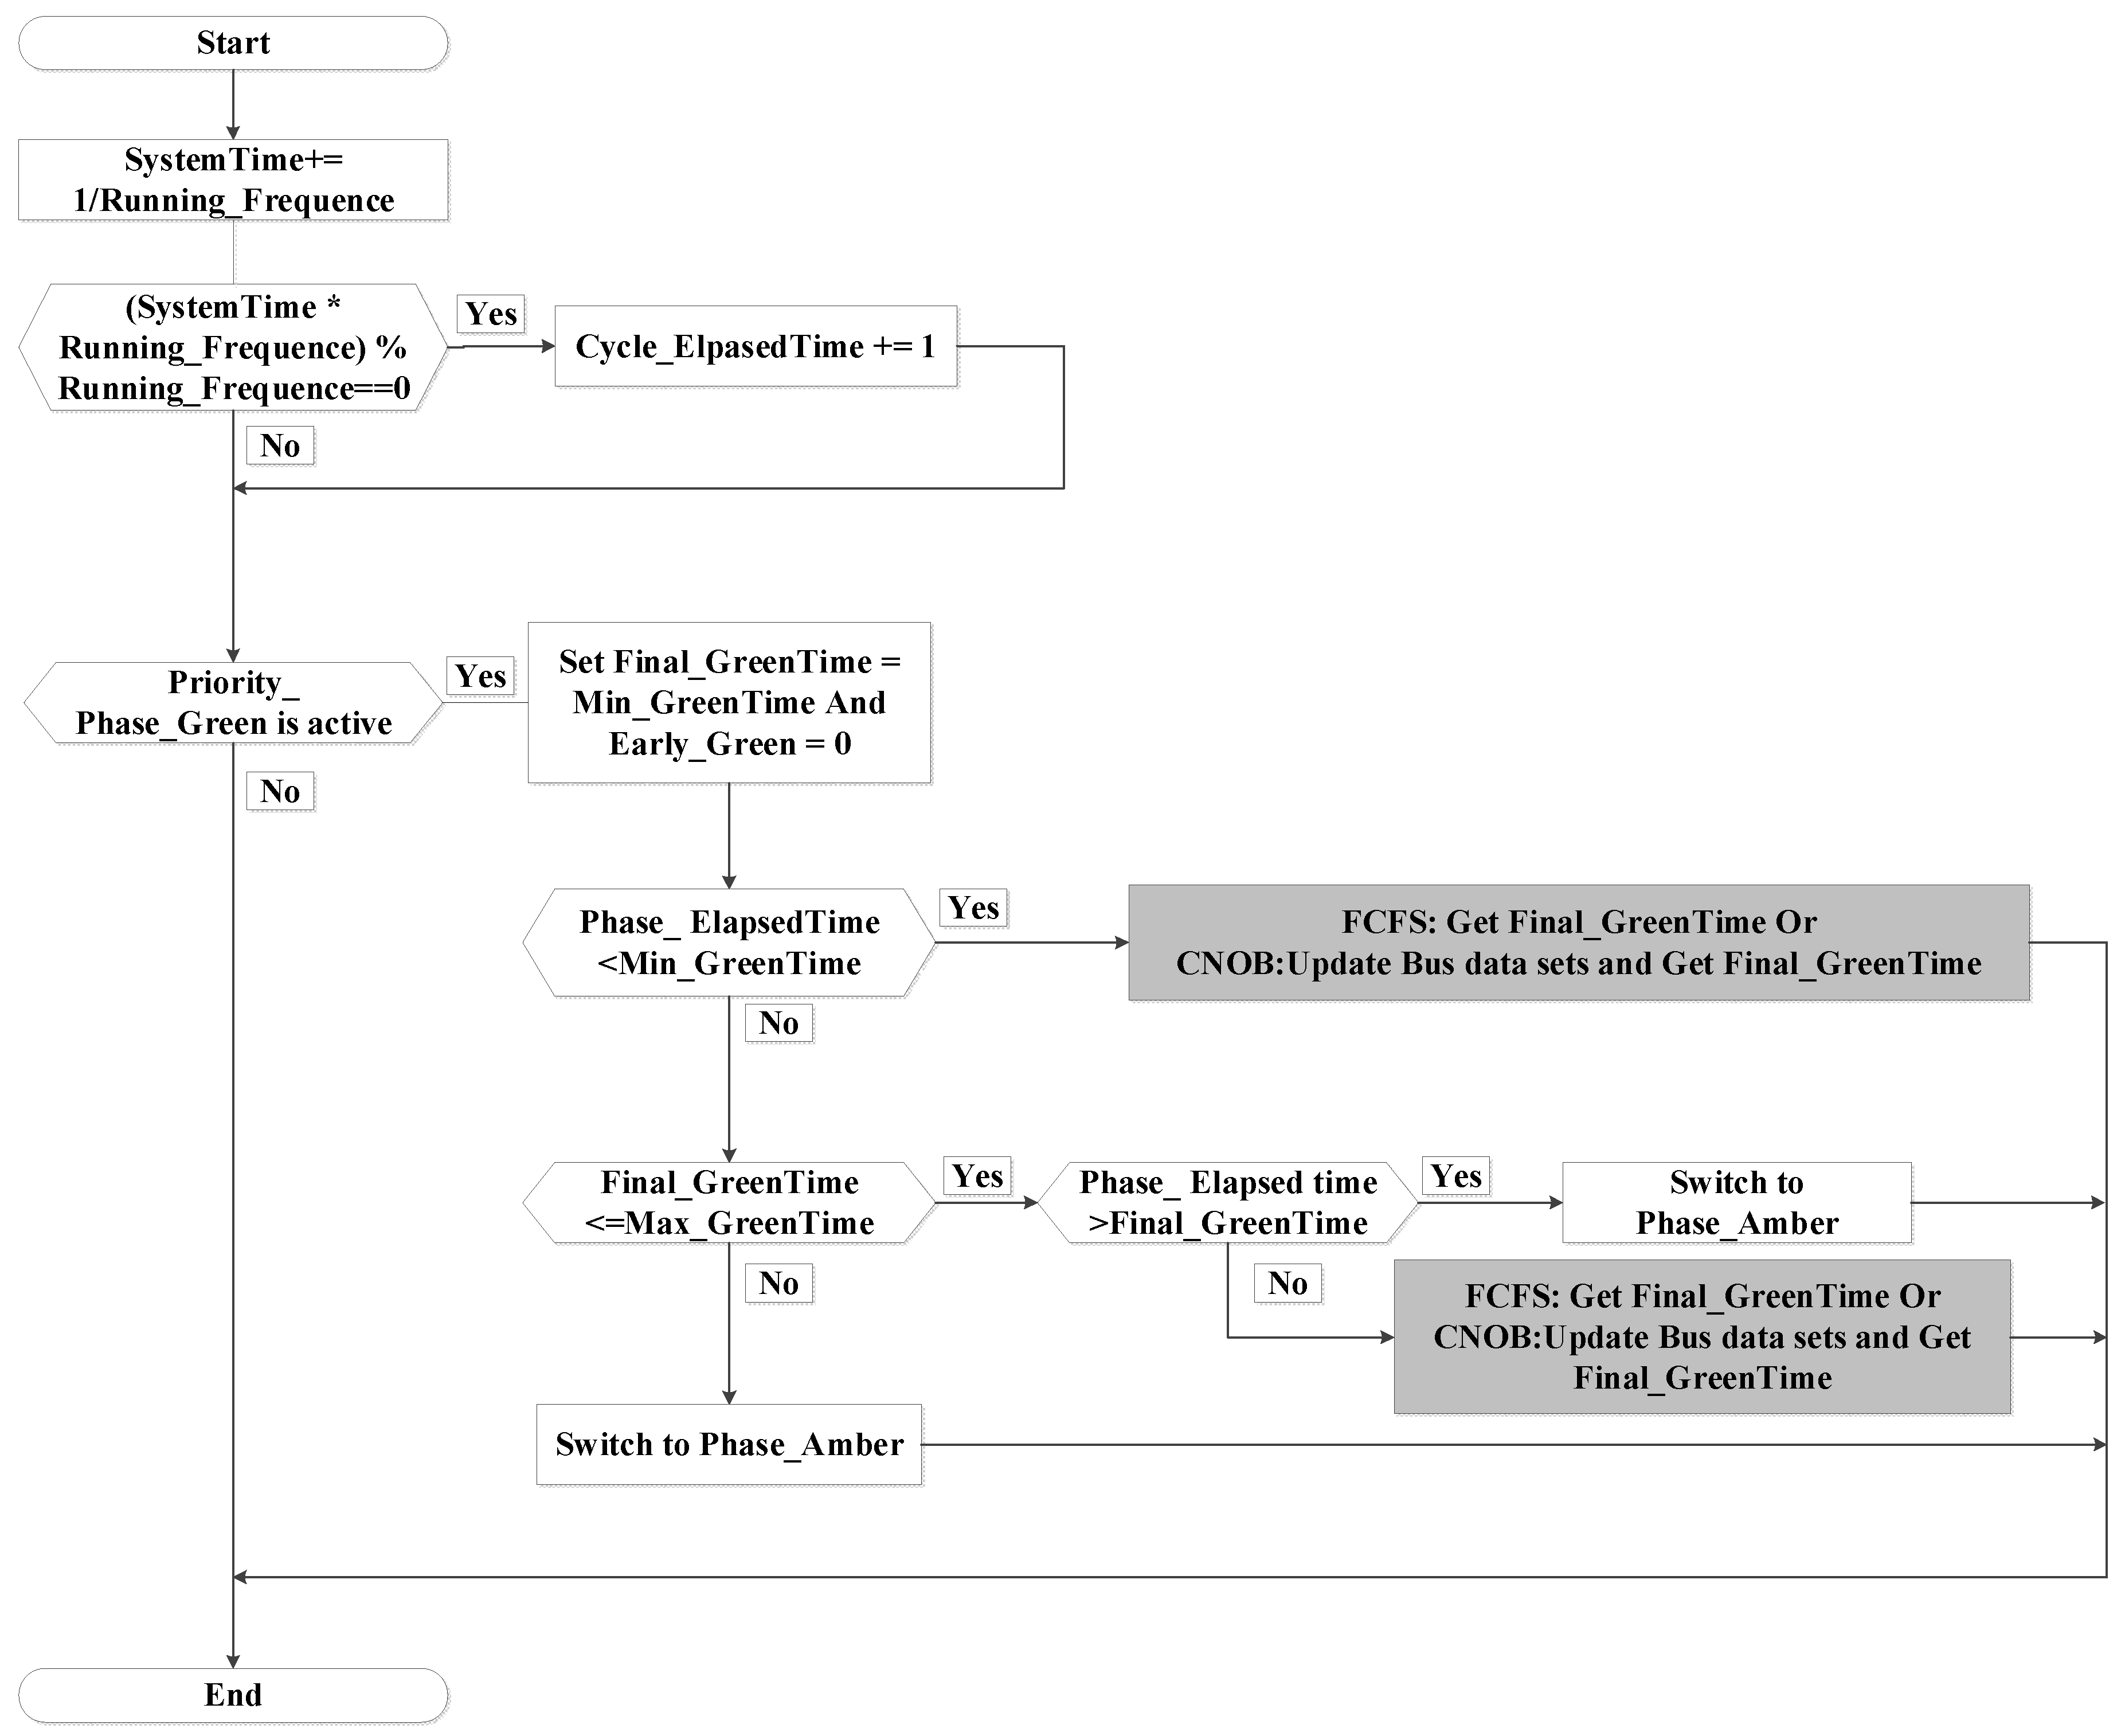
2.1.1. Priority Phase

The TSP control logic of the priority phase is shown in Figure 2. The final green time of the priority phase depends on the bus arrival information at the TSP request line (shown in Figure 1).
(1) No bus arrival
The range of green time for the priority phase is controlled by its own minimum green time and maximum green time parameters. If no bus sends a TSP request, the final green time of the priority phase is fixed at the minimum green time when the priority phase is active (shown in Figure 2).
(2) Bus arrival
If at least one bus sends a TSP request, the final green time relates to three key TSP parameters, Max_call time, Extend time, Duration time (the parameter explanations are shown in Table 1).
If the headway of bus arrival is less than the Max_call time, the final green time of the priority phase will increase by the Duration time (shown in Figure 3).
If the headway of bus arrival is between the Max_call time and the sum of Max_call and Extend time, the final green time of the priority phase will not add a Duration time (shown in Figure 3).
If the headway of bus arrival is larger than the sum of Max_call and Extend time, the signal controller will accept the TSP requests again (shown in Figure 3).
For the FCFS TSP strategy, the trigger probability that the final green time exceeds the minimum green time is relatively low even in the case where more buses arrive during the priority phase [30]. Therefore, it is necessary to improve the TSP strategy of the real-world signal controllers to improve the implementation efficiency of the green extension strategy for the intersections with a lot of bus arrivals.

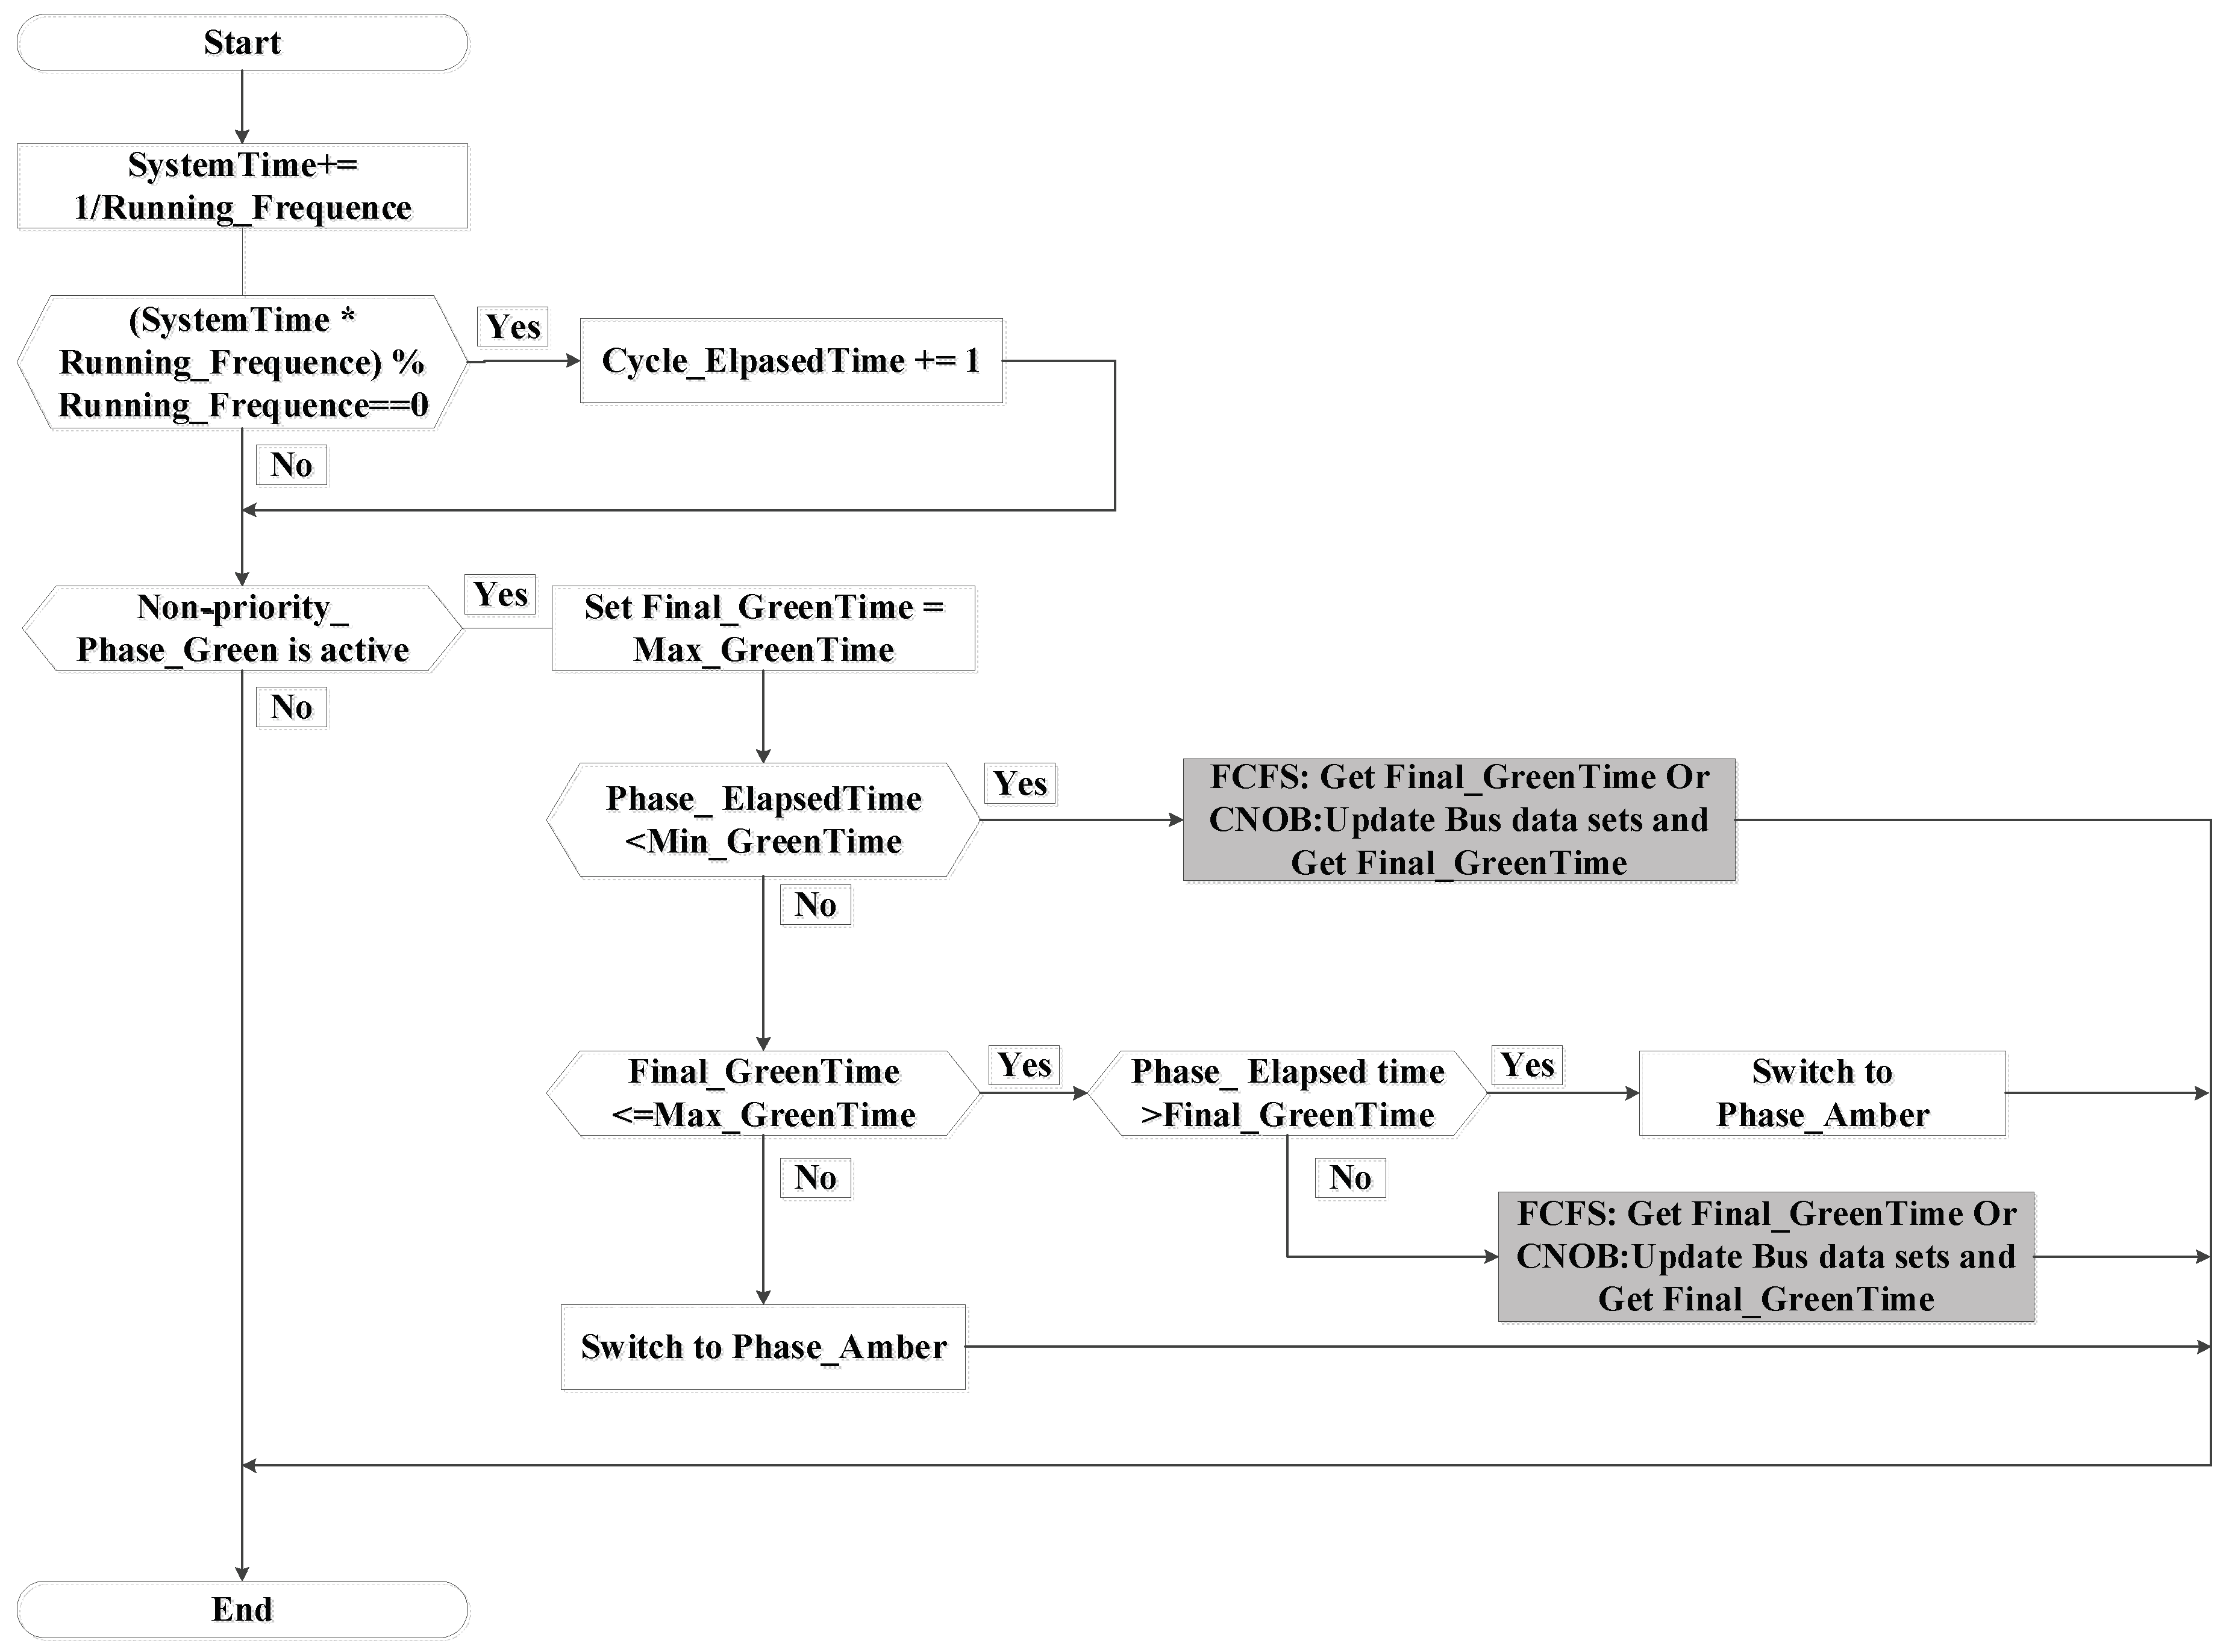
2.1.2. Non-Priority Phase

The TSP control logic of the non-priority phase is shown in Figure 4. The final green time of the non-priority phase depends on the bus arrival information at the TSP request line (shown in Figure 1).
(1) No bus arrival
The final green time of the non-priority phase is fixed at the maximum green time when non-priority phase is active (shown in Figure 4).
(2) Bus arrival
If a bus arrives and is detected during a non-priority phase, the final green time of this non-priority phase will be reduced to its minimum green time if the elapsed time of this non-priority phase is smaller than its minimum green time, or this non-priority phase will be switched to the next phase immediately if the elapsed time of this non-priority phase is larger than its minimum green time (shown in Figure 3).
Moreover, for all the subsequent non-priority phases, the value of Early_Green (shown in Figure 3 and Table 1) parameter will be one (true) until the next priority phase is active, and their final green time will be reduced to their minimum green time whether a bus arrives or not (shown in Figure 3).
For the FCFS TSP strategy, the trigger probability of the early green strategy is relatively high in the case of more buses arriving during the non-priority phases [30]. Meanwhile, the truncation extent of green time is relatively large. In this case, the FCFS TSP strategy often fails to minimize the adverse impact on the general vehicles of non-bus-priority approaches. Therefore, it is necessary to improve the TSP strategy of the real-world signal controllers to adjust the control logic of the early green strategy for the intersections with a lot of bus arrivals.

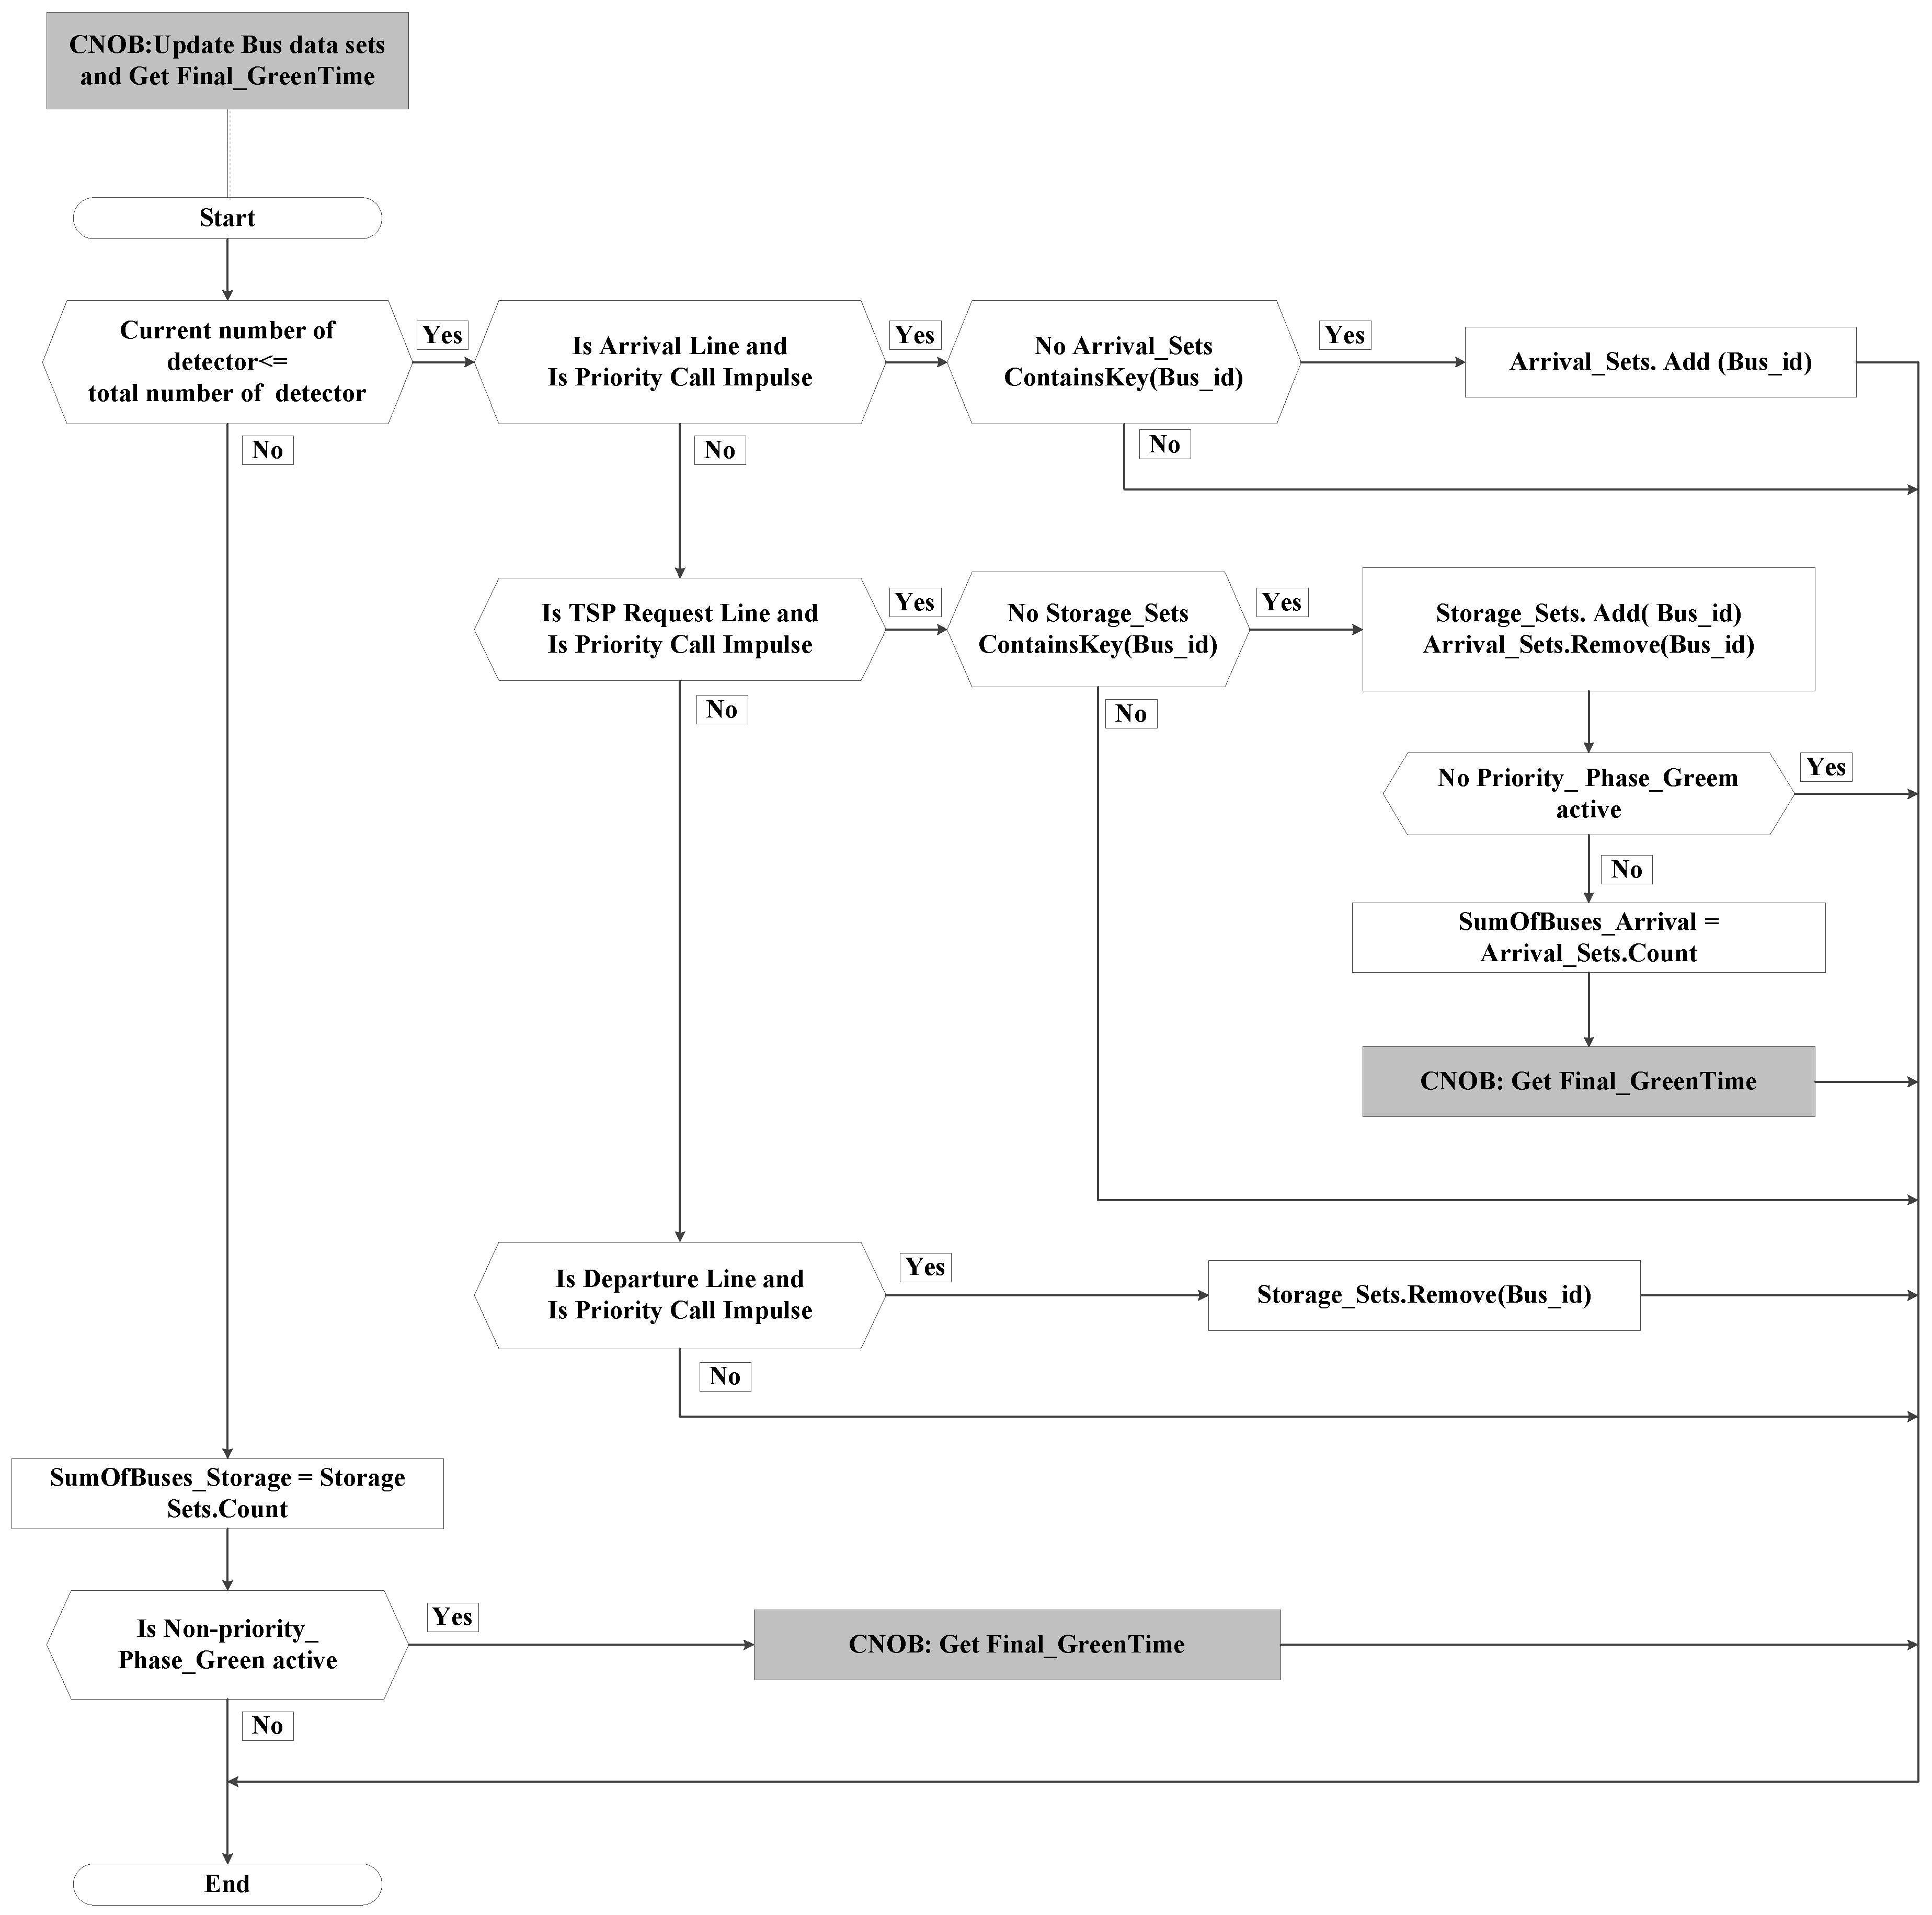
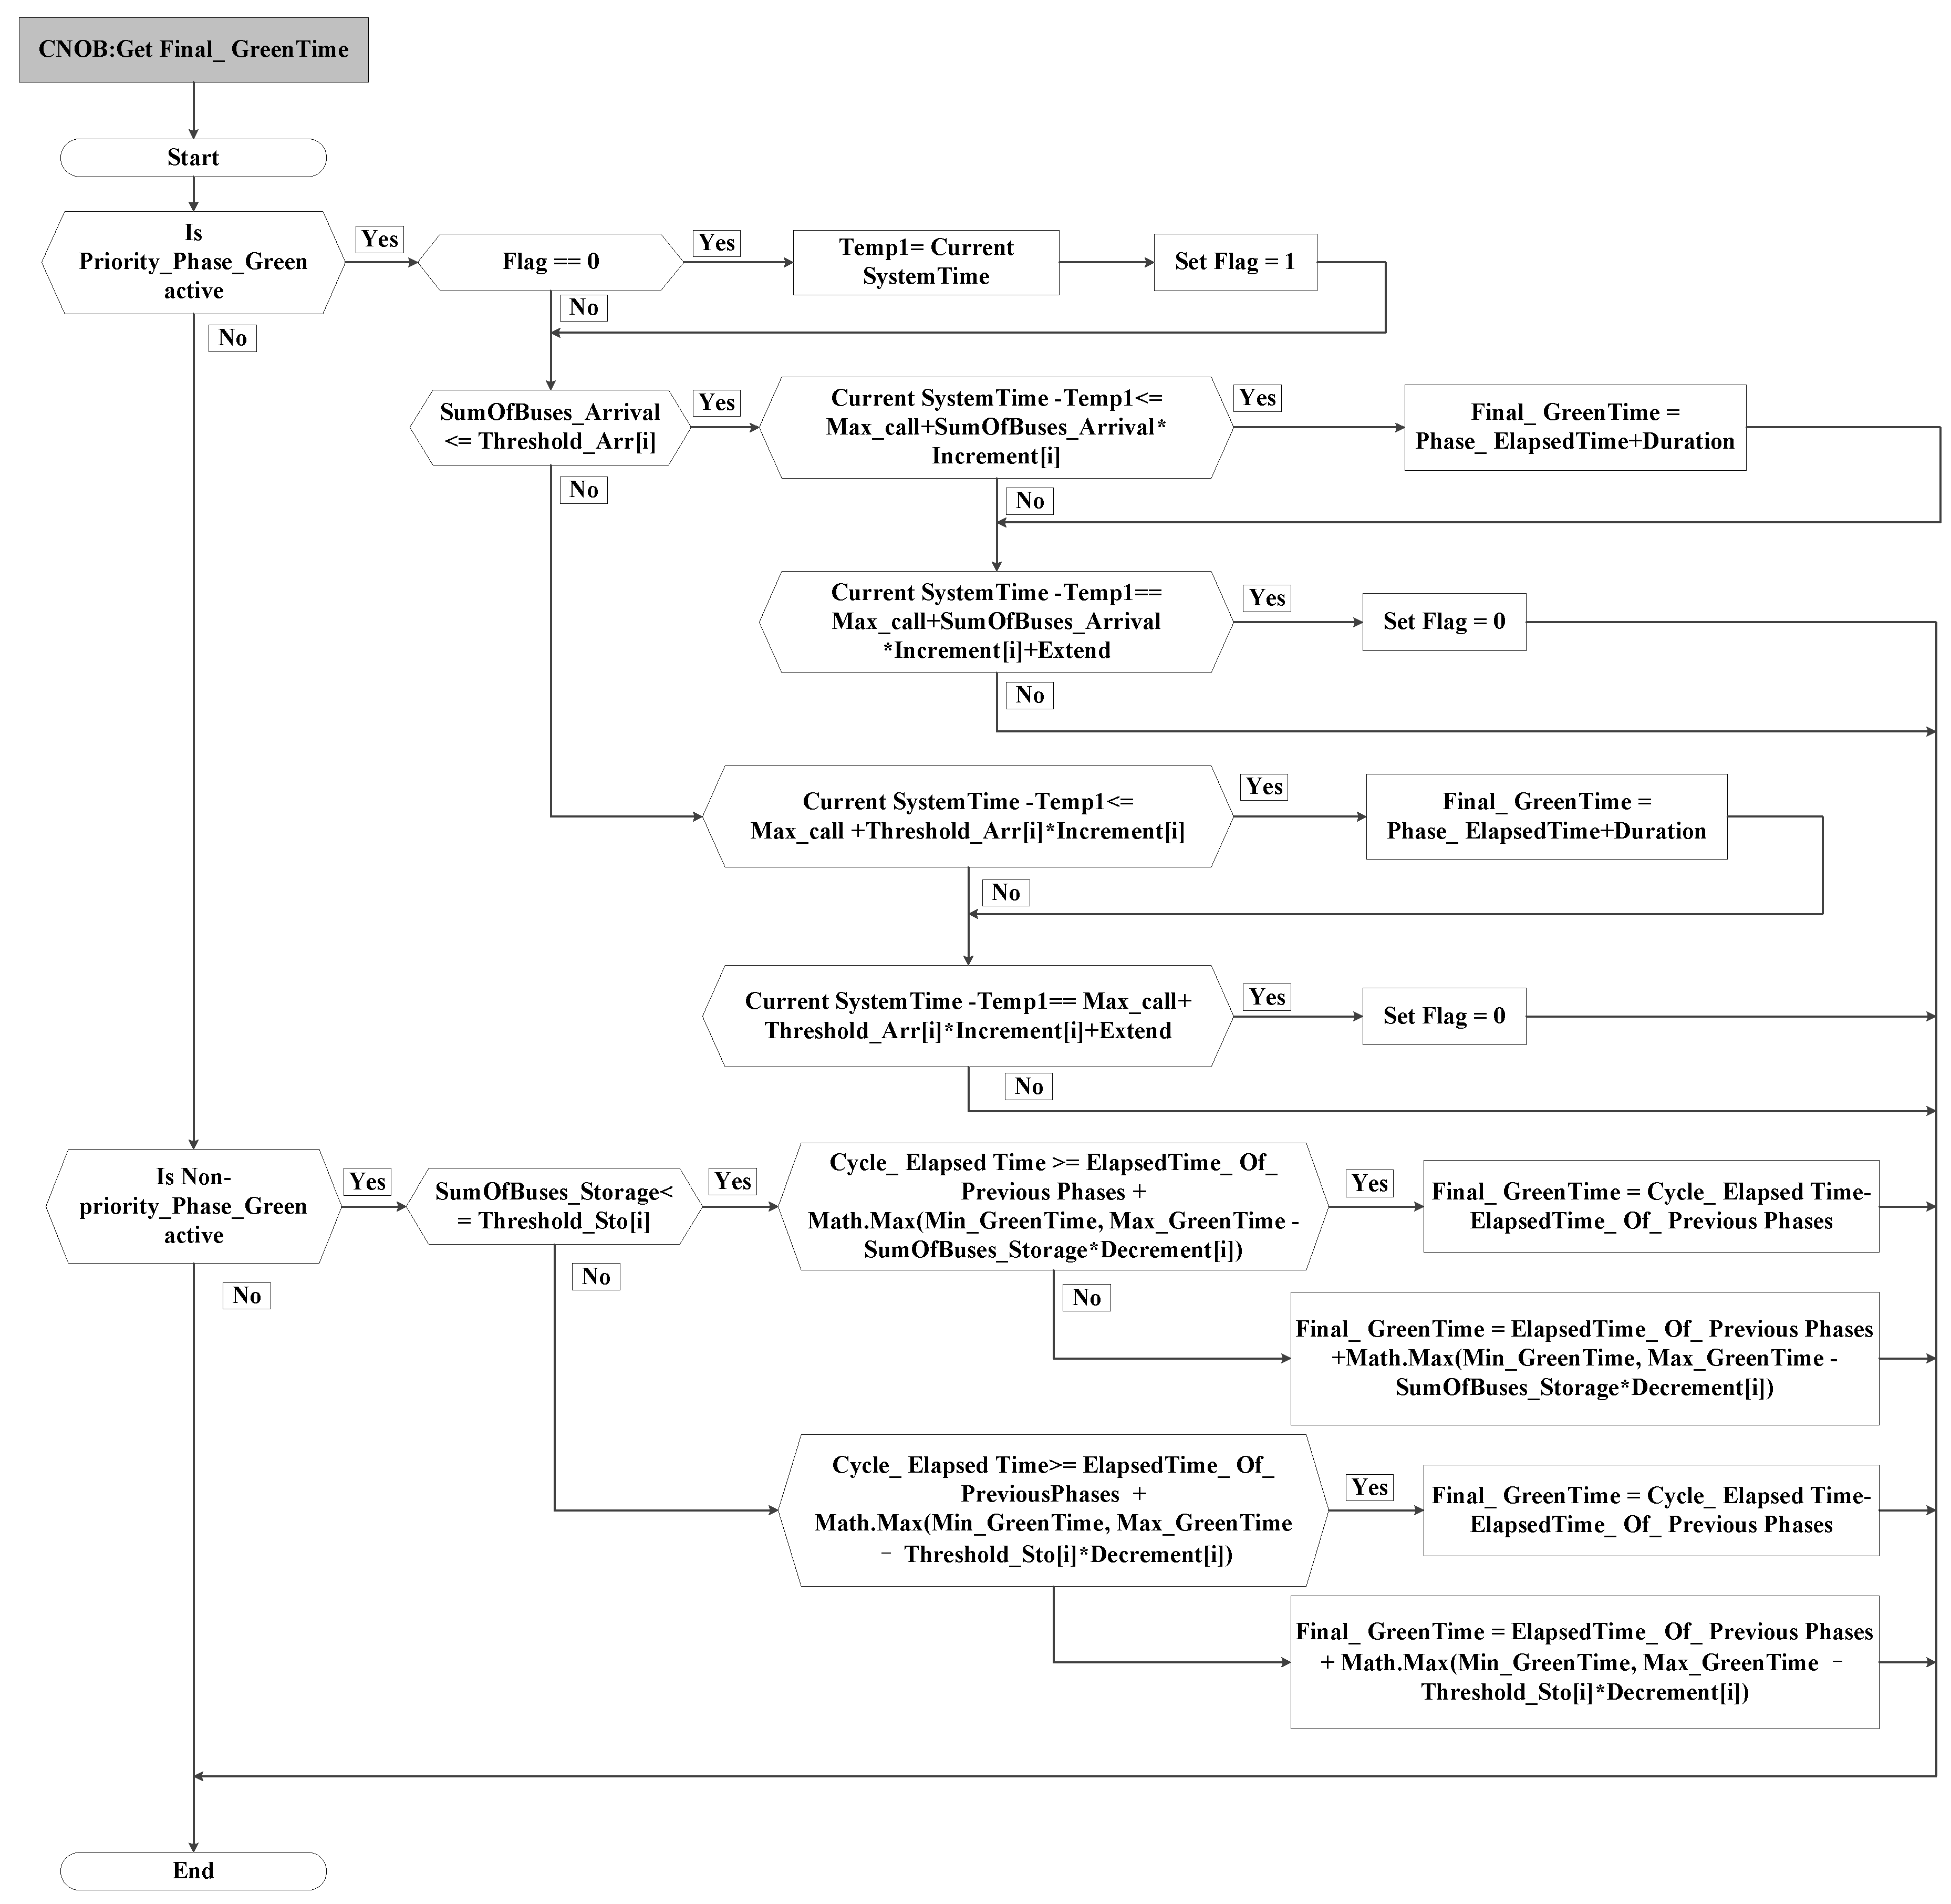
2.2. CNOB TSP Strategy

The CNOB TSP strategy also contains two sub-strategies, one is the green extension strategy for the priority phase, and the other is the early green strategy for the non-priority signal strategy.
Figure 1 shows the bus detection line settings of the CNOB TSP strategy. The detection of buses passing the detection line can be implemented by a GPS-based vehicle positioning system. The FCFS TSP strategy only had the TSP request line. However, the CNOB TSP strategy adds two detection lines onto the basis of the FCFS TSP strategy.
The first detection line is the arrival line. It is used to receive the bus arrival data. The number of bus arrivals between the arrival line and the TSP request line will be used to calculate the value of Max_call time for the priority phase. With the extension of Max_call time, the CNOB TSP strategy can effectively adjust the max call time of the priority phase to match the random arrival of buses and improve the implementation efficiency of green extension strategy for the intersections with a lot of bus arrivals [30].
The second detection line is the departure line. It is used to release the bus data. The number of storage buses between the TSP request line and the departure line will be used to calculate the final green time of the non-priority phase. With the adjustment of control logic, the CNOB TSP strategy will decrease the truncation extent of green time. The early green strategy is better suited for the intersections with a lot of bus arrivals [30].

2.2.1. Priority Phase

The TSP control logic of the priority phase is shown in Figure 2. The final green time of the priority phase relates to the number of bus arrivals in the arrival sections (shown in Figure 1).
(1) No bus arrival
The situation is the same as the FCFS TSP strategy (shown in Figure 2).
(2) Bus arrival
If at least one bus enters into the arrival section, the final green time relates to six key TSP parameters, Max_call time, SumOfBuses_Arrival, Threshold_Arr[i], Increment[i], Extend time, Duration time (the parameter explanations are shown in Table 1). The Max_call time will be extended by parameters SumOfBuses_Arrival, Threshold_Arr[i], and Increment[i]. With the extension setting, the final green time of the priority phase will be sensitive to the number of bus arrivals (shown in Figure 1).
Figure 5 shows the calculation process of parameter SumOfBuses_Arrival. The number of buses in the arrival section is the value of parameter SumOfBuses_Arrival. The parameter Threshold_Arr[i] is used as a limit to prevent an excessive increase of Max_call time.
If the value of SumOfBuses_Arrival is less than the value of Threshold_Arr[i] and the headway of bus arrival is less than the sum of Max_call time, and SumOfBuses_Arrival multiplied by Increment[i], the final green time of the priority phase will increase by a Duration time (shown in Figure 6). If the value of SumOfBuses_Arrival is larger than the value of Threshold_Arr[i] and the headway of bus arrival is less than the sum of Max_call time and Threshold_Arr[i] multiplied by Increment[i], the final green time of the priority phase will increase by a Duration time (shown in Figure 6).
If the value of SumOfBuses_Arrival is less than the value of Threshold_Arr[i] and the headway of bus arrival is larger than the sum of Max_call time, Extend, and SumOfBuses_Arrival multiplied by Increment[i], the signal controller will accept the TSP requests again (shown in Figure 6). If the value of SumOfBuses_Arrival is larger than the value of Threshold_Arr[i] and the headway of bus arrival is larger than the sum of Max_call time, Extend, and Threshold_Arr[i] multiplied by Increment[i], the signal controller will accept the TSP requests again (shown in Figure 6).

2.2.2. Non-Priority Phase

The TSP control logic of the priority phase is shown in Figure 4. The final green time of the priority phase relates to the number of bus arrivals in the storage sections (shown in Figure 1).
(1) No bus arrival
The situation is the same with the FCFS TSP strategy (shown in Figure 4).
(2) Bus arrival
If at least one bus enters the storage section, the final green time relates to three key TSP parameters, SumOfBuses_ Storage, Threshold_Sto[i], Decrement[i] (the parameter explanations are shown in Table 1). With the adjustment of the early green strategy, the final green time of the non-priority phase will be sensitive to the number of buses that are still waiting before the intersection stop line (shown in Figure 1).
Figure 6 shows the calculation process for the final green time of the non-priority phase. If the value of Cycle_ElapsedTime is less than the sum of ElapsedTime_Of_PreviousPhases and Temp_Green (shown in Formula (1)), the final green time of non-priority phase is equal to ElapsedTime_Of_PreviousPhases plus Temp_Green (shown in Figure 6). Otherwise, the final green time of the non-priority phase is equal to Cycle_ElapsedTime minus ElapsedTime_Of_PreviousPhases (shown in Figure 6).
T e m p _ G r e e n = M a t h . M a x { M i n _ G r e e n T i m e M a x _ G r e e n T i m e N u m b e r _ B u s e s D e c r e m e n t [ i ]
N u m b e r _ B u s e s = { S u m O f B u s e s _ S t o r a g e S u m O f B u s e s _ S t o r a g e < T h r e s h o l d _ S t o [ i ] T h r e s h o l d _ S t o [ i ] S u m O f B u s e s _ S t o r a g e > = T h r e s h o l d _ S t o [ i ]
Formula (1) is the calculation formula of temporary parameter Temp_Green. The temporary parameter Number_Buses in Formula (1) is shown in Formula (2). In Formula (2), the number of buses in the storage section is the value of parameter SumOfBuses_Storage (shown in Figure 5). The parameter Threshold_Sto[i] is used to limit the excessive decrease of the final green time.

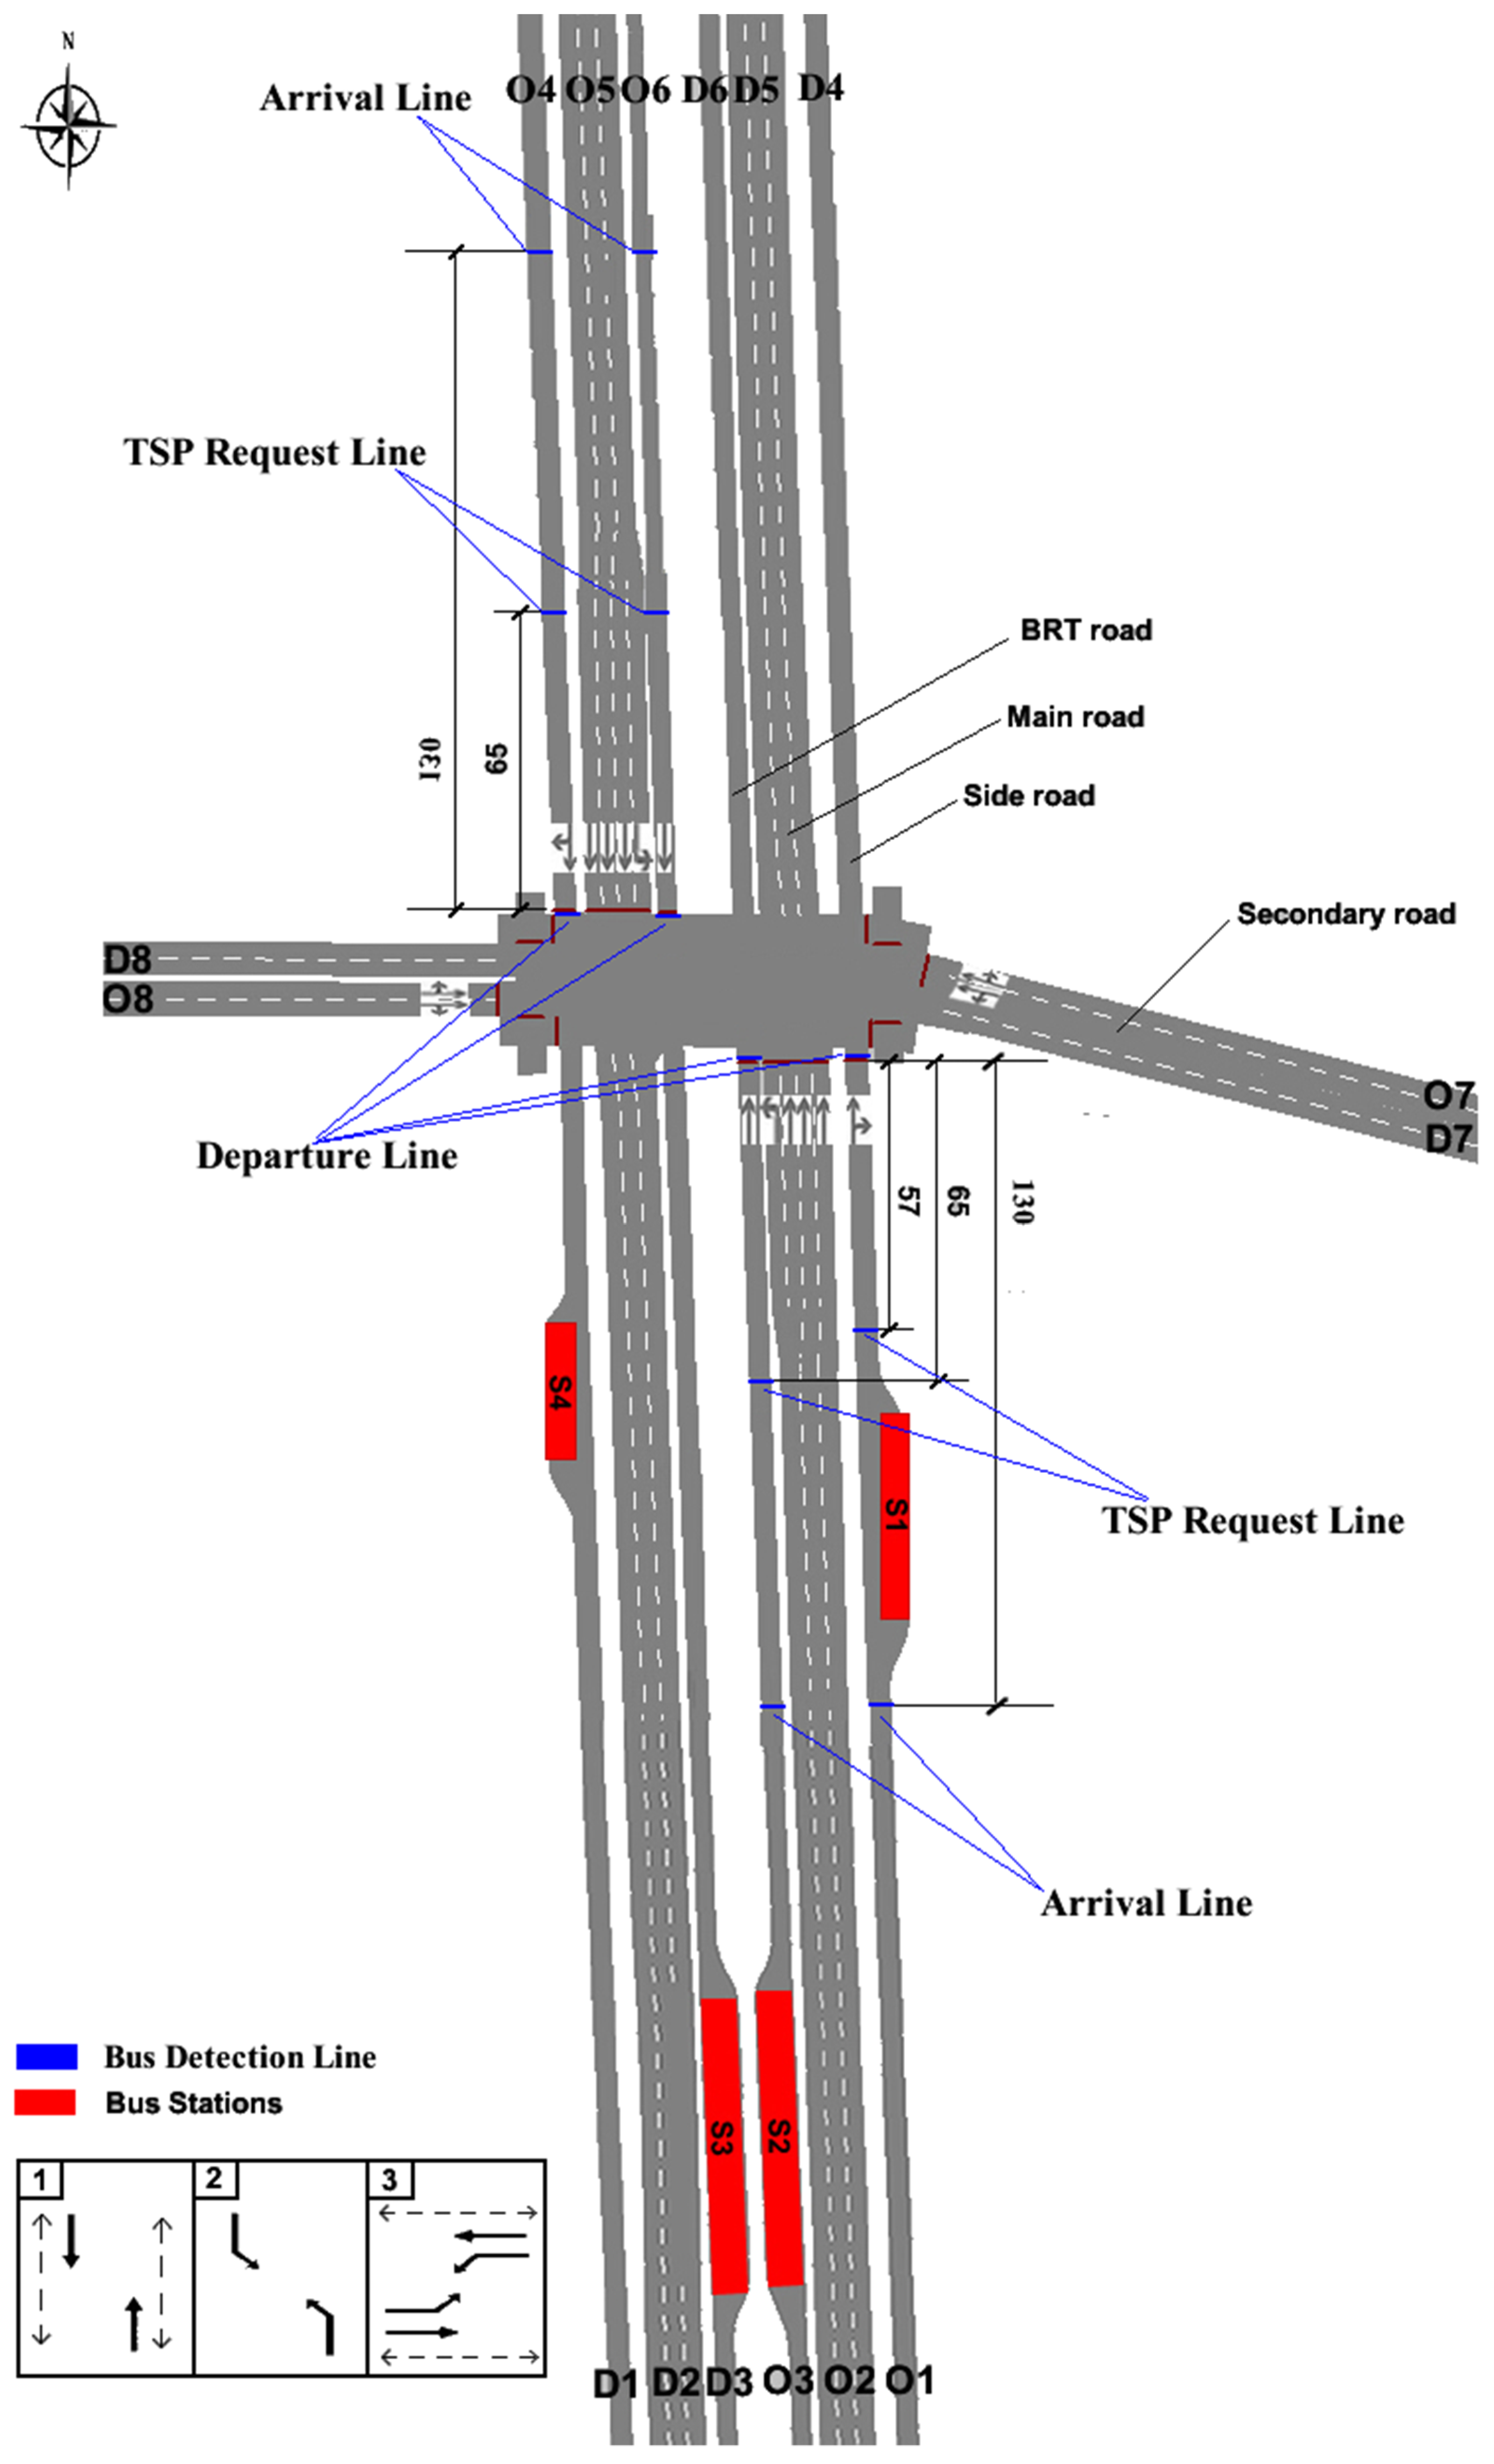
3. Experiment Design

This paper used VISSIM (abbreviations refer to German words, meaning Traffic in cities - simulation model software, which is developed by PTV Co., Ltd., Karlsruhe, Germany) to evaluate the effect of the CNOB TSP strategy. It used Visual Studio 2015-C# and VISSIM-COM programming to model all the TSP strategy experiments. VISSIM is a behavior-based discrete traffic simulator that is powerful in the evaluation of TSP strategies and scenarios [1,8]. Compared with the micro-simulation software (e.g., CORSIM, which is developed by Federal Highway Administration, US, and AIMSUN, which is developed by Aimsun SL Co., Ltd., Barcelona, Spain), VISSIM is good at modeling public transit systems [34]. VISSIM is well designed for both general vehicles and buses [7,35]. VISSIM is better at modeling bus stop information, bus service operations, and TSP control logic [34]. With COM programming, VISSIM can model most user-defined signal control logic [34,36]. We used VISSIM-COM to model the FCFS TSP strategy that is gotten from Siemens 2070 signal controller by the Hardware-in-the-loop simulation [23]. Based on the control logic of the FCFS TSP strategy, we also used VISSIM-COM to model the CNOB TSP strategy.

3.1. Simulation Intersection

The simulated intersection is located in Beijing. It is the intersection of Nanyuan arterial road and Jiujingzhuang Avenue. Figure 7 illustrates the map of the intersection geometry unit in meters. There are two isolated lanes in the middle of Nanyuan arterial road. These two lanes are only used for the bus rapid transit (BRT) vehicles. The arrival lines were placed 130 m upstream of the intersection stop lines. The TSP request lines were placed 57 or 65 m upstream of the intersection stop lines. The bus stops on the regular lanes were set by lay-by type.

3.2. Traffic Demand and Occupancy

Traffic data was collected from 17:00 to 19:00. The traffic volume was counted during the length of the fixed signal cycle (184 s). The vehicle composition mainly consisted of general vehicles, regular buses, BRT (Bus Rapid Transit) vehicles, and pedestrians. The labels of origin and destination (OD) zones are shown in Figure 7. According to the results of traffic statistics, the traffic demand OD of general vehicles is shown in Table 2, the traffic demand OD of BRT vehicles and regular buses is shown in Table 3. In Table 3, the columns “O1–D4” and “O4–D1” relates to the regular buses. The columns “O3–D6” and “O6–D3” relate to the BRT vehicles. The total volume of pedestrians and bikes was 3600 ped/h. The ratio between pedestrians and bikes is two to three. The occupancy of vehicle types in different lanes is shown in Table 4.

3.3. Experiment Plan

The effect of the CNOB TSP strategy will be compared with the FCFS TSP strategy. The evaluation process was conducted through the following steps:
Step-1: Performance comparison among the signal timing of the FCFS TSP strategy, the signal timing of the CNOB TSP strategy and the optimized signal timing of the FCFS TSP strategy by VISSIM-based genetic algorithm optimization (VGAO).
Step-2: Sensitivity analysis between the CNOB TSP strategy and the FCFS TSP strategy to various proportions of bus priority requests.
The signal phase setting is shown in Figure 7. The first phase is the priority phase. The simulation period is 3600 s. The TSP signal timings of Step-1 and Step-2 are shown in Table 5. They were run 10 times with different simulation random seeds and took the mean as the test results. The average delay per person (the average delay per person at the intersection can be acquired from VISSIM simulation) was used to evaluate the performance of different TSP signal timings. The findings show that the average delay per person represents a suitable objective function for the TSP evaluation to minimize the negative impact on the entire intersection [8,37,38].
In Step-1, VGAO can efficiently search for the best solution because of the signal timing evolution and the high-fidelity VISSIM simulation [7,8]. Genetic algorithm is a stochastic search algorithm based on natural genetics and the mechanisms of natural selection [4,39,40]. The VGAO is good at solving the problems of combinatorial optimization and uncertain optimization [4]. It has proven to be an effective methodology to optimize traffic signal timing [7,8]. To ensure a fair comparison, compared with the signal timing of the FCFS TSP strategy without VGAO, each signal phase of VGAO for the FCFS TSP strategy has the max variation range of green time (shown in Table 5). The VGAO for the FCFS TSP strategy firstly optimizes the basic signal timing parameters, and then optimizes the TSP parameters. The optimization process uses an average delay per person as its fitness [23]. The values of VGAO parameters were as follows: The maximum number of generations was 50, the total number of populations was 30, the protection number of populations was 6, the elimination number of populations was 3, the crossover number of populations was 12, the mutation number of populations was 3, the convergence threshold was 1.
In Step-2, the different proportions of bus TSP requests were chosen to run the signal timing of the FCFS TSP strategy and the CNOB TSP strategy. The proportions of bus priority requests in Table 4 were 20%, 40%, 60%, 80%, 100%, respectively.
In addition, active TSP control essentially belongs to inductive signal control. The control effect will be changed by the real-time arrival data of traffic flow, especially by the random arrival of buses. However, the results of VGAO are only effective for the given traffic flow data and cannot reflect the real-time changes in traffic flow. Therefore, the result of VGAO for the FCFS TSP strategy is only used as a reference value. The simulation result of the FCFS TSP strategy without VGAO is used as a comparison baseline in all experiments.

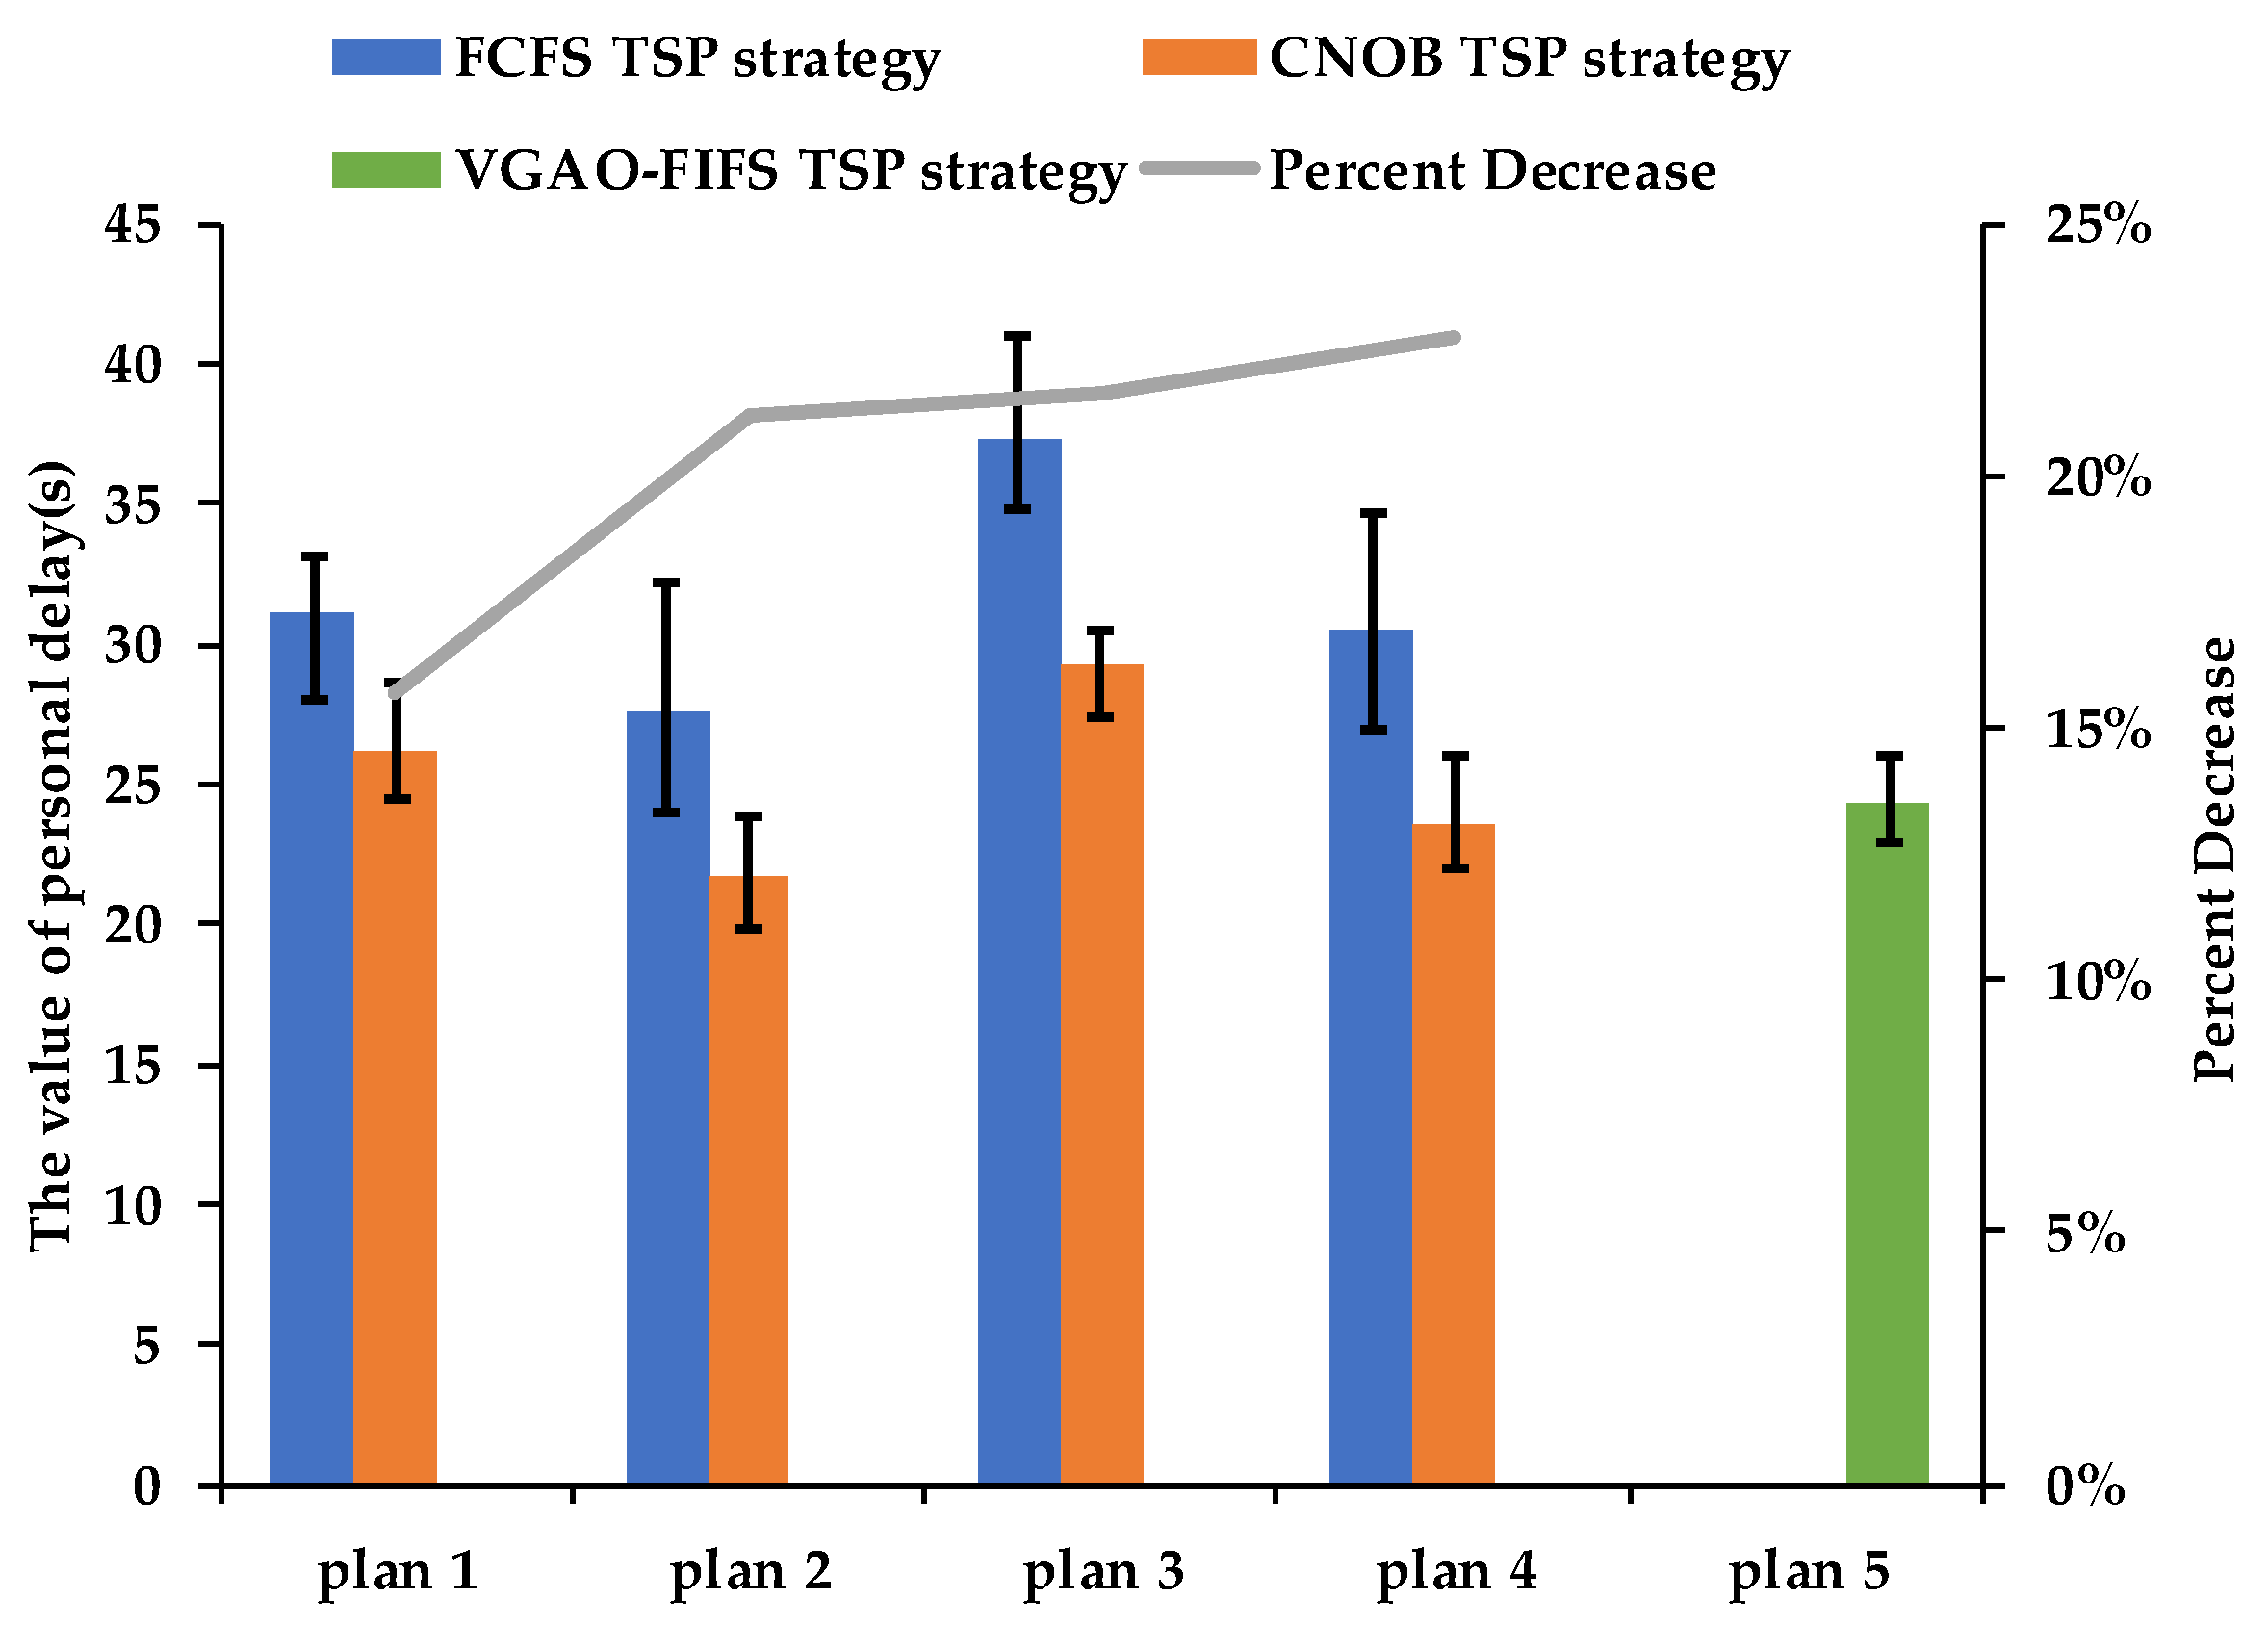
4. Results and Discussion

4.1. Performance Comparison

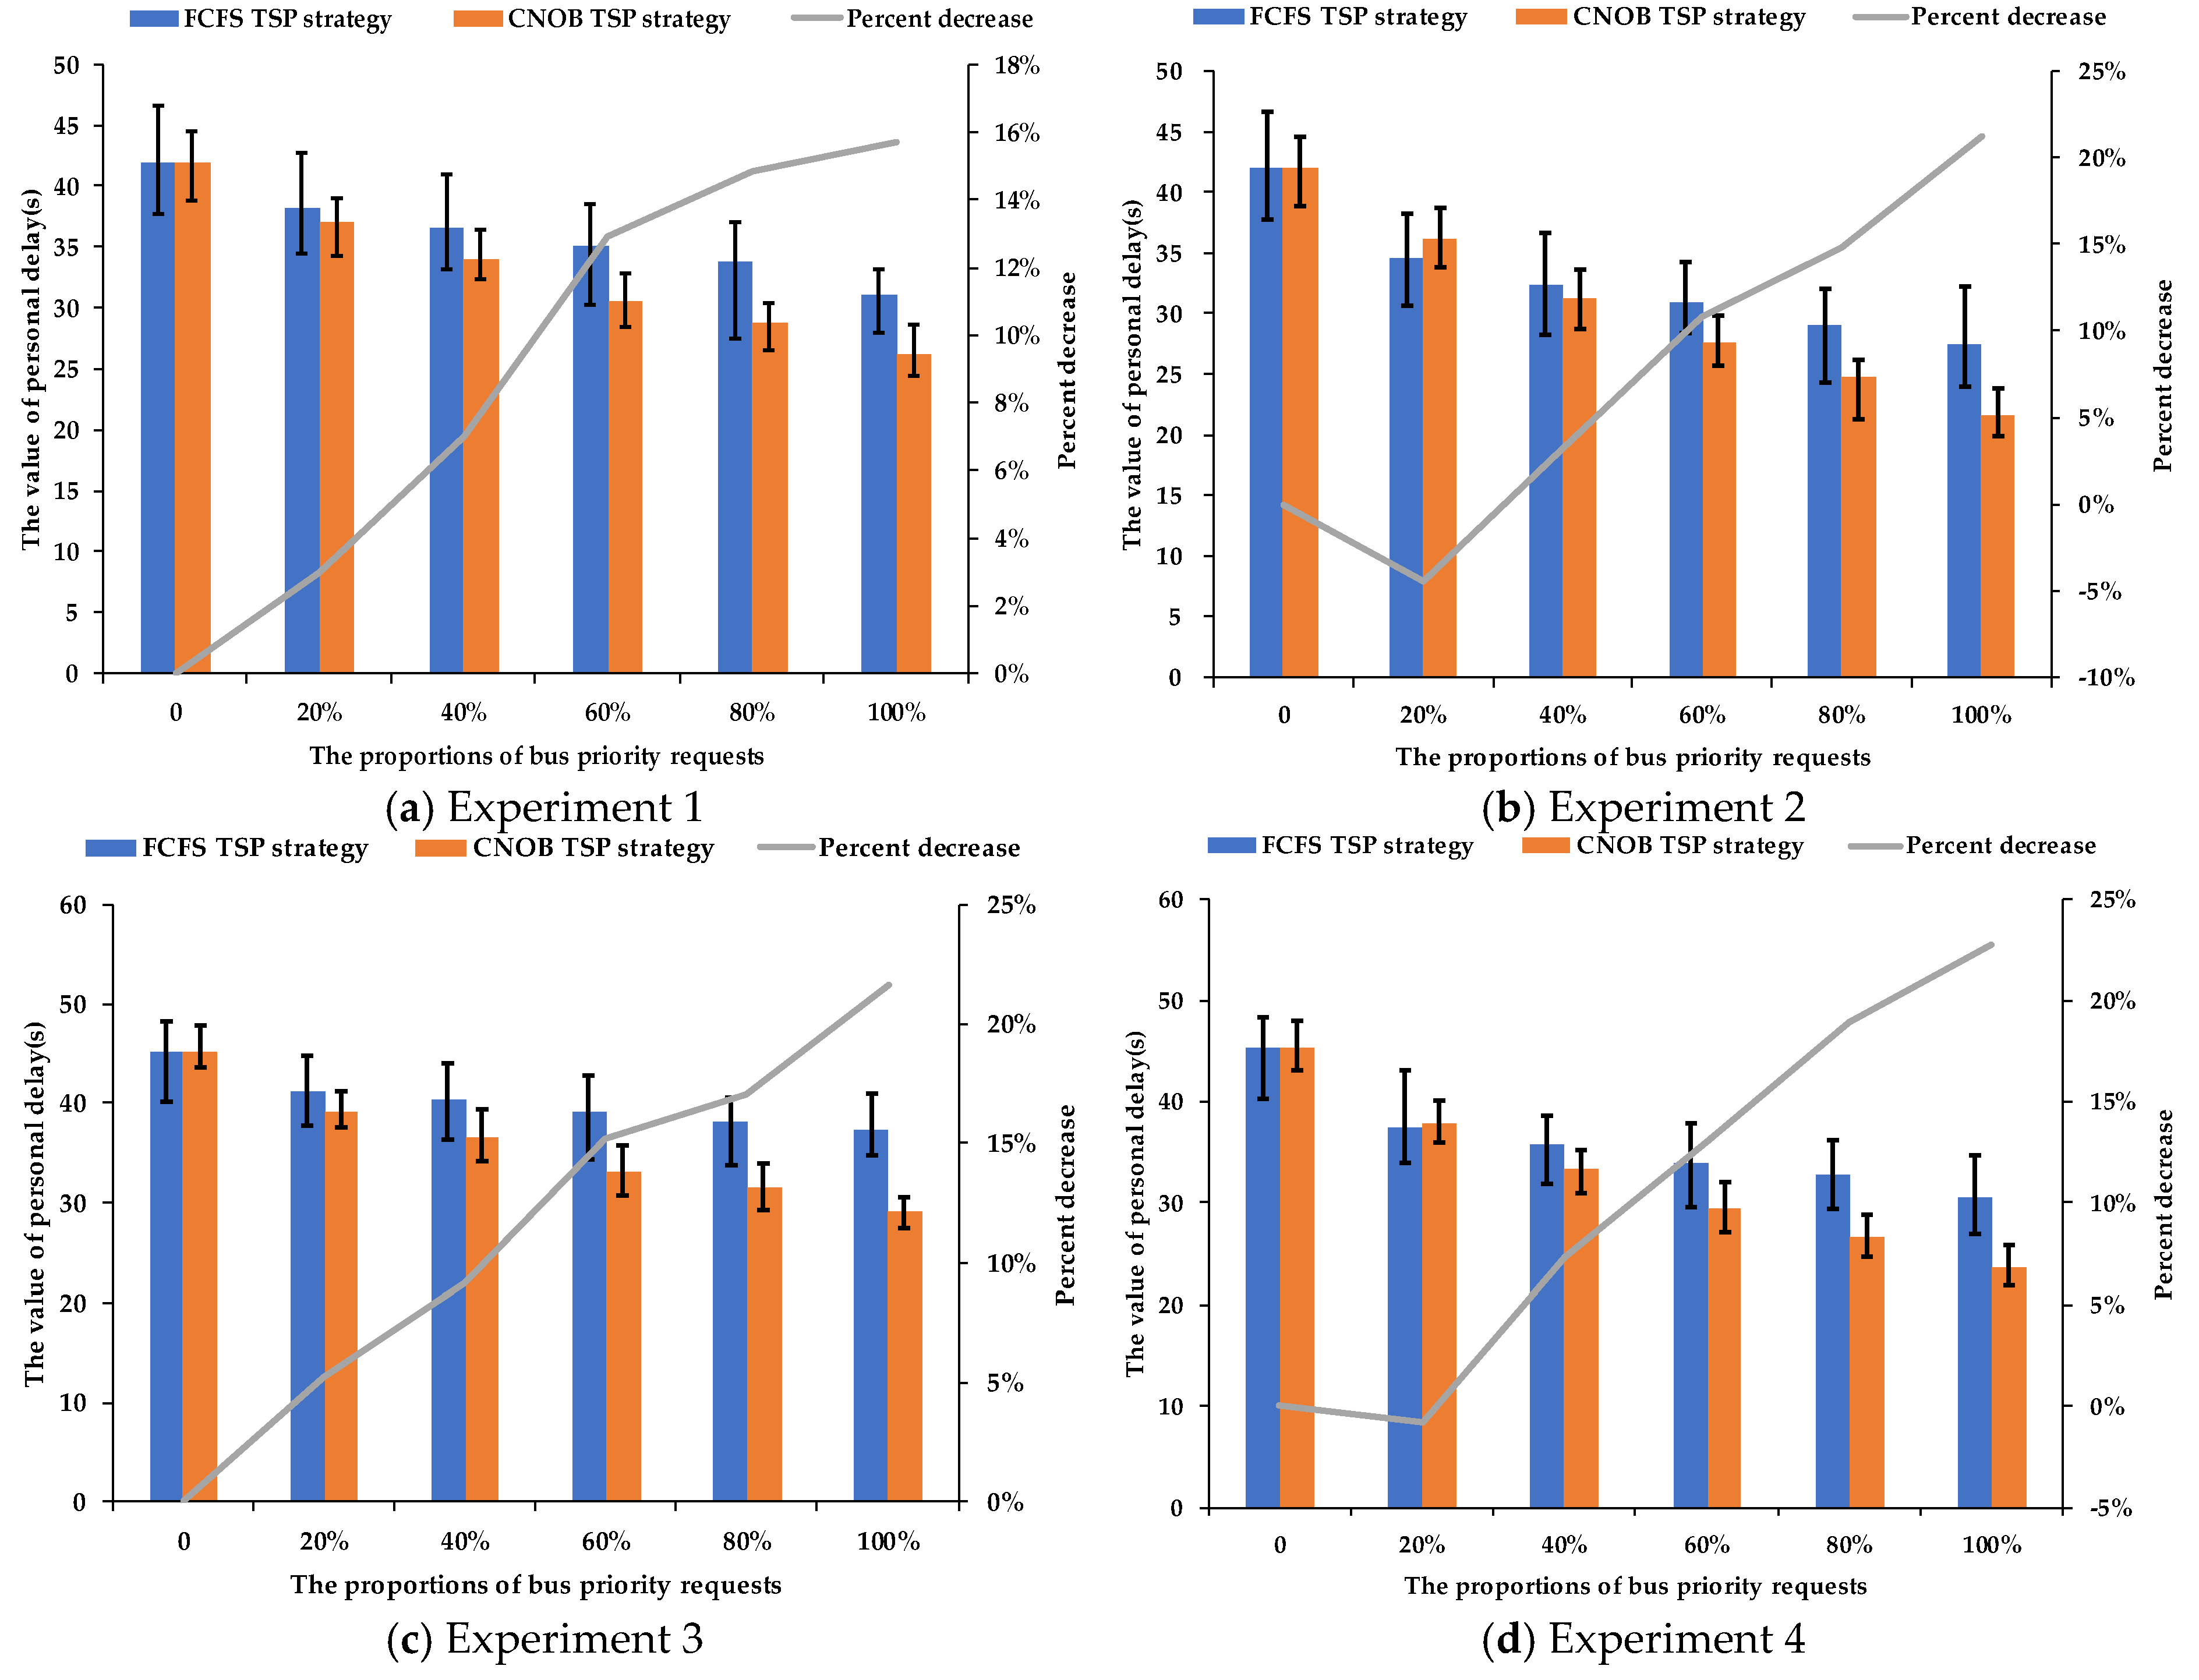
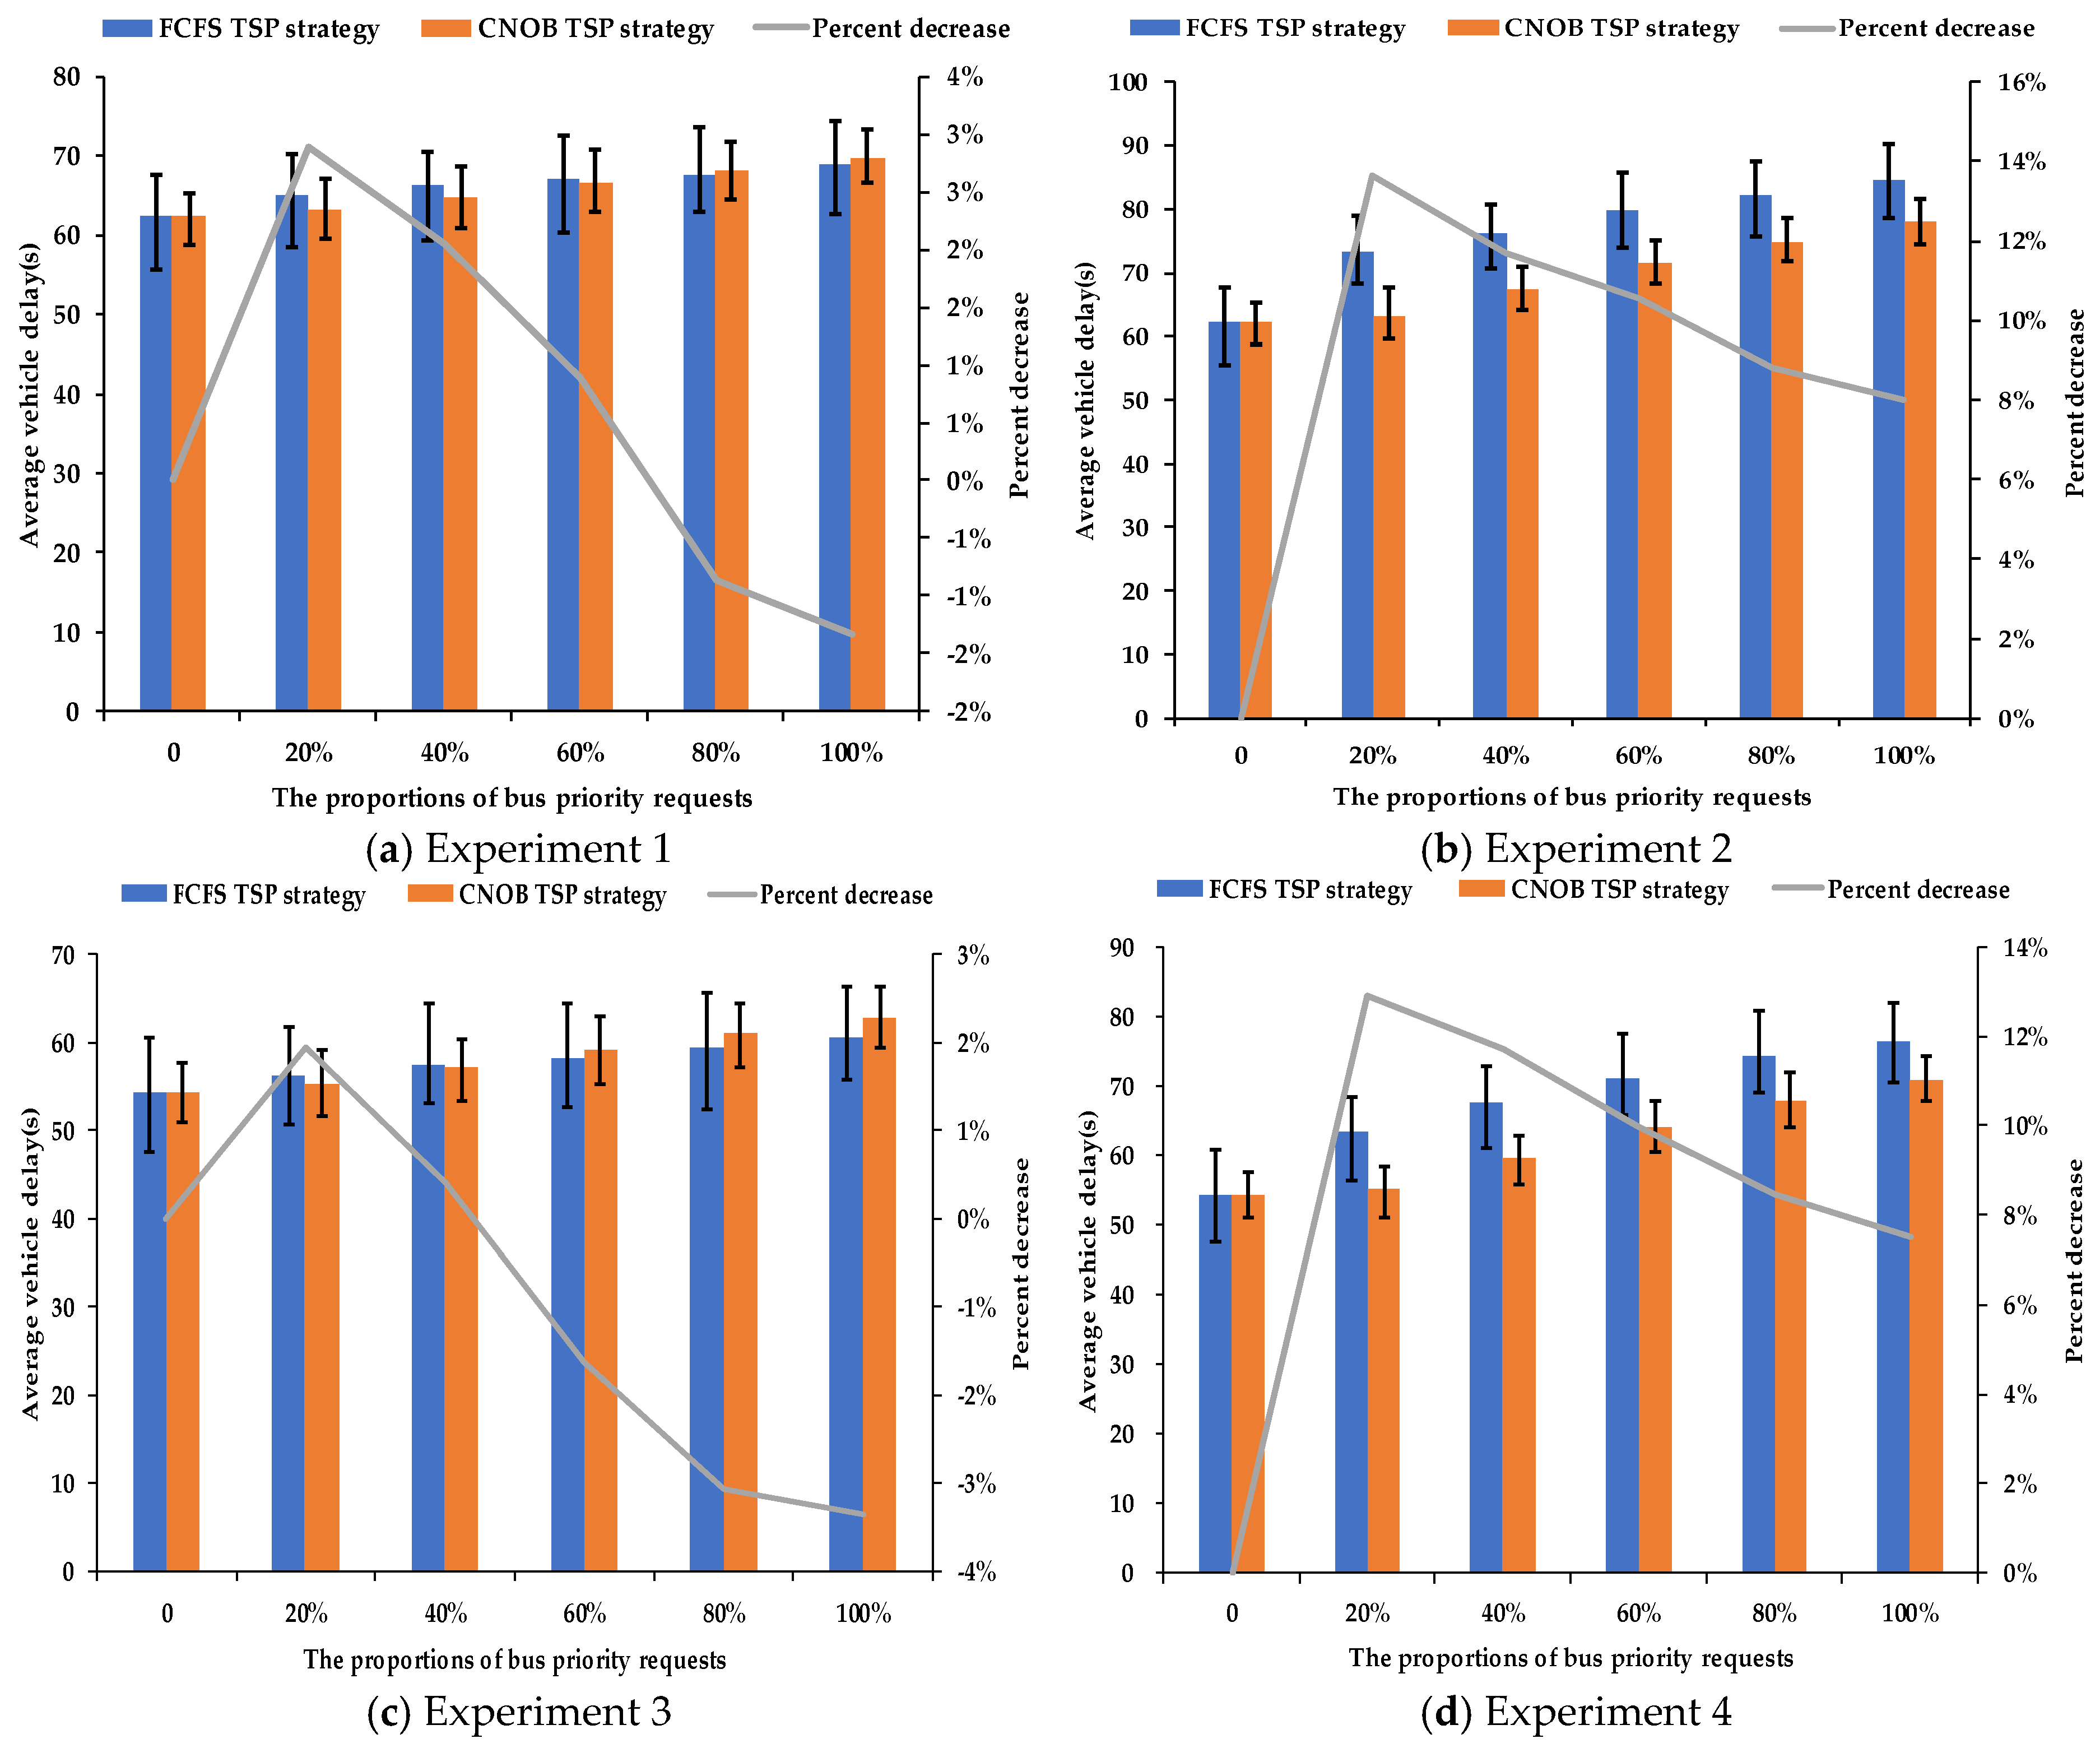
4.1.1. Delay Analysis

From Figure 8 and Figure 9, compared with the signal timing of the FCFS TSP strategy, the CNOB TSP strategy can significantly reduce the average delay per person at the intersection and can get a relatively reasonable value of average vehicle delay for non-priority phases. Experimental data were statistically analyzed by one-way ANOVA. The statistical results (shown in Table 6) indicate that there is a significant difference for average delay per person between the CNOB TSP strategy and the FCFS TSP strategy for each experiment (P < 0.01). For Experiment 2 and Experiment 4, the green time ranges of non-priority phases are relatively large, the average vehicle delay for non-priority phases differs significantly between the CNOB TSP strategy and the FCFS TSP strategy (P < 0.01). However, the situation is the opposite for Experiment 1 and Experiment 3. For Experiment 1 and Experiment 3, the green time ranges of the non-priority phases are relatively small, the average vehicle delay for non-priority phases has no significant difference between the CNOB TSP strategy and the FCFS TSP strategy (P > 0.05). Therefore, the performance of the CNOB TSP strategy will be better at reducing both the average delay per person at the intersection and the average vehicle delay of non-priority phases when the green time ranges of non-priority phases are relatively large.
Compared with the optimized timing of the FCFS TSP strategy by VGAO, the signal timing of the CNOB TSP strategy can produce a small value of average delay per person without using TSP optimization even when the range of green time is large. Meanwhile, it can produce a relatively reasonable value of average vehicle delay for non-priority phases. Therefore, the above analysis shows that the CNOB TSP strategy can not only significantly reduce the average delay per person without using TSP optimization but can also reduce the adverse impact on the general vehicles of non-bus-priority approaches for the intersections with a lot of bus arrivals.

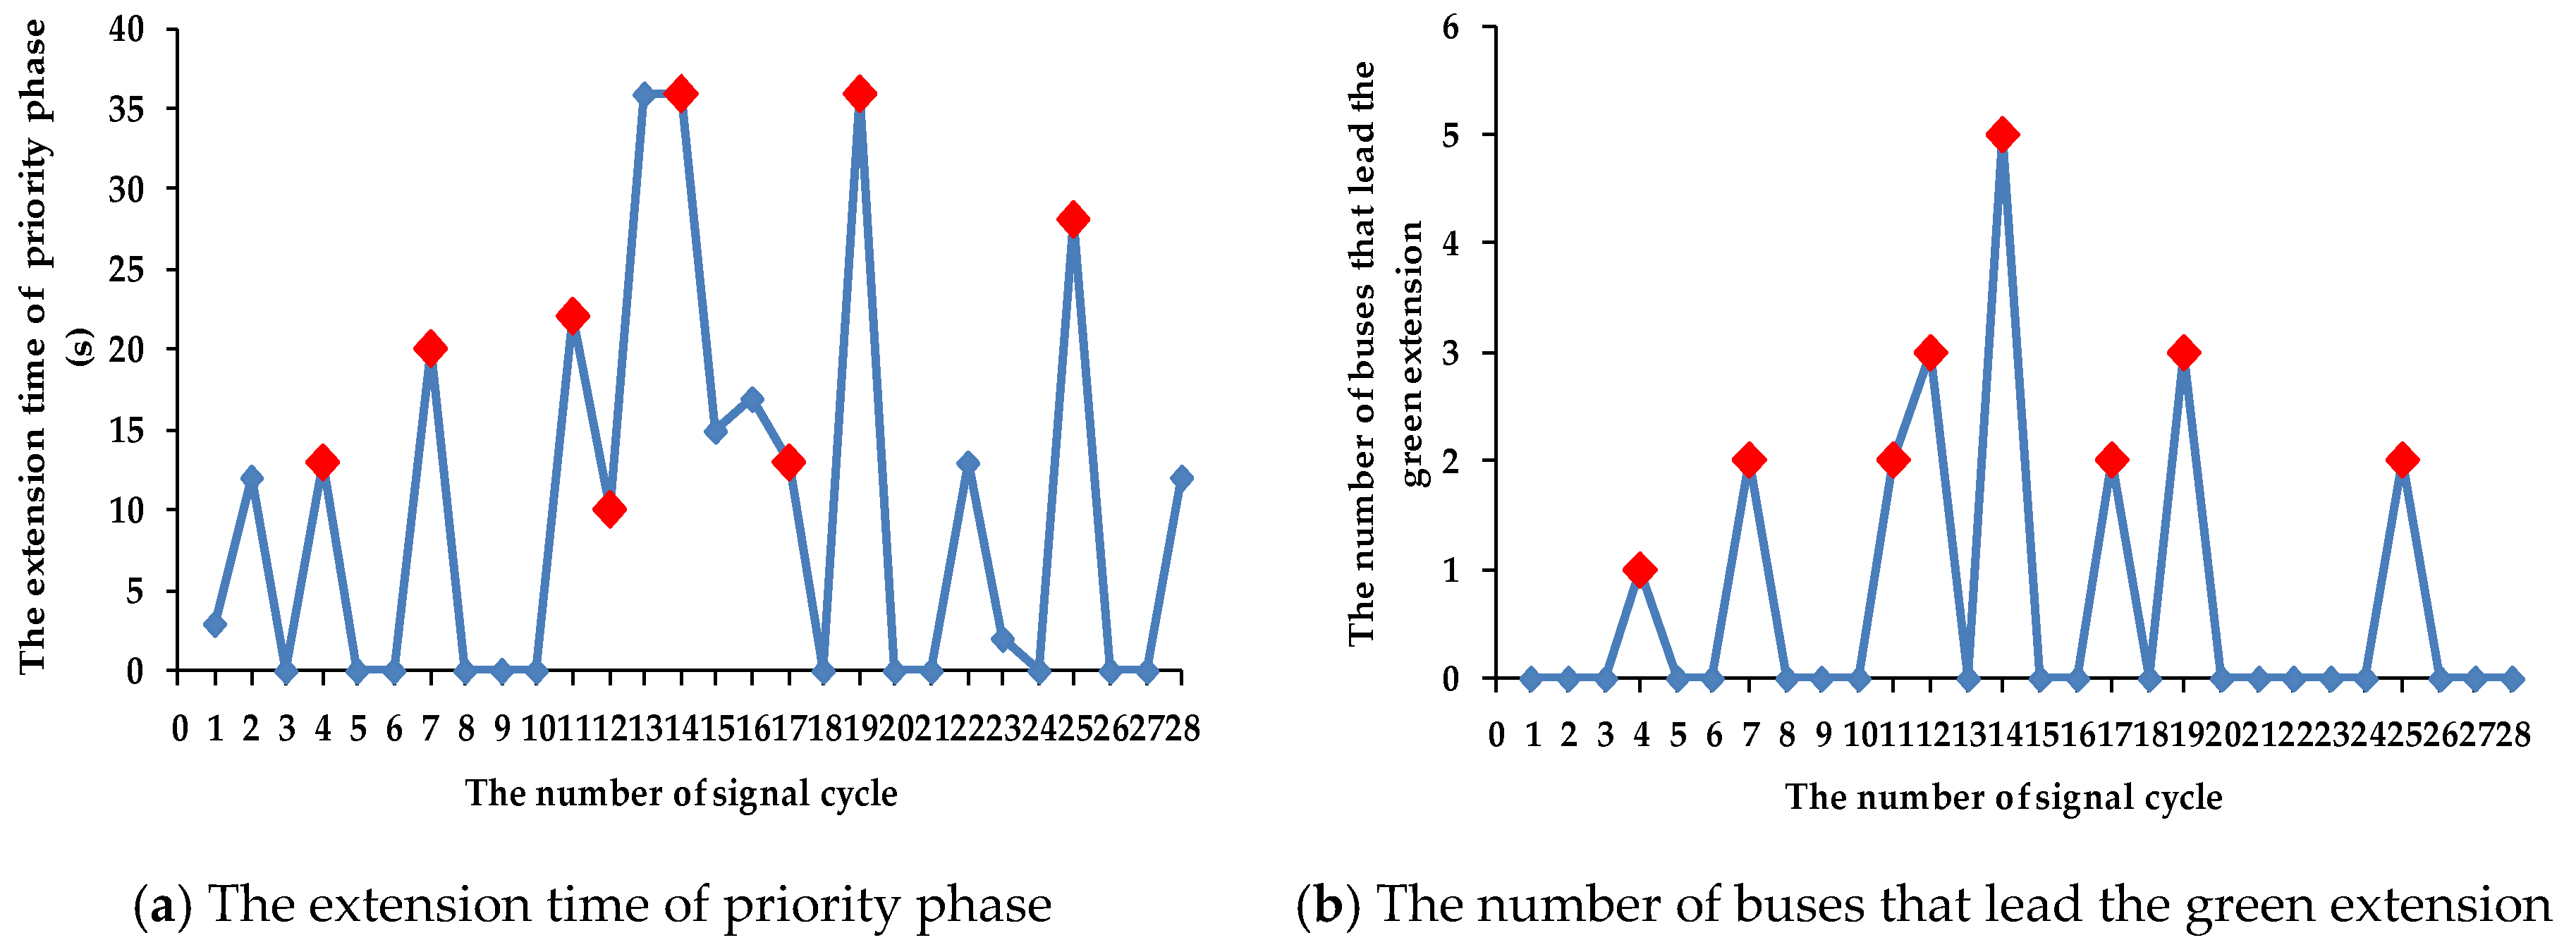
4.1.2. Green Extension Analysis

Figure 10 shows the green extension time of the first phase (the priority phase). There are 16 signal cycles out of the 28 total signal cycles with extended green time after their minimum green time has elapsed. Within these 16 signal cycles, there are eight signal cycles where the extended green time was caused by the existence of buses in the arrival section. This shows that the CNOB TSP strategy can significantly improve the implementation efficiency of the green extension strategy. In addition, the other eight signal cycles extend the green time because buses arrived at the TSP request lines at the right time (shown in Figure 1). There are two reasons for this. One is buses randomly arrive at TSP request lines. The other one is the combined effect of different TSP parameters such as Max_call, Extend, and Duration [24].

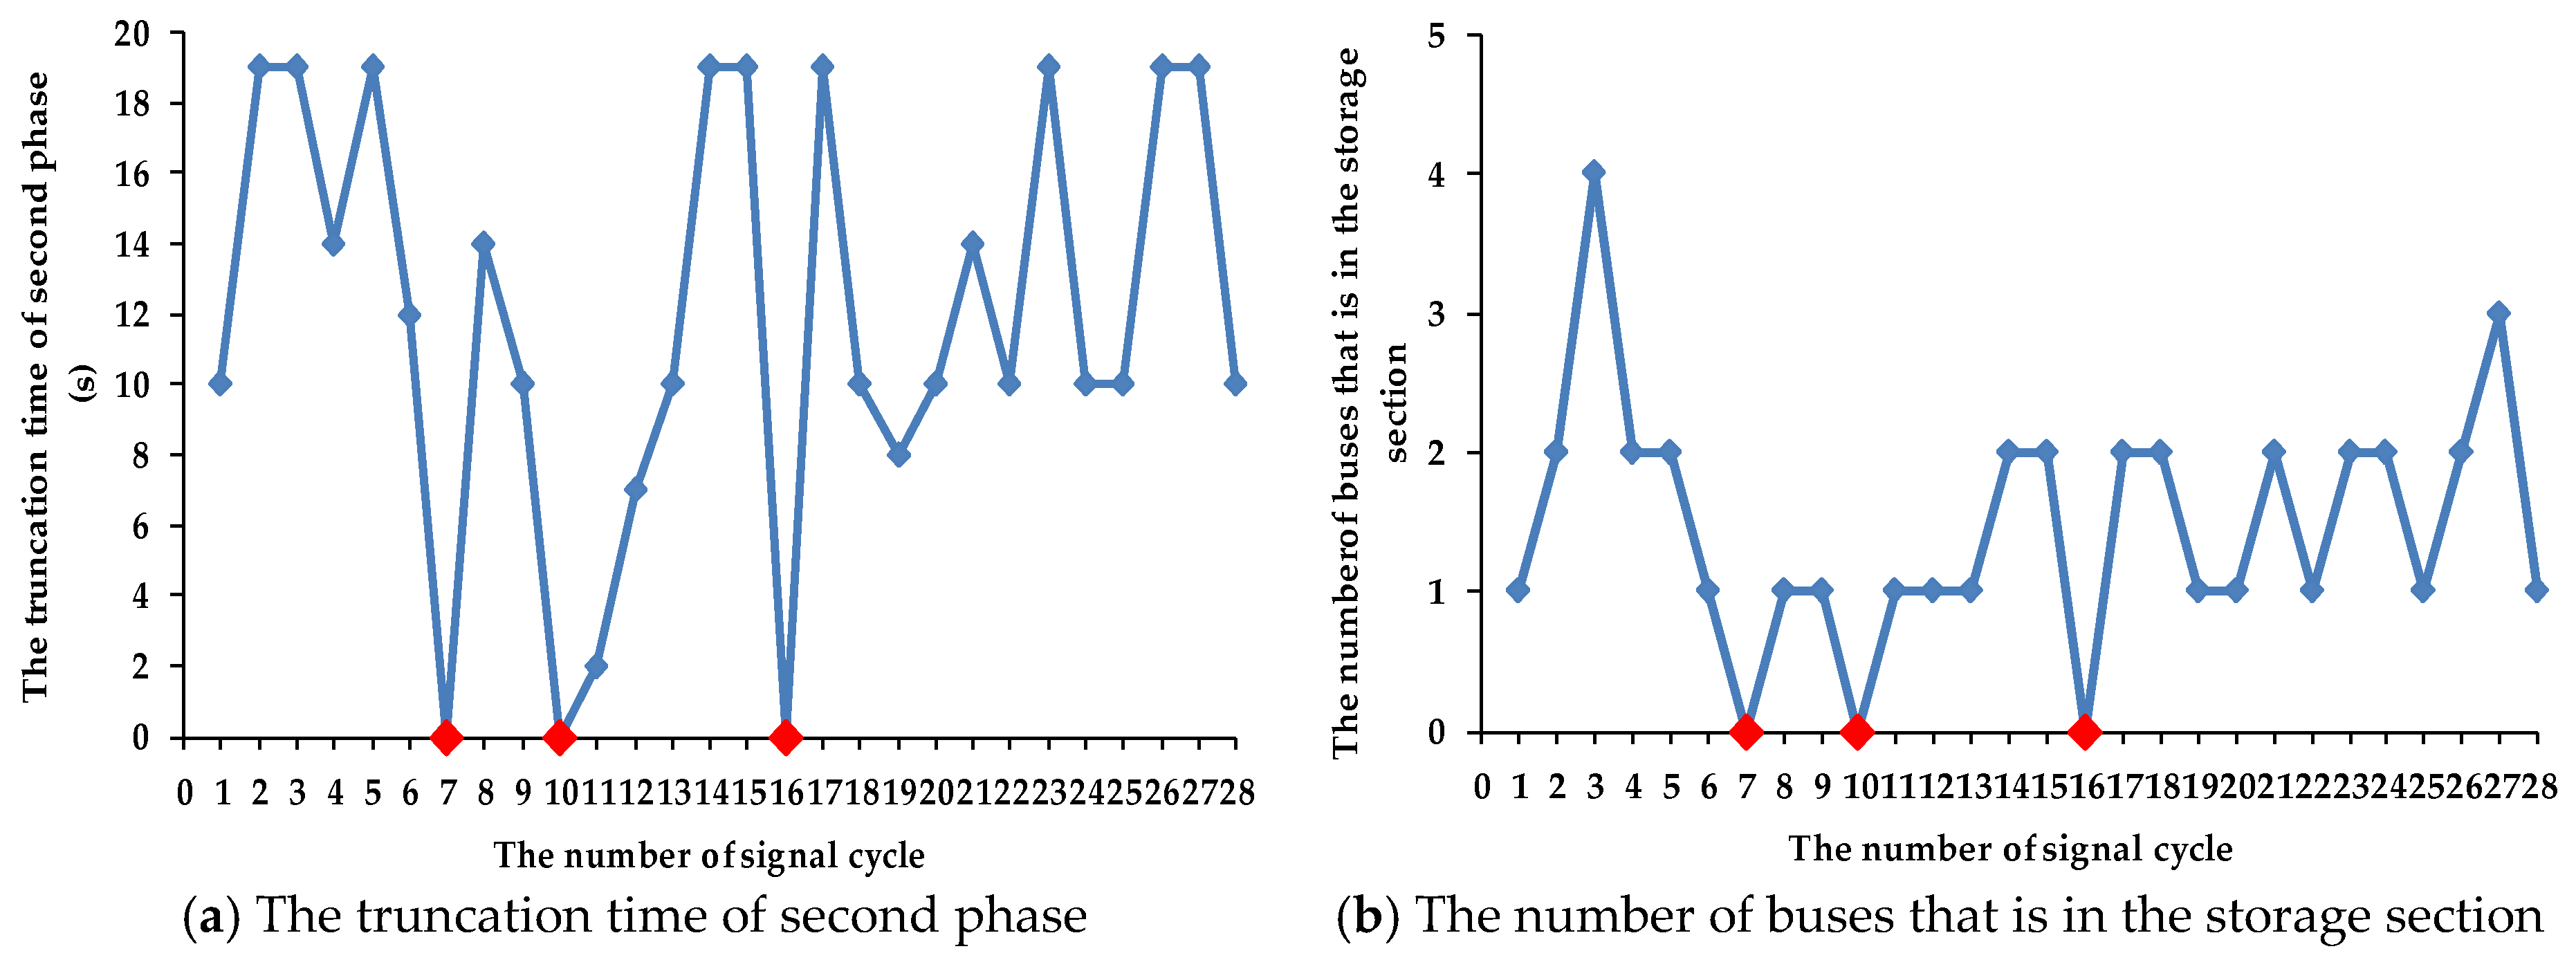
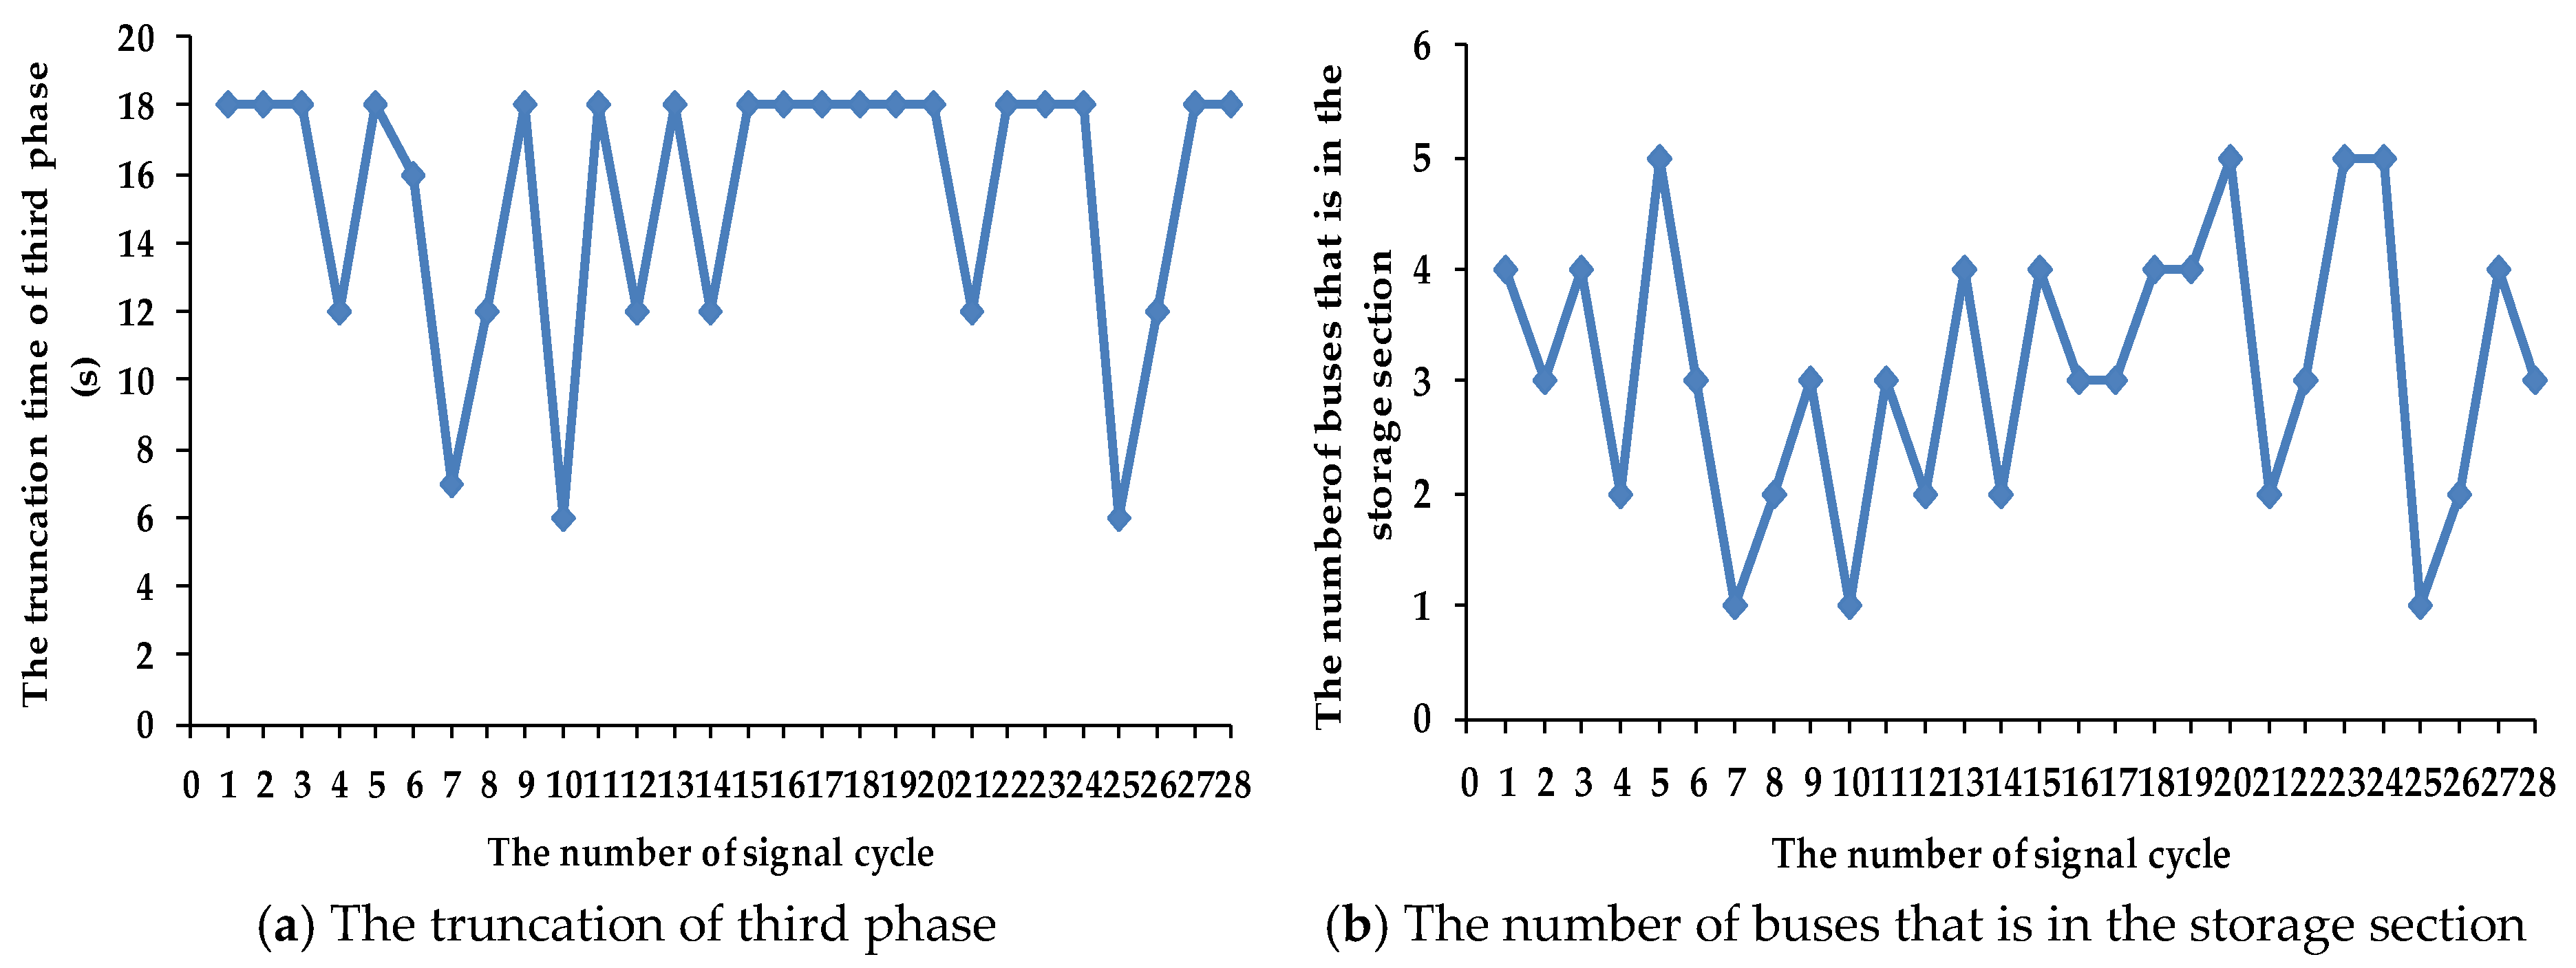
4.1.3. Early Green Analysis

Figure 11 and Figure 12 show the truncation time of the second and third phase. If no buses exist in the storage section, the truncation time of non-priority will be zero. The remaining signal cycles will truncate the green time according to the number of buses in the storage section. From Figure 11 and Figure 12, the variation trend of truncation time matches the number of buses in the storage section well. This shows that the CNOB TSP strategy can significantly improve the implementation efficiency of an early green strategy. In addition, the greater the elapsed time of the signal cycle, the larger the number of buses in the storage section is. The number of buses in the storage section in the third phase is larger than in the second phase. Therefore, the value of parameter Threshold_Sto[i] (shown in Table 1) is changed from small to large. The value of parameter Decrement[i] (shown in Table 1) is changed inversely. This setting can also improve the implementation efficiency of the early green strategy.

4.2. Sensitivity Analysis

From Figure 13, the average delay per person for the CNOB TSP strategy is lower than the FCFS TSP strategy in different priority request proportions. Compared with the FCFS TSP strategy, the percent decrease of average delay per person for the CNOB TSP strategy improves gradually as the priority request proportion increases.
When the priority request proportion is relatively low, the early green strategy will play a major role in the TSP strategy, so the reduced green time of the FCFS TSP strategy is larger than the CNOB TSP strategy. However, the green extension of the CNOB TSP strategy is more effective than the FCFS TSP strategy, so the increased green time of the CNOB TSP strategy is larger than the FCFS TSP strategy. Under the combined effect of these two strategies, the gap of average delay per person between the CNOB TSP strategy and the FCFS TSP strategy is relatively small.
When the priority request proportion is relatively high, the final green time of non-priority phases is close to their respective minimum green times, and there is little green time left to reduce. However, in this case, the green extension of the CNOB TSP strategy is more effective than the FCFS TSP strategy, so the gap of average delay per person between the CNOB TSP strategy and FCFS TSP strategy becomes larger as the priority request proportion increases. Therefore, the variation trend of average delay per person shows that the CNOB TSP strategy can improve the TSP implementation efficiency for the intersections with a lot of bus arrivals.
If the maximum green time equals the minimum green time for a signal phase, with or without the active TSP, the control effect will have no change. Therefore, from Figure 14, when the green time ranges of the non-priority phases are relatively small (Experiment 1 and Experiment 3), the average vehicle delay of non-priority phases for the CNOB TSP strategy is close to the FCFS TSP strategy in different priority request proportions.
On the contrary, from Figure 14, when the green time ranges of the non-priority phases are relatively large (Experiment 2 and Experiment 4), the average vehicle delay of non-priority phases for the CNOB TSP strategy is lower than the FCFS TSP strategy in different priority request proportions. Therefore, when the green time ranges of non-priority phases are relatively large, the variation trend of average vehicle delay shows that the CNOB TSP strategy can significantly reduce the adverse impact on the general vehicles of non-bus-priority approaches for the intersections with a lot of bus arrivals.
Compared with the FCFS TSP strategy, the average vehicle delay of non-priority phases for the CNOB TSP strategy is lower than the FCFS TSP strategy when the priority request proportion is relatively low. Compared with the FCFS TSP strategy, the percent decrease of average vehicle delay for the CNOB TSP strategy reduces gradually as the priority request proportion increases. When the priority request proportion is relatively high, the final green time of non-priority phases is close to their respective minimum green times. In this case, there is little green time left to reduce, so the green extension strategy will play a major role in the average vehicle delay of the non-priority phase, and the final green time of the priority phase increases gradually as the number of bus arrivals increases. Therefore, the gap of average vehicle delay for non-priority phases is gradually reduced between the CNOB TSP strategy and the FCFS TSP strategy as the priority request proportion increases. The average vehicle delay of non-priority phases for the FCFS TSP strategy may even be lower than the CNOB TSP strategy as the number of bus arrivals continuously increases.

5. Conclusions

In this paper, we proposed the CNOB TSP strategy based on the Siemens 2070 signal controller to improve the TSP implementation efficiency for the intersections with a lot of bus arrivals. Besides the TSP request line, the CNOB TSP strategy adds the arrival detection line and the departure detection line onto the basis of the FCFS TSP strategy. The number of bus arrivals between the arrival line and the TSP request line will be used to calculate the value of Max_call time for the priority phase. With the extension of Max_call time, the CNOB TSP strategy can effectively adjust the max call time of the priority phase to match the random arrival of buses and improve the efficiency of green extension strategy for the intersections with a lot of bus arrivals. The number of storage buses between the TSP request line and the departure line will be used to calculate the final green time of the non-priority phase. With the adjustment of control logic, the CNOB TSP strategy will decrease the truncation extent of green time. The early green strategy will be better suited for the intersections with a lot of bus arrivals.
Performance comparison and sensitivity analysis are conducted to evaluate the effect of the CNOB TSP strategy. Compared with the signal timing of the FCFS TSP strategy and the optimized signal timing of the TSP strategy by VGAO, the signal timing of the CNOB TSP strategy can reduce both the average delay per person at the intersection and the average vehicle delay of non-priority phases without using TSP optimization. For the CNOB TSP strategy, more signal cycles will extend the final green time of the priority phase because of the bus arrivals in the arrival section when priority phases are active, and the signal cycles will truncate the green time of non-priority phases more reasonably because of the bus arrivals in the storage section when non-priority phases are active.
Sensitivity analysis validates that the CNOB TSP strategy is better suited for the intersections with a lot of bus arrivals. The gap of average delay per person between the CNOB TSP strategy and FCFS TSP strategy becomes larger as the priority request proportion increases. The variation trend of average delay per person shows that the CNOB TSP strategy can improve the TSP implementation efficiency for the intersections with a lot of bus arrivals. When the green time ranges of non-priority phases are relatively large, the average vehicle delay of non-priority phases for the CNOB TSP strategy is lower than the FCFS TSP strategy in different priority request proportions. The variation trend of average vehicle delay shows that the CNOB TSP strategy can significantly reduce the adverse impact on the general vehicles of non-bus-priority approaches when the green time ranges of non-priority phases are relatively large for the intersections with a lot of bus arrivals.
Future research along these lines will focus on improving the CNOB TSP strategy by considering more factors. Factors such as the number of passengers and the schedule adherence of buses can be considered to calculate the Max_call time of the priority phase, and the final green time of non-priority phases. Moreover, the TSP parameters such as Extend or Duration can also be considered to improve the control logic of the CNOB TSP strategy. In addition, whether accepting one TSP request or multiple TSP requests, the CNOB TSP strategy can effectively adjust the green time of the priority phase to match the random arrival of buses and reasonably control the reduced green time of non-priority phases even when the signal controller is not connected to the central transit control center. This paper focused on the improvement of active TSP control logic for the single computer system and did not consider other system architectures for checking TSP conditions before the request is sent to the signal controller. Therefore, the TSP conditions, such as transit schedule information, general vehicle information, and saturation degree restriction of non-bus-priority approaches, will also be considered for future research to improve the active TSP control logic.

Author Contributions

Conceptualization, P.L. and Y.W.; Data curation, Y.W.; Funding acquisition, Z.L.; Investigation, P.L. and Y.K.; Methodology, P.L.; Project administration, P.L. and Z.L.; Resources, P.L.; Software, P.L. and J.K.; Supervision, J.K. and J.G.; Writing—original draft, P.L. and J.K. All authors have read and agreed to the published version of the manuscript.

Funding

Our work was partially supported by the program of National Key Technology R&D Program of China (No. 2014BAG03B03).

Conflicts of Interest

The authors declare no conflict of interest.

References

  1. Bagherian, M.; Mesbah, M.; Ferreira, L.; Charles, P.; Khalilikhah, M. Network-Wide Optimization of Transit Signal Priority. In Proceedings of the 94th Annual Meeting for Transport Research Board (TRB), Washington, DC, USA, 11–15 January 2015; pp. 15–1146. Available online: https://trid.trb.org/view/1336954 (accessed on 12 September 2015).
  2. Truong, L.T.; Currie, G. Coordinated transit signal priority model considering stochastic bus arrival time. IEEE Trans. Intell. Transp. Syst. 2018, 20, 1269–1277. [Google Scholar] [CrossRef]
  3. Albright, E.; Figliozzi, M. Integration of Multi-modal Transportation Data Sets to Provide Transit Signal Priority Stop-level Performance Measures. In Proceedings of the Western ITE Conference Proceedings, Anchorage, AK, USA, 10–13 July 2011. [Google Scholar]
  4. Ghanim, M.; Dion, F.; Abu-Lebdeh, G. Integration of Signal Control and Transit Signal Priority Optimization in Coordinated Network Using Genetic Algorithms and Artificial Neural Networks. In Proceedings of the 88th Annual Meeting of the Transportation Research Board (TRB), Washington, DC, USA, 11–15 January 2009; pp. 9–3063. Available online: https://trid.trb.org/view/882077 (accessed on 30 January 2009).
  5. Zhang, J. Evaluation of transit signal priority using analytical method. Ph.D. Thesis, Texas Tech University, Lubbock, TX, USA, 2007; pp. 1–55. Available online: http://hdl.handle.net/2346/8819 (accessed on 20 June 2007).
  6. Sun, Z.; Lu, H.; Wan, J. Modeling and simulation of intersection signal control for transit priority. In Proceedings of the 25th Chinese Control and Decision Conference (CCDC), Guiyang, China, 25–27 May 2013; pp. 4496–4501. [Google Scholar] [CrossRef]
  7. Stevanovic, J.; Stevanovic, A. Stochastic optimization of traffic control and transit priority settings in VISSIM. Transp. Res. Part C 2008, 16, 332–349. [Google Scholar] [CrossRef]
  8. Stevanovic, A.; Stevanovic, J. Traffic control optimization for multi-modal operations in a large-scale urban network. In Proceedings of the IEEE Forum on Integrated and Sustainable Transportation Systems, Vienna, Austria, 29 June–1 July 2011; pp. 146–151. [Google Scholar] [CrossRef]
  9. Ghanim, M.S.; Abu-Lebdeh, G. Microscopic simulation study of transit signal priority implementation along an arterial corridor. In Proceedings of the 5th International Conference on Modeling, Simulation and Applied Optimization (ICMSAO), Hammamet, Tunisia, 28–30 April 2013; pp. 1–4. [Google Scholar] [CrossRef]
  10. Xu, H.; Zheng, M. Impact of phase scheme on development and performance of a logic rule-based bus rapid transit signal priority. J. Transp. Sys. Eng. 2009, 135, 953–965. [Google Scholar] [CrossRef]
  11. Ma, W.; Ye, X. Optimal offline cycle length model based on online bus priority demand. J. Transp. Syst. Eng. Info. Technol. 2013, 13, 124–129. [Google Scholar] [CrossRef]
  12. Byrne, N.; Koonce, P.; Bertini, R.L.; Pangilinan, C. Using hardware-in-the-loop simulation to evaluate signal control strategies for transit signal priority. Transp. Res. Rec. 2005, 1925, 227–234. [Google Scholar] [CrossRef]
  13. Li, M.; Wu, G.; Li, Y. Active signal priority for light rail transit at grade crossings. Transp. Res. Rec. 2007, 2035, 141–149. [Google Scholar] [CrossRef]
  14. Currie, G.; Shalaby, A. Active transit signal priority for streetcars: Experience in Melbourne, Australia, and Toronto, Canada. Trans. Res. Rec. 2008, 2042, 41–49. [Google Scholar] [CrossRef]
  15. Consoli, F.A.; Alomari, A.H.; Al-Deek, H. Evaluation of conditional transit signal priority technology for regional implementation. Transp. Res. Rec. 2015, 2484, 140–148. [Google Scholar] [CrossRef]
  16. Tan, X.Y.; Li, J.; Deng, W. Signal Strategy of Conditional Transit Priority Based on Transit Schedule. Advanced Materials Research. Trans. Tech. Publ. 2011, 156, 298–302. [Google Scholar] [CrossRef]
  17. Xuejin, Z.; Qingsong, L.; Tao, L. Study on Conditional Bus Priority Signal Setting Based on Running Timetable. In Proceedings of the 2010 International Conference on Intelligent Computation Technology and Automation, Changsha, China, 11–12 May 2010; Volume 3, pp. 486–488. [Google Scholar] [CrossRef]
  18. Xu, H.; Sun, J.; Zheng, M. Comparative analysis of unconditional and conditional priority for use at isolated signalized intersections. J. Transp. Sys. Eng. 2010, 136, 1092–1103. [Google Scholar] [CrossRef]
  19. Bie, Y.; Wang, D.; Song, X. Conditional bus signal priority strategies considering saturation degree restriction at isolated junction. J. Southwest Jiaotong Univ. 2011, 46, 657–663. [Google Scholar] [CrossRef]
  20. Bie, Y.M.; Wang, D.H.; Wei, Q. Conditional active and passive bus signal priority strategies considering saturation degree restriction at an isolated junction. J. Jilin Univ. (Eng. Technol. Ed.) 2011, 41, 1222–1227. [Google Scholar] [CrossRef]
  21. Feng, L.; Jian, W. Active transit signal priority considering overlapping phase in artery progression. In Proceedings of the 2010 2nd International Conference on Advanced Computer Control, Shenyang, China, 27–29 March 2010; Volume 2, pp. 272–277. [Google Scholar] [CrossRef]
  22. Liu, B.; Zhao, Z.; Niu, X. Analysis of total passager delay at the intersection based on active bus priority strategy. In Proceedings of the 2012 2nd International Conference on Computer Science and Network Technology, Changchun, China, 29–31 December 2012; pp. 2191–2196. [Google Scholar] [CrossRef]
  23. Lian, P.; Li, Z.; Rong, J.; Keel, J.; Lai, Y.; Chen, N. A cycle optimization method for multiple TSP requests based on VISSIM-based GA. Int. J. Simul. Syst. Sci. Technol. 2016, 17. [Google Scholar] [CrossRef]
  24. Siemens Energy & Automation. ACTRA Users Manual version 4.3.9; Siemens Energy & Automation: Munich, Germany, 2006; pp. 253–286. [Google Scholar]
  25. Oliveira-Neto, F.M.; Loureiro, C.F.G.; Han, L.D. Active and passive bus priority strategies in mixed traffic arterials controlled by SCOOT adaptive signal system: Assessment of performance in Fortaleza, Brazil. Transp. Res. Rec. 2009, 2128, 58–65. [Google Scholar] [CrossRef]
  26. Liu, Z.; Qiao, W. A rule-based signal compensation strategy for the non-bus-priority approaches at an intersection. In Proceedings of the 15th COTA International Conference of Transportation Professionals, Beijing, China, 24–27 July 2015; pp. 2007–2017. [Google Scholar] [CrossRef]
  27. Fang, S.Y.; Li, F. A Distributed Phase Time Optimization Method of the Coordinated Control for Active Bus Signal Priority. In Advanced Materials Research; Trans Tech Publications: Kapellweg, Switzerland, 2012; Volume 468, pp. 233–237. [Google Scholar] [CrossRef]
  28. Liu, Z.; Guo, X. Analysis of an Intersection Based on Active Priority Strategies, International Conference on Green Intelligent Transportation System and Safety; Springer: Berlin/Heidelberg, Germany, 2016; pp. 737–750. [Google Scholar] [CrossRef]
  29. Jeong, Y.; Kim, Y. Study on the Optimal Detector Location for the Active Bus Signal Priority of the Median Bus Lane. In Proceedings of the 17th ITS World Congress ITS JapanITS AmericaERTICO, Busan, Korea, 25–29 October 2010; Available online: https://trid.trb.org/view/1090905 (accessed on 30 June 2019).
  30. Huang, H.; Li, X.; Lian, P.; Rong, J. Trigger probability model of transit signal priority strategies based on signal timing. J. Comput. Appl. 2018, 38, 3025–3029. [Google Scholar] [CrossRef]
  31. Stevanovic, A.; Abdel-Rahim, A.; Zlatkovic, M. Microscopic modeling of traffic signal operations: Comparative evaluation of hardware-in-the-loop and software-in-the-loop simulations. Transp. Res. Rec. 2009, 2128, 143–151. [Google Scholar] [CrossRef]
  32. Zlatkovic, M.; Stevanovic, A.; Martin, P.T. Development and evaluation of algorithm for resolution of conflicting transit signal priority requests. Transp. Res. Rec. 2012, 2311, 167–175. [Google Scholar] [CrossRef]
  33. Ma, W.; Bai, Y. Serve sequence optimization approach for multiple bus priority requests based on decision tree. In Plan, Build, and Manage Transportation Infrastructure in China, Proceedings of the Seventh International Conference of Chinese Transportation Professionals Congress, Shanghai, China, 21–22 May 2008; ASCE: Reston, VA, USA, 2008; pp. 605–615. [Google Scholar] [CrossRef]
  34. Ahmed, B. Exploring new bus priority methods at isolated vehicle actuated junctions. Transp. Res. Proc. 2014, 4, 391–406. [Google Scholar] [CrossRef] [Green Version]
  35. Yun, I. Evaluation of stochastic optimization methods of traffic signal control settings for coordinated actuated signal systems. Ph.D. Thesis, University of Virginia, Charlottesville, VA, USA, 2005. Available online: https://trid.trb.org/view/776787 (accessed on 3 March 2006).
  36. Planung Transport Verkehr (PTV) AG. VISSIM 5.30-05 User Manual; Planung Transport Verkehr: Karlsruhe, Germany, 2011; pp. 453–454. [Google Scholar]
  37. Lin, Y.; Yang, X.; Zou, N. Passive transit signal priority for high transit demand: Model formulation and strategy selection. Transp. Lett. 2019, 11, 119–129. [Google Scholar] [CrossRef]
  38. Shu, S.; Zhao, J.; Han, Y. Signal timing optimization for transit priority at near-saturated intersections. J. Adv. Transp. 2018, 2018. [Google Scholar] [CrossRef] [Green Version]
  39. Tan, M.K.; Chuo, H.S.E.; Chin, R.K.Y.; Yeo, K.B.; Teo, K.T.K. Optimization of Urban Traffic Network Signalization using Genetic Algorithm. In Proceedings of the (2017) ICOS 2016 IEEE Conference on Open Systems, Langkawi, Malaysia, 10–12 October 2016; pp. 87–92. [Google Scholar] [CrossRef]
  40. Li, Z.D.; Chen, K.Q. Research on Timing Optimization of Reginal Traffic Signals Based on Improved Genetic Algorithm, IOP Conference Series: Materials Science and Engineering, 2018; IOP Publishing: Bristol, UK, 2018; p. 012191. [Google Scholar] [CrossRef]
Figure 1. The bus detection line settings of the CNOB (cumulative number of buses) TSP (transit signal priority) strategy.
Sustainability 12 00287 g001
Figure 2. The TSP control logic of the priority phase. FCFS = first-come-first-served.
Sustainability 12 00287 g002
Figure 3. The FCFS TSP control logic for getting the final green time.
Sustainability 12 00287 g003
Figure 4. The TSP control logic of the non-priority phase.
Sustainability 12 00287 g004
Figure 5. The CNOB TSP control logic for updating bus data sets and getting the final green time.
Sustainability 12 00287 g005
Figure 6. The CNOB TSP control logic for getting the final green time.
Sustainability 12 00287 g006
Figure 7. The map of intersection geometry.
Sustainability 12 00287 g007
Figure 8. The average delay per person at the intersection.
Sustainability 12 00287 g008
Figure 9. The average vehicle delay of the non-priority phases. VGAO = VISSIM-based genetic algorithm optimization.
Sustainability 12 00287 g009
Figure 10. The green extension time of the first phase.
Sustainability 12 00287 g010
Figure 11. The truncation time of the second phase.
Sustainability 12 00287 g011
Figure 12. The truncation time of the third phase.
Sustainability 12 00287 g012
Figure 13. The average delay per person in different priority request proportions.
Sustainability 12 00287 g013
Figure 14. The average vehicle delay of non-priority phases in different priority request proportions.
Sustainability 12 00287 g014
Table 1. Parameter and Explanation.
ParameterExplanation
SystemTimeThe system time of signal controller (Sec.)
Running_FrequenceThe running times in one second (times/Sec.)
Cycle_ElapsedTimeThe elapsed time of current signal cycle (Sec.)
Priority_Phase_GreenThe green time period of priority phase
Non-priority_Phase_GreenThe green time period of non-priority phase
Phase_ElapsedTimeThe elapsed time of the current signal phase (Sec.)
Final_GreenTimeThe green time of signal phase that real-timely calculated by TSP strategy (Sec.)
Phase_AmberChange the current status of signal phase to amber
Phase_GreenChange the current status of signal phase to green
Min_GreenTimeThe minimum green time of signal phase (Sec.)
Max_GreenTimeThe maximum green time of signal phase (Sec.)
Early_GreenBoolean used to judge whether at least one bus passes the TSP request line when any non-priority phase is active
Max_callThe maximum time that a priority call for bus may remain active and be considered valid (Sec.) [24]
ExtendThe time which is added to the end of each priority call when the assigned phase is green, during the period of Extend time, the signal controllers will not respond to any priority call (Sec.) [24]
DurationThe extension of green time when a priority call occurs (Sec.) [24]
ElapsedTime_Of_PreviousPhasesThe total green time of the previous signal phases that do not include the current signal phase (Sec.)
Arrival_SetsThe data sets that use to record the bus arrival information in the arrival section
Storage_SetsThe data sets that use to record the bus storage information in the storage section
SumOfBuses_ArrivalThe number of buses in the arrival section
SumOfBuses_StorageThe number of buses in the storage section
Threshold_Arr[i]The maximum allowed value of buses in the arrival section that will be accepted by the signal controller for the i-th priority phase
Threshold_Sto[i]The maximum allowed value of buses in the storage section that will be accepted by the signal controller for the i-th non-priority phase
Increment[i]The unit extension time for one bus in arrival section for the i-th priority phase (Sec.)
Decrement[i]The unit truncation time for one bus in storage section for the i-th non-priority phase (Sec.)
Table 2. The traffic demand OD (origin and destination) of general vehicles (veh/h).
Cycle
No
O1–D4O1–D7O2–D5O2–D8O4–D1O4–D8O5–D2O5–D7O7–D2O7–D5O7–D8O8–D2O8–D5O8–D7
113798743782015715072742078209817639
22352093913711711711937813759059117157
33523958798021513503131371173920215176
4254201096393913711542741371373920293117
523520158511739117150721520982020235137
63130125278781571409254781572020235137
71570148798591371507293137783920235117
815720119398117981467254981179839117176
91965910371579878156523598591173911798
1098011935959981487235391372020176196
1125420822137781171487235391373913713778
1227439959789811715652541761763959215157
13352208803978117121325413778392011778
14215117101798201571193157137393939157117
152543910377820137156513798157392023598
16235013509811713712522745959785923539
17333781311393915713701179839782078215
1829359103778391761291117391373939137157
1927401370117021514092355939202011798
Table 3. The traffic demand OD of BRT vehicles and regular buses (veh/h).
Cycle
No
O1–D4O3–D6O4–D1O6–D3
139785920
2595911759
320789859
439209859
539590137
659785920
79839200
839207839
97859980
10395911798
113907820
1239203998
130395939
145911711759
15393911739
165939590
175911711720
18020980
199820390
Table 4. The occupancy of vehicle types in different lanes.
Vehicle TypesLanesOccupancy
General vehiclesAll lanes1.5
Regular busesSouth bound of side road20.0
North bound of side road56.5
BRT vehiclesSouth bound of BRT road30.5
North bound of BRT road70.2
BRT = Bus Rapid Transit.
Table 5. The TSP signal timings of different experiments.
Experiment No12345
TSP StrategyFCFS CNOBFCFS CNOBFCFS CNOBFCFS CNOBVGAO-FCFS
First Phase (priority phase)Max_GreenTime868686868686868686
Min_GreenTime666666665050505050
Amber444444444
All-Red222222222
Max_call77777777[3,10]
Extend33333333[3,10]
Duration1515151515151515[3,34]
Threshold_Arr[1]---4---5---4---5
Increment[1]---5---8---5---8
Second Phase (non-priority phase)Max_GreenTime343434343434343434
Min_GreenTime242415152424151515
Amber444444444
All-Red222222222
Threshold_Sto[1]---2---2---2---2---
Decrement[1]---5---10---5---10---
Third Phase (non-priority phase)Max_GreenTime404040404040404040
Min_GreenTime303022223030222222
Amber444444444
All-Red888888888
Threshold_Sto[2]---3---3---3---3---
Decrement[2]---4---6---4---6---
TSP = transit signal priority, FCFS = first-come-first-served, CNOB = cumulative number of buses, VGAO = VISSIM-based genetic algorithm optimization.
Table 6. The results of one-way ANOVA (P-value).
Experiment No1 234
Average delay per person (s)5.42 × 10−63.42 × 10−58.87 × 10−107.11 × 10⁻⁷
Average vehicle delay(s)0.403043641.23 × 10−40.236757122.18 × 10−4

