Article

The Trends of the Energy Intensity and CO2 Emissions Related to Final Energy Consumption in Ecuador: Scenarios of National and Worldwide Strategies

by
Flavio R. Arroyo M.
1,2,* and
Luis J. Miguel
1,*
1
Systems Engineering and Automatic Control, School of Industrial Engineering, Paseo del Cauce s/n, University of Valladolid, 47011 Valladolid, Spain
2
Faculty of Engineering, Physical Sciences and Mathematics, Av. Universitaria, Central University of Ecuador, Quito 170129, Ecuador
*
Authors to whom correspondence should be addressed.
Sustainability 2020, 12(1), 20; https://doi.org/10.3390/su12010020
Submission received: 29 November 2019 / Revised: 8 December 2019 / Accepted: 8 December 2019 / Published: 18 December 2019

Abstract

:
Climate change and global warming are related to the demand for energy, energy efficiency, and CO2 emissions. In this research, in order to project the trends in final energy demand, energy intensity, and CO2 emission production in Ecuador during a period between 2000 and 2030, a model has been developed based on the dynamics of the systems supported by Vensim simulation models. The energy matrix of Ecuador has changed in recent years, giving more importance to hydropower. It is conclusive that, if industrialized country policies or trends on the use of renewable energy and energy efficiency were applied, the production of CO2 emissions by 2030 in Ecuador would reach 42,191.4 KTCO2, a value well below the 75,182.6 KTCO2 that would be seen if the current conditions are maintained. In the same way, by 2030, energy intensity would be reduced to 54% compared to the beginning of the simulation period.

1. Introduction

The scientific evidence is overwhelming for the proposition that global warming is due in great measure to the increase in CO2 levels in the atmosphere, as is the fact that the increase in CO2 concentration is due to human activity [1,2,3,4]. Climate change is currently one of the most pervasive and threatening problems. In many places, the changes in temperature are already placing ecosystems under stress and are also affecting human well-being [2].
Environmental change is happening at a much faster rate than previously thought, making it imperative that governments act now to reverse the damage that has been done to the planet [1,5]. The World Health Organization estimates that more than seven million people die every year due to poor air quality, and that three million of those deaths are premature. Several studies have shown that air pollution associated with the production and use of energy directly affects air quality and climate [6,7,8,9,10,11,12].
As global Gross domestic product (GDP) grew between 2014 and 2016, global fossil fuel emissions stagnated. However, this trend did not continue, and in 2017 global emissions increased by 1.6%. The projections of the Global Carbon Project suggest that CO2 emissions will grow by around 2.7%, reaching 37.1 gigatons by the year 3000 [4]. The main sources of air pollution are associated with inefficient transport systems, the use of electrical energy produced in power plants that consume fossil fuels, and also industrial activities.
Between 1750 and 2011, cumulative anthropogenic CO2 emissions to the atmosphere were 2040 ± 310 GTCO2. About 40% of these emissions have remained in the atmosphere (880 ± 35 GTCO2) [5]; the rest have been removed from the atmosphere and stored on land (in plants and soils) and in the ocean. People’s life expectancy is threatened by climate change through the limitation of access to water, food, medical care, and land. Therefore, it is important to reduce the consumption of fossil fuels and increase the use of renewable energy in order to minimize CO2 emissions [13].
Sustainability of power systems with high renewable energy penetration rates is a topic of major interest, especially when considering the intermittency of renewable energy source (RES) production and the actual growing trend of energy consumption [6]. The transition from fossil fuels to RESs is an indispensable necessity if sustainable socio-economic systems are to be realized. RES variability now represents a major challenge when it comes to upgrading power systems. From a social and economic perspective, the RES share in meeting electricity demand has shown a steady growth [7]. The increasing renewable energy share in electricity generation as a result of several factors such as environmental constraints, technical and economic aspects, or social implications has led to a corresponding reduction in total CO2 emissions [8].
The energy return on investment (EROI) metric includes factors affecting the whole energy system that are not accounted for by the monetary costs of individual power plants (such as additional costs for the system related to distribution, intermittency of RES, etc.) [14,15,16,17,18,19,20]. The transition to new energy resources and to new energy conversion and storage devices will affect the fraction of energy reinvestment, which could have significant economic impacts [21,22,23,24,25,26]. Those RESs with a higher potential (i.e., wind, and solar) have been generally found to have a lower EROI standard (EROIst) than fossil fuels, especially when incorporating the energy costs of dealing with intermittency [9].
Energy and environmental objectives are a global problem and, in this regard, international agreements between developed and developing countries are crucial for the future of the international energy situation [10]. In 2015, world leaders agreed to 17 goals that would lead to a better world by 2030. These goals have the power to end poverty, fight inequality, and stop climate change [11]. Technological progress, the accumulation of capital, and the change in the structure of production, has contributed positively to the reduction of energy intensity. Changes in the composition of the energy supply (for example: the increasing importance of electricity) can affect productivity [12].
Energy intensity has been analyzed and has been found to be a key driver for guiding the pathway of energy transition towards achieving a low carbon economy [27,28]. The energy intensity of the global economy continues to fall. Global energy intensity—measured as the primary energy demand per unit of GDP based on the 2016 US dollar (USD) on a purchasing power parity (PPP) basis—fell by 1.8% in 2016. This decline continued the recent trend of stable improvement. Even though it was lower than it had been in 2015, it was still a significant increase on the averages seen in the preceding decades (see Figure 1). While GDP grew by 3% in 2016, global energy demand increased by only 1.1% [29].
In Organization for Economic Co-operation and Development (OECD) countries and non-OECD economies, energy intensity has declined almost without interruption since 2000, averaging 1.6% per year to 2016, as seen in Figure 2. In OECD countries, primary energy demand fell by 1%, despite a 32% increase in GDP; in other countries, energy demand rose by 80% while GDP increased by 150% [29].
In 2016, global investment in energy efficiency increased by 9% to USD 231 billion. This increase matched with a slowdown in investment on the supply side of the energy system. Energy efficiency investment now represents 13.6% of the USD 1.7 trillion invested across the entire energy market [29].
Latin America has slowly initiated the integration of policies associated with the efficient use of energy; and the integration of energy efficiency programs from the demand side. These policies have not achieved significant results and the costs and benefits associated with the industrial and electrical sectors have not been applied in other sectors. Mexico and Brazil have been consolidating their institutional and regulatory frameworks in support of energy efficiency activities. Energy Intensity is generally declining due to convergence and economic development, especially in energy-importing countries, and in countries with significant energy resources [30].
Energy prices have a major effect on energy consumption. Higher prices may encourage the sectors of the economy to change their consumption behavior. In the residential sector, this factor can represent changes in household habits for energy use. Furthermore, households can shift to energy-efficiency technology that could reduce energy consumption in the short-term. However, special attention should be considered for this factor because the improvements in energy efficiency can lower the implicit price of energy and make it more affordable. This issue represents a rebound effect that may have an effect on the rest of the sectors [31]. The different behaviors of technology spillovers on energy intensity suggest that measures intending to make efficient use of energy should accord well with the characteristics and behaviors of each technology spillover [32].
The energy sector constitutes a strategic sector in all economies, the engine of the productive system and a crucial factor for the satisfaction of human needs. Today’s Ecuador is a net exporter of primary energies, with oil being the main export item, which in 2016 represented 32.5% of revenues for the country. The price per barrel of oil for the year 2019, was estimated at 50.05 USD by the authorities of the economic front. Ecuador is a member of OPEC and that has led to sacrifices in its levels of production.
Ecuador has maintained a strong dependence on petroleum products. However, investments in renewable energy and new clean energy production technologies will improve the potential of the Ecuadorian energy matrix. According to the 2017 energy balance published by the Ministry of Electricity and Renewable Energy in 2016, as shown in Figure 3.
CO2 emissions were the main contributor to climate change in a period between 1750–2005 [33,34]. A reduction in access to water, food availability, land use are the main threats of climate change to the life expectancy of human populations. Therefore, minimizing CO2 emissions through the reduction of fossil fuel consumption and the increase in the use of renewable energy is essential [35].
A positive relationship between CO2 emissions, energy consumption, and the type of energy has been observed. The authors in [36] have proposed that in the long term for CIVETS (Colombia, Indonesia, Vietnam, Egypt, Turkey, and South Africa), economic growth and energy consumption are determinants of the increase in CO2 emissions. A positive linear relationship between economic growth and emissions has been observed for ASEAN (Association of Southeast Asian Nations) [37]. In Taiwan, authors in [14] found a relationship between CO2 emissions with demographic and economic growth. The researchers in [15] found a greater correlation between CO2 emissions with the performance of the US and European stock market than with China; while the authors in [16] proposed a scenario to reduce CO2 emissions with a reduction in energy intensity. A positive and significant impact on CO2 emissions in Nigeria was related to the increase in per capita GDP and population [17]. Researchers in [18] found that energy consumption has positive effects on CO2 emissions and statistically significant for European and Northern Asian countries, Latin America and the Caribbean and the Middle East, and North and Sub-Saharan Africa. The authors in [19] researched the emissions and income relationship and established the incidence of the EKC in 22 OECD countries; using the data of six Central American Countries, and researchers in [20] established a causal relationship between economic growth, energy consumption and CO2 emissions. Authors in [21] applied a model to examine the relationship between CO2 emissions, electricity consumption and economic growth in the case of the countries of the Association of Southeast Asian Nations. A causality relationship between CO2 emissions, energy consumption and economic growth for nine newly industrialized countries was found [22]. For Brazil, India, China, and Russia (BRIC) a dynamic relationship between economic growth, energy consumption, and carbon emissions was pointed out [23], and for Ecuador a significant decrease in CO2 emissions was associated with replacement technologies and changes in the energy matrix [24].
This research seeks to examine the causal relationship of the functioning of economic growth, energy consumption and CO2 emissions, using a system dynamics model. Energy production and consumption generate effects that have negatively effects for the environment [25]. Determining future scenarios will allow obtaining important information for decision making in relation to the current national energy model, in order to find a sustainable energy matrix and to establish environmental policies that allow economic development that takes care of the environment.

2. Materials and Methods

Climate change is one of the most serious challenges facing humanity in the 21st century. A policy-driven solution to prevent the most drastic effects of climate change requires a long-term policy architecture that is independent, without exceptions, from the ideological party of the incumbent and successive governments in power, that is, without policy risk [38,39,40]. Increases in ambient temperature and changes in related processes are directly related to the increase in anthropogenic concentrations of greenhouse gases (GHG) in the atmosphere [41,42]. The estimates of the effectiveness of the measures to reduce the demand for energy services have a high level of uncertainty in the current conditions of climate policy where the final objective of climate mitigation has not yet been decided [43,44].
The concentration of CO2 in the atmosphere in July 2019 was 411.77 ppm [1]. The World Health Organization indicates that about 80% of cities exceed the limits of air quality, that is, nine out of ten people in the world breathe contaminated air, which means that it affects 92% of the world population [3]. The countries with the highest contribution in the CO2 emission for 2016 were China, the United States, India, Russia, and Japan, representing 28.21%, 15.99%, 6.24%, 4.53%, and 3.67% respectively [45]. While the majority of deaths associated with CO2 emissions occurred in urban centers in China, India, and Pakistan, representing 2.1 million people [46].
The dynamics of the system (DS) allows the interaction of different elements of a system over time, and incorporates concepts such as stock, flows, feedback, and delays, which allows for capturing the dynamic aspect of the process and providing a dynamic vision of the system behavior over time [26].
In this research, a dynamic model was designed using the Vensim graphic tool for the creation of simulation models that allows conceptualizing, documenting, simulating, analyzing, and optimizing system dynamics models. These model development procedures are designed to conceptualize, document, simulate, and analyze dynamic system models [47], which will allow a sensitivity analysis to examine the consistency of the model against changes in the values of the parameters.
In fact, the dynamic systems method allows describing a problem dynamically, in this study the effects of energy consumption on the environment were analyzed; The variables used were population, energy supply and demand, CO2 emissions, and energy intensity.
Energy consumption can be measured in primary or final terms, and by total or by disaggregating into different types of energy sources. Economic output can also be measured at sectorial or aggregated levels. GDP has been one of the most frequent [48,49,50]. It is difficult to find a definition of energy intensity that can make it suitable for using as an indicator of regional energy efficiency. Energy intensity, if calculated based on primary energy demand using the IEA/Eurostat methodology, will increase (worsen) if an economy uses more generation of nuclear and geothermal electricity. Nevertheless, if the energy intensity is calculated according to the final energy demand, it will not reflect improvements in the efficiency of electricity generation [51].
The energy intensity is defined as the energy consumed per unit of production. Energy intensity is inversely related to energy efficiency; the lower the energy required to produce an output or service unit, the greater the energy efficiency [52]. Energy intensity is the most commonly used aggregate indicator of a nation’s energy efficiency [27,53]. It usually be calculated as units of energy per unit of the industry’s value added or the country’s GDP.
Energy Intensity (EI) = Energy/GDP
where EI is the Energy Intensity; E is the total energy consumed and GDP is the gross domestic product expressed in dollars.
Improving energy efficiency has been one of the highest priorities for achieving economic growth during the post-industrial phase of economic development. Energy efficiency is considered one of the most important factors to strengthen industrial competitiveness and energy security. A positive relationship between energy efficiency and business growth has been reported [53].
Energy efficiency is rarely traded as a commodity. Where it is traded, it is usually the result of government regulations to create a market for efficiency outcomes, such as energy savings, carbon dioxide emissions reductions, or electricity system adequacy (the ability of the power system to match the evolution in electricity demand) [29].
The price of energy has shown a significant relationship (in terms of magnitude) with the growth rate of energy intensity [28], while capital and labor prices have shown an insignificant association with the growth rate of energy intensity [54]. The combination of higher fossil fuel-based energy prices coupled with a substantial increase in electricity supply could have opened the way for an increase in energy efficiency, which in turn has reduced the rate of growth in energy intensity [54].
An increase or decrease in energy intensity does not necessarily correspond to the real change in the energy efficiency of the sector. This is one of the main limitations when the energy intensity is calculated in terms of the economic production of the industrial sectors instead of the physical production [55].
Lower energy consumption does not have to come at the expense of lower economic growth, and the objectives of reducing energy intensity can be an acceptable and effective compromise for developing countries. However, for a considerable number of countries, energy intensity is not decreasing, energy intensity has increased or remained steady since the 1980s. For these countries, lower energy consumption and robust economic growth seem to be in conflict, given their current technologies and their economic and energy structures [56].
Energy plays a positive and statistically significant role in economic growth. The intensity of the energy is a measure that the energy grows towards its stable state [57]. Investments in modern and energy efficient technologies and products have also affected the growth of the economy. Reducing energy consumption is crucial to improve the economic efficiency of the economy and its positive impact on international competitiveness [33].
The GDP of individual economies or purchasing power parity (PPP) can drastically change the calculations of energy intensity improvement [34]. It has been suggested that purchasing power parity (PPP) is the most correct approach as it is the real purchasing power of each GDP that will drive the energy use of an economy [51]. A solid version of the PPP theory is based on the law of one price. Rounding up complicated factors such as transportation costs, taxes, and tariffs, the law of a price establishes that any good that is traded on world markets will be sold for the same price in all countries that are engaged in trade, when prices are expressed in a common currency [58]. The improvement in energy intensity for a group of economies will generally have a downward bias if calculated using market exchange rates instead of purchasing power parities [51].
Given the impact of the energy system on climate change, essentially emissions from fossil fuel combustion, many countries have made efforts to decouple energy use from economic growth. Decoupling consists of increasing the energy productivity of economic activities such that more output can be produced per unit of energy used [59,60,61]. Energy efficiency measures are expected to be the main factor in reducing energy intensity and an indicator of successful decoupling. In fact, energy policies in Europe and elsewhere place high expectations on energy efficiency improvements to reduce primary and final energy consumption [62].

2.1. Scenarios Considered for Analysis

The construction of scenarios allows exposing a set of alternatives regarding the future. The construction of scenarios can be seen as a subset of strategic forecast that can be defined as the creation of multiple possible futures to support strategies [63,64]. The construction of the scenario is based on assumptions about what the future might look like one day: what direction certain trends could take, which developments could remain constant, and which could change over time. The scenarios are descriptions of journeys to possible futures [65]. They reflect different assumptions about how current trends will unfold, how critical uncertainties will develop, and what new factors will come into play [66].
The model combines different sectors through feedback mechanisms to capture the complexity of the behavior of the economic–climatic system. The matrix of productive sectors used in this study consists of six sections: (i) transport, (ii) industry, (iii) residential, (iv) commercial, services and public administration, (v) agriculture, fishing and mining, (vi) construction and others. The energy matrix consists of the following primary energy sources: oil, natural gas, hydroelectric power, cane products, and other primary products. The final energy sources are: electricity, LGP, gasoline, kerosene and airdraft fuel, diesel, fuel oil, gases, reduced crude oil, and non-energy. Non-conventional renewable energies include: solar photovoltaic, wind, biomass, biogas, and biofuels. This structural approach allows a more scientific representation of feedback relationships.
A set of scenarios was developed that seeks to identify trends in energy intensity and CO2 emissions related to final energy consumption in Ecuador. The scenarios necessarily include subjective elements and are open to various interpretations. The formulation of the scenarios is necessary to predict the evolution of the main variables, which can promote energy generation policies, and to project the consumption and mitigation of CO2 emissions.
For the purposes of this research, three scenarios were proposed: BAU (abbreviation of business as usual). This scenario refers to the current way in which the systems are being developed and what would happen if we continue under the same conditions. SCENARIO1 considers all the policies proposed by the national government for future projections. SCENARIO2 is a scenario of global trends of industrialized countries.
The business as usual (BAU) scenario projects the current trends identified by each nation, assumes that past trends will continue in the future and that no new policies will be implemented for this case of research related to energy production and consumption.
SCENARIO1 contemplates the government plans and strategies that have been established for the coming years in Ecuador regarding energy production and consumption. The following documents are taken into account: National Energy Agenda 2014–2040, National Energy Balance 2015–2017, National Energy Efficiency Plan 2016–2035, Electricity Master Plan 2016–2025, Electrification Master Plan 2013–2022, Analysis of R&D&I opportunities in Energy Efficiency and Renewable Energies in Ecuador, and National Climate Change Strategy of Ecuador 2012–2025. The policies in SCENARIO1 raises concerns including: prioritizing the use of renewable energy sources, promoting the use of hydroelectric energy, and replacing inefficient thermal generation. The massive introduction of efficient lighting in homes and public roads is proposed. It suggests the application of standard and technical regulations for the labeling of household appliances, and the replacement of equipment with high energy consumption. The replacement of LPG by electricity is proposed with the implementation of induction cookers, implementation of energy management systems in the main industries. The scenario promotes the implementation of sustainable transport that considers electricity and not hydrocarbons as the main source of energy. The scenario also considers improvement in the management of electricity companies necessary, an energy sovereignty is considered as one of the pillars of a new Ecuador.
Finally, SCENARIO2 considers the environmental dimension of sustainable development goals, global environmental governance, multilateral environmental agreements, and global macroeconomic perspectives for sustainable development, replacement strategies for clean energy and energy efficiency, are considering the projections or trends of the reports of organizations such as the Intergovernmental Panel on Climate Change (IPCC), International Energy Agency (IEA), and BP, among others (Figure 4).

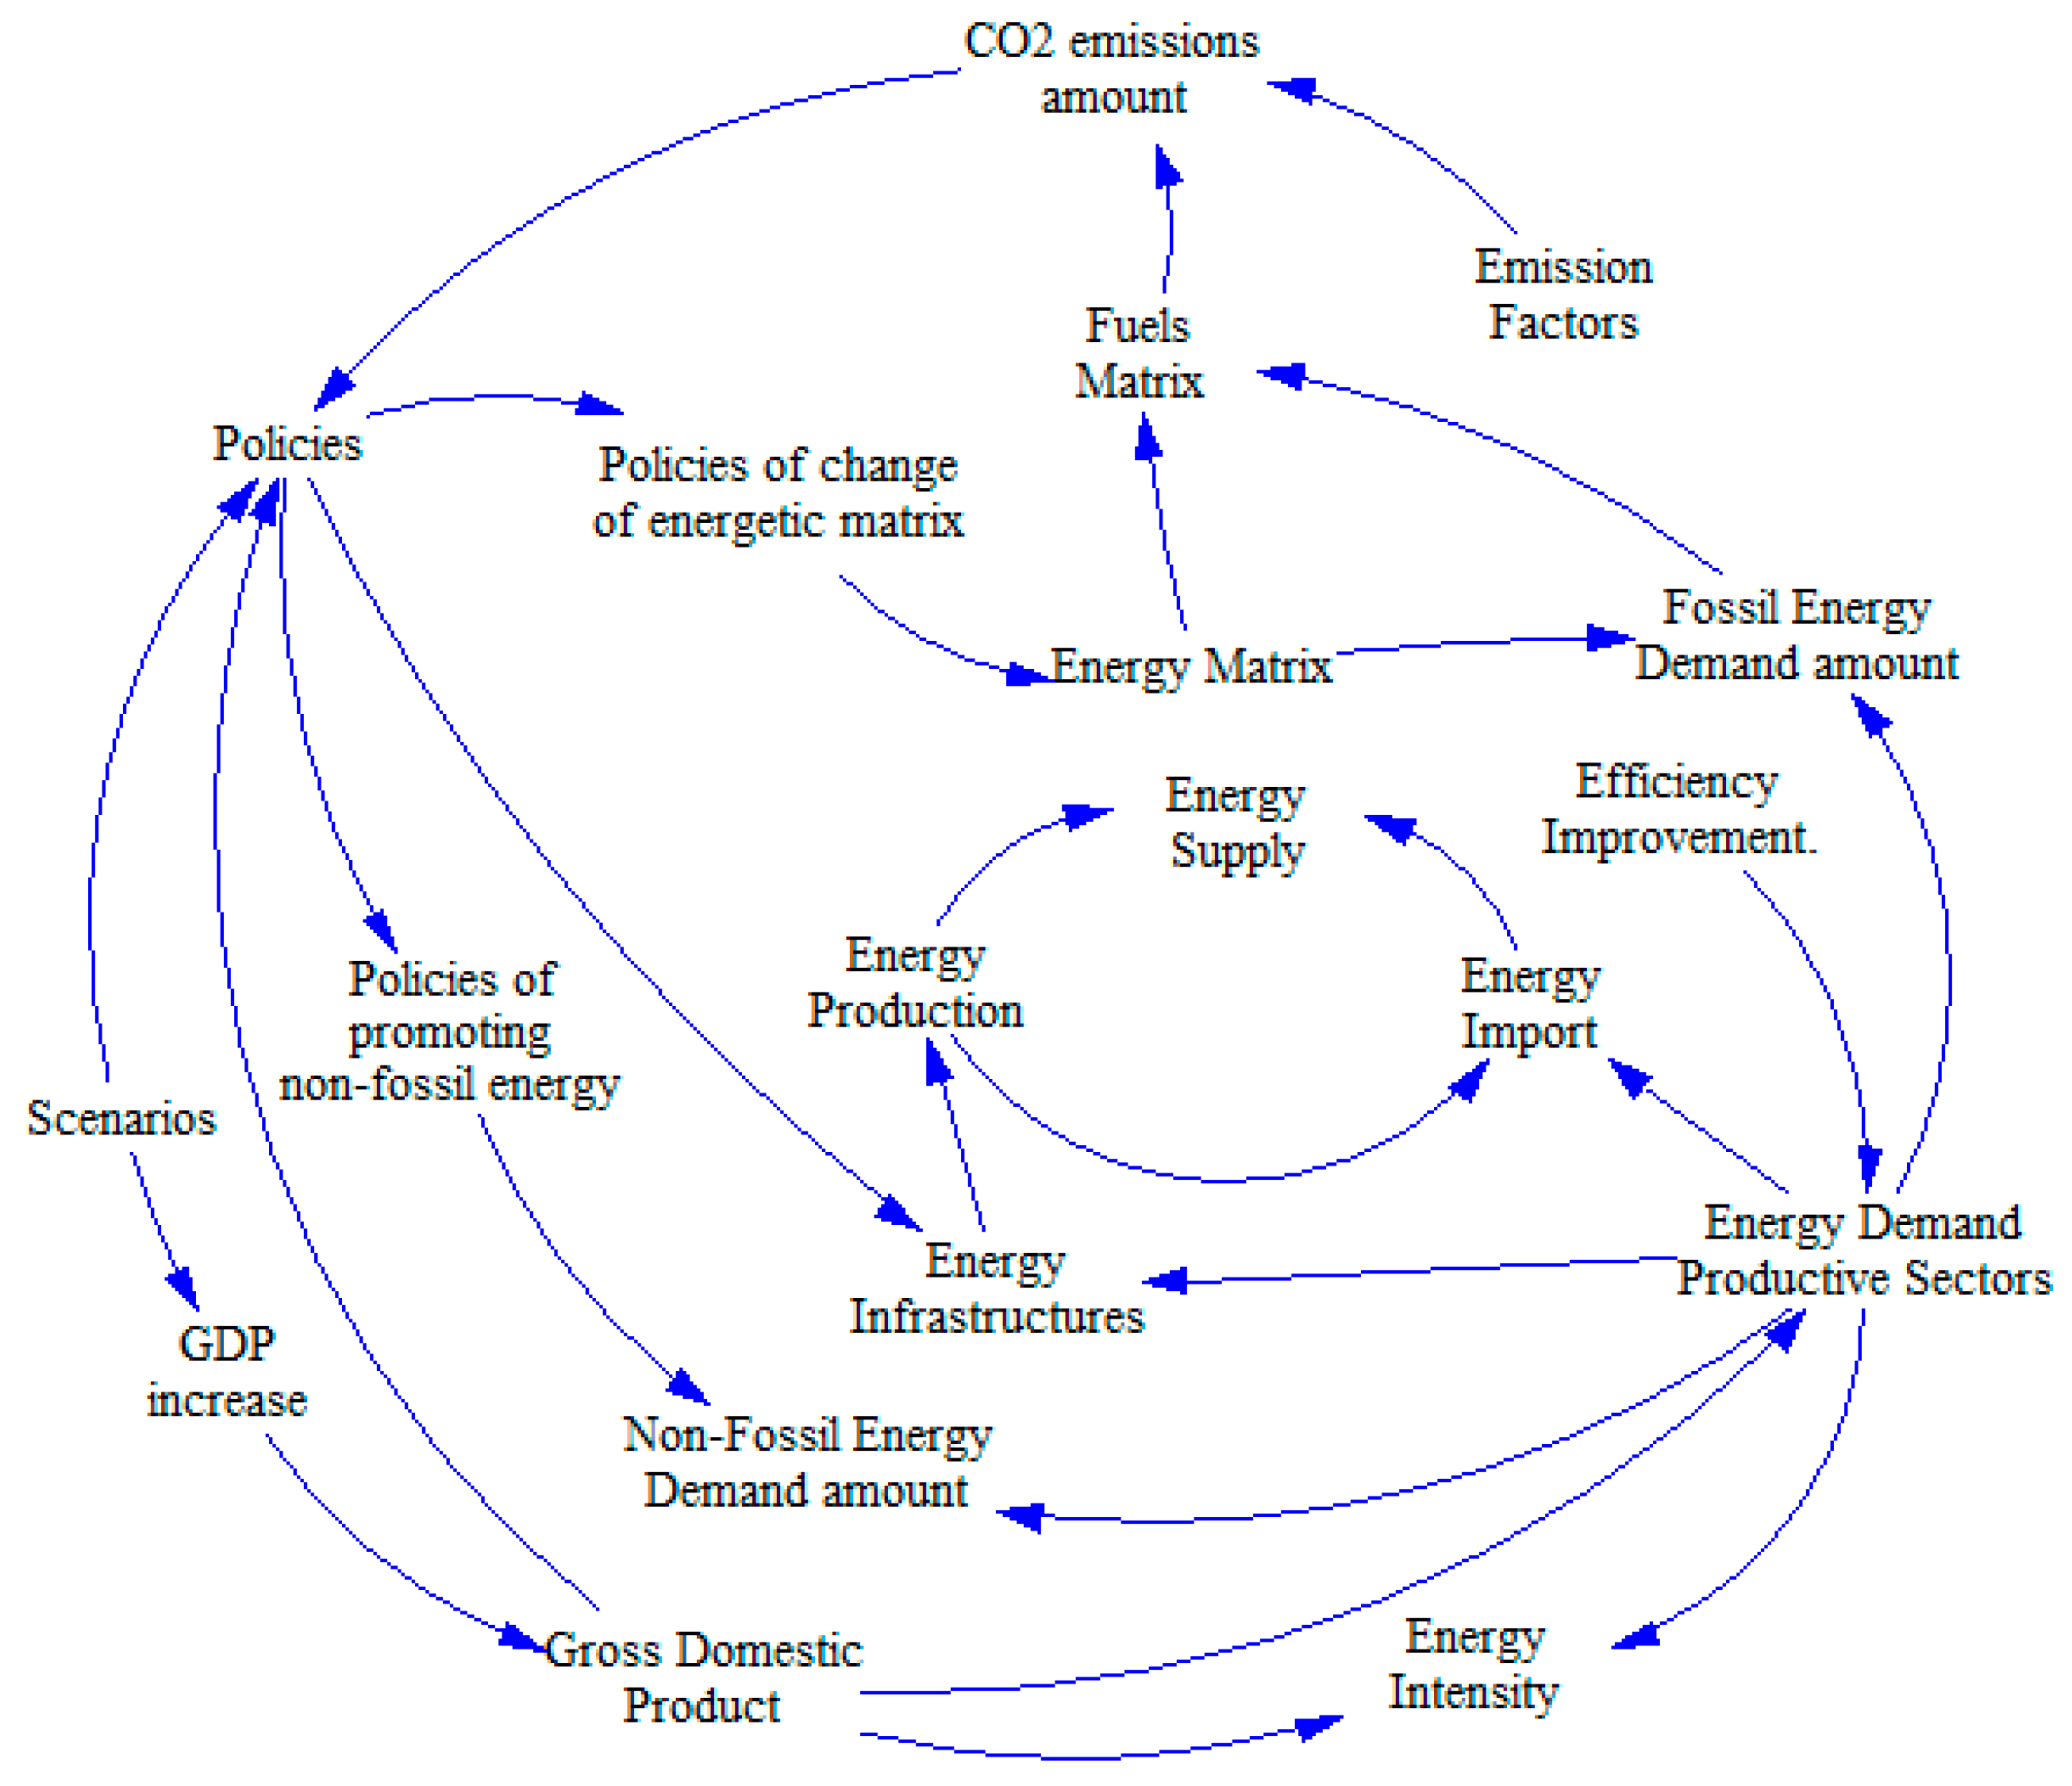
2.2. Modeling and Simulation

The modelling of the energy system is a complex problem due to the presence of multiple decision makers, the complexity of consumer behavior, the feedback processes between the modules, technological limitations, and various types of delays. The system dynamics model (SDM) is an appropriate approach to model such complexities, since it is a powerful modeling technique to understand and explore the feedback structure in complex systems. The strength of this model lies in its ability to understand nonlinearity in the dynamics, feedback, and delay time [67].
The proposed system dynamics model was simulated using Vensim software, a modeling tool commonly used to build, simulate, and analyze dynamic model systems based on causal loops or stock and flow diagrams. The system dynamics model was designed to estimate energy consumption, economic growth, energy intensity, and CO2 emissions in Ecuador in 2030. To accomplish the research objective, traditional energy resources of Ecuador are considerate (Figure 5).
An economy that depends more on fossil fuels will have more emissions than an economy that depends on renewable energy [17]. The primary energy matrix of Ecuador has historically been dominated by oil production Figure 6. Historically renewable energies have not had a great participation in a primary energy matrix. However, the production of hydropower has increased by 72% between 2000 and 2015, while the production of other primary sources such as wind and photovoltaic energy began in 2007 [68].
Research on the analysis of emissions and energy consumption has been carried out in Ecuador, including an analysis of the possible dimension of the physical impact of climate change and its economic quantification in different areas, such as water resources, agriculture, biodiversity, marine and coastal resources, health, infrastructure, extreme events, and the Galapagos Islands were carried out by the Economic Commission for Latin America and the Caribbean (ECLAC) in 2013. To analyze carbon emissions, energy consumption, and sustainable development in Ecuador between 1980 and 2025, reference [69] used SDM, decomposition analysis, and the Kuznets curve. A study on carbon emissions in Ecuador to generate policies to promote its reduction was conducted by reference [70]. Likewise, reference [71] analyzed the scenarios of national government policies and global trends that mark the way forward in the search for the reduction of energy consumption, energy efficiency, and the mitigation of CO2 emissions in Ecuador by 2030.
Total secondary energy production in Ecuador has remained at levels close to 70 million BEP between 2003 and 2015, with fuel oil as the main secondary energy produced in the country, followed by diesel until 2011, after which electricity became the second main energy source produced, and is currently almost on par with fuel oil production (Figure 7).
Of the six economic sectors in terms of final energy consumption identified at the national level by 2015, transport had a 46% share of the total energy demanded by the country’s sectors, industries reached 19%, and the residential sector reached 13% (Figure 8). Although there was a 4% reduction in sectoral energy consumption in the country in 2015 compared to 2014, there was an increase in the demand for transport (2%) and for households (1.6%). This fact has been justified mainly by lower energy consumption in the industry (−4.5%) and in other sectors [68].
Related studies between energy consumption and polluting emissions support the impact of the structure of energy consumption on air [72,73,74]. GDP growth and fossil fuel energy consumption are mentioned as major sources of CO2 emission [75,76,77].
The total of emissions produced is calculated with the following expression:
ECO2 = ∑Est × FCEt
where ECO2 is the total of CO2 emissions; “s” is the consumer sector; “t” is the type of final energy consumed; and FCEt is the conversion factor of CO2 emissions per type of energy consumed.
The conversion factors for CO2 emissions (FCEt) from the different energy sources employed to calculate ECO2 are shown in Table 1.

2.3. Model Validation
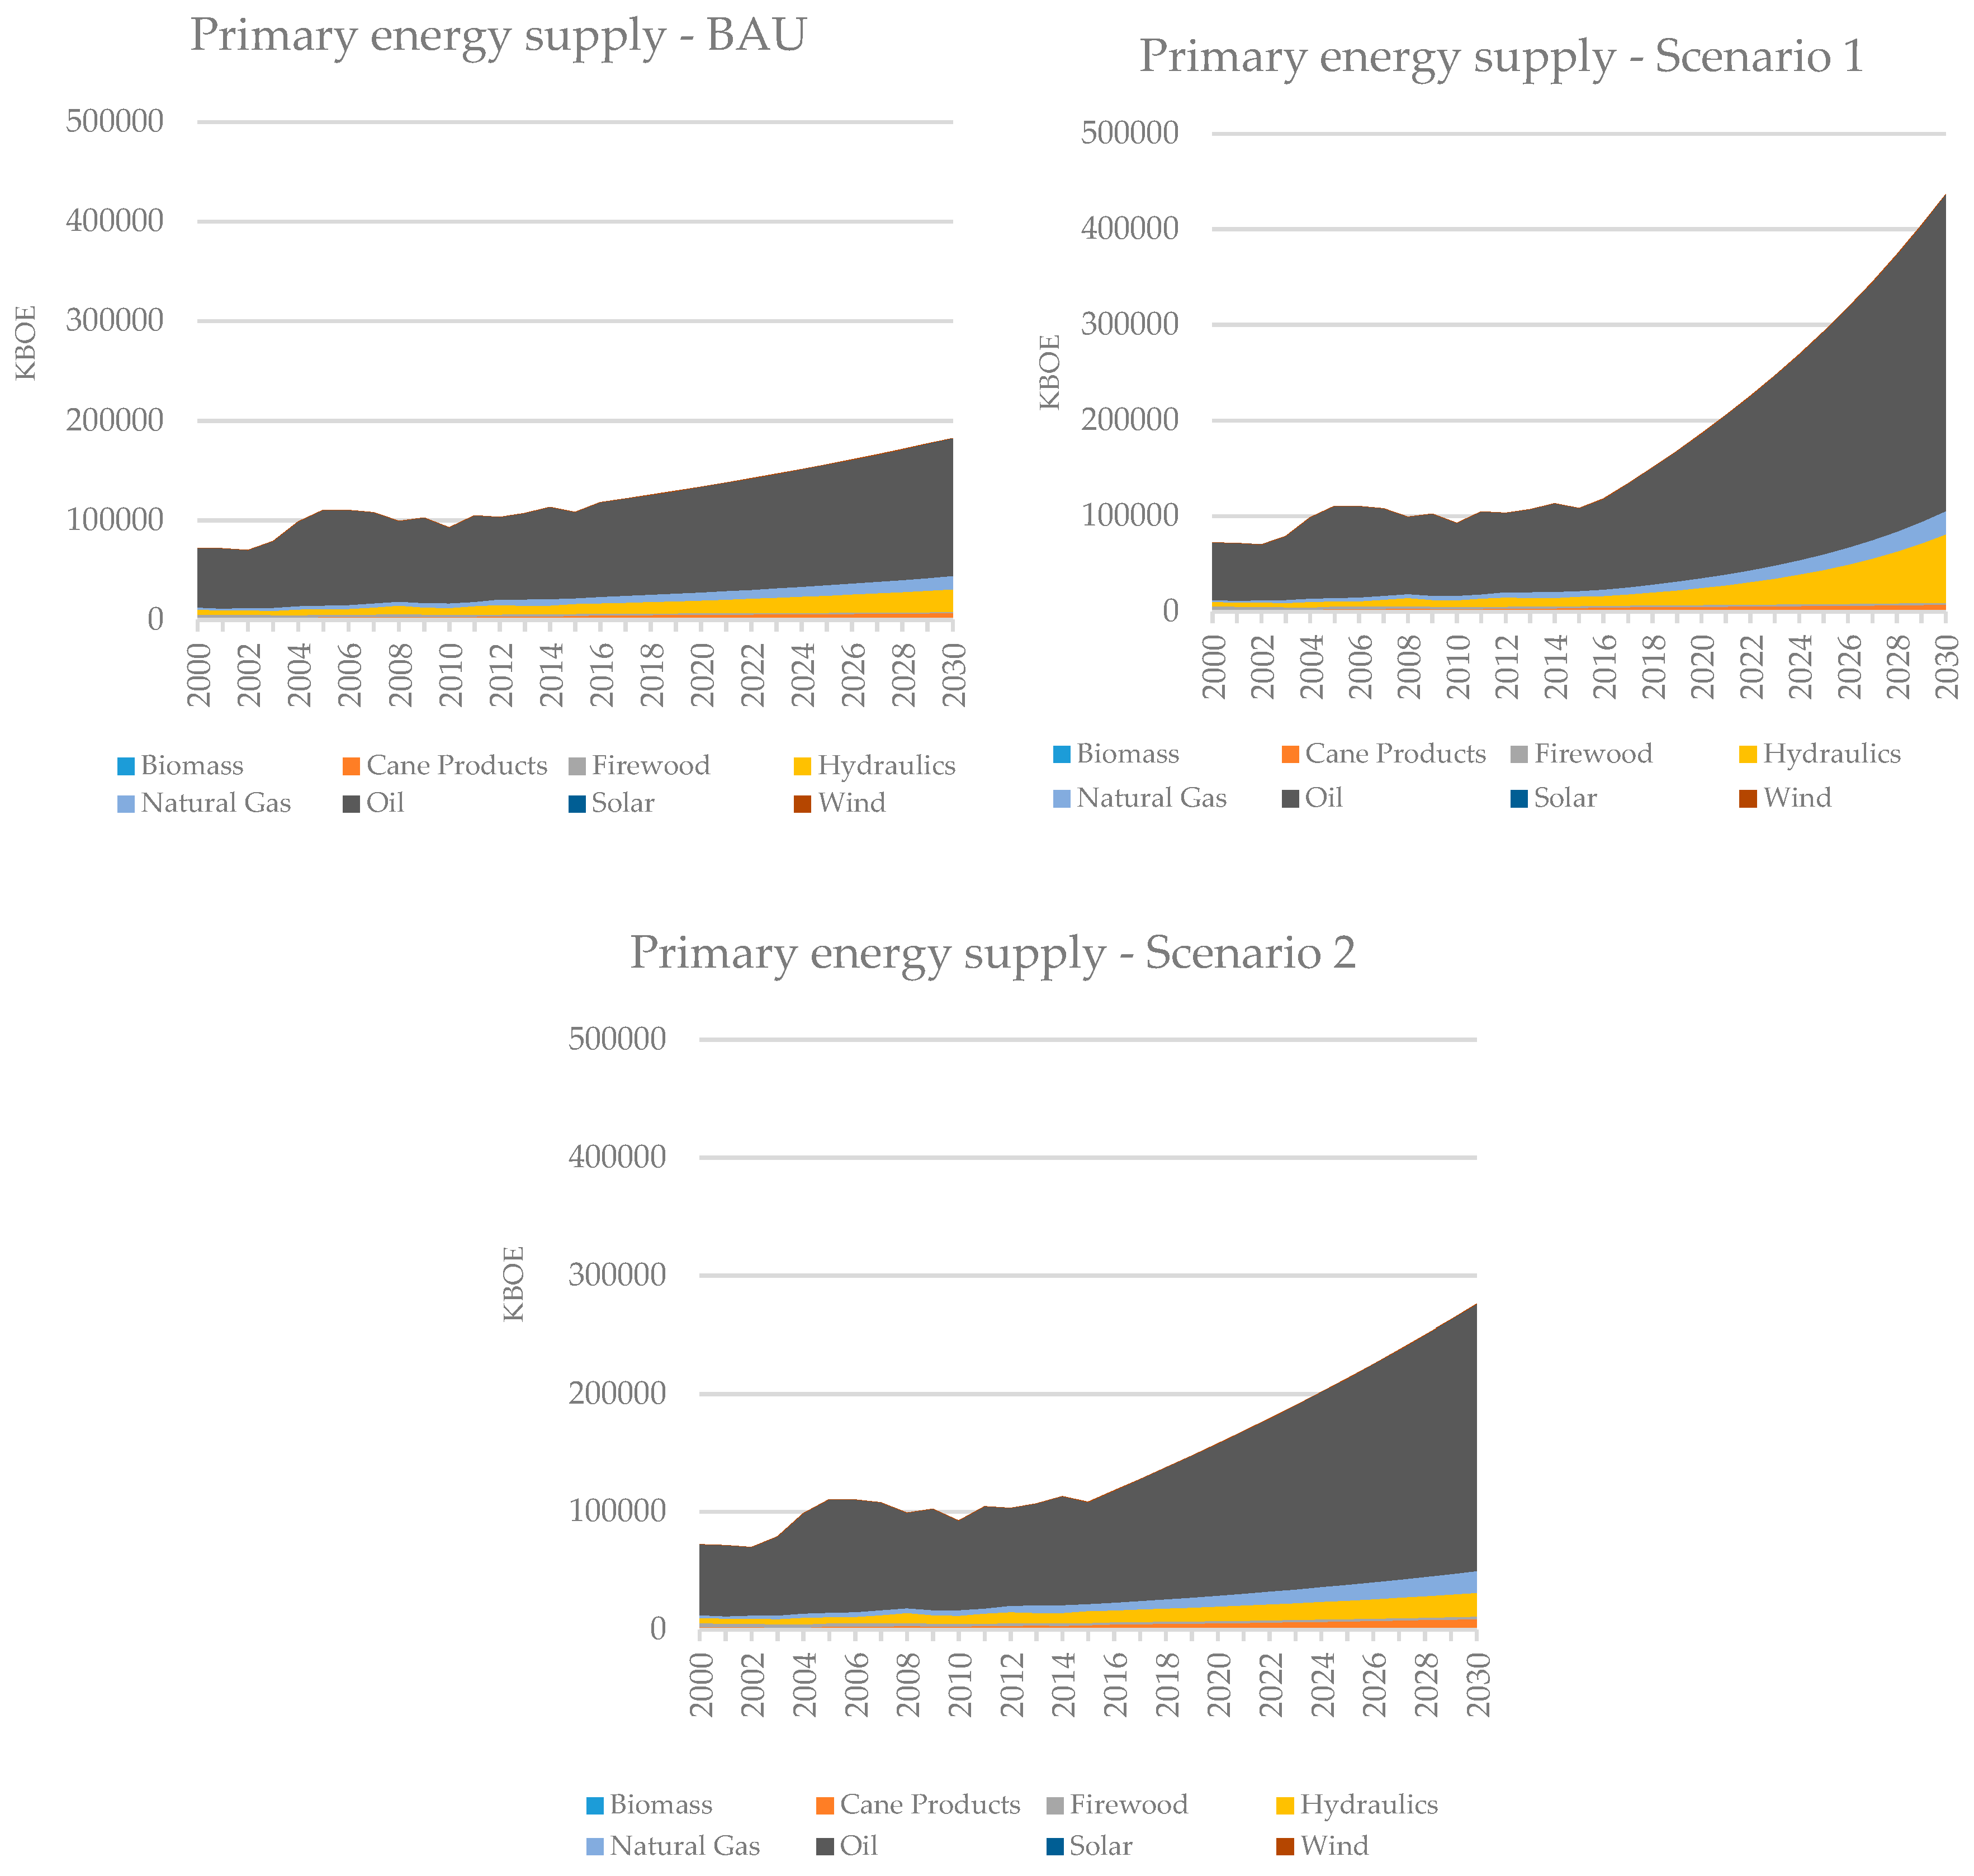
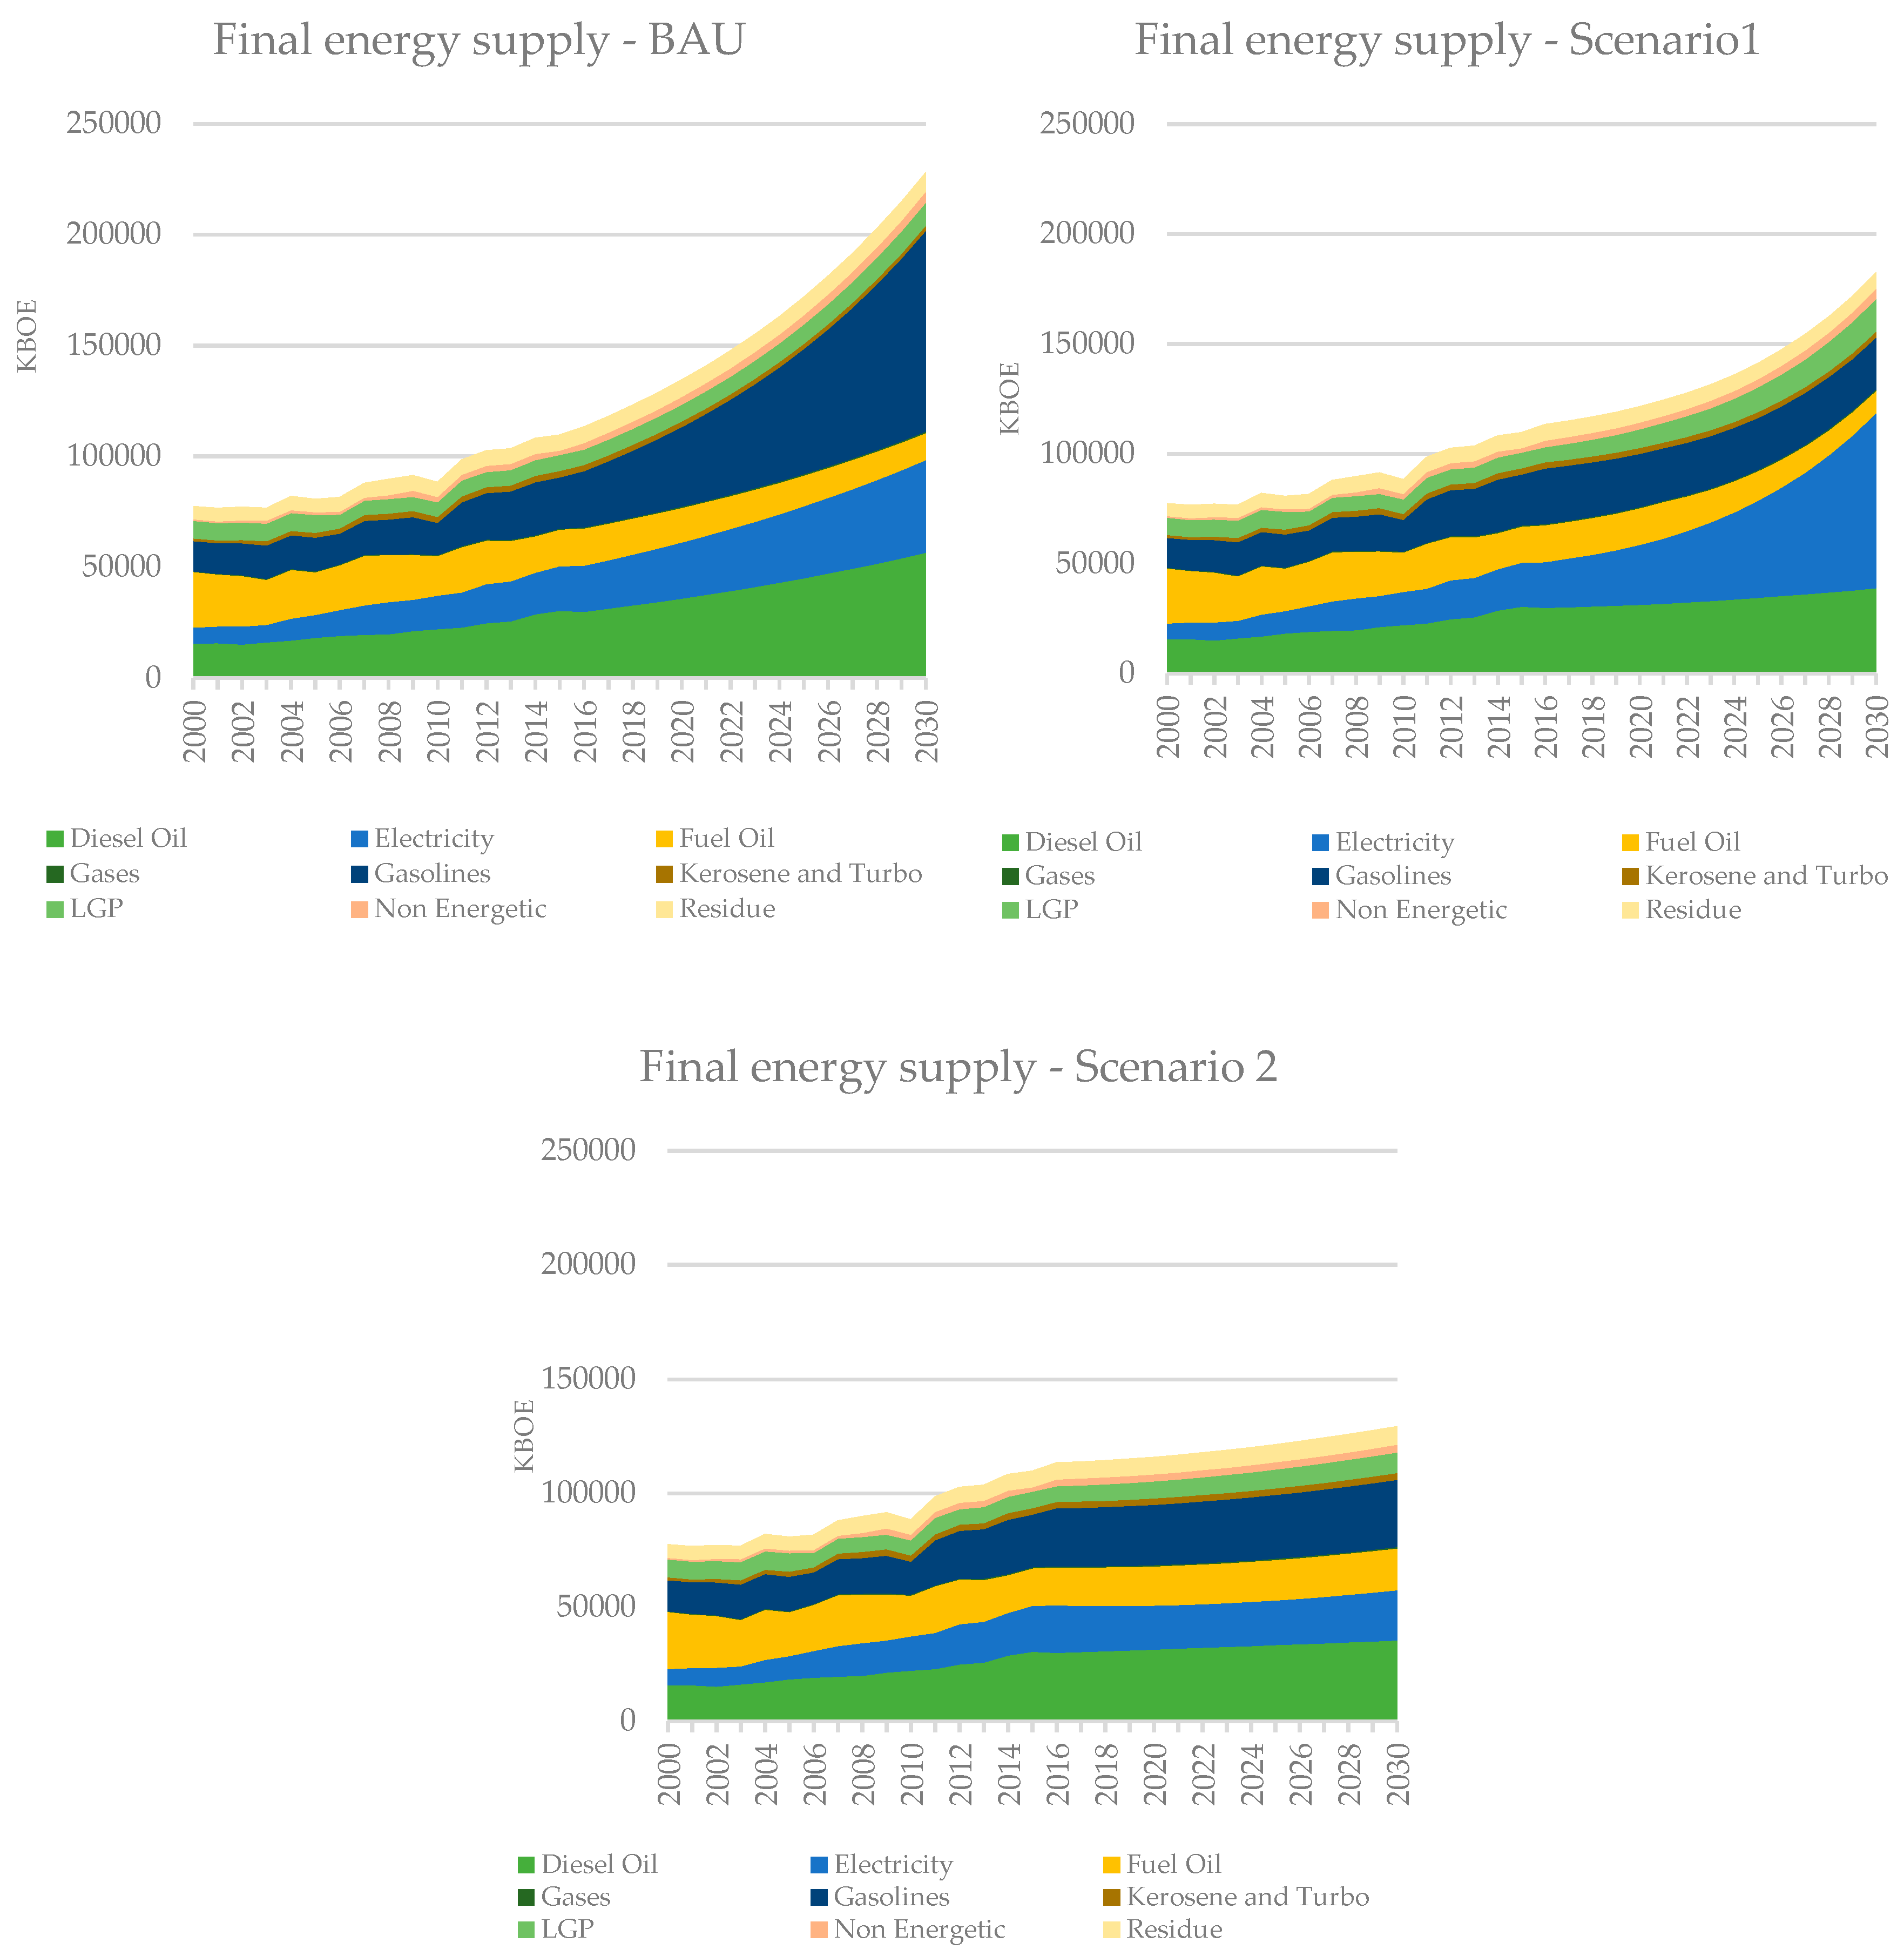
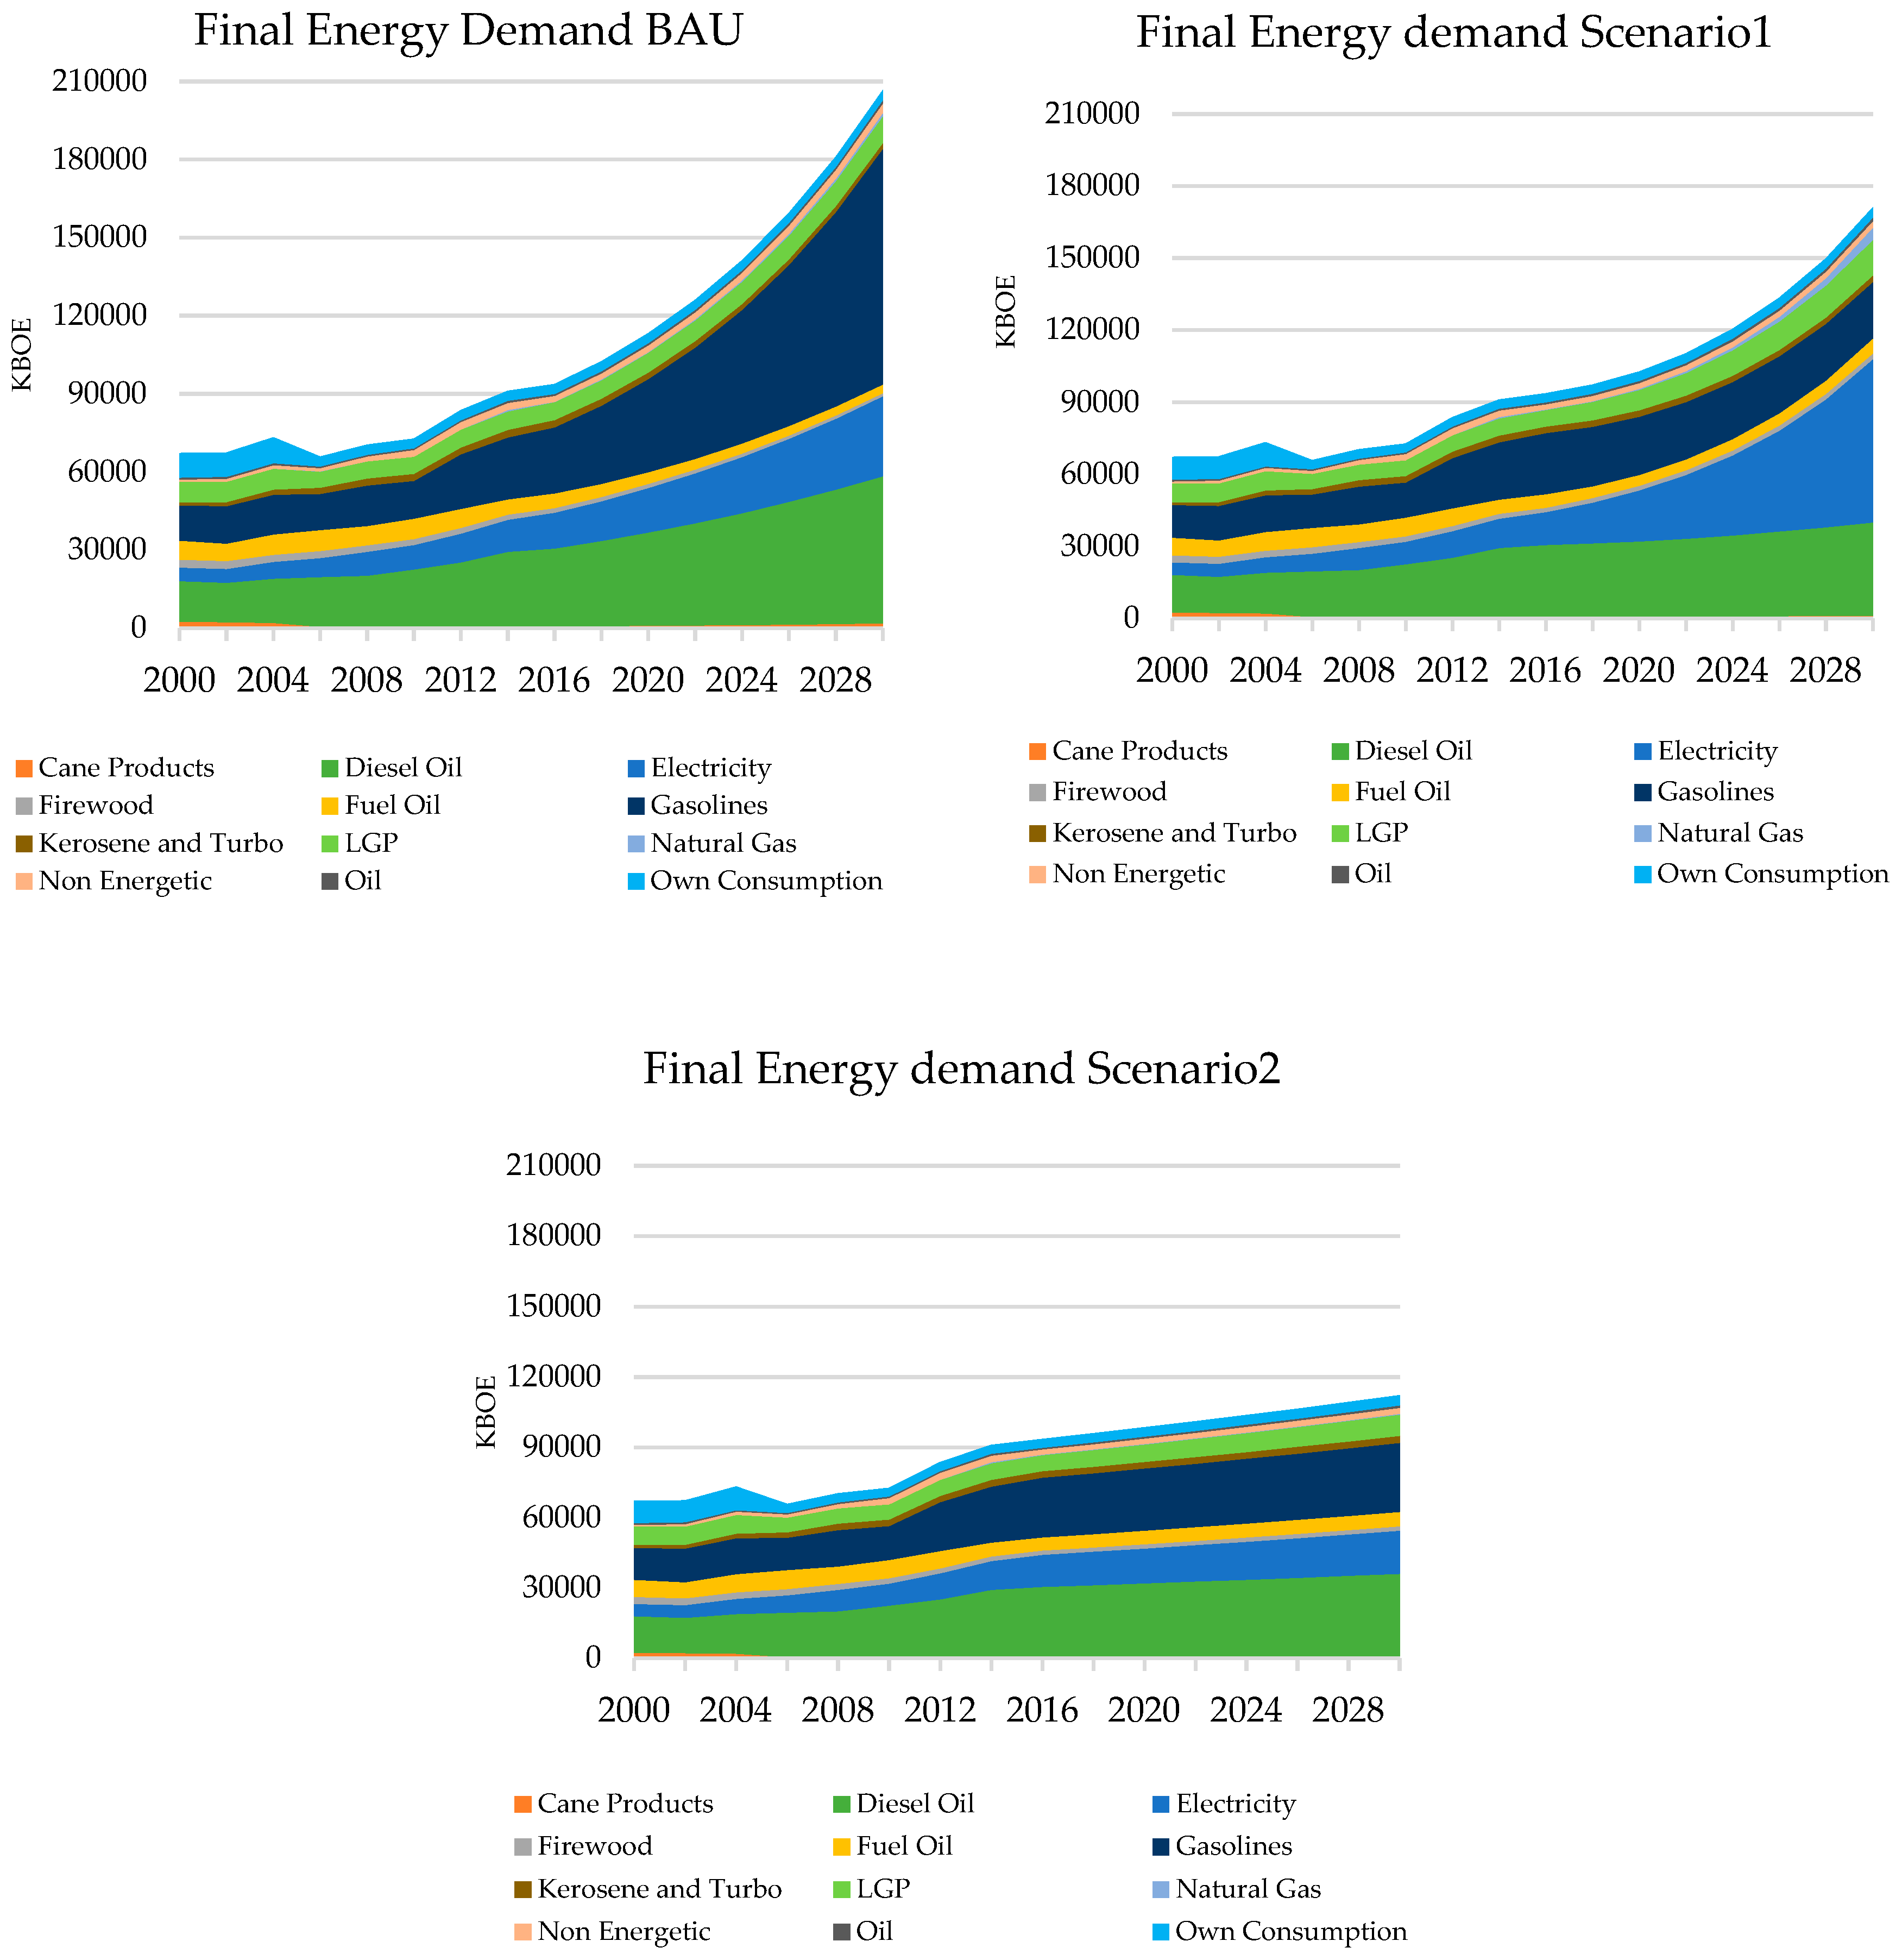
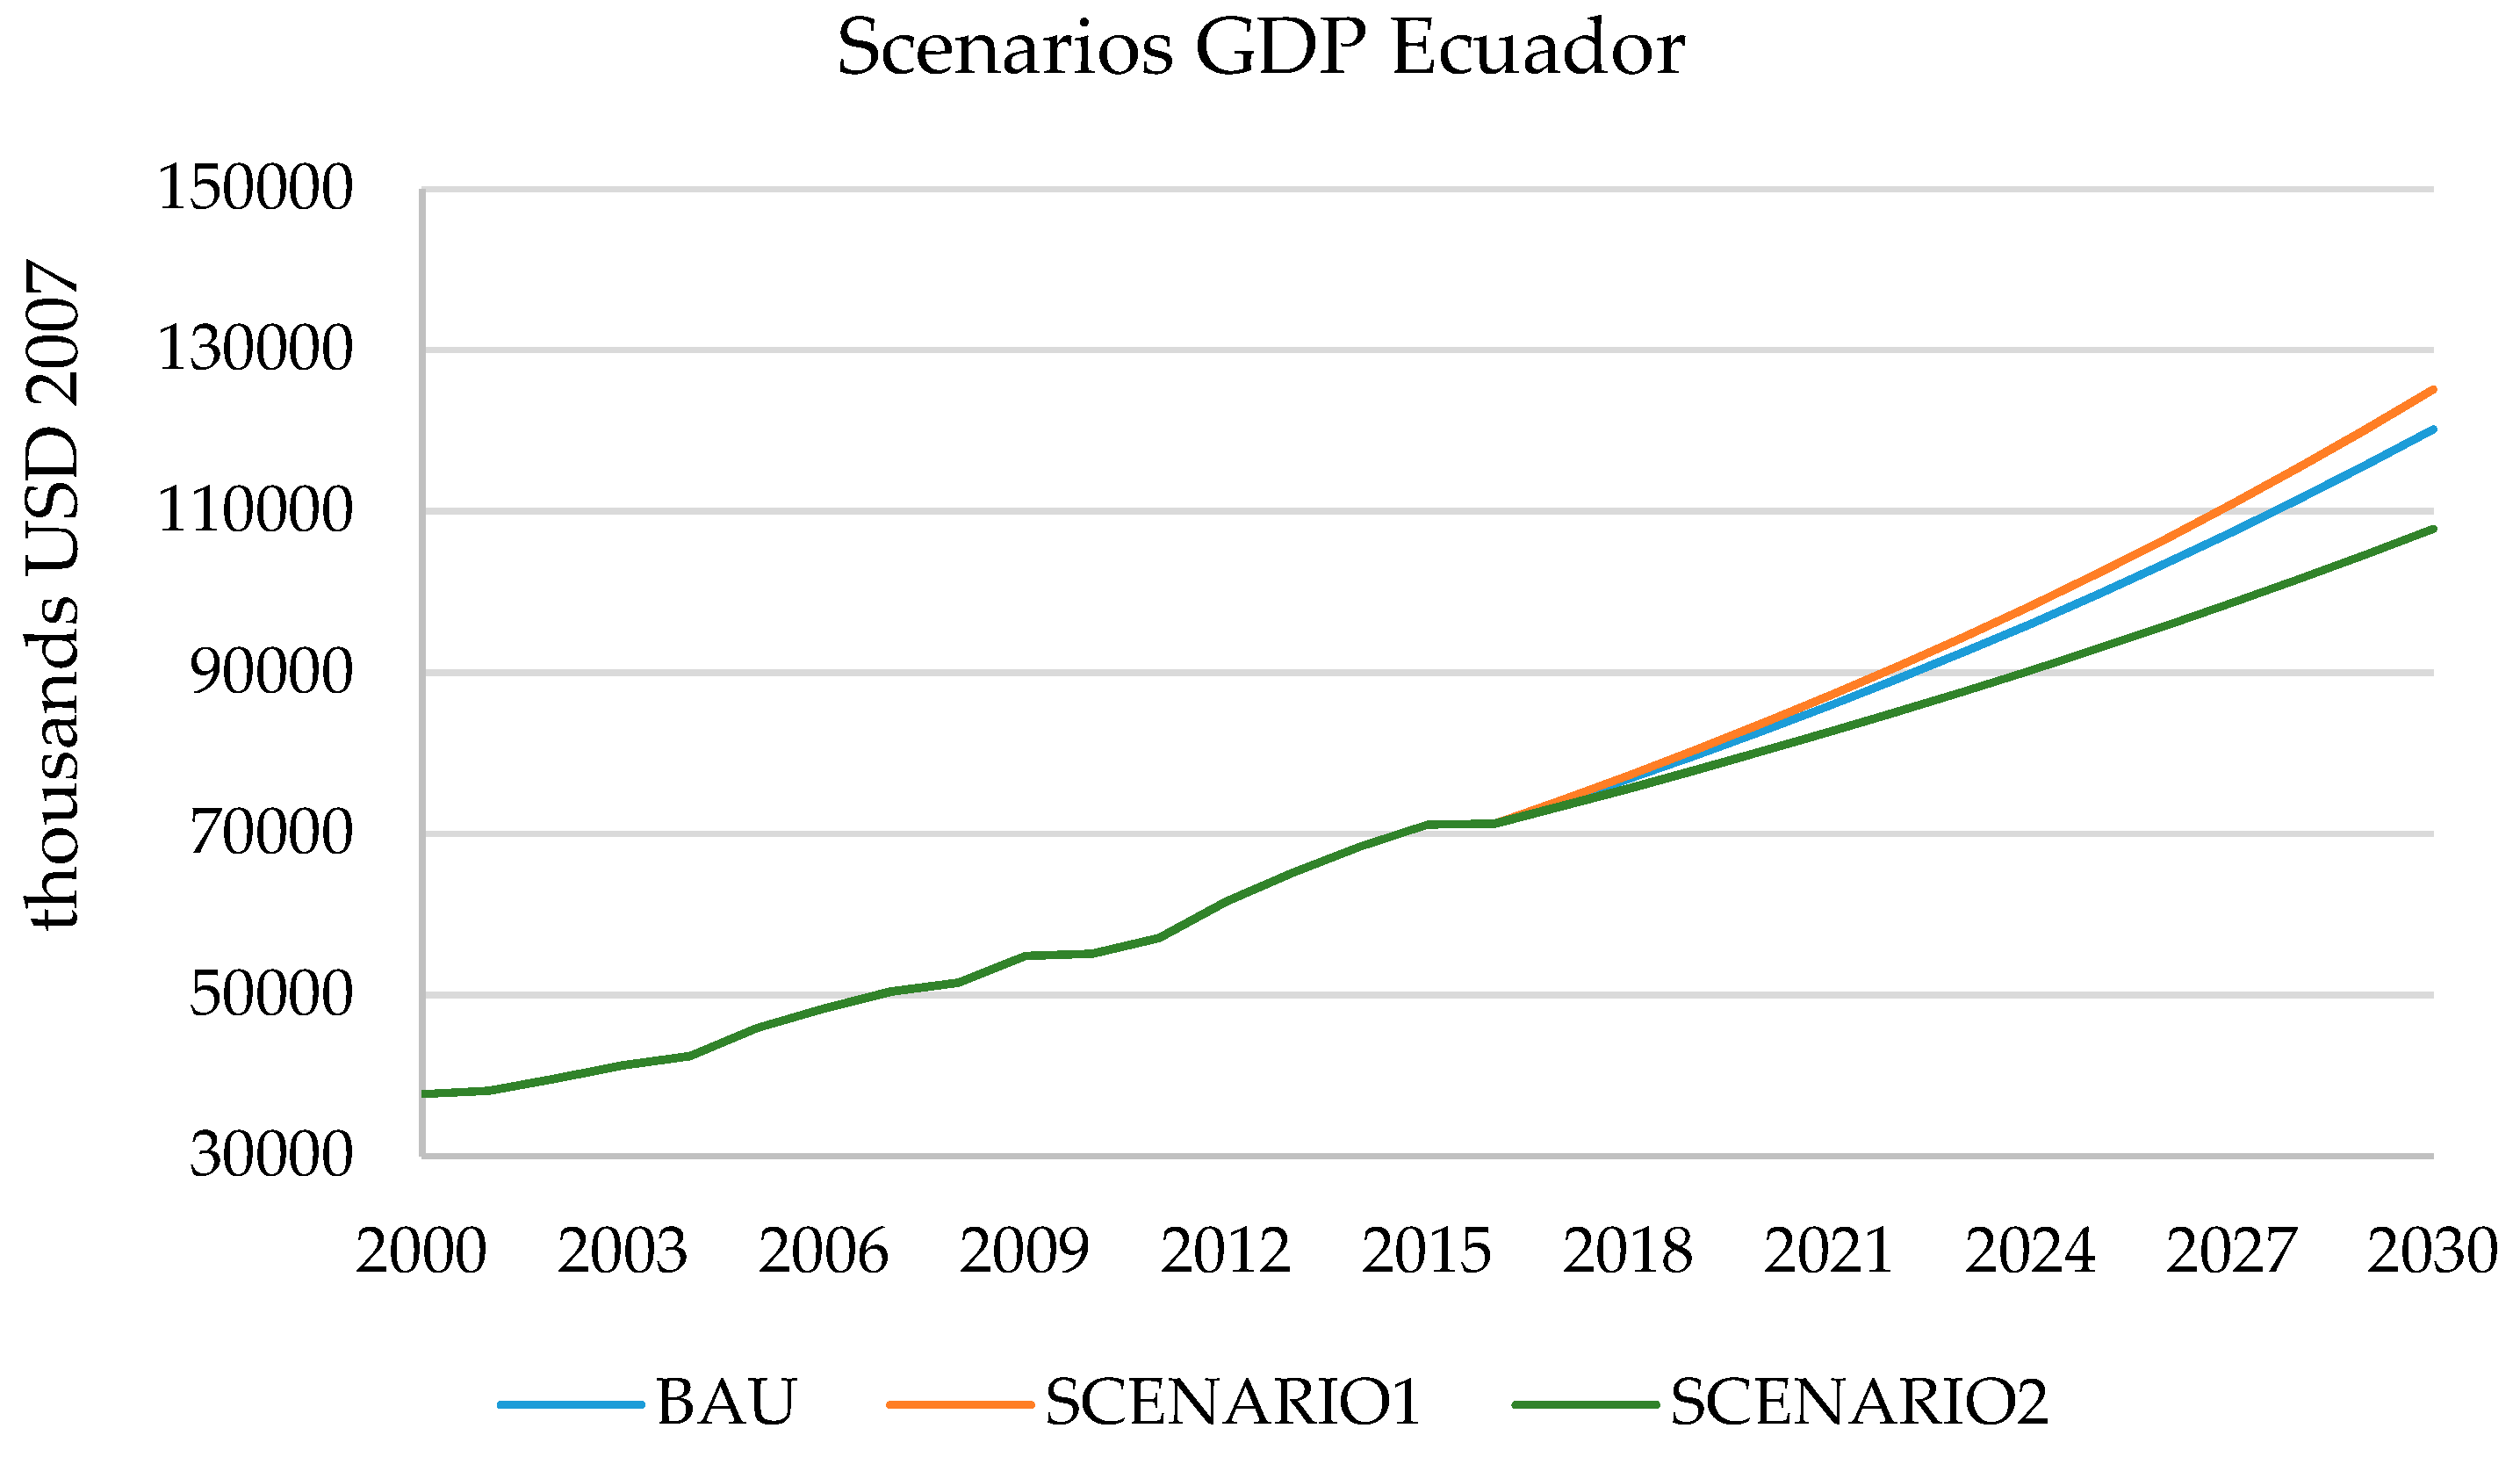
After the model has been calibrated using the original system dataset, a “final” validation is conducted using the second system dataset. The validation of a system dynamics model consists of two broad components: structure validation and behavior validation. The validation of the structure means establishing that the relationships used in the model are an adequate representation of the real relationships, with respect to the purpose of the study. Behavior validation consists of demonstrating that the behavior of the model is “close enough” to the actual behavior observed.
The validation of the model to test its predictive power and robustness in the first instance was performed comparing the official data from 2000 to 2015. The validation method was performed by calculating the mean absolute percentage error (MAPE), which is defined as:
MAPE ( % ) = 1 n | At Ft At | × 100
where MAPE is the mean absolute percentage error, and At, Ft, and “n” are the real data, the calculated values, and the number of data, respectively. Table 2 shows the values obtained from the MAPE method. These results indicate the strength of the model. In this investigation, we note that CO2 emissions come from the burning of fossil fuels consumed by the six economic sectors of Ecuador.

3. Results

Ecuador has maintained an energy combination based on fossil sources, where renewable energy source technologies were constrained by poor development, but now have greater participation with the start-up of large capacity hydroelectric plants.
Figure 9 shows three scenarios of primary energy supply. The BAU projects a lower primary energy supply, mainly since the other two scenarios propose energy production and exploitation policies. In SCENARIO1, national government policies include the construction of new hydroelectric projects as well as the continuation of oil exploitation [79], so the growth of energy supply is justified mainly in the implementation of hydroelectric megaprojects [80]. Primary energy production under national policies will reach 436,847.13 KBOE.
The projection of the final energy production in Ecuador gives us the result that the BAU scenario projects the greatest growth reaching 228,167.83 KBOE by 2030, while the scenarios based on national or global policies showed lower values in final energy production, reaching very similar values of 182,586.26 KBOE and 129,412.62 KBOE (Figure 10). The lower values may be due to the fact that industrialized countries have greater energy efficiency and are committed to increasing their energy generation from renewable sources, reducing the use of fossil fuels [81] while in the case of Ecuador, oil is its main source [71].
The projected final energy demand reaches 206,681.22 KBOE in the BAU scenario, being the fastest growing (Figure 11). Projecting the scenarios that consider national policies or world trends, we can observe that the production decreases, mainly due to the efficiency of the type of energy planned to be used [82]. The efficiency of hydropower is much better than the efficiency of fossil fuels [83], the transition to renewable energies seen in both scenarios leads us to a demand projection of 171,093.94 and 112,286.78 KBOE in the sceneries 1 and 2, respectively.
Figure 12 shows the different scenarios of GDP growth in Ecuador. Economic growth in any of the scenarios will be affected by the oil barrel price. Government policies are set based on the growth of exports of non-traditional products, the exploitation of new oil fields, and mainly by the level of foreign investment [84]. Ecuador has proven oil reserves of 8.3 billion barrels [48]. The average GDP growth rate for the simulation period shows a 3.84% growth in the BAU scenario, 3.22% in SCENARIO1, and 3.45% in SCENARIO2.
Energy intensity is currently an indicator of the energy efficiency of a sector and therefore of a country. Economic growth is directly related with the efficient use of energy [49]. Figure 13 shows the projections of the Energy Intensity in Ecuador. The BAU scenario shows a growth in energy intensity in the 2016–2030 simulation period, with the increase being 1.42%. On the other hand, SCENARIO1 and SCENARIO2 have more positive projections that reach an energy intensity of 1.08 and 0.96, respectively. Currently, Ecuador which maintains an energy combination heavily based on fossil fuel energy, presents inefficiency indicators, mainly in the transport and industry sectors [68].
Figure 14 shows the evolution and projection of total CO2 emissions by the final energy consumption in the country between 2000 and 2030. Since 2009, the production of CO2 emissions begins with a constant growth and is very similar to the rate of global average emissions growth, while since 2015 the total emission values began to grow by a smaller percentage due to the energy matrix change policies proposed by the national government [79].
If the proportion of current energy sources were maintained, CO2 emissions would increase by 2030 (BAU scenario). However for the scenarios that contemplate an energy combination with a higher proportion of renewable energies, emissions from all sectors would decrease significantly, reaching low levels in Ecuador. The projections of CO2 emissions from final energy were 75,182.6; 43,938.3, and 342,191.4 KTCO2 in the BAU, SCENARIO 1, and SCENARIO 2, respectively.

4. Discussion

In order to analyze the energy intensity of Ecuador and project the production of CO2 emissions in Ecuador during the period 2000–2030, an integrated systems dynamics model was developed based on a Vensim software framework [80].
The BAU, SCENARIO1, and SCENARIO2 projections for 2030 maintain a growth in the supply and demand of final energy in relation to the 2015 values. The projections of final energy demand forecast the largest increase in the BAU scenario at 206,681.22 KBOE and the lowest growth for SCENARIO2 at 112,286.78 KBOE. A close relationship could be observed between the final energy supply and the final energy demand, which could be mainly associated with a transition towards energy production from renewable energies [58,85,86,87].
The application of the measures derived from the BAU, SCENARIO1, and SCENARIO2 project an approximate increase of 42% in GDP by 2030 compared to 2015 GDP, the year in which the simulation of the model began, while SCENARIO2 forecasts a smaller increase compared to the other two scenarios of 34% (Figure 12).
A significant reduction in energy intensity could be expected. This improvement would be associated with a change in the national energy matrix; through the replacement of the use of fossil fuels by renewable energy sources [88,89].
SCENARIO1 and SCENARIO2 expect a production of CO2 emissions of 43,938.3 and 42,191.4 KTCO2 by 2030, respectively. If environmental trends are taken into account and policies proposed by developed countries, the production of carbon emissions would reduce the average growth rate from 1.64% in SCENARIO1 to 1.08% in SCENARIO2.
Energy efficiency contributes to the reduction of expenses in the entire energy chain, decreases the dependence on energy imports, mitigates damage to the global and local environment, contributes to the improvement of the productive efficiency of the country and has positive impacts in terms of social equity [90,91,92]. It also directs economic activity towards activities of high added value and low energy consumption.
Recent efforts in energy efficiency have not achieved what is necessary in a transversal way and the results thus far have not met expectations. This is largely because the largest amount of energy used in Ecuador comes from fossil sources. Since 2016, fossil fuels have represented 77.65% of total energy consumption, with the transport sector being the main emitter of greenhouse gases.
Sectors such as transport or industry maintain a tendency to consume more energy, and due to its fossil origin, these sectors produce a greater amount of emissions and are very inefficient in terms of energy. In the transport sector, it is necessary to review the quality of the fuel and the quality of the hydrocarbons. The infrastructure for transport circulation must be optimized, contributing to reduction of fuel consumption. Projects must be continued to replace inefficient public transport technologies.
The results obtained through the system dynamics model, developed to simulate the scenarios of energy intensity and production of CO2 emissions by 2030, will work as a basis for proposals for future energy policies aimed at mitigating emissions and improving national energy efficiency. In comparison with the works carried out and cited in the bibliographic review, it is observed that this research shows a more up-to-date panorama on the economic-environmental scenario of Ecuador. The energy perspective may change depending on the projects implemented by the government. The projection of the studies carried out shows a notable increase of CO2 emissions if the current conditions of energy consumption and the energy mix based on non-renewable energies are maintained.

5. Conclusions

Considering the hydroelectric potential of Ecuador, an energy combination is observed where hydropower and other renewable sources would have a greater participation, such as those that reduce the production of CO2 emissions.
The increasing use of hydropower in recent years has played a fundamental role in reducing CO2 emissions. The development of renewable energies is important for Ecuador, though policies are needed to facilitate a greater supply of clean energy. The use of energy from natural sources must be encouraged. Projects such as The Metro in Quito and the Tram in Cuenca are the beginning of a transition toward a more sustainable public transport model.
The use of hydropower should also be promoted, as well as fossil fuel replacement policies, the use of induction cookers instead of LPG, and the use of electric vehicles for light transportation and passengers. The replacement of fuels modifies the intensity of energy due to its different level of efficiency.
Considering that fossil fuels are a main source of total energy consumption, it is a must for Ecuador to improve energy efficiency due to a reduction of expenses throughout the energy chain, decrease in emissions and improvement in the country’s productivity. The industrial sector must continue with projects that improve its performance, and it is essential to change energies, meaning the industrial sector must migrate to more efficient sources of energy.
It is necessary to replace inefficient equipment, such as engines, pumps, boilers, and water heaters in industry, as well as to apply cogeneration systems and embrace an energy management system. Considering the importance of renewable energy in Ecuador, we recommend promoting the development of a market of Energy Services Companies, which would generate income and encourage improvement measures in the industrial sector. This would lead to savings obtained by the decrease of energy consumption.
It is necessary to increase the efficient use of energy in residential, commercial, and public buildings, through regulations on the habitability criteria in the buildings. We must strengthen equipment replacement programs with higher energy consumption and appliance labeling, and replace public lighting luminaires with more efficient ones, as well as strengthening the energy efficiency program for induction cooking and water heating with electricity.
The creation and improvement of technical capacities in this area of energy efficiency should be encouraged; the training, certification, and accreditation of experts in energy efficiency and energy management should be promoted, in order to incorporate best practices and standards in the different sectors of Ecuador.

Author Contributions

Investigation F.R.A.M.; conceptualization, F.R.A.M. and L.J.M.; methodology, F.R.A.M. and L.J.M.; software, F.R.A.M. and L.J.M.; writing—original draft preparation F.R.A.M.; writing—review and editing F.R.A.M. and L.J.M.; supervision L.J.M.; validation L.J.M. All authors have read and agreed to the published version of the manuscript.

Funding

This research received no external funding.

Conflicts of Interest

The authors declare no conflict of interest.

References

  1. CO2.earth. Earth’s CO2 Home Page, September 2019. Available online: https://www.co2.earth/earths-co2-main-page (accessed on 30 October 2019).
  2. UN Environment. United Nations Environment Programme. Available online: https://www.unenvironment.org/explore-topics/climate-change/about-climate-change (accessed on 29 October 2019).
  3. Querol, X.; Baldasano, J.; Boldo, E.; Borge, R.; Casanova, J.; Castro, T.; Cristóbal, Á.; Lanzani, G.; Lumbreras, J.; Lutz, M.; et al. Air Quality in Cities. A Global Challenge; Fundació Naturgy: Barcelona, Spain, 2018. [Google Scholar]
  4. Fogarty, D. The Straits Times, 6 December 2018. Available online: https://www.straitstimes.com/world/study-global-co2-emissions-to-hit-record-in-2018 (accessed on 30 October 2019).
  5. IPCC. Climate Change 2014: Impacts, Adaptation, and Vulnerability; Cambridge University Press: New York, NY, USA, 2014. [Google Scholar]
  6. Lazaroiu, G.; Ciupageanu, D.A. Multi-criteria decision mking in sustainable renewable energy systems. In Proceedings of the 19th International Multidisciplinary Scientific GeoConference, Sofia, Bulgaria, 29 June 2019; Volume 4, pp. 332–352. [Google Scholar]
  7. Ciupageanu, A.; Lazaroiu, G.; Barelli, L. Wind energy integration: Variability analysis and power system impact assessment. Energy 2019, 185, 1183–1196. [Google Scholar] [CrossRef]
  8. Ciupageanu, D.-A.; Lazaroiu, G.; Mihai, T. Carbon dioxide emissions reduction by renewable energy employment in Romania. In Proceedings of the IEEE International Conference on Electromechanical and Power Systems, Iasi, Romania, 12 October 2017; Volume 11, pp. 281–285. [Google Scholar]
  9. Capellán-Péreza, I.; de Castro, C.; González, L.J.M. Dynamic Energy Return on Energy Investment (EROI) and material requirements in scenarios of global transition to renewable energies. Energy Strategy Rev. 2019, 26, 1–26. [Google Scholar] [CrossRef]
  10. Herrerias, M. World energy intensity convergence revisited: A weighted distribution dynamics approach. Energy Policy 2012, 49, 383–399. [Google Scholar] [CrossRef]
  11. The Global Goals for Sustainable Development. The 17 Goals. Available online: https://www.globalgoals.org/ (accessed on 30 September 2019).
  12. Wang, C. Changing energy intensity of economies in the world and its decomposition. Energy Econ. 2013, 40, 637–644. [Google Scholar] [CrossRef]
  13. Intergovernmental Panel on Climate Change. Climate Change 2014: Synthesis Report; IPCC: Geneva, Switzerland, 2015. [Google Scholar]
  14. Yeh, J.-C.; Liao, C.-H. Impact of population and economic growth on carbon emissions in Taiwan using an analytic tool STIRPAT. Sustain. Environ. Res. 2017, 27, 41–48. [Google Scholar] [CrossRef] [Green Version]
  15. Lin, B.; Tan, R. Sustainable development of China’s energy intensive industries: From the aspect of carbon dioxide emissions reduction. Renew. Sustain. Energy Rev. 2017, 77, 386–394. [Google Scholar] [CrossRef]
  16. Mirzaei, M.; Bekri, M. Energy consumption and CO2 emissions in Iran, 2025. Environ. Res. 2017, 154, 345–351. [Google Scholar] [CrossRef]
  17. Lin, B.; Omoju, O.E.; Okonkwo, J.U. Impact of industrialisation on CO2 emissions in Nigeria. Renew. Sustain. Energy Rev. 2015, 52, 1228–1239. [Google Scholar] [CrossRef]
  18. Saidi, K.; Hammami, S. The impact of CO2 emissions and economic growth on energy consumption in 58 countries. Energy Rep. 2015, 1, 62–70. [Google Scholar] [CrossRef] [Green Version]
  19. Martínez-Zarzoso, I.; Bengochea-Morancho, A. Pooled mean group estimation of an environmental Kuznets curve for CO2. Econ. Lett. 2004, 82, 121–126. [Google Scholar] [CrossRef]
  20. Apergis, N.; Payne, J.E. CO2 emissions, energy usage, and output in Central America. Energy Policy 2009, 37, 3282–3286. [Google Scholar] [CrossRef]
  21. Lean, H.; Smyth, R. CO2 emissions, electricity consumption and output in ASEAN. Appl. Energy 2010, 87, 1858–1864. [Google Scholar] [CrossRef]
  22. Hossain, M.S. Panel estimation for CO2 emissions, energy consumption, economic growth, trade openness and urbanization of newly industrialized countries. Energy Policy 2011, 39, 6991–6999. [Google Scholar] [CrossRef]
  23. Pao, H.-T.; Tsai, C.-M. CO2 emissions, energy consumption and economic growth in BRIC countries. Energy Policy 2010, 38, 7850–7860. [Google Scholar] [CrossRef]
  24. Arroyo, F.; Miguel, L. Analysis of energy demand scenarios in Ecuador: National government policy perspectives and global trend to reduce CO2 emissions. Int. J. Energy Econ. Policy 2019, 9, 364–374. [Google Scholar]
  25. Li, K.; Lin, B. Impacts of urbanization and industrialization on energy consumption/CO2 emissions: Does the level of development matter? Renew. Sustain. Energy Rev. 2015, 52, 1107–1122. [Google Scholar] [CrossRef]
  26. Tang, V.; Vijay, S.; Massachusetts Institute of Technology, Cambridge, Massachusetts. Personal communication, 2001.
  27. Metcalf, G.E. An Empirical Analysis of Energy Intensity and Its Determinants at the State Level. Energy J. 2008, 29, 1–26. [Google Scholar] [CrossRef]
  28. OECD. Energy, OECD Growth Studies Energy; OECD: Paris, France, 2011. [Google Scholar]
  29. International Energy Agency. Market Report Series: Energy Efficiency 2017; International Energy Agency: París, France, 2017. [Google Scholar]
  30. Atalla, T.; Bean, P. Determinants of energy productivity in 39 countries: An empirical investigation. Energy Econ. 2017, 62, 217–229. [Google Scholar] [CrossRef]
  31. Carpio, C.V. Analysis of Energy Intensity in the End-Use Sectors of the Ecuadorian Economy. Master’s Thesis, University of Technology, Sydney, Australia, 2015. [Google Scholar]
  32. Huang, J.; Du, D.; Tao, Q. An analysis of technological factors and energy intensity in China. Energy Policy 2017, 109, 1–9. [Google Scholar] [CrossRef]
  33. Firlej, K. Energy intensity of GDP in the light of energy policy objectives in Poland until 2030. In Proceedings of the International Conference Hradec Economic Days 2012—Economic Development and Management of Regions, Hradec Kralove, The Czech Republic, 31 January–1 February 2012; pp. 1–8. [Google Scholar]
  34. Eder, L.; Provornaya, I. Analysis of energy intensity trend as a tool for long-term forecasting of energy consumption. Energy Effic. 2018, 11, 1971–1997. [Google Scholar] [CrossRef]
  35. Gielen, D.; Boshell, F.; Saygin, D.; Bazilian, D.M. N. Wagner and R. Gorini, The role of renewable energy in the global energy transformation. Energy Strategy Rev. 2019, 24, 38–50. [Google Scholar] [CrossRef]
  36. Robledo, J.C.; Olivares, W. Relationship between CO2 emissions, energy consumption and GDP: The case of CIVETS. Semest. Económico 2013, 16, 45–66. [Google Scholar]
  37. Saboori, B.; Sulaiman, J. CO2 emissions, energy consumption and economic growth in Association of Southeast Asian Nations (ASEAN) countries: A cointegration approach. Energy 2013, 55, 813–822. [Google Scholar] [CrossRef]
  38. Contreras, G.; Platania, F. Economic and policy uncertainty in climate change mitigation: The London Smart City case scenario. Technol. Forecast. Soc. Chang. 2019, 142, 384–393. [Google Scholar] [CrossRef]
  39. Barron, R.; McJeon, H. The differential impact of low-carbon technologies on climate change mitigation cost under a range of socioeconomic and climate policy scenarios. Energy Policy 2015, 80, 264–274. [Google Scholar] [CrossRef]
  40. Moss, R.; Edmonds, J.; Hibbard, K.; Manning, M.; Rose, S.; van Vuuren, D.; Carter, T.; Emori, S.; Kainuma, M.; Kram, T.; et al. The next generation of scenarios for climate change research and assessment. Nature 2010, 463, 747–756. [Google Scholar] [CrossRef]
  41. Van Vuuren, D.P.; Isaac, M.; Kundzewicz, Z.W.; Arnell, N.; Barker, T.; Criqui, P.; Berkhout, F.; Hilderink, H.; Hinkel, J.; Hof, A.; et al. The use of scenarios as the basis for combined assessment of climate change mitigation and adaptation. Glob. Environ. Chang. 2011, 21, 575–591. [Google Scholar] [CrossRef] [Green Version]
  42. Nema, P.; Nema, S.; Roy, P. An overview of global climate changing in current scenario and mitigation action. Renew. Sustain. Energy Rev. 2012, 16, 2329–2336. [Google Scholar] [CrossRef]
  43. Fujimori, S.; Kainuma, M.; Masui, T.; Hasegawa, T.; Dai, H. The effectiveness of energy service demand reduction: A scenario analysis of global climate change mitigation. Energy Policy 2014, 75, 379–391. [Google Scholar] [CrossRef]
  44. Syri, S.; Lehtilä, A.; Ekholm, T.; Savolainen, I.; Holttinen, H.; Peltola, E. Global energy and emissions scenarios for effective climate change mitigation—Deterministic and stochastic scenarios with the TIAM model. Int. J. Greenh. Gas Control 2008, 2, 274–285. [Google Scholar] [CrossRef]
  45. Arroyo, F.; Bravo, L. Future scenarios of CO2 emissions produced by the final energy consumption in Ecuador. Revista Energía Mecánica Innovación y Futuro 2017, 1, 31–38. [Google Scholar]
  46. Fresnada, C. Global Alert for Pollution in Cities Around the Planet. Available online: https://www.elmundo.es/salud/2016/01/18/569bba3d268e3ea1548b45e4.html (accessed on 30 October 2019).
  47. Dyson, B.; Chang, N.-B. Forecasting municipal solid waste generation in a fast-growing urban region with system dynamics modeling. Waste Manag. 2005, 25, 669–679. [Google Scholar] [CrossRef] [PubMed]
  48. El Universo. Mistrust, Legacy of Almost Five Decades of Oil Exploitation in Ecuador; El Universo: Quito, Ecuador, 2019. [Google Scholar]
  49. Everett, T.; Ishwaran, M.; Ansaloni, G.P.; Rubin, A. Economic Growth and the Environment, Department for Environment; Food and Rural Affairs: London, UK, 2010. [Google Scholar]
  50. UNED. Energy, Sustainable Development, 31 March 2016. Available online: http://www2.uned.es/biblioteca/energiarenovable3/impacto.htm (accessed on 30 October 2019).
  51. Samuelson, R.D. The unexpected challenges of using energy intensity as a policy objective: Examining the debate over the APEC energy intensity goal. Energy Policy 2014, 64, 373–381. [Google Scholar] [CrossRef] [Green Version]
  52. Torrie, R.D.; Stone, C.; Layzell, D.B. Reconciling energy efficiency and energy intensity metrics: An integrated decomposition analysis. Energy Effic. 2018, 11, 1999–2016. [Google Scholar] [CrossRef] [Green Version]
  53. Choi, B.; W, P.; Yu, B.-K. Energy Intensity, Firm Growth. Energy Econ. 2017, 65, 1–44. [Google Scholar] [CrossRef]
  54. Karimu, A.; Brännlund, R.; Lundgren, T.; Söderholm, P. Energy intensity and convergence in Swedish industry: A combined econometric and decomposition analysis. Energy Econ. 2017, 62, 347–356. [Google Scholar] [CrossRef] [Green Version]
  55. Hasanbeigi, A.; de la Rue du Can, S.; Sathaye, J. Analysis and decomposition of the energy intensity of California industries. Energy Policy 2012, 46, 234–245. [Google Scholar] [CrossRef]
  56. Liddle, B. Revisiting world energy intensity convergence for regional differences. Appl. Energy 2010, 87, 3218–3225. [Google Scholar] [CrossRef]
  57. Burnett, J.W.; Madariaga, J. The convergence of U.S. state-level energy intensity. Energy Econ. 2017, 62, 357–370. [Google Scholar] [CrossRef]
  58. Pakko, M.; Pollard, P.S. Burgernomics: A big MacT guide to purchasing power parity. Econ. Pap. 2003, 85, 9–28. [Google Scholar] [CrossRef]
  59. Xue, B.; Geng, Y.; Muller, K.; Lu, C.; Ren, W. Understanding the Causality between Carbon Dioxide Emission, Fossil Energy Consumption and Economic Growth in Developed Countries: An Empirical Study. Sustainability 2012, 6, 1037–1045. [Google Scholar] [CrossRef] [Green Version]
  60. Porzio, G.F.; Fornai, B.; Amato, A.; Matarese, N.; Vannucci, M.; Chiapelli, L.; Colla, V. Reducing the energy consumption and CO2 emissions of energy intensive industries through decision support systems—An example of application to the steel industry. Appl. Energy 2013, 112, 818–833. [Google Scholar] [CrossRef]
  61. Nain, M.Z.; Ahmad, W.; Kamaiah, B. Economic growth, energy consumption and CO2 emissions in India: A disaggregated causal analysis. Int. J. Sustain. Energy 2015, 36, 807–824. [Google Scholar] [CrossRef]
  62. European Commission. Energy Roadmap 2050; European Commission: Luxembourg, 2012. [Google Scholar]
  63. Moreau, V.; Vuille, F. Decoupling energy use and economic growth: Counter evidence from structural effects and embodied energy in trade. Appl. Energy 2018, 215, 54–62. [Google Scholar] [CrossRef]
  64. Wu, Y.; Zhu, Z.Q.; Zhu, B. Decoupling analysis of world economic growth and CO2 emissions: A study comparing developed and developing countries. J. Clean. Prod. 2018, 190, 94–103. [Google Scholar] [CrossRef]
  65. United Nations Environment Programme. Global Environment Outlook GEO-6: Healthy Planet; UN Environment: Nairobi, Kenya, 2019. [Google Scholar]
  66. Kosow, H. Methods of Future and Scenario Analysis: Overview, Assessment, and Selection Criteria; German Development Institute (DIE): Bonn, Germany, 2008. [Google Scholar]
  67. Wu, D.D.; Kefan, X.; Hua, L.; Shi, Z.; Olson, D.L. Modeling technological innovation risks of an entrepreneurial team using system dynamics: An agent-based perspective. Technol. Forecast. Soc. Chang. 2010, 77, 857–869. [Google Scholar] [CrossRef]
  68. Coordinating Ministry of Strategic Sectors. National Energy Balance 2016; Coordinating Ministry of Strategic Sectors: Quito, Ecuador, 2017. [Google Scholar]
  69. López, A.R. Carbon Emissions, Energy Consumption and Sustainable Development in Ecuador (1980–2025): System Dynamics Modelling, Decomposition Analysis and the Environmental Kuznets Curve. Ph.D. Thesis, Universidad de Huelva, Huelva, Spain, 2014. [Google Scholar]
  70. Herrera, J.C. Study of the Reduction of Carbon Emissions in Ecuador. Master’s Thesis, National Polytechnic School, Quito, Ecuador, 2014. [Google Scholar]
  71. Arroyo, F.; Miguel, L. Analysis of the variation of CO2 emissions and possible scenarios to 2030 in Ecuador. Rev. Espac. 2019, 40, 5–23b. [Google Scholar]
  72. Carbajales-Dale, M.; Barnhart, C.J.; Benson, S.M. Can we afford storage? A dynamic net energy analysis of renewable electricity generation supported by energy storage. Energy Environ. Sci. 2014, 7, 1538–1544. [Google Scholar] [CrossRef] [Green Version]
  73. Hall, C.A.; Lambert, J.G.; Balogh, S.B. EROI of different fuels and the implications for society. Energy Policy 2014, 64, 141–152. [Google Scholar] [CrossRef] [Green Version]
  74. IKessides, N.; Wade, D.C. Deriving an Improved Dynamic EROI to Provide Better Information for Energy Planners. Sustainability 2011, 3, 2339–2357. [Google Scholar] [CrossRef] [Green Version]
  75. Dale, M.; Krumdieck, S.; Bodger, P. A Dynamic Function for Energy Return on Investment. Sustainability 2011, 3, 1972–1985. [Google Scholar] [CrossRef] [Green Version]
  76. Henshaw, P.F.; King, C.; Zarnikau, J. System Energy Assessment (SEA), Defining a Standard Measure of EROI for Energy Businesses as Whole Systems. Sustainability 2011, 3, 1908–1943. [Google Scholar] [CrossRef] [Green Version]
  77. Wurlod, J.-D.; Noailly, J. The impact of green innovation on energy intensity: An empirical analysis for 14 industrial sectors in OECD countries. Energy Econ. 2018, 71, 47–61. [Google Scholar] [CrossRef] [Green Version]
  78. Garg, A.; Kazunari, K.; Pulles, T. IPCC Guidelines for National Greenhouse Gas Inventories; IPCC: Geneva, Switzerland, 2006. [Google Scholar]
  79. Castro, M. Towards a Diversified Energy Matrix in Ecuador; CEDA: Quito, Ecuador, 2011. [Google Scholar]
  80. CONELEC. Electrification Master Plan 2013–2022; CONELEC: Quito, Ecuador, 2013. [Google Scholar]
  81. Ahuja, D.; Tatsutani, M. Sustainable energy for developing countries. Sapiens 2019, 2, 1–16. [Google Scholar]
  82. Ouedraogo, N.S. Africa energy future: Alternative scenarios and their implications for sustainable development strategies. Energy Policy 2017, 106, 457–471. [Google Scholar] [CrossRef]
  83. Energy Efficiency Renewable Energy. Water Power Technologies Office. Available online: https://www.energy.gov/eere/water/benefits-hydropower (accessed on 29 October 2019).
  84. Production Coordinating Ministry Employment and Competitiveness. Industrial policy of Ecuador 2016–2025; Production Coordinating Ministry; Employment and Competitiveness: Quito, Ecuador, 2016. [Google Scholar]
  85. Solaun, K.; Cerda, E. Climate change impacts on renewable energy generation. A review of quantitative projections. Renew. Sustain. Energy Rev. 2019, 116, 109415. [Google Scholar] [CrossRef]
  86. Herran, D.S.; Tachiiri, K.; Matsumoto, K. Global energy system transformations in mitigation scenarios considering climate uncertainties. Appl. Energy 2019, 243, 119–131. [Google Scholar] [CrossRef]
  87. Carfora, A.; Scandurra, G. The impact of climate funds on economic growth and their role in substituting fossil energy sources. Energy Policy 2019, 129, 182–192. [Google Scholar] [CrossRef]
  88. Carbajales-Dale, M.; Barnhart, C.J.; Brandt, A.R.; Benson, S.M. A better currency for investing in a sustainable future. Nat. Clim. Chang. 2014, 4, 524–527. [Google Scholar] [CrossRef]
  89. Kaygusuz, K. Energy for sustainable development: A case of developing countries. Renew. Sustain. Energy Rev. 2012, 16, 1116–1126. [Google Scholar] [CrossRef]
  90. Cantore, N.C.M.; Velde, D.W.T. Does energy efficiency improve technological change and economic growth in developing countries? Energy Policy 2016, 92, 279–285. [Google Scholar] [CrossRef]
  91. United Nations Environment Programme. Report on Atmosphere and Air Pollution; UNEP: Addis Ababa, Ethiopia, 2005. [Google Scholar]
  92. Barlas, Y.; Korhan, K. A dynamic pattern-oriented test for model validation. In Proceedings of the 4th Systems Science European Congress, Valencia, Spain, September 1999; pp. 269–286. Available online: https://www.researchgate.net/publication/229045997_A_dynamic_pattern-oriented_test_for_model_validation (accessed on 30 October 2019).
Figure 1. Annual changes in global primary energy intensity, 1981–2016 (US dollars (USD), 2016).
Sustainability 12 00020 g001
Figure 2. Primary energy demand, GDP, and energy intensity by region (2016 USD). Organization for Economic Co-operation and Development (OECD).
Sustainability 12 00020 g002
Figure 3. Primary energy production (KBOE)—Year 2016.
Sustainability 12 00020 g003
Figure 4. General block diagram of the model.
Sustainability 12 00020 g004
Figure 5. Simplified influence diagram for the input-output analysis in the Ecuador model.
Sustainability 12 00020 g005
Figure 6. Evolution of primary energy production in kilobarrels of oil equivalents (KBOE) [68].
Sustainability 12 00020 g006
Figure 7. Evolution of secondary energy production (KBOE) [68].
Sustainability 12 00020 g007
Figure 8. Evolution of consumption by sector (KBOE) [68].
Sustainability 12 00020 g008
Figure 9. Primary energy supply scenarios.
Sustainability 12 00020 g009
Figure 10. Final energy supply scenarios.
Sustainability 12 00020 g010
Figure 11. Final energy demand scenarios.
Sustainability 12 00020 g011
Figure 12. GDP Ecuador scenarios (thousands USD 2007).
Sustainability 12 00020 g012
Figure 13. Energy intensity scenarios BOE/USD 2007.
Sustainability 12 00020 g013
Figure 14. CO2 emissions (KT CO2).
Sustainability 12 00020 g014
Table 1. CO2 emission conversion factors [78].
Conversion Factors CO2 Emission(Kg CO2/BOE)(Kg CO2/TJ)
Petroleum448.5473,300
Natural gas343.2956,100
Firewood685.36112,000
Cane Products433.2470,800
Electricity
Petroleum liquid gas386.1363,100
Gasolines424.0669,300
Kerosene and Turbo439.9771,900
Diesel453.4474,100
Fuel Oil473.6377,400
Solar / Wind
Asphalts and lubricants448.5473,300
Table 2. Model validation results.
GDPEnergy DemandEnergy IntensityCO2 Emissions
YearReal Data (milesUSD2007)Simulated (milesUSD2007)MAPE (%)Real Data (KBOE)Simulated (KBOE)MAPE (%)Real Data (BOE/Thousands of USD 2007)Simulated (BOE/Thousands of USD 2007)MAPE (%)Real Data (MegatonsCO2)Simulated (MegatonsCO2)MAPE (%)
200037,726.437,726.40.060,202.563,775.60.11.61.60.027,477.027,658.80.0
200139,241.438,162.10.060,164.463,506.30.11.51.60.126,229.027,800.00.1
200240,849.039,773.00.060,122.563,198.10.11.51.50.025,480.027,642.70.1
200341,961.341,485.20.061,213.865,506.60.11.51.50.028,607.029,022.70.0
200445,406.742,670.00.163,329.166,579.80.11.51.50.028,709.029,856.40.0
200547,809.346,348.40.063,418.065,335.10.01.41.30.027,491.027,691.10.0
200649,914.648,922.80.059,648.062,570.70.01.31.30.126,540.026,168.10.0
200751,007.851,183.00.061,734.064,899.00.11.31.30.127,010.027,223.60.0
200854,250.452,360.00.064,515.066,877.20.01.31.20.127,500.027,537.80.0
200954,557.755,856.60.069,555.070,066.10.01.31.20.128,000.029,302.60.0
201056,168.956,190.90.069,718.069,081.30.01.31.20.130,100.028,917.20.0
201160,569.558,273.60.074,931.075,832.70.01.41.30.132,000.031,507.40.0
201264,106.063,089.00.077,789.079,499.10.01.31.20.134,000.032,906.50.0
201367,081.066,957.70.081,610.081,746.50.01.31.20.135,400.0335,94.50.1
201469,632.070,437.80.086,048.086,519.70.01.41.20.136,800.035,464.20.0
201570,345.073,388.80.086,323.090,329.30.01.41.20.137,000.035,902.80.0
2.18 3.49 5.65 3.04

