Article

Evaluating a Planning Support System’s Use and Effects in Urban Adaptation: An Exploratory Case Study from Berlin, Germany

by
Sadie McEvoy
1,2,*,
Frans H. M. van de Ven
1,3,
Reinder Brolsma
1 and
Jill H. Slinger
2,4
1
Deltares, 2629 HV Delft, The Netherlands
2
Policy Analysis, Faculty of Technology Policy and Management, Delft University of Technology, 2628 BX Delft, The Netherlands
3
Water Management, Faculty of Civil Engineering and Geosciences, Delft University of Technology, 2628 CN Delft, The Netherlands
4
Institute for Water Research, Rhodes University, 6139 Grahamstown, South Africa
*
Author to whom correspondence should be addressed.
Sustainability 2020, 12(1), 173; https://doi.org/10.3390/su12010173
Submission received: 9 November 2019 / Accepted: 3 December 2019 / Published: 24 December 2019
(This article belongs to the Section Sustainable Urban and Rural Development)

Abstract

:
Planning Support Systems (PSS) are increasingly used to support collaborative planning workshops in urban adaptation practice. Research has focused on developing such tools and evaluating their use in workshops but has not measured tools’ effects over time on real planning processes, on the participants involved, and on the final outcomes. The role that tools play in adaptation planning, therefore, remains unclear. A longitudinal case study was made to evaluate a PSS, the Adaptation Support Tool (AST), in a design workshop for sustainable urban water management, in Berlin, Germany. The case study also served to test the evaluation framework and generate insights regarding systematic evaluations of tools in planning processes. The case study was carried out over eighteen months, to capture both the details of the workshop and its longer-term effects on the project and participants. Our results show that the AST’s most evident effects were (1) contributory and less tangible in nature (e.g., supporting learning), than directly causal and concrete (e.g., affecting planning decisions), and (2) a function of the process and context in which the workshop took place. This study demonstrates that making systematic, longitudinal evaluations are valuable for studying the role of PSS in urban adaptation planning.

1. Introduction

The unique challenges of climate change for cities have been recognized for some time and have inspired the burgeoning field of research and practice in adaptation planning [1,2], a complex undertaking, involving existing structures and infrastructures, interconnected urban systems, and myriad public and private stakeholders [1,3,4]. As such, adaptation planning is inherently spatial and deeply political [4,5]. Engaging stakeholders in the planning process is widely viewed as necessary to address the complexity and multi-actor nature of urban adaptation [1,6,7]. To this end, collaborative planning workshops are often held in the preliminary phases of a project, with the intention of building relationships between stakeholders, exchanging knowledge and views, clarifying problems, and identifying mutually acceptable and technically viable solutions [6]. Whatever the aims of a specific collaborative planning workshop, ultimately, they are meant to positively affect the larger planning process of the project, the participants involved, and the final outcomes.
Planning support tools and the more specific Planning Support Systems (PSS) with which we are concerned are often used in collaborative planning workshops to support the way of working and the quality of the work products and other outcomes, such as learning [8,9,10]. A variety of tools are used for providing information, structuring interdisciplinary communication, promoting learning and shared understanding, and for documenting discussions and results [11]. Despite the longstanding development and use of planning support tools and PSS in particular, the role they play in real collaborative planning workshops, and their effect on planning processes, on participants involved, and on final outcomes are not well documented.
Planning support tools and PSS, more specifically, have been studied for decades now. PSS evaluations have made important contributions to understanding instrumental aspects of these tools [4,6,12,13], as well as their perceived added value, usability, usefulness, and adoption, among others [10,14,15,16]. This work has provided valuable insights to tool researchers and developers. Planning support tool evaluations are, however, characterized by a number of common features. First, evaluations are mostly made in simulated workshops or in workshops organized for the purpose of testing a tool [3,7,17,18,19] and are often carried out by tool developers themselves [3,6,19,20,21]. A recent state-of-the-art review of 114 articles on spatial visualization tools that support dialogue in urban planning found that studies of tools implemented in real planning are rare and all such studies were allowed to influence the workshop under investigation [7]. PSS researchers have, for many years, recognized the need for in-situ evaluations of tool use [22]; however, Goodspeed (2015) [23] still stands out as a rare application. This is not to say that tool use in practice is underrepresented in PSS research. There are numerous assessments of the adoption of tools in planning practice [15,24,25], practitioner perceptions of tools [10,26,27,28] and the gap between what tools provide and what practitioners need from tools [27,29,30]. Nevertheless, most current evaluations are not based on real applications of tools in practice. Second, evaluations of tools have so far focused on the workshops in which they are used, without capturing longer-term effects on the planning processes in which workshops take place [7,28,31,32]. In contrast, a body of research on evaluating participatory planning processes focusses on the big picture of a project or program but fails to distinguish the influence of a tool used in a specific workshop, which may be one of many activities over the course of a planning process (for example, [33,34]). Third, and finally, tool assessments often rely on ad hoc reflections of workshop facilitators and organizers or apply bespoke frameworks and methods [3,20,31,32,35,36] as there is no recognized structure for evaluating planning support tools and their role in planning practice. This makes evaluations hard to compare.
What is missing from the study of planning support tools and specifically PSS are: (1) independent assessments of tool use in real planning workshops that are not influenced by the aim of evaluation, (2) assessments that capture a tool’s role and influence on the longer-term planning processes, as well as the workshops, and (3) assessments based on a structured and comprehensive framework and method that can be used to evaluate any tool in practice and produce comparable results. A multi-actor policy analysis lens, which focuses on complex decision-making processes, like planning, is a useful shift from the tradition of using instrumental and planning lenses for evaluating tools.
Evaluating the role of tools in real adaptation planning is a challenging undertaking. While a tool may play a vital role in a workshop at the start of a project, over time, many factors will influence the planning process, the participants, and the eventual outcomes. Identifying and teasing out elements that can be attributed in part or in full to a tool used in a workshop is no small task [31]. Furthermore, given the importance of less tangible outcomes in adaptation and collaborative planning, evaluations must capture hard-to-measure effects, like learning, moving the needle on certain topics, forming shared strategies, and creating spinoff initiatives [36]. Together, these conditions lead to three challenges for evaluation:
  • Making evaluations specific enough to be meaningful to a particular case, yet generic enough to offer useful and usable insights for broader research and practice.
  • Making evaluations flexible enough to capture locally relevant factors and unintended and unexpected effects yet structured enough to be recognizable and comparable to other applications.
  • Capturing both the details of a tool used in a workshop, and the longer-term effects on the planning process, the participants, and the outcomes.
There is a recognized need to better understand the role of tools in real planning applications. Such knowledge will provide valuable insights to practice and feedback to theory [4,10]. The focus of our research is to explore how tools used in collaborative planning workshops influence these activities and their outcomes, and how such evaluations can be carried out. To this end, we undertook a single exploratory longitudinal case study of a collaborative adaptation planning workshop in Moabit West, a district of Berlin, Germany. This workshop made use of a Planning Support System (PSS), called the Adaptation Support Tool. In this article, we present our approach to evaluation, the results of our case study, and offer insights drawn from our experience with this evaluation. The conceptual framework of analysis is presented in Section 2, the research design for our study in Section 3, our research methods in Section 4, the case study results in Section 5, a discussion of our findings and our experience with the framework in Section 6, and conclusions in Section 7.

2. Conceptual Framework of Analysis

The use of a collaborative planning support tool can be conceptualized as nested within a workshop that occurs during a planning process, which itself takes place within a larger context [18]. Understanding the role of a tool requires examining these different layers and their inter-relations. While the literature offers useful frameworks for evaluating participatory planning processes [33,34] among others and individual workshops [31,37,38,39,40], we are unaware of a framework that accounts for the nested nature of tool use needed to study the role of planning support tools in practice. Another requirement for our framework is that it be useful for evaluating not only PSS but planning support tools more broadly.
We took a pragmatic approach to develop a framework for our aims by borrowing and learning from the existing frameworks for evaluating activities and processes. As elaborated elsewhere [41,42,43] and described in Table 1, our framework identifies seven factors for evaluating workshops within planning processes. This framework explicitly links the input and the workshop with results and effects within the larger context. This reflects our fundamental assumption of the relations between what happens in a workshop and its outcomes in a context-rich planning process. Furthermore, our framework distinguishes between the process and content of a workshop, which is useful for evaluating a tool, and particularly a PSS, as planning support systems aim to support both process and content aspects [10].

3. Research Design

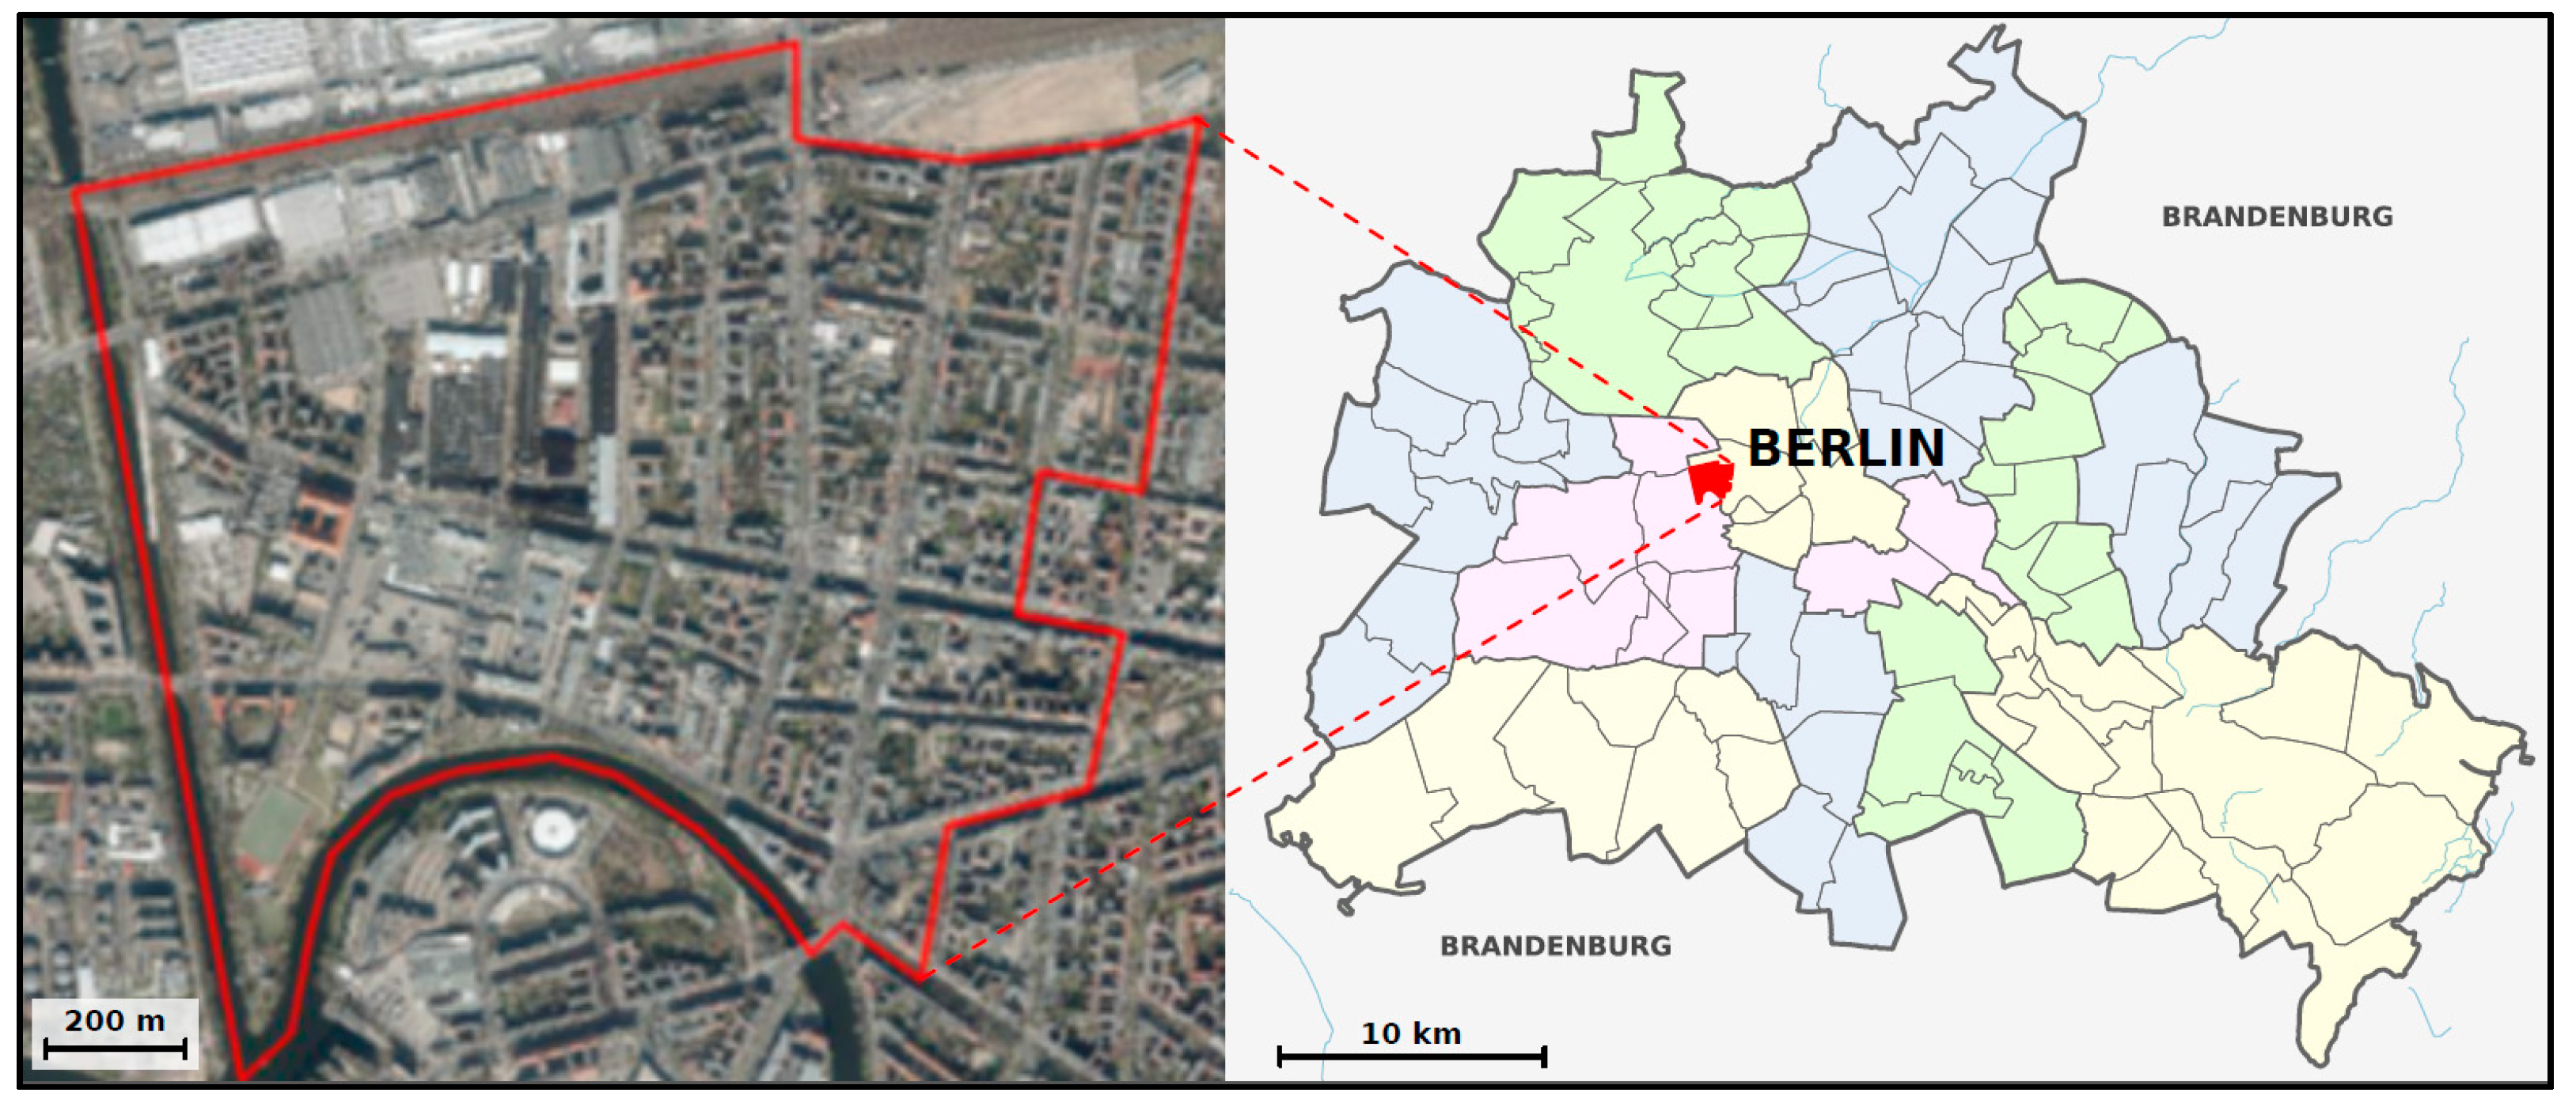
3.1. Case Study Description

The case study focuses on a workshop for designing sustainable urban water management measures in Moabit West, in central Berlin, Germany (Figure 1). Moabit West faces pressures typical for Berlin and other European cities, namely the challenge of providing affordable housing to a growing population, supporting a dynamic economy, addressing climate change [44], and adapting an already densely built environment [45].
The design workshop studied in this research formed part of a larger project (planning process), Smart Sustainable District Moabit West (SSD-Moabit West) that was funded by Climate KIC and organized by CHORA Conscious City, at Berlin University of Technology (CCC-TUB). The SSD-Moabit West project focused on three themes: sustainable urban water management, energy efficiency and low-carbon mobility. The working groups for each theme included local public and private partners, European knowledge partners from Climate KIC’s SSD consortium, and the project managers at CCC-TUB. During the design workshop, each working groups focused on finding pilot projects that could be implemented in Moabit West. A designated integration manager from CCC-TUB looked for opportunities to integrate the themes.
The year-long project was initiated and designed by CCC-TUB and involved two workshops between the local and European partners. The first workshop, in March 2016, addressed agenda setting, building relationships between the partners, and deciding on the role of the European partners. The second workshop, in September 2016, focused on designing pilot projects for each theme and exploring opportunities for integration. The event comprised:
  • A short plenary introduction for all project partners and invited participants;
  • Parallel half-day design sessions for each working group to design pilot projects; and
  • A plenary integration session to identify opportunities for collaboration between pilots from the different working groups.
The design session for the sustainable urban water management group (here forth: water group) forms the focus of this study and employed a PSS called the Adaptation Support Tool. A schedule of the day, activities, materials, and outcomes is available in Appendix A.

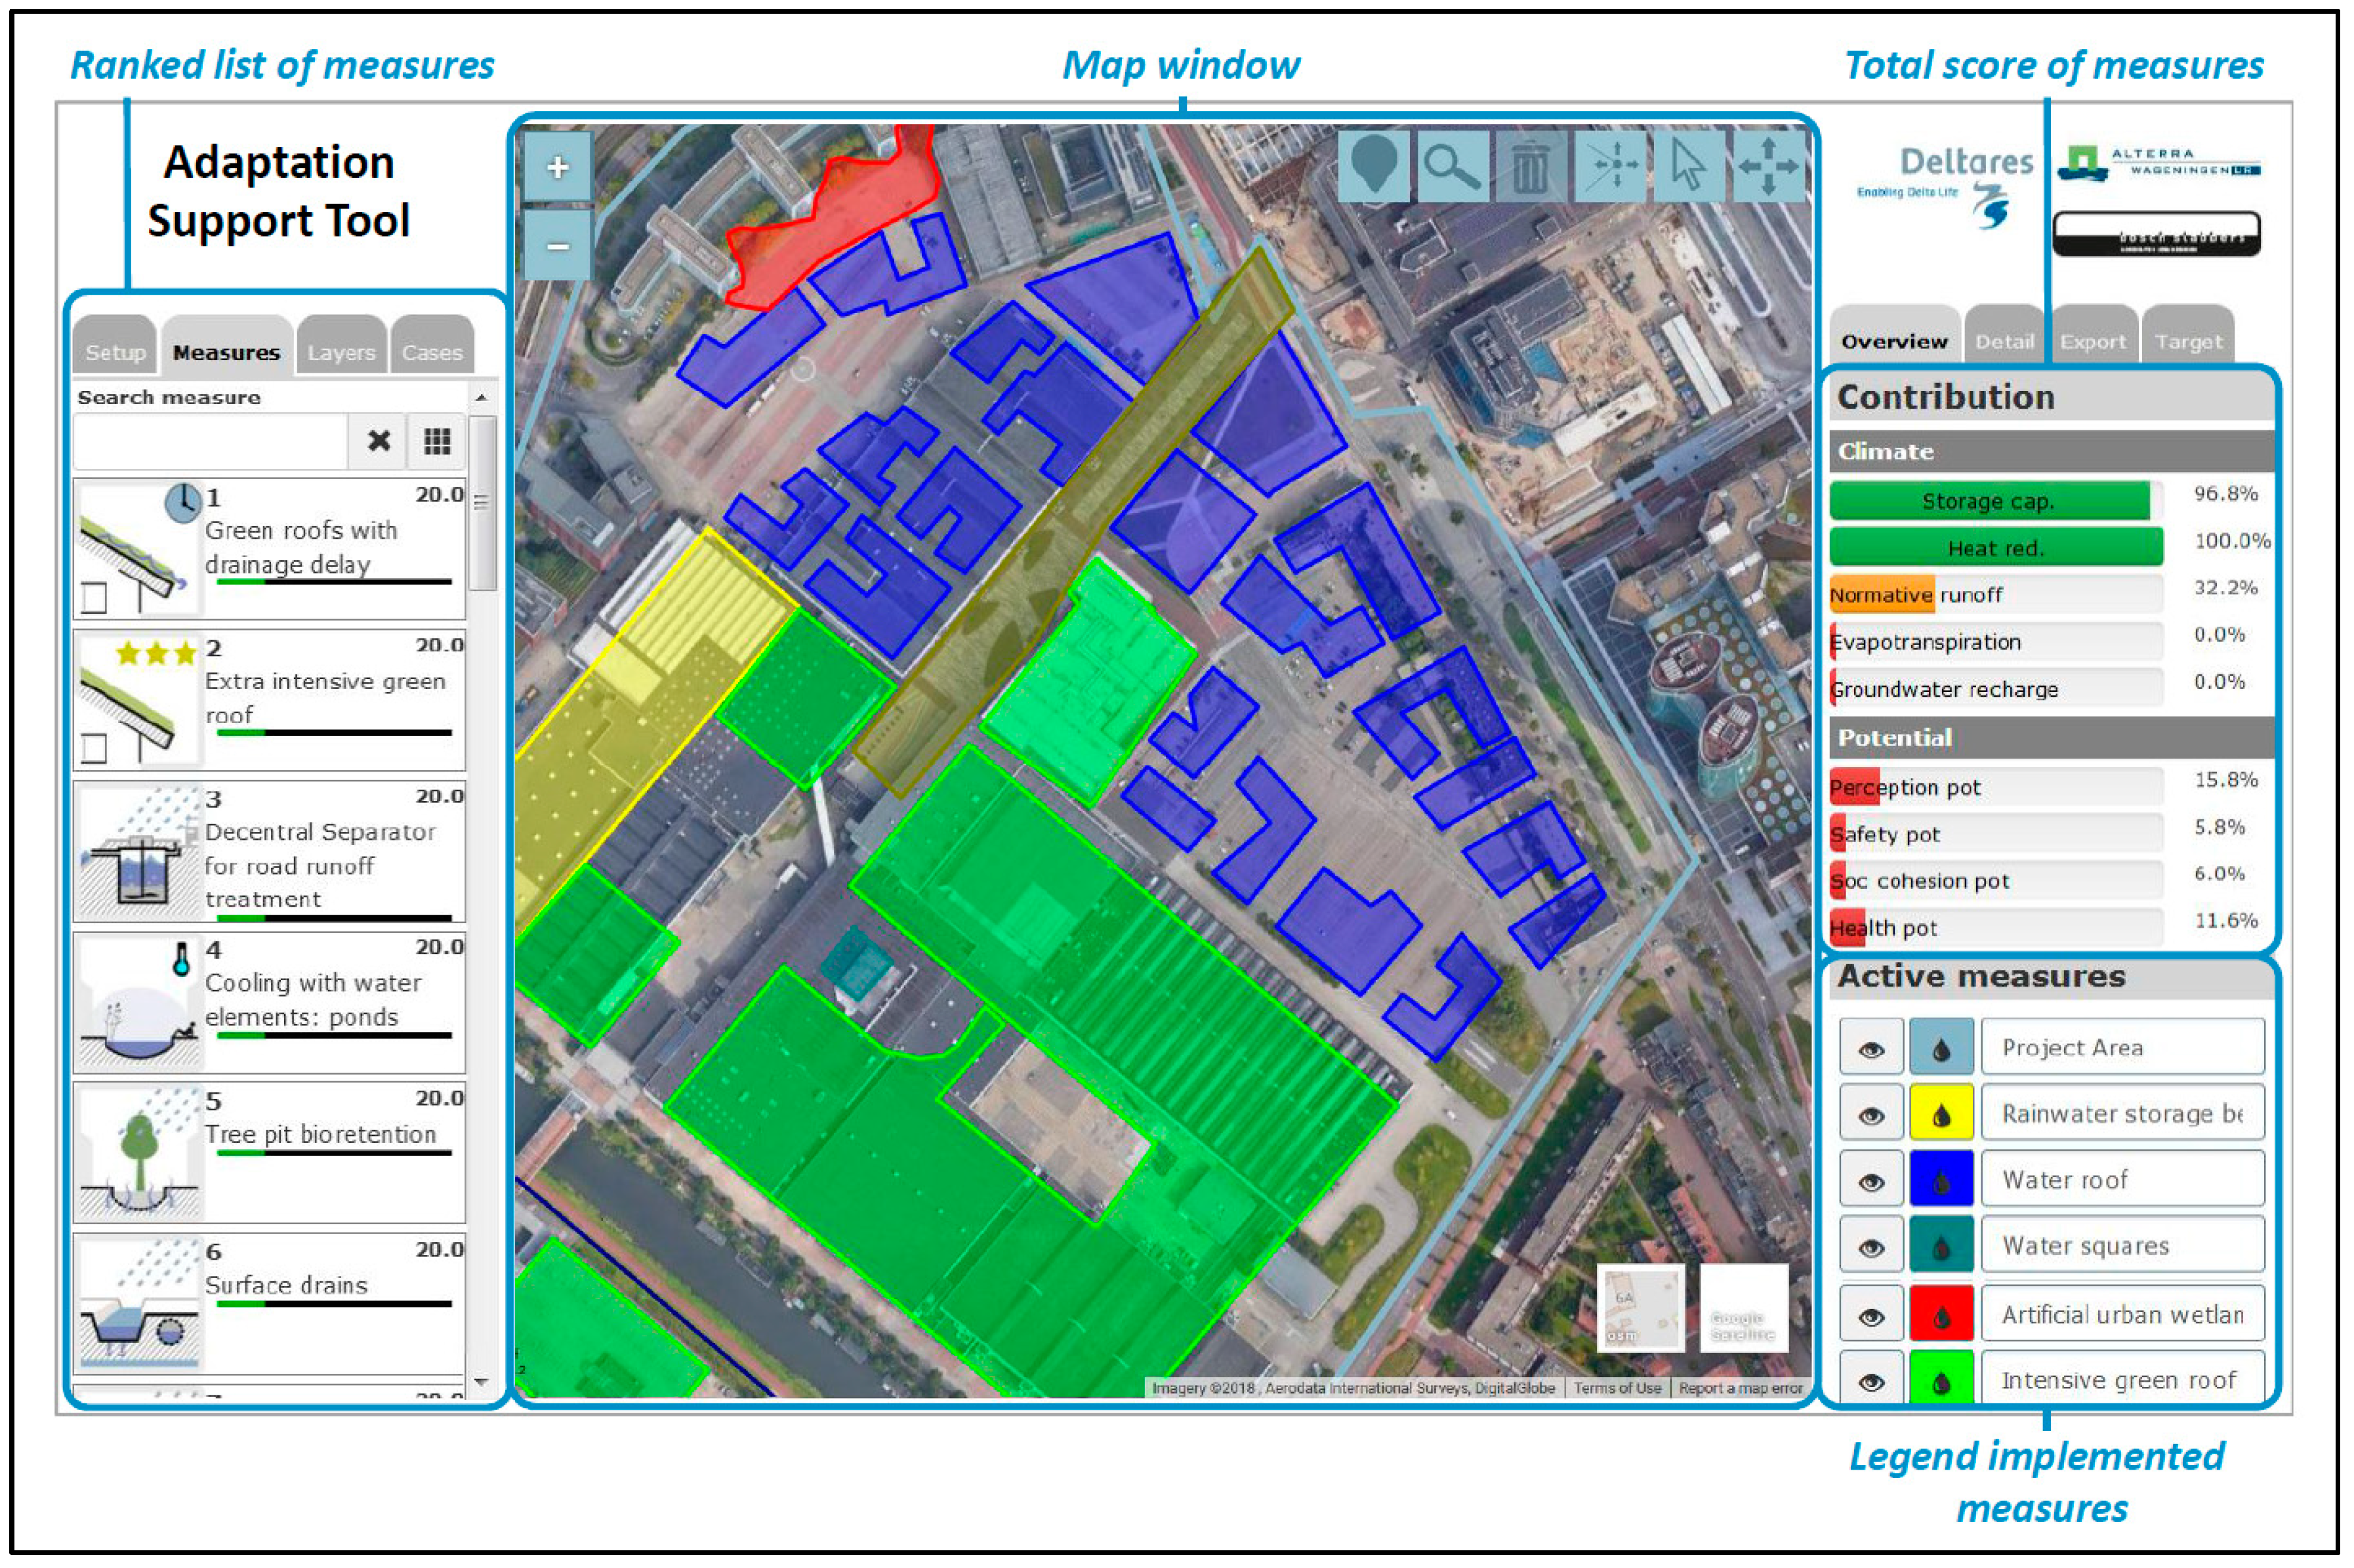
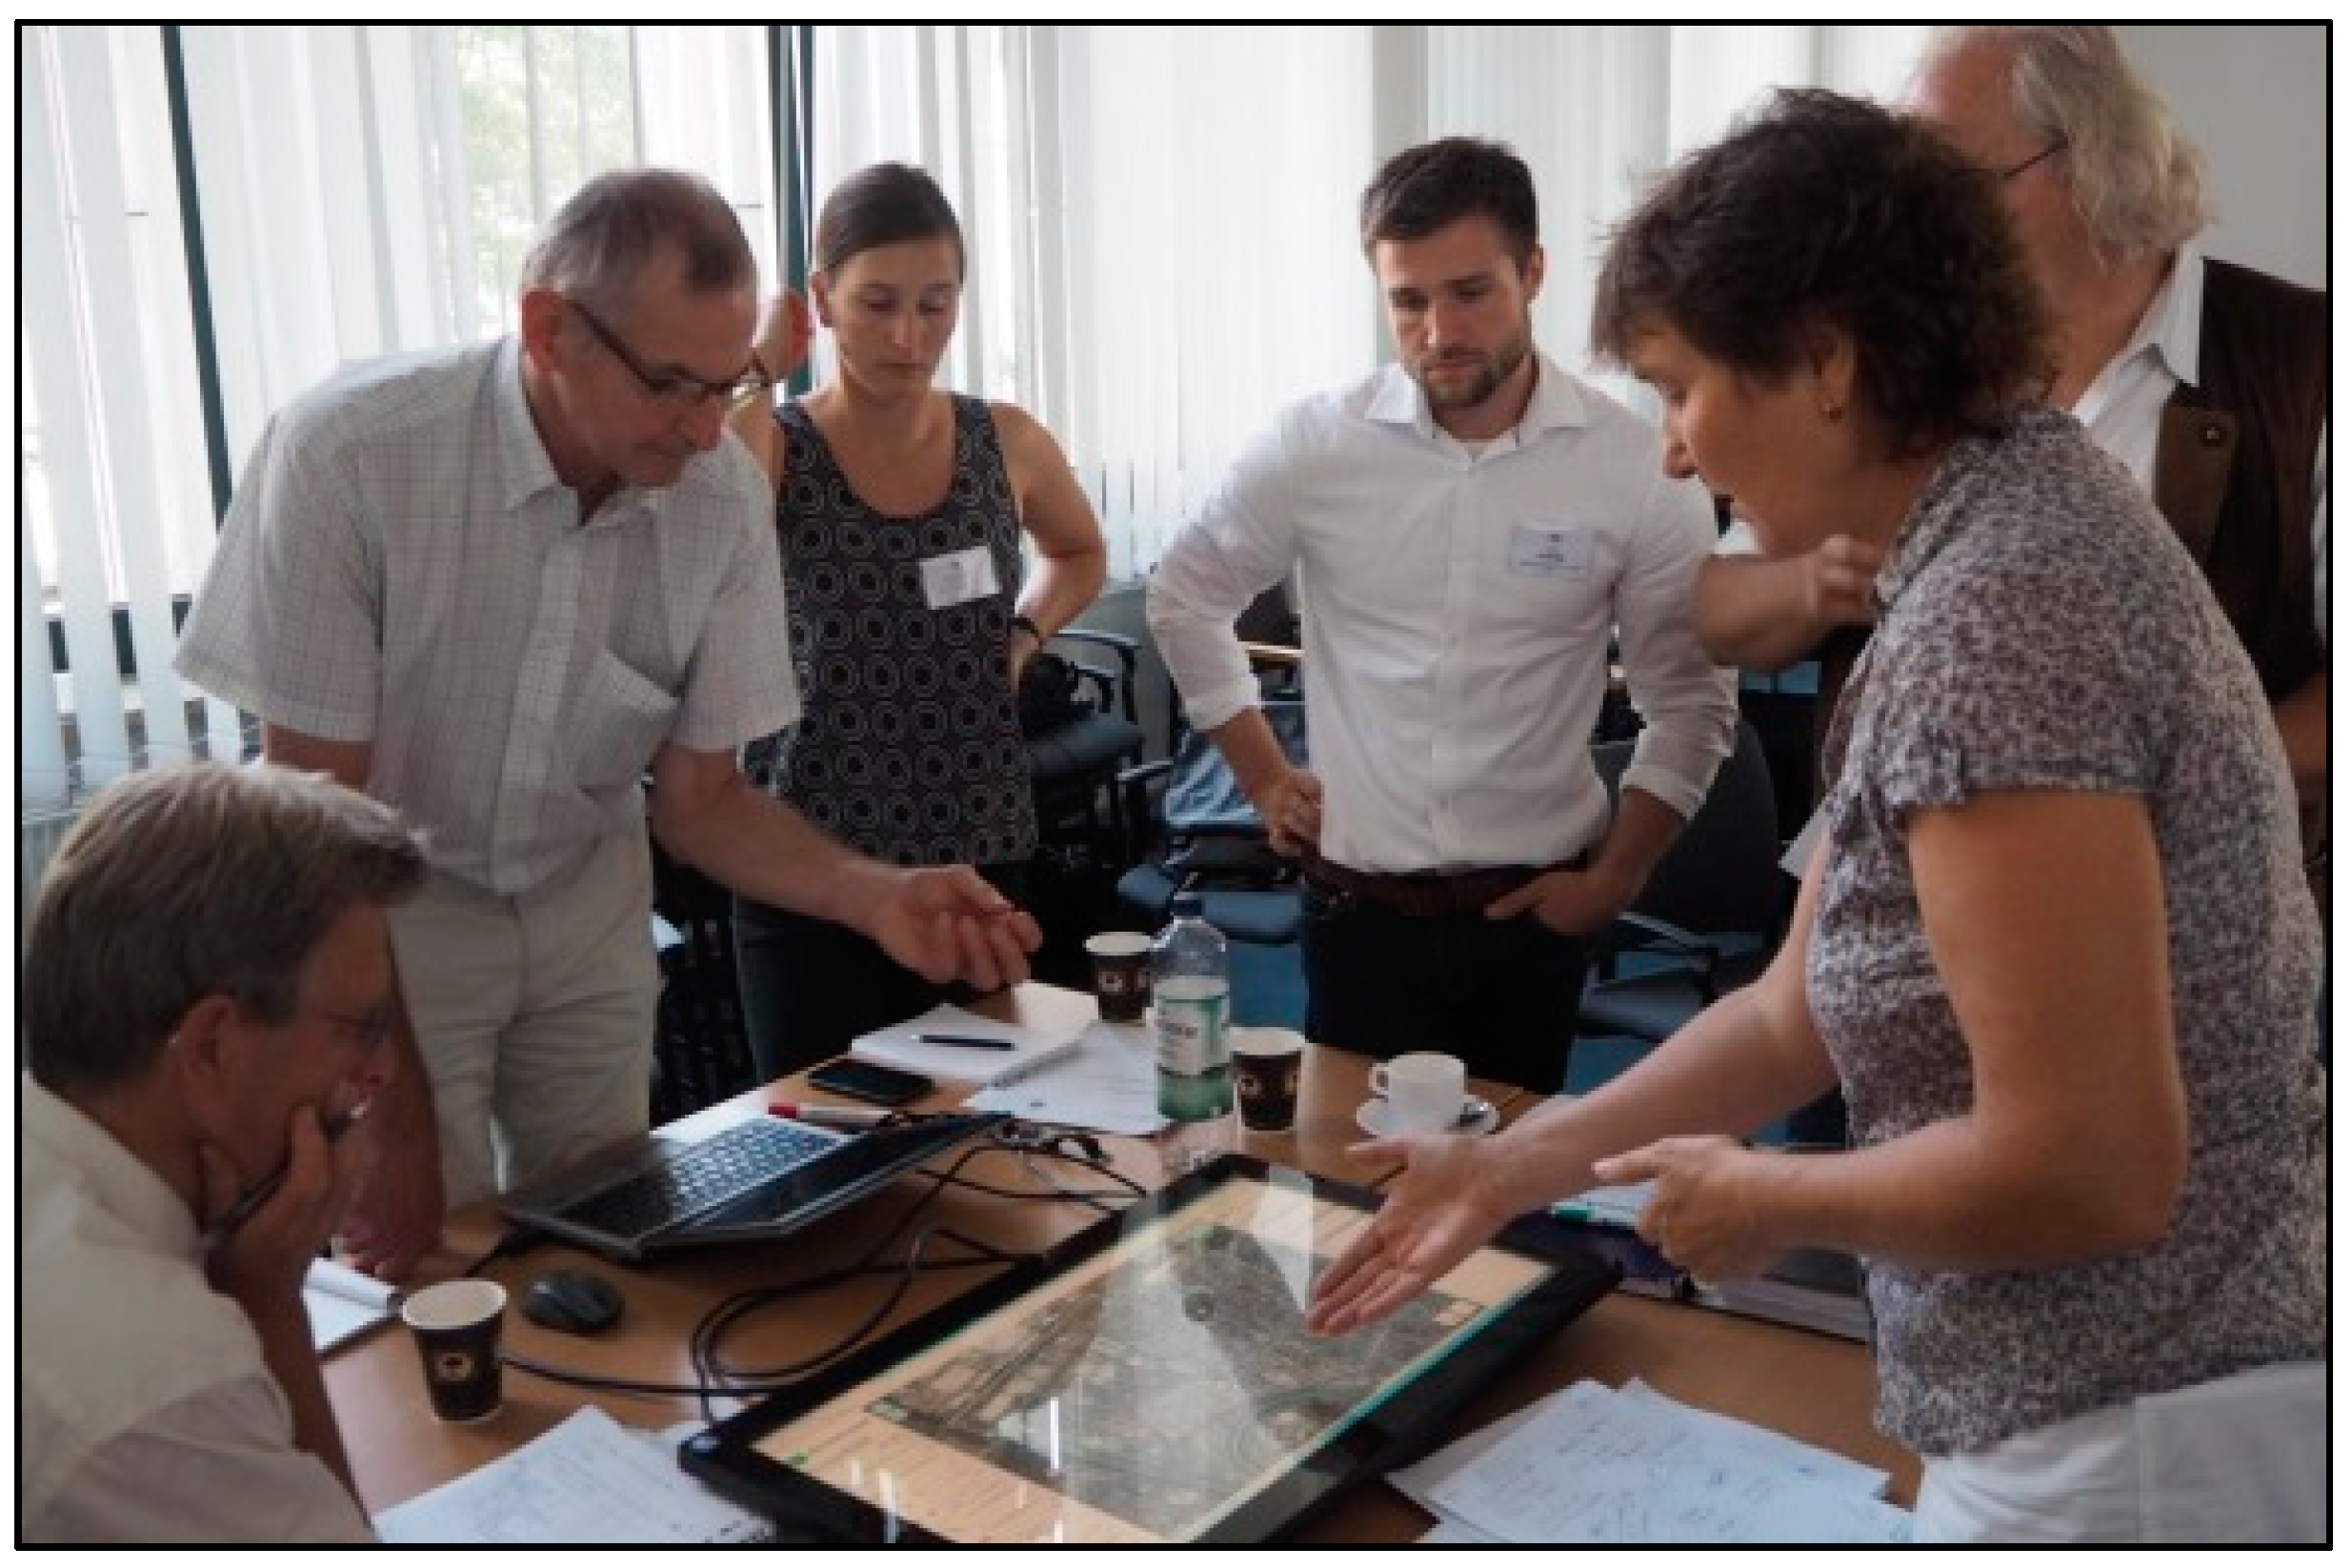
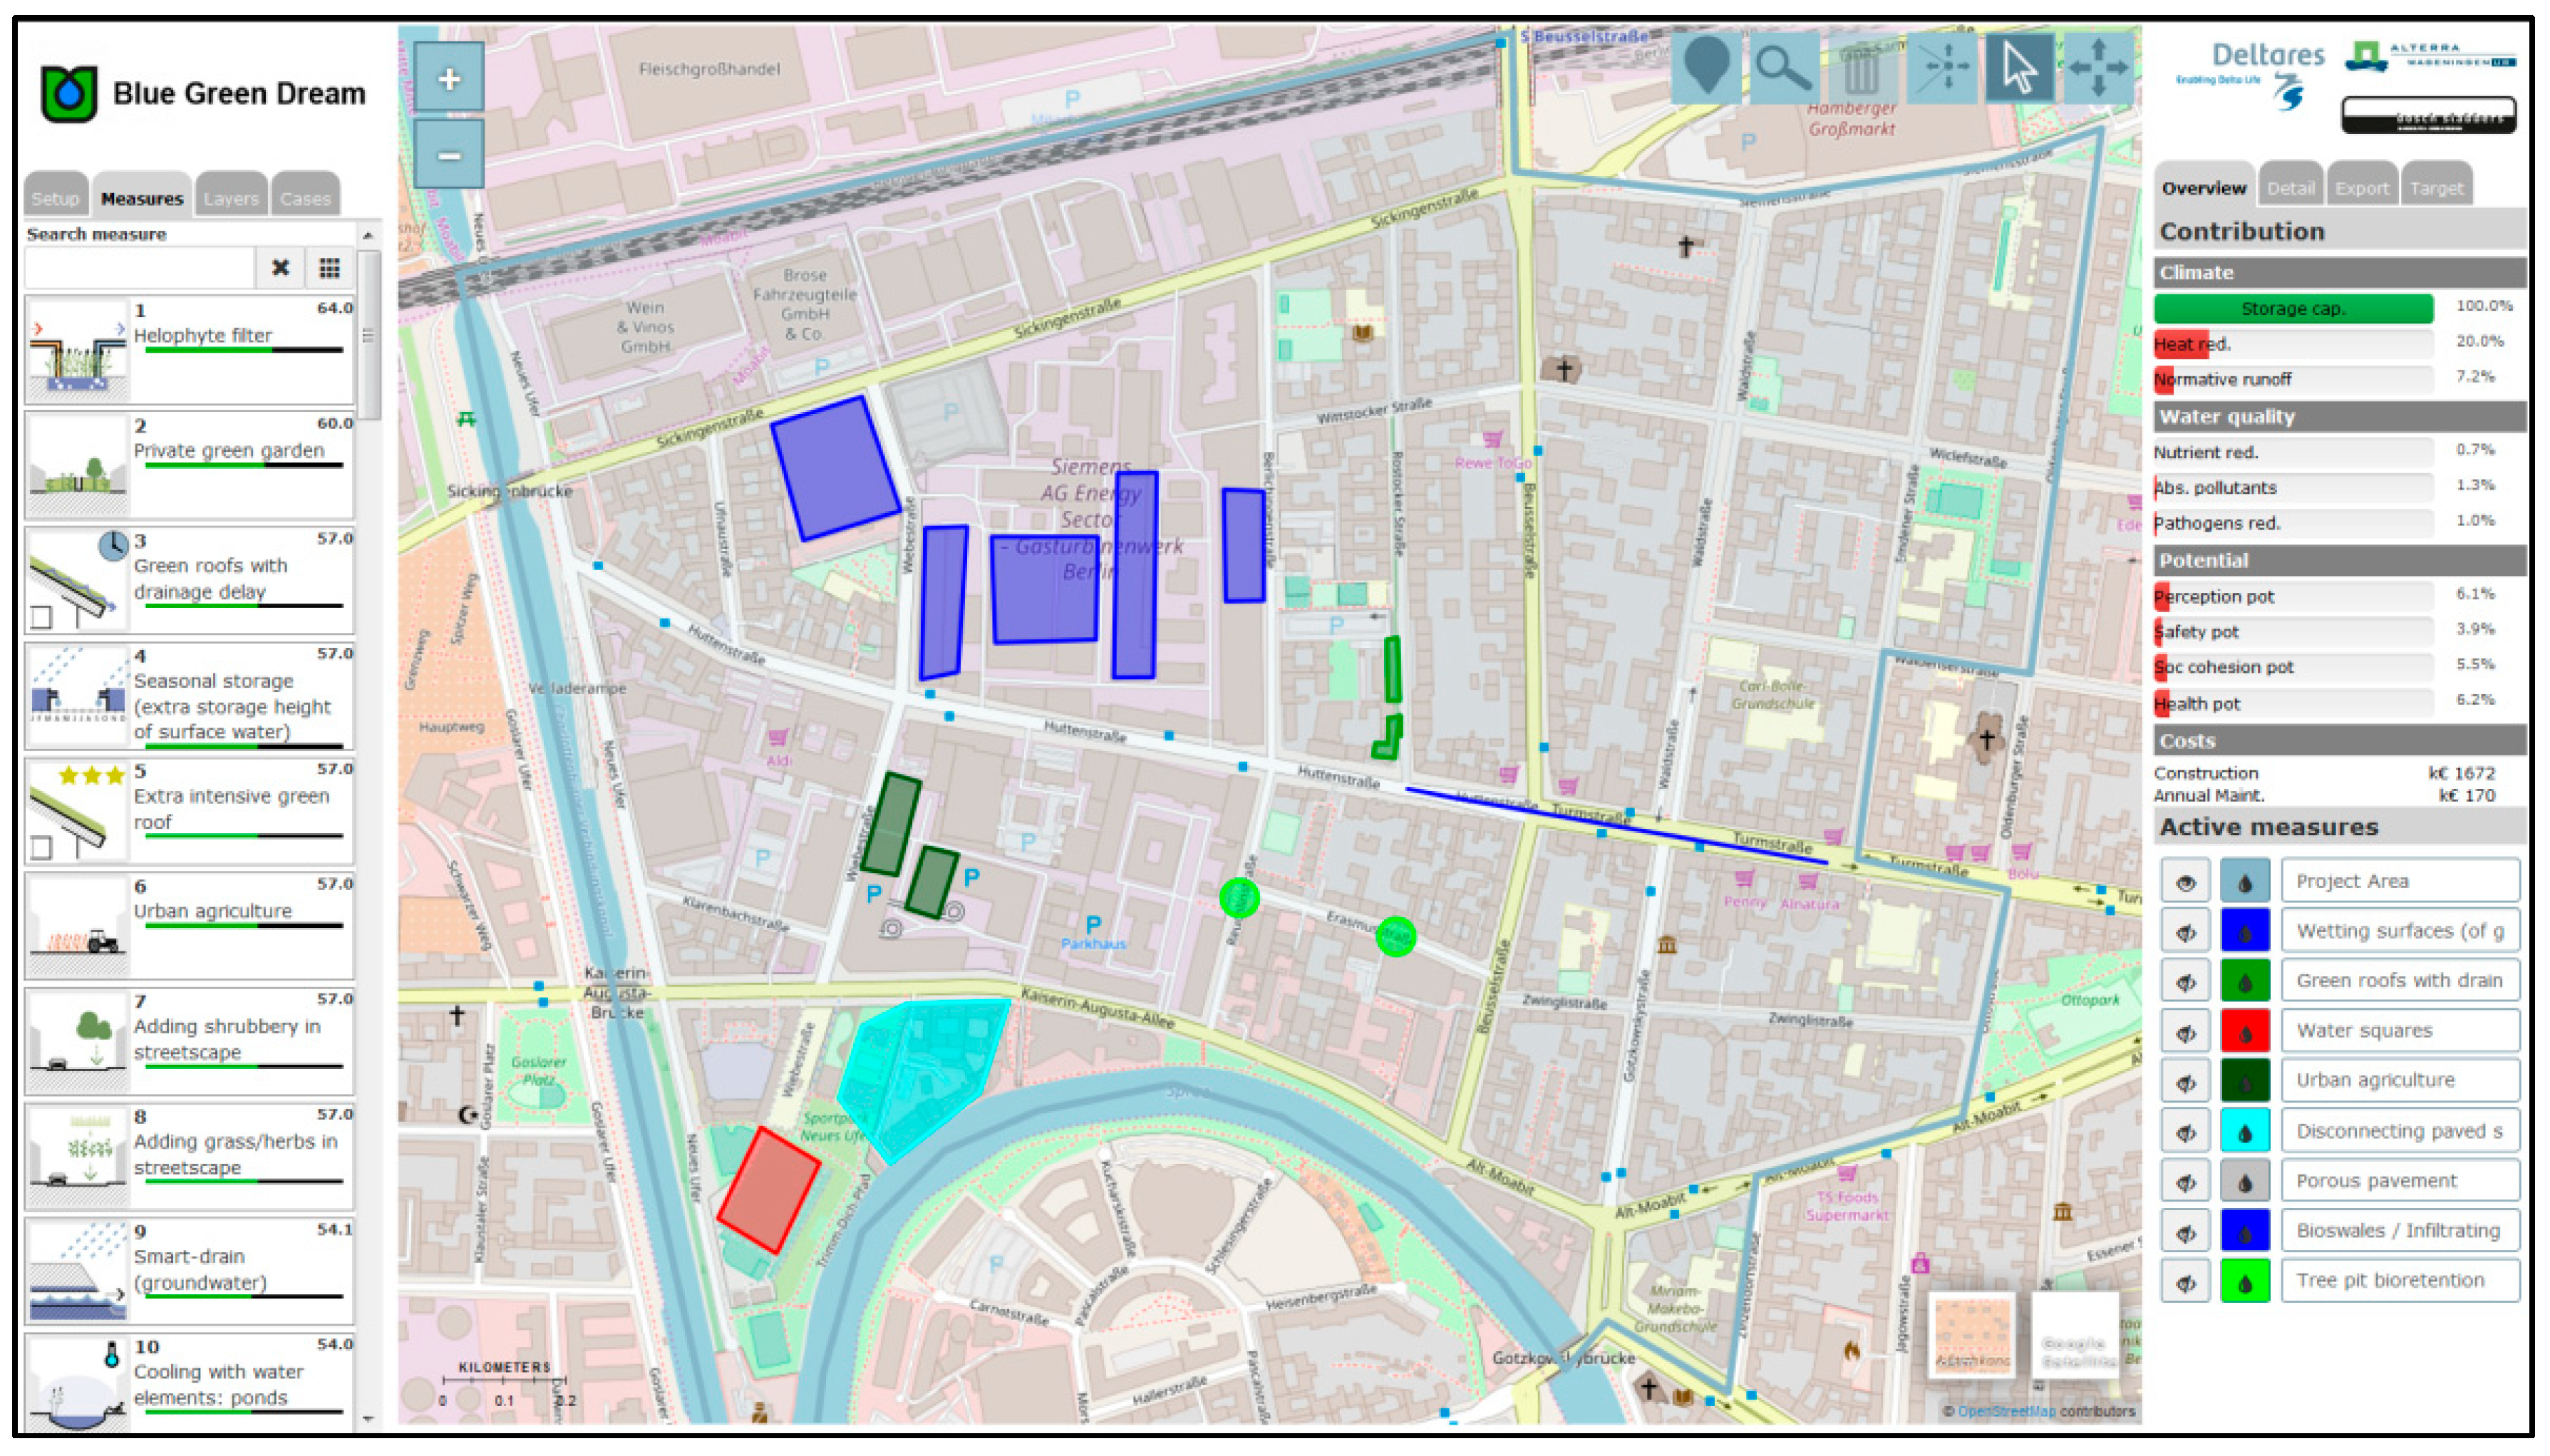
3.1.1. Adaptation Support Tool

The Adaptation Support Tool (AST) is a web-based PSS for planning nature-based and traditional infrastructure spatial adaptation measures in the urban environment (Figure 2). The AST is designed for use in facilitated workshops, where small groups of stakeholders co-create spatial adaptation plans at the neighbourhood to city scale. More information on the AST can be found in van de Ven et al. [6].
The touch-table screen of the AST consists of three panels. The left panel is used for input, the middle panel contains a map interface that is used for developing an adaptation plan, and the right panel shows output parameters in real-time. Each panel is summarized below.
The input panel consists of a Setup tab to specify properties of the project area, for example, soil type, land use, and scale of interest. Based on the entered properties, a ranked list of adaptation measures is generated from a library. This list is shown in a second tab Measures [47]. For each measure in the library—currently 72—information and pictures are provided by selecting Info.
The map window contains base layers, like street and satellite view maps or aerial photographs, which are used for spatial referencing. On top of these base layers, semi-transparent thematic maps can be displayed as overlays, like elevation, critical objects, and flood or heat maps. The layers help users understand the climate challenges in an area, and to choose effective locations for interventions. Adaptation measures can be selected from the list in the input panel and applied in the map interface. The estimated effectiveness and cost of the measure are then calculated, based on its dimensions, and the local properties and climate conditions. For more details on the models, see van de Ven et al. and Voskamp and van de Ven [6,47].
The output panel contains a legend of the measures that have been applied in the map and a list of key performance indicators: storage capacity, flood return period, heat stress reduction, drought reduction, water quality, and a first estimate of construction and maintenance costs. At the start of a workshop, targets are entered for each performance indicator, and bar graphs are used to show the cumulative percentage of each target achieved. A second tab, Details, provides the quantified contribution of each applied measure.
Plans developed using the AST are intended as the input for more detailed design efforts by water managers, urban planners, and landscape architects. The intended added value of the AST lies in collaboratively developing ideas of possible measures and their locations, based on the dialogue of stakeholders and informed by real-time, evidence-based feedback from the tool. AST sessions are meant to capture locally specific factors like acceptability, constraints, and opportunities early in a planning process, and to create shared learning through dialogue and interaction with the tool [6].

3.1.2. Relation of the Authors to the Project, the Workshop, and the Tool Evaluated

In the interest of transparency, we clarify the relation of the authors to the project, the workshop and the tool evaluated. The local organizers in Berlin designed the workshop and selected the AST to support their aims. The first author was invited to make an independent evaluation and played no role in the project itself, nor in planning or facilitating the workshop, nor in the development of the AST. These conditions provided the opportunity to evaluate a PSS used within a real workshop, as well as its effects on the remainder of the planning process. The second and third authors facilitated the AST session during the workshop and formed part of the tool’s development team but were not involved in the collection or analysis of data. The fourth author provided an external check on the research design, data analysis, and results and has no association with the workshop, project, or tool.

4. Research Methods

A case study approach provided an appropriate method for examining the role of a tool within a planning process, where a holistic analysis promises the most useful insights [48]. Accordingly, a single, longitudinal case study was used to evaluate the role of the AST in the SSD-Moabit West sustainable urban water management design workshop and its longer-term effects. Our methods are elaborated below.

4.1. Evaluation Factors

The evaluation factors are each described by several elements (Table 1). These elements derive their use in other applications from a literature review [41,42] and are further refined in this case via the deductive and inductive data analyses (Section 4.3). While a comprehensive description of each evaluation factor is unrealistic, in our selection of the elements in Table 1, we required that the elements be (1) general enough to be meaningful in most applications and to our exploratory study, (2) comprehensive enough to capture all elements germane to understanding the role of a tool in practice, and (3) concise enough to support a pragmatic evaluation. Finally, our evaluation factors focus on the elements needed to understand the role of a tool within a workshop and planning process, as opposed to describing characteristics or functionality of a tool.

4.2. Data Collection and Types of Data

In longitudinal case studies, data is collected at more than one point in time to track changes in relevant factors [48]. In this case study, the analysis was based on data collected over 18 months, in five phases from before the workshop, during and after it, at the end of the project (planning process) and one year after the end of the project.
A table detailing the data collected in each phase is provided in Appendix B. A summary of the different types of data collected and how they were used is provided below:
  • Interviews. Seventeen semi-structured interviews of one to three hours were carried out with the project management team and workshop participants. Audio recordings and written notes were transcribed for analysis.
  • Discussions. In addition to the formal interviews, informal on-the-record discussions were used for confirming impressions and information, as well as asking for the views of a wider range of informants. Audio recordings and written notes were transcribed for analysis.
  • Documents. A range of documents was reviewed, including planning documents, reports, websites, team emails, and work products.
  • Questionnaires. A short questionnaire was taken by participants at the end of the design workshop. The questionnaire measured responses to the design workshop and the tool. The questionnaire included five-point Likert scale ratings and open questions (see Appendix B).
  • Observations. Observations were made during the design workshop and at the project’s final symposium event. Written notes were transcribed for analysis.

4.3. Data Analysis

The data analysis comprised three steps, an inductive (thematic) analysis, a deductive analysis and a meta-analysis. Text analysis, using the software package Atlas.ti version 7.5.18 (ATLAS.ti Scientific Software Development GmbH, Berlin, Germany) formed the primary method in the inductive and deductive analyses.
  • Inductive (thematic) analysis was made first to surface codes and themes that emerged from the case study.
  • Deductive analysis was undertaken using the pre-defined evaluation factors and a list of describing elements from literature. The list of elements (codes) was later refined to those listed in Table 1 (see Appendix C for original list).
  • Meta-analysis was used for two purposes. First, to compare the inductive and deductive analyses for different and common findings. From this assessment, a comprehensive list of themes and codes was created. Second, the meta-analysis was used to examine a number of elements that were not well captured in text, yet were important for the evaluation, for example, assessing the quality of work products.
The multiple data sources and three-part analysis were used to reduce bias in the evaluation and to strengthen the accuracy of the findings through triangulation [49].
All participants gave their informed consent for inclusion before they participated in the study. The study was conducted in accordance with the Declaration of Helsinki, and the protocol was approved by the Delft University of Technology’s Human Research Ethics Committee.

5. Results

The following sections summarize the findings for each evaluation factor and end with a short reflection on the role of the tool, based on our analysis. We report the results qualitatively and descriptively for two reasons. First, the small number of participants in our study and its inherently qualitative and exploratory nature would make quantitative reporting unrepresentative and misleading. Second, most of our results are based on a combination of data sources, for instance, questionnaires and interviews, which are not easily conveyed in graphical or quantitative formats. The results summarized below are elaborated in more detail, including interview quotes in Planning Support Tools in Urban Adaptation Practice [43].

5.1. Context

Although describing the context (Table 2) does not tell us directly about tool use, it gives critical information for understanding the use and effects of tools. Thus, context is important to the evaluation of tools in use. Elements of context were surfaced primarily through the thematic analysis. The interviews and document reviews were particularly useful for this.

Analysis of Context and its Relation to the Role of the Tool

Nature-based adaptation measures have clear benefits for the social and physical systems in Moabit West. They can improve aesthetic quality, create more shared green space in the community and address present and growing problems of heat stress and storm water flooding. However, the environmental permitting and property rental conditions create institutional barriers to implementing nature-based solutions on both public and privately-owned land. Furthermore, the workshop was carried out in a project with a strict schedule, budget, and performance requirements from its funder, which served as limiting boundary conditions.
The AST’s aim to support the design of nature-based measures to adapt to urban areas was well suited to the planning topic and local project setting. Furthermore, the fact that the AST is an off-the-shelf tool that can be used with basic, easily available input information, meant the tool could be deployed within the limited timeline and budget of the project. In these ways, the AST seems an appropriate tool for the given contextual conditions.

5.2. Input

Similar to context, assessing workshop input offers insights for understanding the role of the tool in the workshop and its effects afterwards. The input (Table 3) was evaluated mostly through the thematic and deductive analyses of interviews, documents, and observation.

Analysis of the Role of the Tool in the Input

The AST was selected by the organizers for its ability to support the aims of the workshop: exploring and designing nature-based solutions in public and private spaces in the early phase of adaptation planning. Furthermore, the collaborative design element of the tool could foster dialogue between stakeholders to address institutional barriers to the implementation of such measures and could serve as a pilot for collaborative planning workshops in Berlin. Previous research has highlighted the importance of task-technology fit in PSS usefulness [50]. Finally, the tool is intended to be used by small groups, like that in the workshop, and the type of information presented by the tool is well suited to institutional stakeholders.

5.3. Process

Observations, interviews, and questionnaires were used to evaluate the workshop process, using the inductive, deductive, and meta analyses (Table 4).

Analysis of the Role of the Tool in the Workshop Process

Our analysis indicates that the AST supported the workshop process mostly through communication and the way of working. These were among the most valued aspects of tool use by participants.
Communication between participants and an interactive way of working were supported through the tool’s map interface, real-time feedback, and library of measures. Responding to the tool’s content and working around a common object created a dynamic and engaged process during the workshop. This finding highlights the interconnected nature of content and process in workshops and the tool’s role in supporting both. By providing content, the tool was central to supporting a productive workshop process and realizing its achievements in a time-efficient manner.

5.4. Content

The observations, interviews, questionnaires, and documents were most relevant for evaluating the content, using the inductive, deductive, and meta analyses (Table 5).

Analysis: Role of the Tool in the Content

Our analysis indicates that the tool was a significant source of substantive content in the workshop and also elicited the communication of content held by the local and European partners. This included subjects not covered by the tool, such as social or institutional issues. The tool’s most valued elements, its library of measures and real-time feedback, are its content.
Given the participants’ mixed level of familiarity with adaptation measures, reviewing the tool’s library created a common knowledge base for the design. Similarly, the map interface created a focal point for discussions and a shared spatial language. The interactive nature of the touch table was also valued for adding content in a more dynamic and creative way than traditional workshops.

5.5. Results

While the inductive, deductive, and meta analyses were used to evaluate the results (Table 6 and Figure 4), the meta-analysis was particularly helpful.

Analysis: Role of the Tool in the Results

The tool was central to the results achieved in the design workshop. The main work product, the plan of measures on the map, was created in the tool and based on information provided by the tool’s library and indicators. Participants, however, found the less tangible results, like learning and collaboration, most valuable. It is more challenging to determine the tool’s role in achieving these types of results, but evidence includes participants reporting that the tool made the workshop more effective and efficient than others they had attended, and significantly more so than local planning practice without workshops. The tool also supported dialogue and improved communication between participants, as discussed in earlier sections, and so contributed to the less tangible results.

5.6. Use

The evaluation of use (Table 7) focused first on the use of results at two time frames: during the SSD-Moabit West project and after it. The meta-analysis was especially useful for comparing planned or intended uses of results with actual uses over time.

Analysis: Role of the Tool in the Use of Results

Both the work products and the less tangible results from the tool were used directly and indirectly during and after the project. The plan developed in the tool was a useful artefact and the most used result for project reporting, presenting, and as the basis of further analysis and design elaboration. The plan was valued for communication purposes and for developing the pilot project. However, the plan was not used to select measures, as would be expected. This was attributed to the pre-selection of a preferred measure and to contextual factors of the project that limited openness to pursue new measures proposed in the plan. Overall, the work products, namely the map and measures developed with the tool, were used for official purposes. The less tangible results, such as strengthened commitment, were used to motivate the actions of partners in this project and to inspire future initiatives. The use of work products is interesting in this regard, as the purpose of the AST is to create designs that inform planning, but contextual factors of the project appear to have limited this use while making the designs useful in other important ways and making the less tangible outcomes useful to the planning process.

5.7. Effects

The longitudinal study was particularly useful for capturing effects (Table 8) over time, using the inductive, deductive, and meta analyses.

Analysis: Role of the Tool in the Effects

The tool’s strongest effect during the project was on learning. Here, the collaborative workshop and the tool’s library of measures and interactive character appear to have contributed to learning through the provision of content and improved communication and interaction. The tool supported the intended effects of the project by providing a successful pilot of collaborative tool-based planning workshops, as evidenced by the proposed use of the tool for other projects in the city. The learning and strengthened commitment credited to the tool also played a role in achieving approval for the tree pit pilot; however, these effects are too indirect and enigmatic for strong claims.
The tool did not have a discernible effect on the rest of the planning process, on the decisions made, or on the physical problem situation. This appears to be largely due to contextual factors of the project, like its timeline being too short to consider new ideas or to engage other stakeholders.

6. Discussion

We conceptualized the use of planning support tools as nested within a workshop, which occurs during a planning process, which itself takes place within a larger context. In the previous section, we described our findings from applying the evaluation framework to the SSD-Moabit West design workshop for sustainable urban water management, which made use of the Adaptation Support Tool. In the discussion, we reflect on the use of the tool in the workshop, the connections to the planning process and its context, and finally, on our research methods.

6.1. Reflections on the Use of the Tool in the Workshop

Our results have shown that the design workshop was perceived positively and that participants enjoyed working with the one another and the tool in collaborative adaptation planning. Beyond outcomes that could reasonably be expected from dialogue alone, we ascribe the following attributes to the use of the tool:
  • Providing information about the many adaptation measures in the tool’s library, which created a common knowledge base and vocabulary for the design.
  • Supporting dynamic communication by serving as a focal point of discussion and group work through a shared spatial language in the map and interaction with the tool.
  • Ranking suitable measures for the local physical conditions, adaptation targets, and input criteria.
  • Producing a mutually-supported spatial plan of preferred measures, with their basic dimensions and locations specified.
  • Improving learning among participants through substantive content, enriched communication, and interactions.
While some of these outcomes could arguably be achieved with paper maps and more traditional forms of a workshop, the tool provided time efficiency to achieve these results within three hours. In this way, the tool’s unique contribution was to combine the analysis, design, and dialogue aspects of conceptual planning in a time efficient and informed manner. These findings are consistent with the main added values of PSS identified by Pelzer et al. [10], namely, learning, communication, collaboration, consensus, efficiency, and more informed products.
When reflecting on the value of the tool in the workshop, most participants remarked that the way of working was more efficient, creative, interactive, or inspirational than traditional planning. Previous PSS research has shown that some types of users, such as planners and community members, may find an analytical map-based tool disruptive to their manner of working [30,41,51]. In Berlin, the match between the tool’s engineering frame and the participants’ technical backgrounds probably contributed to their comfort with the tool. It would be valuable to evaluate tool use in a more mixed group.

6.2. Reflections on Connections with the Planning Process and Context

The most relevant effects of the tool on the planning process were contributory and less tangible in nature, such as learning. This is not surprising, given the preliminary level of design in the workshop and the focus on overcoming barriers to implementing pilots. The lack of more causal and concrete effects, however, is a function of the context. Most critically, the project structure defined, to a large extent, the role that the tool could play in the planning process. A better alignment between the workshop aims and project schedule seems like it would have provided a better opportunity for the tool to affect the planning process in a material way. Research has shown the critical influence of context on the role of a tool [22,27,28,42].
Learning plays an important role in adaptation [1,3,52,53] and forms a common aim of planning support tools, and PSS more specifically [10]. Therefore, the learning effects created by using the AST are important outcomes.

6.3. Reflections on the Research Methods

6.3.1. Case Study

A longitudinal case study proved a useful approach for examining the role of a tool in a workshop and planning process, particularly as this approach allowed us to evaluate the use of results and the effects over the life of the project and beyond. As expected, the complexity of real-world planning made it challenging to tease out the most contributory and less tangible effects that were realized. Here, the richness of context was important for understanding the ‘how’ and ‘why’ of what was observed.
The SSD-Moabit West design workshop was a representative case of adaptation planning. Evaluating ‘real’ workshops, as opposed to those designed for academic research, offers obvious benefits for the representativeness of results. However, ‘real’ workshops are imperfect research objects. In our particular case, there was insufficient time for using the tool to its full capacity in the workshop, which limited the extent of the design; local data was not used in the tool, limiting the value of its indicators; and some stakeholders were missing from the workshop, whose perspectives were absent from the dialogue. Evaluating a ‘real’ workshop, however, revealed the critical importance of context in determining the role a tool is able to play.
While case studies are meant to offer in-depth insights in place of broadly generalizable results, it is useful to compare our findings to other research on PSS use in workshops. In doing so, we see a number of consistent themes emerge. For instance, Pelzer et al. [10], found that users’ valued the MapTable planning support tool more for collaboration and communication support than for outcomes. Similarly, the same tool’s shared map interface was found to stimulate knowledge sharing and dynamic interactions in workshops, which contributed to learning [51]. Meanwhile, Arciniegas and Janssen [20] found that another map-based touch table tool supported improved communication and new insights into land use planning, Russo et al. similarly found map interfaces are highly valued by practitioners [27]. Mirroring our own findings, Pelzer [54] noted the need for alignment between a tool’s functionality and the stage of planning in order to promote effective tool use. Finally, a number of researchers [22,27,28,42,55] have highlighted context as a determining factor in the role, and even the meaning, of a PSS and its outcomes. While many of these findings were based on simulated workshops and different tools, our corroboratory results are based on a real planning workshop using the AST. Most importantly, while prior research has focused on the workshops alone, we have evaluated the effects of PSS use over the longer-term planning process, a novel step in this field.

6.3.2. Evaluation Framework

We required a framework that recognized the nested nature of tool use within workshops, planning processes, and context. Our framework was useful for structuring the evaluation and for ensuring that it was systematic and comprehensive. The framework, however, is descriptive in nature; it simply structures data so that it is addressed, regardless of expectations and preconceptions. The evaluator must make sense of the data and draw causal links. The framework was used as the basis of the deductive analysis, while the inductive and meta-analyses were used to surface explanatory threads, major themes, and to check for components missing from the original framework. The three analyses combined, allowed locally specific and relevant themes to emerge while ensuring the evaluation was still systematic and produced reliable and comparable results.
Our choice for a framework that does not focus on tool characteristics, but instead focuses on the factors that help understand the role of the tool in a broader setting, provided a holistic and rich picture of what worked (and not), how it worked, and why. A challenge in using and reporting on the framework is overlap, which comes from the interconnectedness of factors. For instance, the tool’s content, such as the map interface, also played an important role in the process of the workshop. In this article, we chose to report the results according to the structure of the framework to illustrate both the application of the framework, as well as the results of this particular case.

6.3.3. The Challenges of Evaluation Revisited

We started this article by describing several challenges in evaluating the use of tools in adaptation planning workshops and processes. Reflecting on our framework and evaluation, we find:
  • The evaluation factors and describing elements broad enough to be relevant for a variety of tools and workshops and specific enough to produce meaningful insights for our case.
  • The framework and analysis method flexible enough to reflect local conditions and capture emergent themes yet structured enough to produce systematic and comparable results.
  • The longitudinal case study approach appropriate and effective for capturing the effects of the tool on the planning process and participants, and for revealing the importance of context, while still capturing the details of tool use in the workshop itself.
  • The nested view of tools helpful for understanding the use of the tool, its results, and effects.
  • The descriptive and qualitative nature of the framework a potential weakness in its reliability, but a strength in its ability to be applied to a wide variety of cases and tools, in different contexts.
The results of our evaluation of the AST used in the design workshop for SSD-Moabit West are specific to the tool and the application studied. The use of tools, the tools themselves, and the conditions in which they are used are too varied to make claims about the generalizability or transferability of our results. Nevertheless, by using a systematic and structured approach to the evaluation, the outcomes should be comparable and useful in other cases. The reliability of the framework can only be confirmed through testing in more applications. However, the skill of the evaluator is an important and less predictable variable in the quality of results. Validity is a more interesting question and a common challenge in qualitative studies [48,49], such as ours. We found several strategies useful for limiting bias:
  • Using many sources and types of data for triangulation.
  • Basing the evaluation on a structured framework for ensuring a systematic review of all the data.
  • Using different approaches in the data analysis for capturing a comprehensive view of the data.
  • Using a longitudinal study for ensuring the consistency of our findings over time.
  • Checking our themes, hypotheses, explanations, and findings with key informants.
  • Using an evaluator who is independent of the tool, the workshop and the project.
  • Engaging an external reviewer to check the evaluation design, analysis and results.
Finally, we recognize that the access, time, and resources to carry out a comprehensive and longitudinal evaluation are luxuries not readily available to most projects. While our analysis was time consuming, the framework could also be used in a ‘lighter’ evaluation. Workshop organizers or evaluators could fill in most of the framework based on their knowledge, soliciting input and feedback from key participants, as needed. Care should be taken to think critically about the evaluator’s biases and preconceptions, as they will not have the benefit of thorough data collection or analysis.

7. Conclusions

We set out to understand what role a PSS, like the AST, plays in collaborative planning workshops, and what effects such tools have on these activities, the participants, and the planning processes in which they are used. We also wanted to test how such evaluations could be carried out effectively. There are a number of challenges in evaluating the role of tools in a way that the results are both meaningful to a specific case, and more broadly, useful and comparable. Such evaluations must be flexible yet structured and detailed yet wide-reaching. In this article, we have presented a framework for making evaluations, along with our results and experiences in applying it to a longitudinal case study of the AST, used in a design workshop for sustainable urban water management, in Moabit-West, Berlin. Our findings showed that the tool’s role was mostly contributory and less tangible in nature (e.g., supporting learning and communication) as opposed to directly causal and concrete (e.g., affecting the planning process, decisions or problem situation). Perhaps most importantly for illustrating our assertion that the effect of tools should be studied within the wider arena of the planning process and context, our results showed that the role of the tool was largely a function of contextual conditions, such as project structure and timing.
While one case study is a modest contribution to understanding the role of tools in collaborative planning workshops, the longitudinal case study approach allowed us to evaluate the effects of a tool over time, and to test a framework for evaluation. We found our framework and research approach addressed the challenges of evaluations and provided useful and usable results. Naturally, more applications are needed to test the reliability of the framework, while additional evaluations of tools in real applications are needed to continue improving the quality of PSS and of adaptation planning practice and theory. Finally, evaluations that account for the nested nature of tools within workshops, planning processes, and context can help to capture effects beyond the workshop.

Author Contributions

Conceptualization, S.M., F.H.M.v.d.V. and J.H.S.; data curation, S.M.; formal analysis, S.M.; investigation, S.M.; methodology, S.M., F.H.M.v.d.V. and J.H.S.; project administration, F.H.M.v.d.V.; software, F.H.M.v.d.V. and R.B.; supervision, F.H.M.v.d.V. and J.H.S.; validation, J.H.S.; visualization, R.B.; writing—original draft, S.M.; writing—review and editing, S.M., F.H.M.v.d.V. and J.H.S. All authors have read and agreed to the published version of the manuscript.

Funding

This project received funding from the European Union’s Horizon 2020 research and innovation programme, under grant agreement No. 640954.

Acknowledgments

The authors thank the Climate-KIC Smart Sustainable District–Moabit West project for serving as a case study. We are especially grateful to Nadine Kuhla von Bergmann and Georg Hubmann at CHORA Conscious City, Department for Sustainable Urban Development, Faculty of Architecture, TU Berlin, and to the members of the sustainable urban water management group, who participated in this research. Livius Hausner was particularly helpful in providing information and documents. Finally, we thank the anonymous reviewers and the editor of this journal for their helpful comments on our manuscript.

Conflicts of Interest

The authors declare no conflict of interest. The funders played no role in the design of the study; in the collection, analyses, or interpretation of data; in the writing of the manuscript, or in the decision to publish the results.

Appendix A

Workshop Agenda and Invited Stakeholders

Table A1. Workshop agenda, activities, materials, and outcomes. Grey cells are plenary; white cells are the design session.
TimeActivityMaterialOutcome
9:30Coffee and reception
10:00–10:30Workshop introductions and overviewPresentations
10:30–11:00Working group updates—water, energy, mobilityPresentations
11:00–11:15Introductions
  • Self-introductions in the group
  • Review of session aims and agenda
  • Explanation of the evaluation research and consent forms
Consent formsGroup familiarity
Communicate aims and agenda
Inform and consent
11:15–11:30Presentation of Best-Practices Document by TNOReport detailing best practices for sustainable urban water management measures in the NetherlandsLearning about best practices and several examples of sustainable urban water management in the Netherlands
11:30–12:15AST Introduction and Start-Up 1
  • Explanation of AST content, operation
  • Review of the measures in the tool’s library of measures—including discussion about implementation experience
  • Review of the site map, with flood inundation and heat maps to identify critical locations for measures
  • Entering adaptation targets and local conditions into AST
  • Formation of short-list of group’s preferred measures
AST on touch table
AST library of measures
AST set-up tab
White board
Learning about the tool
Learning about 67 adaptation measures, sharing experiences and local challenges
Focusing on spatial aspect of problems
Agreed set-up conditions in tool
Short list of preferred measures
12:15–13:15Designing Adaptation Plan in the AST 1
  • Discussion of measures, possible locations for implementation and applying them in the AST
AST on touch table with tool operator/facilitatorA plan developed in the AST with measures implemented, giving basic dimensions and indicators of effectiveness
13:15–13:30Design Session Wrap-up
  • Discussion of what should be elaborated in final plan
  • Agreement on next steps
Agreed elaboration of plan
Agreed next steps for project
13:30–13:40Questionnaires
  • Completion post-workshop surveys
Hardcopy surveysCompleted surveys
13:30–14:30Lunch Informal discussions and agreements for actions
14:30–15:00Working group presentations of design session results—water, energy, mobilityPresentationsCommunicating results to other working groups
15:00–16:00Integration session—looking for opportunities to integrate water, energy, mobility pilot projectsDiscussionIntegrated project proposals
16:00–16:15Coffee break
16:15–17:00Funding session for workgroup leadersDiscussion
1 The activities, content and outcomes of this step are elaborated in Supplement 3.
Table A2. Stakeholders invited to the workshop.
Local Stakeholders from Berlin
IPSLocal urban water consultancy. Led the sustainable urban water management group.
Nolde and PartnerLocal design-build-operate consultancy, specializing in urban water solutions. Could design and build nature-based measures.
Berlin WasserbetriebeBerlin water company. Would be responsible for implementing measures related to urban drainage and retention. Three departments were invited: research and development, sanitation, and drainage.
Bezirksamt Mitte von BerlinDistrict authority, tasked with approving, operating and maintaining any measures in public streets or green areas in Moabit West. The offices of streets and green spaces, and of nature conservation were invited.
Senatsverwaltung für Stadtentwicklung und UmweltCity department for urban development and environment. The departments of water resources and ground water were invited.
European Partners from the Climate-KIC Consortium
DeltaresDutch institute for applied research in the field of water and subsurface. Facilitated the Adaptation Support Tool design session.
TNODutch institute for applied sciences. Developed the best practices document.

Appendix B

Data Collection

Table A3. Data collected by phase over project duration.
1: Prior to Workshop
August–September 2016
DocumentsWebsite of preceding project that initiated SSD project
Report from preceding project that initiated SSD project
Internal team emails about organization and planning the design session
Interviews5 interviewees—interviews were recorded and transcribed
1 design session organizer
1 design session participant
1 design session facilitator and participant
1 workshop organizer
1 project manager
2: During Workshop
September 2016
ObservationsObservations of design session and larger workshop, based on observation protocol. Written notes were used to record observations.
SurveysPost-session surveys from all participants
DiscussionsDuring breaks, short discussions with most participants, organizers and facilitators to check information and ask for impressions. Written records were made of discussions.
DocumentsPresentations made in plenary and working group sessions
Workshop records (agenda, invitees, participants, etc.)
List of measures selected by water group for application
Photographs of design session participants working with tool
Inspiration document prepared for session
3: Immediately Following Workshop
September 2016
DocumentsPlans developed in design session
Agreements, plans for next stepsFrom interviews and discussion in sessions, the planned next steps were recorded, as well as agreed actions of different actors. These were also reported by session organizers to the project management team.
Interviews5 interviewees—interviews were recorded and transcribed.
1 design session organizer
1 design session participant
1 design session facilitator and participant
1 workshop organizer
1 project manager
4: Project End—Final Symposium Event
December 2016–January 2017
DocumentsFinal project report
Symposium records (agenda, invitees, participants)
Symposium handouts
Presentations made at end symposium events
ObservationsObservations of end symposium event with stakeholders and partners, based on observation protocol and with use of German interpreter. Written notes and audio memos were used to record observations.
Interviews3 interviewees—interviews were recorded and transcribed.
1 design session organizer and participant
1 design session participant
1 design session facilitator and participant
1 project manager
DiscussionsDuring breaks and after symposium, short discussions several partners, participants, organizers and managers, to check information and ask for impressions. Written records and audio memos were used to record discussions.
5: One Year Post-Project End
January–February 2018
Interviews4 interviewees—interviews were recorded and transcribed.
1 design session organizer and participant
1 design session participant
1 design session facilitator and participant
1 project manager
DocumentsProject website (SSD Moabit)
Project status updates and reporting shared during interviews

Appendix C

Data Analysis

Table A4. Codes used for evaluation factors and indicators.
Evaluation FactorsDescribing ElementsCodes Used to Develop Describing Element
CONTEXTLocal settingCONTEXT—Setting information
CONTEXT—Prior elements
Institutional settingCONTEXT—Institutional
CONTEXT—Challenges Institutional
Project structure and processCONTEXT—Process structure
CONTEXT—Challenges Structural
INPUTAim and role of activityINPUT—Aim of Activity
OrganizationINPUT—Resource Availability
INPUT—Organization of Activity
Stakeholders and participantsINPUT—Actors
INPUT—Participants
CONTENTDepth and breadthCONTENT—Depth and Breadth
Data and informationCONTENT—Validity and Credibility
Tool and methodologyCONTENTv Methodology
PROCESSProceduresPROCESS—Procedures
CommunicationPROCESS—Communication
Way of workingPROCESS—Participants
PROCESS—Working Method
Organization PROCESS—Organization
PROCESS—Resource Use
RESULTSOutcomesRESULTS—Work Products
RESULTS—Non-product Results
DocumentationRESULTS—Presentation
RESULTS—Availability
Value and relevanceRESULTS—Acceptance
RESULTS—Relevance
RESULTS—Solution quality
RESULTS—Verifiability and Validity
USEDirect useUSE—Direct
Indirect useUSE—Indirect
UnusedUSE—Unused
EFFECTSLearning effectsEFFECTS—Actors
EFFECTS—Learning
Problem situation effectsEFFECTS—Problem Situation
Planning process effectsEFFECTS—Planning Process
Decision effectsEFFECTS—Decisions/Policy Quality
Intended effectsEFFECTS—Intended
Italicized items are from the inductive analysis. Otherwise, codes are based on deductive analysis based on Thissen and Twaalfhoven (2001) framework [40].
In addition to the codes and themes that were developed and summarized above, there are also two other ways codes and themes were used in the analysis.
  • ‘Tracking codes’: Codes that were used to keep track of narratives in the data that did not contribute to a specific theme, but were useful for the meta-analysis. For example, a code ‘Planned use’ was helpful for tracking intended use of results, which could later be compared to the actual use.
  • ‘Prompting codes’: Factors that were used in the meta-analysis, but were not conducive to text coding. These codes were used as prompts for the meta-analysis. For example, factors such as ‘sensible results’.
Table A5. Tracking codes used in the evaluation.
Tracking CodeUse
CONTEXT—Challenges GeneralTo identify the role of these challenges as they reinforced/counteracted the role of the design session and tool
PROCESS—ChangesTo identify if the process of the design session strayed from plans
PROCESS—EndingTo identify how the design session ended
RESULTS—Planned ActionsA type of result that is a plan to take action by a participant. Later compared to actual actions taken following design session.
USE—Planned UseTrack intended use of results for different time periods for comparison with actual use. Identified realized, unrealized and realized but unforeseen uses of results and their time frames
EFFECTS—TypesTrack different types of effects over time
Needed actionsTrack actions that were identified as necessary to reach certain aims, like implementation. Later checked which actions were taken and the results.
Next steps/expectationsTrack the plans and expectations of different actors to compare with the actual process and what transpired.
ParticipationIdentify role of participation and views on participation
Perspectives/viewsTrack different perspectives of actors in the project over time to identify changes, contradictions, shared views, etc.
Table A6. Prompting codes used in the evaluation.
Prompting CodeUse
RESULTS—ConsistencyAssessing the consistency of the results with the input conditions, actors, process and content of the design session and project
RESULTS—DocumentationAssessing the quality of the documentation, different from the theme documentation
RESULTS—SensibleAssessing whether results seemed reasonable for the project and actors
USE—Timeframe of UseExamining when results were used in the process
USE—Used ElementsExamining which results or elements were used
USE—Used ForExamining in what capacity or for what purpose results were used
USE—Who UsedExamining who used which results following the design session
EFFECTS—ImplementationAssessing implementation or realization with a broad view, not only of ‘built project’ but ‘soft changes’

References

  1. Anguelovski, I.; Chu, E.; Carmin, J. Variations in approaches to urban climate adaptation: Experiences and experimentation from the global South. Glob. Environ. Chang. 2014, 27, 156–167. [Google Scholar] [CrossRef]
  2. Masson, V.; Marchadier, C.; Adolphe, L.; Aguejdad, R.; Avner, P.; Bonhomme, M.; Bretagne, G.; Briottet, X.; Bueno, B.; de Munck, C.; et al. Adapting cities to climate change: A systemic modelling approach. Urban Clim. 2014, 10, 407–429. [Google Scholar] [CrossRef]
  3. Mayer, I.S.; van Bueren, E.M.; Bots, P.W.G.; van der Voort, H.; Seijdel, R. Collaborative decisionmaking for sustainable urban renewal projects: A simulation—Gaming approach. Environ. Plan. B Urban Anal. City Sci. 2005, 32, 403–423. [Google Scholar] [CrossRef]
  4. Eikelboom, T.; Janssen, R. Collaborative use of geodesign tools to support decision-making on adaptation to climate change. Mitig. Adapt. Strategies Glob. Chang. 2017, 22, 247–266. [Google Scholar] [CrossRef] [Green Version]
  5. Henstra, D. The tools of climate adaptation policy: Analysing instruments and instrument selection. Clim. Policy 2016, 16, 496–521. [Google Scholar] [CrossRef]
  6. Van de Ven, F.H.M.; Snep, R.P.H.; Koole, S.; Brolsma, R.; van der Brugge, R.; Spijker, J.; Vergroesen, T. Adaptation Planning Support Toolbox: Measurable performance information based tools for co-creation of resilient, ecosystem-based urban plans with urban designers, decision-makers and stakeholders. Environ. Sci. Policy 2016, 66, 427–436. [Google Scholar] [CrossRef] [Green Version]
  7. Billger, M.; Thuvander, L.; Wästberg, B.S. In search of visualization challenges: The development and implementation of visualization tools for supporting dialogue in urban planning processes. Environ. Plan. B Urban Anal. City Sci. 2017, 44, 1012–1035. [Google Scholar] [CrossRef]
  8. Al-Kodmany, K. Using visualization techniques for enhancing public participation in planning and design: Process, implementation, and evaluation. Landsc. Urban Plan. 1999, 45, 37–45. [Google Scholar] [CrossRef]
  9. Geurts, J.L.A.; Joldersma, C. Methodology for participatory policy analysis. Eur. J. Oper. Res. 2001, 128, 300–310. [Google Scholar] [CrossRef]
  10. Pelzer, P.; Geertman, S.; van der Heijden, R.; Rouwette, E. The added value of Planning Support Systems: A practitioner’s perspective. Comput. Environ. Urban Syst. 2014, 48, 16–27. [Google Scholar] [CrossRef]
  11. Geertman, S.; Toppen, F.; Stillwell, J. Planning Support Systems for Sustainable Urban Development; Geertman, S., Toppen, F., Stillwell, J., Eds.; Springer: Berlin/Heidelberg, Germany, 2013; Volume 195. [Google Scholar]
  12. Arciniegas, G.; Janssen, R.; Rietveld, P. Effectiveness of collaborative map-based decision support tools: Results of an experiment. Environ. Model. Softw. 2013, 39, 159–175. [Google Scholar] [CrossRef]
  13. Kuller, M.; Bach, P.M.; Roberts, S.; Browne, D.; Deletic, A. A planning-support tool for spatial suitability assessment of green urban stormwater infrastructure. Sci. Total Environ. 2019, 686, 856–868. [Google Scholar] [CrossRef] [PubMed]
  14. Pelzer, P.; Geertman, S. Planning support systems and interdisciplinary learning. Plan. Theory Pract. 2014, 15, 527–542. [Google Scholar] [CrossRef]
  15. Russo, P.; Lanzilotti, R.; Costabile, M.F.; Pettit, C.J. Adoption and Use of Software in Land Use Planning Practice: A Multiple-Country Study. Int. J. Hum. Comput. Interact. 2018, 34, 57–72. [Google Scholar] [CrossRef]
  16. Te Brömmelstroet, M. PSS are more user-friendly, but are they also increasingly useful? Transp. Res. Part A Policy Pract. 2016, 91, 166–177. [Google Scholar] [CrossRef] [Green Version]
  17. Wardekker, J.A.; de Jong, A.; Knoop, J.M.; van der Sluijs, J.P. Operationalising a resilience approach to adapting an urban delta to uncertain climate changes. Technol. Forecast. Soc. Chang. 2010, 77, 987–998. [Google Scholar] [CrossRef] [Green Version]
  18. McEvoy, S.; van de Ven, F.H.M.; Blind, M.W.; Slinger, J.H. Planning support tools and their effects in participatory urban adaptation workshops. J. Environ. Manag. 2018, 207, 319–333. [Google Scholar] [CrossRef]
  19. Sellberg, M.M.; Wilkinson, C.; Peterson, G.D. Resilience assessment: A useful approach to navigate urban sustainability. Ecol. Soc. 2015, 20, 43. [Google Scholar] [CrossRef]
  20. Arciniegas, G.; Janssen, R. Spatial decision support for collaborative land use planning workshops. Landsc. Urban Plan. 2012, 107, 332–342. [Google Scholar] [CrossRef]
  21. Pettit, C.J. Use of a collaborative GIS-based planning-support system to assist in formulating a sustainable-development scenario for Hervey Bay, Australia. Environ. Plan. B Plan. Des. 2005, 32, 523–545. [Google Scholar] [CrossRef]
  22. Geertman, S. Potentials for planning support: A planning-conceptual approach. Environ. Plan. B Plan. Des. 2006, 33, 863–880. [Google Scholar] [CrossRef] [Green Version]
  23. Goodspeed, R. Sketching and learning: A planning support system field study. Environ. Plan. B Plan. Des. 2015, 43, 444–463. [Google Scholar] [CrossRef]
  24. Vonk, G.; Geertman, S. Improving the Adoption and Use of Planning Support Systems in Practice. Appl. Spat. Anal. Policy 2008, 1, 153–173. [Google Scholar] [CrossRef] [Green Version]
  25. Vonk, G.; Geertman, S.; Schot, P. Bottlenecks blocking widespread usage of planning support systems. Environ. Plan. A 2005, 37, 909–924. [Google Scholar] [CrossRef] [Green Version]
  26. Kuller, M.; Farrelly, M.; Deletic, A.; Bach, P.M. Building effective Planning Support Systems for green urban water infrastructure—Practitioners’ perceptions. Environ. Sci. Policy Policy 2018, 89, 153–162. [Google Scholar] [CrossRef]
  27. Russo, P.; Lanzilotti, R.; Costabile, M.F.; Pettit, C.J. Towards satisfying practitioners in using Planning Support Systems. Comput. Environ. Urban Syst. 2018, 67, 9–20. [Google Scholar] [CrossRef]
  28. Pelzer, P.; Geertman, S.; van der Heijden, R. A comparison of the perceived added value of PSS applications in group settings. Comput. Environ. Urban Syst. 2016, 56, 25–35. [Google Scholar] [CrossRef]
  29. Geertman, S. PSS: Beyond the implementation gap. Transp. Res. Part A Policy Pract. 2017, 104, 70–76. [Google Scholar] [CrossRef]
  30. Pelzer, P.; Brömmelstroet, M.; Geertman, S. Geodesign in Practice: What About the Urban Designers. In Geodesign by Integrating Design and Geospatial Sciences; Lee, D.J., Dias, E., Scholten, H.J., Eds.; Springer: Berlin/Heidelberg, Germany, 2014; pp. 331–344. [Google Scholar]
  31. Midgley, G.; Cavana, R.Y.; Brocklesby, J.; Foote, J.L.; Wood, D.R.R.; Ahuriri-driscoll, A. Towards a new framework for evaluating systemic problem structuring methods. Eur. J. Oper. Res. 2013, 229, 143–154. [Google Scholar] [CrossRef] [Green Version]
  32. Te Brömmelstroet, M. Performance of planning support systems: What is it, and how do we report on it? Comput. Environ. Urban Syst. 2013, 41, 299–308. [Google Scholar] [CrossRef]
  33. Abelson, J.; Forest, P.G.; Eyles, J.; Smith, P.; Martin, E.; Gauvin, F.P. Deliberations about deliberative methods: Issues in the design and evaluation of public participation processes. Soc. Sci. Med. 2003, 57, 239–251. [Google Scholar] [CrossRef]
  34. Hassenforder, E.; Smajgl, A.; Ward, J. Towards understanding participatory processes: Framework, application and results. J. Environ. Manag. 2015, 157, 84–95. [Google Scholar] [CrossRef] [PubMed] [Green Version]
  35. Pettit, C.; Bakelmun, A.; Lieske, S.N.; Glackin, S.; Hargroves, K.C.; Thomson, G.; Shearer, H.; Dia, H.; Newman, P. Planning support systems for smart cities. City Cult. Soc. 2018, 12, 13–24. [Google Scholar] [CrossRef]
  36. Innes, J.E.; Booher, D.E. Consensus building and complex adaptive systems: A framework for evaluating collaborative planning. J. Am. Plan. Assoc. 1999, 65, 412–423. [Google Scholar] [CrossRef]
  37. Jones, N.A.; Perez, P.; Measham, T.G.; Kelly, G.J.; d’Aquino, P.; Daniell, K.A.; Dray, A.; Ferrand, N. Evaluating Participatory Modeling: Developing a Framework for Cross-Case Analysis. Environ. Manag. 2009, 44, 1180–1195. [Google Scholar] [CrossRef]
  38. Rowe, G. Evaluating Public-Participation Exercises: A Research Agenda. Sci. Technol. Hum. Values 2004, 29, 512–556. [Google Scholar] [CrossRef]
  39. Rowe, G.; Frewer, L.J. Public participation methods: A framework for evaluation. Sci. Technol. Hum. Values 2000, 25, 3–29. [Google Scholar] [CrossRef]
  40. Thissen, W.A.H.; Twaalfhoven, P.G.J. Towards a conceptual structure for evaluating policy analytic activities. Eur. J. Oper. Res. 2001, 129, 627–649. [Google Scholar] [CrossRef]
  41. McEvoy, S.; van de Ven, F.H.M.; Santander, A.G.; Slinger, J.H. The influence of context on the use and added value of Planning Support Systems in workshops: An exploratory case study of climate adaptation planning in Guayaquil, Ecuador. Comput. Environ. Urban Syst. 2019, 77, 101353. [Google Scholar] [CrossRef]
  42. McEvoy, S. Planning Support Tools in Urban Adaptation Practice Planning Support Tools in Urban Adaptation Practice; Delft University of Technology: Delft, The Netherlands, 2019. [Google Scholar]
  43. McEvoy, S. Planning Support Tools in Urban Adaptation Practice Planning Support Tools in Urban Adaptation Practice. Available online: https://repository.tudelft.nl/islandora/object/uuid:48b7649c-5062-4c97-bba7-970fc92d7bbf?collection=research (accessed on 10 December 2019).
  44. EIT Climate-KIC. Moabit West|Climate-KIC. Available online: http://www.climate-kic.org/success-stories/moabit-west/ (accessed on 12 April 2018).
  45. Green Moabit. Stadtteilentwicklungskonzept: GREEN MOABIT—Bericht Berlin. 2013. Available online: https://sustainum.de/wp-content/uploads/2015/10/Green_Moabit_Bericht-1.pdf (accessed on 17 December 2019).
  46. Von Bergman, N.K. Smart Sustainable District Moabit West: Final Report 2016. 2017. Available online: http://ssd-moabit.org/wp-content/uploads/2017/01/final_reportcover_website.pdf (accessed on 17 December 2019).
  47. Voskamp, I.M.; van de Ven, F.H.M. Planning support system for climate adaptation: Composing effective sets of blue-green measures to reduce urban vulnerability to extreme weather events. Build. Environ. 2015, 83, 159–167. [Google Scholar] [CrossRef]
  48. Yin, R.K. Case Study Research Design and Methods, 3rd ed.; Sage: Thousand Oaks, CA, USA, 2003. [Google Scholar]
  49. Creswell, J.W. Research Design: Qualitative, Quantitative and Mixed Methods Approaches, 2nd ed.; Sage: Thousand Oaks, CA, USA, 2003. [Google Scholar]
  50. Pelzer, P.; Arciniegas, G.; Geertman, S.; Lenferink, S. Planning Support Systems and Task-Technology Fit: A Comparative Case Study. Appl. Spat. Anal. Policy 2015, 8, 155–175. [Google Scholar] [CrossRef] [Green Version]
  51. Pelzer, P.; Arciniegas, G.; Geertman, S.; De Kroes, J. Using MapTable to Learn About Sustainable Urban Development. In Planning Support Systems for Sustainable Urban Development; Springer: Berlin, Germany, 2013. [Google Scholar]
  52. Tyler, S.; Moench, M. A framework for urban climate resilience. Clim. Dev. 2012, 4, 311–326. [Google Scholar] [CrossRef]
  53. Birkmann, J.; Garschagen, M.; Setiadi, N. New challenges for adaptive urban governance in highly dynamic environments: Revisiting planning systems and tools for adaptive and strategic planning. Urban Clim. 2014, 7, 115–133. [Google Scholar] [CrossRef]
  54. Pelzer, P. Usefulness of planning support systems: A conceptual framework and an empirical illustration. Transp. Res. Part A Policy Pract. 2017, 104, 84–95. [Google Scholar] [CrossRef]
  55. Te Brömmelstroet, M. A Critical Reflection on the Experimental Method for Planning Research: Testing the Added Value of PSS in a Controlled Environment. Plan. Pract. Res. 2015, 30, 179–201. [Google Scholar] [CrossRef]
Figure 1. Map of case study location, Moabit West, Berlin, Germany. Modified from Sieker et al. [46].
Sustainability 12 00173 g001
Figure 2. Interface of the Adaptation Support Tool and its three panels.
Sustainability 12 00173 g002
Figure 3. Participants working with the Adaptation Support Tool in the design workshop for Moabit West, Berlin (used with permission from CHORA Conscious City, TU Berlin).
Sustainability 12 00173 g003
Figure 4. Initial plan developed in the Adaption Support Tool (AST), during the design session. Measures include a water square, porous pavement, disconnecting paved surfaces, green roofs, urban agriculture, tree pits, and swales.
Sustainability 12 00173 g004
Table 1. Evaluation factors, with the elements by which each factor was described in this study [42,43].
Evaluation Factors
ContextThe context in which a planning process and a specific workshop take place has important implications for what can be achieved by a planning support tool [22]. Contextual factors can include political and physical conditions, social, technical and ecological systems, and what events have come before. The elements of context that are relevant for a tool’s role and effects in a specific case can vary significantly.
Context is described in this study by: local project setting; institutional setting; project structure and process.
InputThe input to a workshop encompasses everything that was provided to it, such as the available data, the stakeholders related to the issue, and the objectives of the workshop. Input should not be confused with participants’ contributions during the workshop, which is content.
Input is described in this study by: Aim and role of workshop; organization of workshop; stakeholders and workshop participants.
ProcessA workshop’s process includes the procedures, communication, and ways of working during the activity. This is not to be confused with the overall planning process, in which the workshop takes place. Tools typically intend to support a workshop process through improved interactions and communication.
Process is described in this study by: workshop structure and procedures; communication; way of working.
ContentContent refers to the substantive material used during a workshop, including information, knowledge, models, maps, perspectives, and values that are shared by participants or provided by organizers. Planning support tools are typically an important source of substantive content.
Content is described in this study by: quality and type of data and information used; depth and breadth of content; tool or method used.
ResultsResults are the direct products of a workshop, which include artefacts, like maps, models and planning documents, and less tangible outcomes like alliances and agreements. Tools aim to improve the quality of workshop results through improved content and processes.
Results are described in this study by: workshop results; documentation of results; value and relevance of results to the planning process and stakeholders.
UseThe use of results includes the direct and indirect ways a workshop’s tangible and less tangible results are used over various time frames and by different actors, for different purposes (direct use of a tangible result, for instance, would be a planner applying an idea or measure from a tool directly in the next steps of developing the plan. Indirect use of less tangible results would be a stakeholder leveraging a new alliance to influence decisions on the plan). The use of results leads to effects and also captures the value and meaning of the results for different stakeholders.
Use is described in this study by: direct use of results; indirect use of results; unused results.
EffectsEffects are the workshop’s impacts on the system or actors involved. Assessing effects is complicated as they have different forms and are realized at different temporal and spatial scales. There are direct effects from a workshop, such as learning and new relationships, and indirect effects through the use of results, such as influencing later decisions. Effects may be intended or unintended, and a workshop may clearly be the cause of an effect or only contribute to it. In adaptation and collaborative planning, less tangible effects, such as creating shared meaning, are as important as traditional, more concrete ones [3,36].
Effects are described in this study by: effects on learning; effects on problem situation; effects on planning process; effects on decisions made; (un)intended effects.
Table 2. Summary of the findings related to context, listed by the describing elements.
Local project setting
  • Densely built, limited green space or open community space
  • Mixed residential, commercial, industrial properties, predominantly rented
  • High unemployment, poverty and immigrant population, low community identity
  • Existing heat stress and combined sewer overflows from paved surfaces are projected to increase under climate change
Institutional setting
  • Environmental permitting and commercial property use are most relevant contextual factors for adaptation
  • Environmental permitting
  • Permitting favours traditional infrastructure over nature-based alternatives
  • No pilot program for implementing and testing alternatives
  • Layers of permitting administration are burdensome and time consuming
  • Commercial property lease contracts and business models
  • Short rental contracts require a return on adaptation investment of 2–3 years for renters
  • Property owners not incentivized to invest in adaptation, as benefits are realized by renters
Project structure and process
  • Workshop was part of a one-year planning and implementation project
  • Project operated under a limited and inflexible timeline, budget and objectives set by the funder
Table 3. Summary of the findings related to workshop input, listed by the describing elements.
Aim and role of the workshop
  • Workshop aims
  • Find opportunities for sustainable urban water management measures in private and public space in the district
  • Pilot collaborative planning workshops in Berlin
  • Project outcome aims
  • Address the heat and flooding issues in the district
  • Demonstrate nature-based solutions for tackling environmental permitting issues
Organization of the workshop
  • The overall workshop was organized by the project leaders
  • Water group leaders planned the design session, with the time, participant number and objectives established by the overall workshop
  • The AST was selected and used in an abbreviated version of a full-day workshop
Stakeholders and workshop participants
  • Water group leaders identified and invited stakeholders. Nine individuals attended the session (complete list in Appendix A)
  • Institutional stakeholders with the capacity to partner in implementing projects were prioritized
  • Number of participants limited by the overall workshop’s time, space and focus
Table 4. Summary of the findings related to workshop process, listed by the describing elements.
Workshop structure and procedures
  • Workshop steps (detailed agenda in Appendix A)
    • Introduction to session and participants
    • Sustainable urban water management best practices presentation and discussion
    • Review of measures in the AST library
    • Creation of a short-list of preferred measures
    • Design by implementing preferred measures in the tool’s map interface
  • Workshop activities were structured around the tool
  • Full design not realized in limited time, but most preferred measures were
  • Tool was most used to explore which measures were suitable and where they could be best implemented
Communication
  • Tool’s library provided a shared vocabulary to communicate about measures
  • Map interface provided shared spatial language and focus for discussions
  • Co-design effective and efficient for stakeholder communication
  • Participants reported tool helped them communicate, understand others
Way of working
  • Participants stood or sat around the tool, placed on a table (Figure 3)
  • Participants interacted directly in the tool
  • In the questionnaire, participants highly valued collaborative and interactive working
Table 5. Summary of the findings related to workshop content, listed by the describing elements.
Quality and type of information usedSources of Content
  • The tool’s library of measure, maps, overlays, and evaluative function
  • Presentation of sustainable urban water management best practices
  • Shared knowledge of local and European participants
Quality of Content
  • Dutch climate and cost data used (insufficient time and budget to customize)
  • Local heat and flood maps, adaptation targets, and district characteristics used
Participant Perceptions
  • Data acceptable for preliminary design aims of workshop and limited time and budget of the project
Depth and breadth of content
  • Wide breadth of issues related to design and implementation discussed, limiting time for detailing the design or comparing alternative designs
  • Discussions of measures based on the library and the map surfaced opportunities and constraints for the design
  • Tool could not fully address all topics that emerged, but participants found missing stakeholders the main limitation with respect to content
Tool or method used
  • Tool interface and interactive character elicited knowledge, information, and discussion from participants
  • Local input conditions and proposed designs were adjusted and then were saved in the tool, based on session dialogue
  • Participants most valued the tool’s library and feedback features
  • The library created a common knowledge base on adaptation measures that facilitated productive discussions in the session
Table 6. Summary of the findings related to workshop results, listed by the describing elements.
Workshop resultsWork Products
  • Plan made in the map, with measures, dimension, and locations (Figure 4)
  • List of preferred measures (not all implemented in the plan)
Less Tangible Results
  • Discussions about which measures were feasible and implementation barriers
  • Agreement between partners for next steps and actions
  • Shared aim identified by two partners created a commitment to shared actions
Documentation of the results
  • Process and work products comprehensively documented in the final report [46] and in the final presentation at stakeholder symposium
Value and relevance of the results to the planning process and stakeholders
  • Design addressed district’s physical issues and pushed institutional barriers
  • Participants’ satisfaction with work products mixed, some disappointment in level of design achieved
  • Participants’ satisfaction with less tangible results unanimously high, most valued outcomes
  • Project leaders’ satisfaction with work products very high
Table 7. Summary of the findings related to the use of workshop results, listed by the describing elements.
Direct use of resultsDuring the Project
  • Immediately following the design session, the plan was used in the integration session with other groups to select a pilot project
  • The plan was used by water group and project leaders in the documentation, follow up stakeholder meetings, and to elaborate on the design and analysis
After the Project
  • The plan formed the basis of the ‘tree pit’ pilot project that continued in the year following the end of the project
Indirect use of resultsDuring the Project
  • Strengthened relationship between two key partners used in ~30 meetings to secure permits and implementation of the pilot
After the Project
  • Experience from the workshop inspired one participant to propose it in a spinoff project
Unused results
  • Plan was used to identify a suitable location for the pilot but not to select tree pit measure, which was pre-selected by group leaders
  • Contextual factors, like limited time and budget to explore alternative, timing of the workshop in the middle of the project, and sunk costs and efforts in the tree pit proposal limited openness to new ideas from the design session
Table 8. Summary of the findings related to effects, listed by the describing elements.
Effects on learning
  • Learning was a dominant effect of workshop and tool use
  • Learning topics included: about measures, about ways of planning (collaborative workshop), about support tools, and about information and views of other participants
  • Participants most valued the workshop for insights on problems and solutions
  • Knowledge exchange between partners important to local participants
Effects on the problem situation
  • Authorities ultimately changed rules prohibiting infiltration measures, such as tree pits, effecting an institutional barrier from environmental permitting
  • Two tree pits being implemented in the pilot are expected to have a street-level effect on flooding and heat stress pressures
  • No measures have been implemented on private properties, as business models and lease contracts remain unchanged
Effects on the planning process
  • Next steps taken in the project not effected due to project constraints
  • Indirect contributory effects via participants’ use of learning and strengthened commitment convinced authorities to permit the pilot project
  • Big picture, the experience informed a spinoff project in which the tool-based workshop was proposed
Effects on the decision or policy
  • The location for the tree pit pilot was identified using the map interface of the tool during the workshop
  • Measure selection was not influenced by the workshop, due to contextual factors and the project’s structure
(Un)Intended effects
  • Workshop intended to lead to pilot demonstrating nature-based solutions and collaborative planning workshops in Berlin, these were achieved
  • No unintended effects of the workshop were encountered

