Article

A Large Scale, App-Based Behaviour Change Experiment Persuading Sustainable Mobility Patterns: Methods, Results and Lessons Learnt

1
Insitute for Applied Sustainability to the Built Environment, SUPSI, Via Trevano, 6952 Canobbio, Switzerland
2
Institute of Cartography and Geoinformation, ETH Zurich, Stefano-Franscini-Platz 5, 8093 Zürich, Switzerland
3
Dalle Molle Institute for Artificial Intelligence (IDSIA), USI-SUPSI, Galleria 2, Via Cantonale 2c, 6928 Manno, Switzerland
*
Author to whom correspondence should be addressed.
Sustainability 2019, 11(9), 2674; https://doi.org/10.3390/su11092674
Submission received: 4 April 2019 / Revised: 3 May 2019 / Accepted: 6 May 2019 / Published: 10 May 2019

Abstract

:
The present urban transportation system, mostly tailored for cars, has long shown its limitations. In many urban areas, public transportation and soft mobility would be able to effectively satisfy many travel needs. However, they tend to be neglected, due to a deep-rooted car dependency. How can we encourage people to make sustainable mobility choices, reducing car use and the related CO 2 emissions and energy consumption? Taking advantage of the wide availability of smartphone devices, we designed GoEco!, a smartphone application exploiting automatic mobility tracking, eco-feedback, social comparison and gamification elements to persuade individual modal change. We tested the effectiveness of GoEco! in two regions of Switzerland (Cantons Ticino and Zurich), in a large-scale, one year long randomized controlled trial. Notwithstanding a large drop-out rate experienced throughout the experiment, GoEco! was observed to produce a statistically significant impact (a decrease in CO 2 emissions and energy consumption per kilometer) for systematic routes in highly car-dependent urban areas, such as the Canton Ticino. In Zurich, instead, where high quality public transport is already available, no statistically significant effects were found. In this paper we present the GoEco! experiment and discuss its results and the lessons learnt, highlighting practical difficulties in performing randomized controlled trials in the field of mobility and providing recommendations for future research.

1. Introduction

The present urban transportation system, mostly tailored for cars, has long shown its limitations [1]. Cities seek to improve mobility alternatives to cars and promote a mix of transport modes, to counteract local and global problems associated with traffic and energy-intensive lifestyles [2]. For this purpose, they usually target the development of new infrastructures producing tangible changes in the urban environment, such as bike lanes, the improvement of public transport offers [3] or legislative interventions, or the reduction of attractiveness and opportunities for car travel, such as road closures, road pricing or monetary incentives for non-car transport [4]. However, only relying on such structural or regulatory tools is often insufficient to break car-dependent habits, promote inter-modal mobility choices and produce tangible reductions in car use at the community level: in many urban areas public transportation, soft mobility networks, or vehicle-sharing systems still tend to be neglected due to a deep-rooted car dependency [5,6,7].
To promote adoption of more sustainable mobility patterns, soft policy measures [8,9] were suggested as complementary tools to strengthen traditional urban mobility planning and management tools. Adopting a cognitive-motivational approach [10], they usually exploit insights from both psychology and behaviour disciplines [3,11], with the aim of stimulating individuals to voluntarily change their mobility patterns (Voluntary Travel Behaviour Changes programmes, VTBC [12]). They provide feedback, opportunities for social comparison, and economic incentives, targeting a change in affects, beliefs and attitudes towards individual mobility choices [3].
The growing diffusion of Information and Communication Technologies (ICTs) in the transportation field [13,14] opened up new possibilities for exploring cognitive-motivational tools and assessing their effectiveness. A whole body of research under the “captology” framework (i.e., the study of Computers as Persuasive Technologies by Fogg [15]) studies how to effectively couple traditional offline persuasive techniques, with ICT tools. In this framework, smartphone apps were identified as ideal tools, since they allow for bi-directional, frequent, and cheap interaction with individual app users, thus potentially being able to provide them with the right element to support their behaviour change process, at the right moment. Persuasive apps in the field of mobility started being developed following progress in automatic tracking capability by exploiting the GPS and other sensors embedded in smartphones [16,17,18,19,20,21]. For an in-depth discussion, one can refer to [22,23,24,25]. Frequently, such persuasive apps adopt a gamification approach, which is usually defined as the use of game elements in non-gaming contexts [26]. Typical gamification mechanics and elements are competition, cooperation, assignments, quests, goals, points, levels, badges and leaderboards [27]. More specifically, they rely on techniques for effective persuasion such as those identified by Froehlich [28]: provision of feedback on consequences of individual mobility choices (such as the impact on energy consumption or CO 2 emissions), invitation to define personal goals for change, engage in challenges, and compare performance within virtual communities composed of several app users.
Even though such persuasive, gamified apps are frequently popping up, their development is still a young discipline. In particular, similarly to soft policy measures and VTBC interventions, they were frequently seen to lack grounds in a proper behaviour change theory [24,29,30], which was said to limit both their behaviour change effectiveness and the capability to gain in-depth understanding of the effects produced by their use. Moreover, so far only a few field studies were run to assess their behaviour change effectiveness, and most of them were criticized due to the small sample of app users (understandably, sometimes heavily biased towards volunteer university students), the short period of app testing time and the consequent focus on short-term effects only, and, similarly to other VTBC interventions, the lack of proper randomization techniques, or even the lack of a control group, which precluded performing randomized controlled trials (RCTs), the “gold standard for interventions” [3,11,23,24,31,32]. Overall, this situation implies that:
  • results could not be generalized to the whole society,
  • long-term behavior change could not be measured, and
  • potential changes in their mobility behavior could not unequivocally be attributed to the app alone, since they might also be due to other external factors.
Against this backdrop, we developed and field tested GoEco!, a mobile app targeting a reduction in individual car use and the related energy consumption and CO 2 emissions, by promoting the use of public transport and soft mobility. Well aware of the above limitations affecting persuasive interventions in the mobility domain, we aimed at exploring the feasibility of performing a large scale, app-based field experiment, quantitatively assessing the app’s effectiveness by measuring the change in key mobility variables.
For this purpose, we designed and managed a one year long randomized controlled trial, involving voluntary individuals living in two different urban contexts across Switzerland. In this paper we introduce the GoEco! persuasive app and provide details about the methodology we followed in the field experiment aimed at assessing its effectiveness (Section 2). In Section 3 we present the results of the experiment and in Section 4 we discuss our results under the light of practical limitations that still affect internal and external validity of randomized controlled trials in the mobility field. In Section 5 we conclude by reflecting on the lessons learnt and on the main open challenges to be addressed in future research.

2. Materials and Methods

In this section we present the persuasive app GoEco!, state our research hypotheses and describe how we designed and managed the GoEco! experiment.

2.1. The GoEco! App

The persuasive app GoEco! is anchored in the Transtheoretical model for behaviour change [33], according to which behaviour change occurs through several cognitive-motivational processes, that make individuals progress from the stage of pre-contemplation of change to the stage of maintenance of change. Consistently, it is endowed with a set of features and components specifically designed to support individuals in each stage of behaviour change. Since the app is largely presented in another work [34], here we limit ourselves to introduce its key features, following the overview provided in Table 1, and to show some screenshots (Figure 1).
The app users are supposed to start from the pre-contemplation stage of behaviour change, at which they have no intention to change their mobility behaviour. By exploiting basic activity tracking features provided by the commercial app Moves [35] (discontinued since July 2018), GoEco! tracks all the travelled routes and, by means of on-purpose developed algorithms [36], detects the transport mode used, asking users for a manual validation of the detected transport modes (either confirmation or correction). All the travelled routes are automatically collected by the app, with no manual activities requested by the users, apart for the validation of the transport mode. If needed, users can temporarily stop the Moves tracking tool, and they can provide the validations at their own convenience, for example in the evening or in the weekends, going back to all the routes travelled in the previous week. Soon after validation, the users are provided with feedback about the individual routes they have travelled (kilometers and travel time, as well as CO 2 emissions produced and energy consumed, estimated based on the Mobitool consumption and emissions factors available for Switzerland [37], that depend on the transport mode used and on the amount of kilometers travelled, independently on the vehicle’s occupancy rate). To get more realistic estimates of impact, users are also allowed to set the average fuel consumption value of their car, expressed in fuel liters per 100 km, which is then used by GoEco! to customize the Mobitool estimates. Once per week, they are also given a summary of their mobility patterns and impacts (average weekly kilometers and travelling time, percentage use of transport modes). After four weeks of app use, they are also provided with information about their “baseline mobility patterns”, namely how they travel on average and the related impact on energy consumption and CO 2 emissions.
This information is supposed to raise their consciousness towards the need for a different mobility behaviour. At this stage, GoEco! supports them by suggesting them alternatives for the routes they regularly travel (“systematic” home-to-home loops) and by calculating their overall “potential mobility patterns”, namely the mobility patterns they could have, by always opting for the lowest carbon emitting alternative compatible with their needs. For a detailed description of how we perform this activity, please refer to [36]. Basically, the assessment of someone’s potential is based on the comparison to optimal travel behavior, where the optimisation criterion is, in this case, the amount of CO 2 emissions: for every travelled route, and specifically for every starting and final point, we search for all available itineraries and transport mode alternatives and select the one with the lowest CO 2 emissions. If the selected alternative does not provide a relevant improvement compared to the original route, no suggestion is made.
Once they get accustomed to this piece of information, individuals start contemplating change. Even though ideas and methods for automatically determining the time at which this happens (from passively recorded mobility data) exist [38], they were not advanced enough to be used in GoEco. Therefore, GoEco! assumes that people start contemplating change after they have been supplied with such a mobility feedback. At this stage, GoEco! invites them to set their personal goal for change, by choosing one of the five pre-set goal options (“reduce car use”, “increase slow mobility”, “increase public transport”, “reduce energy consumption”, and “reduce CO 2 emissions”), and setting a target by choosing a value between their baseline and potential mobility patterns. Progress towards this individual goal is therefore the main motivational factor that stimulates individuals to prepare to action. On a weekly basis, GoEco! provides users with an update on the progress towards their goal, showing them its level of achievement on a simplified bar chart (the height of the bar being proportional to the percentage of goal achievement) and providing them with a congratulation or encouragement message, depending on their performance.
To support users during action, GoEco! invites them to engage in individual challenges, providing users with practical suggestions on what should be done to progress towards one’s goal, such as for example “I will not use the car during peak hours for five days out of the next seven days”, “This week I will travel by slow mobility all my short routes”, or “During the weekend I will take the train for trips longer than 100 km”. Users are free to join or ignore challenges. The idea is that by joining a challenge, they are supported to replace their automatically performed mobility choices (habits) and turning them into different choices, explicitly controlled by intention. The completion of challenges is automatically assessed against a set of rules, so that users who achieve a challenge are automatically rewarded with a trophy. Additionally, users are rewarded with surprise badges, when specific sustainable mobility choices are detected by the system, such as using the bicycle every day for at least five consecutive days or travelling long trips by train. This also has a guidance effect: receiving an unexpected reward for spontaneously performed actions makes users aware of positive actions they perform and stimulates them to repeat them in the future. Moreover, badges reinforce commitment and rekindle user interest. Finally, action is further stimulated by the possibility of comparing individual performance with the other app users, seen as members of the same GoEco! community. Typically, gamified environments exploit a leaderboard, though in GoEco! this is not straightforward, since there is no point-based reward system. As such, personal goals for change are put at the center of the motivational mechanics, basing the comparisons between members of the GoEco! community on each individual’s level of achievement, combined with the number of challenges she completed and the number of badges she obtained. The leaderboard is updated every week, when the top-3 members of the week are also rewarded with visibility in the “Hall of fame” section. Regardless of the complexity of the goals, users can still be listed in the Hall of fame if they achieved their goals. The system does not judge goal complexity, which depends on the users’ initial mobility patterns, on their potential for change, on external, personal constraints and on their level of engagement. Progression towards an own goal is therefore the key motivational factor, and it gives a measure of success both at the individual level and in the competition with the other participants. Users are free to progress at their own pace and in their own direction, while being stimulated by GoEco! to achieve their personal goal for change. Also, note that monetary or tangible performance-based rewards are not included among the GoEco! motivational factors, since its aim is mostly to stimulate mobility behaviour change as a personal, intrinsic choice of app users, instead of buying it in exchange for money or other tangible goods, which has been found to only have temporary effects [39].
To support users in the maintenance of the new behaviour they started to put into practice, GoEco! strengthens individual commitment by means of a notification system, that daily reminds users to check and validate their routes, notifies them about updates of the weekly statistics, congratulates them whenever they achieve good results (goal achievement, challenge completion, attribution of badges, visibility in the Hall of fame) and encourages them to try again the next weeks if they fail their goals or challenges. Furthermore, in-person events outside the app are put in place to create a feeling of belonging to a community.

2.2. Research Hypotheses

The effectiveness of the GoEco! app is field-tested in a randomized controlled trial (experiment) [40,41,42] involving voluntary citizens across Switzerland, in two contexts largely differing in the urban settlement type and in the available mobility options: the City of Zurich (German-speaking part of Switzerland), a dense urban area, characterized by high levels of accessibility to public transport and infrastructures for slow mobility, and the Canton Ticino (Italian-speaking part of Switzerland), a region characterized by urban sprawl, where effective alternatives to individual cars are often missing. Data of the Swiss Mobility and Transport Census 2015 [43] show that in Ticino car use is definitely higher than in Zurich (the daily average percentage of kilometers travelled by car and motorbike is equal to 74% in Ticino and 57% in Zurich), while in Ticino on average less kilometers are travelled than in Zurich (29.17 km/day in Ticino and 34.94 km/day in Zurich).
The use of the persuasive app GoEco! is expected to help people substituting their car uses with lower CO 2 emission transport modes (modal change), and consequently to help reducing travel impacts in terms of CO 2 emissions and energy consumption. In particular, this is expected to occur for “systematic loops”, namely the home-to-home loop routes that are frequently travelled.
We speculate that changing one’s own habitual routes is easier than changing occasional ones, because origins and destinations are well-known and convenient alternatives can more easily be found, and then beneficially implemented over time, without any need for additional effort in the search for alternatives. Therefore, the GoEco! experiment is designed to test the following null-hypotheses.
Hypothesis 1 (H1).
After treating individuals with the use of the GoEco! app, (i) average CO 2 emissions per kilometer and average energy consumption per kilometer are lower than before the intervention, and (ii) the after/before difference between these variables is higher than the after/before difference between the same variables, calculated in the same period for a comparable group of individuals, that are not treated with the GoEco! app.
Hypothesis 2 (H2).
The same conditions also hold true when only considering a subset of frequently travelled routes, namely those automatically classified as “systematic loops” by GoEco!’s algorithms.

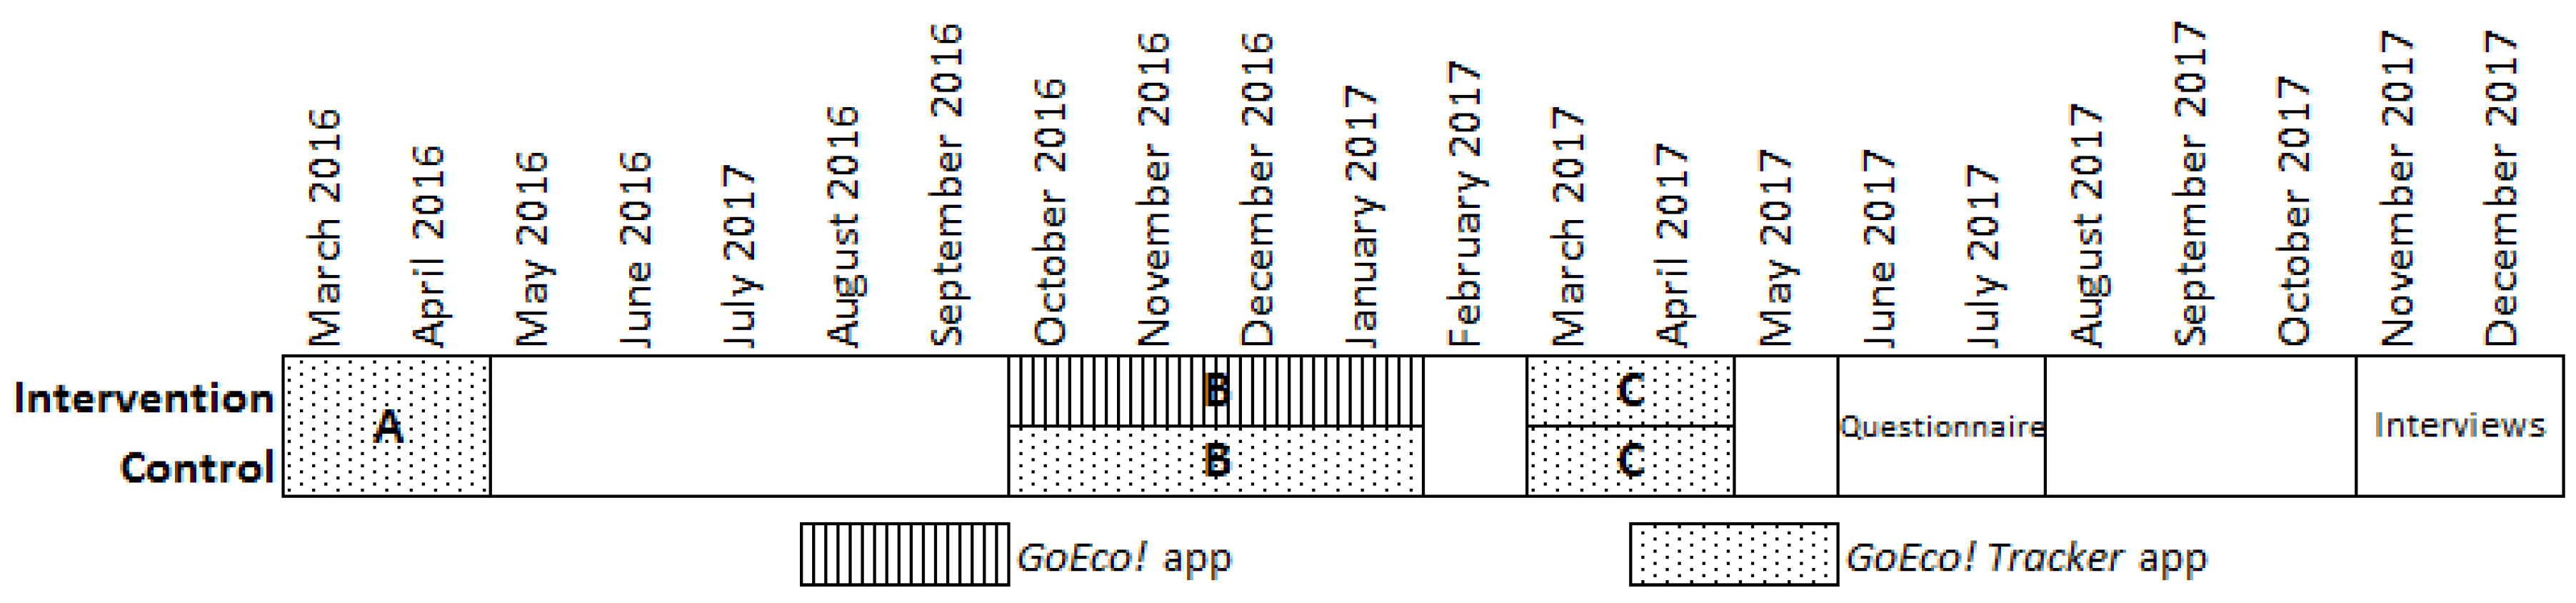
2.3. Design of the Experiment

Both these hypotheses are separately tested in Ticino and in Zurich, in order to detect possible different outcomes in the two regions. In each region, the experimental design envisions a treatment and a control group: the former groups are treated with the use of the GoEco! app, while the latter do not receive the persuasive treatment. However, also the control groups are requested to use an app, named GoEco! Tracker, developed on purpose within the project as well, and aimed at simply collecting mobility data, without any persuasive goal. The GoEco! Tracker app is a simplified version of the full GoEco! app, that only performs automatic tracking of individual mobility data. For this purpose, it exploits the same tracking component of GoEco! (algorithms, user interface, look and feel, etc.), but without offering any eco-feedback to the users. Similar to GoEco!, however, it requires users to perform a manual validation of each detected route, in order to confirm or correct the detected transport mode. Therefore, its users are still requested to interact with the app on a daily basis.
Overall, as shown in Figure 2, the experiment is designed around three mobility tracking periods:
  • period A (March–April 2016) aims at collecting pre-intervention, baseline mobility data, through the GoEco! Tracker app;
  • period B (October 2016–January 2017) aims at collecting “persuaded” mobility data while using the GoEco! app for the treatment groups and at collecting counterfactual mobility data for the control groups, through the GoEco! Tracker app;
  • period C (March–April 2017) aims at collecting post-intervention mobility data, again through the GoEco! Tracker app.
Periods A and C take place in the same months of the year, with a difference of one year, so that our research hypotheses can be tested by directly comparing the mobility data collected in these periods, without any data post-processing activity aimed at removing seasonal macro effects. They last for six weeks each, a duration chosen as a trade-off between the need for collecting as much and as diverse data as possible, and the need for limiting attrition as much as possible. Period B, instead, lasts longer (twelve weeks), since for a behavioural intervention to produce a long-lasting change, more time is needed. Since the assessment of the intervention is made by comparing mobility data collected between period C and period A, the specific time of the year chosen for period B is a less critical choice; it is set from October to January to avoid overlapping with the Summer holidays, during which management of the intervention is expected to be more complex and less effective.
Besides the quantitative data automatically collected by the GoEco!/GoEco! Tracker apps, to get additional insights on our research hypotheses, a post-experiment online questionnaire delivered to all project participants is also performed (June–July 2017), followed by individual semi-structured interviews conducted one year after the intervention with a subsample of 20 participants, randomly selected (November–December 2017). To conclude, a cross-analysis of the elements emerging from the quantitative data tracked by the app, the questionnaire, and the interviews is performed, to reciprocally enrich and sustain the insights they individually provide.

2.4. The Experimental Sample

The research goal to perform a large-scale field experiment is quantified in a target sample of overall 600 individuals, equally distributed between Ticino and Zurich regions—a much larger sample than previous interventions. They are are voluntary citizens, performing their usual everyday activities and trying to satisfy their mobility needs. They have to be a sufficiently large and varied group of individuals, to smooth out biases due to self-selection and allow generalization of the results of the intervention to the target segment of population more familiar with everyday use of smart device applications, namely individuals living in urban areas aged between 25 and 44 [44]. In order to reproduce the conditions of a “real-life” use (outside of the field test) of the GoEco! app as much as possible, we decided against paying people for their participation in the experiment, as well as against introducing any enforcement for app use.
To raise the interest by this target group, a three-month public recruitment campaign is set (December 2015–March 2016), exploiting a variety of communication channels available at the two experimental sites: press conferences, participation in local radio and television programmes, articles in newspapers and magazines, posts in social networks (Facebook and Twitter) and paid advertising on Facebook. Even though prizes for the participants remaining active until the end of the field experiment are envisioned (see Section 2.6), the campaign does not explicitly focus on them, in order to address intrinsic motivational factors as much as possible. Our general aim is in fact to stimulate mobility behavior change as a personal, intrinsic choice of app users, instead of buying it in exchange for money or other tangible goods, which has been found to only have temporary effects [39].

2.5. Randomization and Assignment to Treatment and Control Groups

During period A, no differentiation is made within the sample, and all recruited participants are asked to use the GoEco! Tracker app, in order to identify their baseline mobility patterns. The split in the treatment and control groups is performed at the end of period A, in order to only account for those participants that collect a sufficient amount of data to estimate reliable baseline mobility patterns—namely, to avoid that poor data quality and/or drop-outs could unbalance size and composition of the groups and preclude effectiveness of the experiment.
Thus, at the end of period A, the full set of routes collected by GoEco! Tracker for each participant is processed, in order to decide whether they are allowed to enter period B. Period A data is processed based on the following rules:
  • consider only days with at least one validated route (→ “active days”; no difference is made between working and non-working days);
  • consider only weeks with at least four “active days” (→ “active weeks”);
  • if the participant has at least three active weeks, at least fifty routes, and at least validated 80% of the routes (→ “active participant”), she can enter period B and has to be randomly attributed to treatment or control group; otherwise, she has to be excluded from the experiment.
Once the full sample of participants allowed to enter period B is identified, they are randomly assigned to the treatment and control groups. To avoid that further drop-outs during periods B and C affect the possibility to get statistically significant results, two thirds of the participants are randomly assigned to the treatment groups and one third to the control groups—namely, while respecting random assignment principles, we create a larger group of people using the persuasive GoEco! app, than the group of control people being just tracked with the GoEco! Tracker app.
Finally, in Tracking period C both groups are again asked to use the GoEco! Tracker app.

2.6. Retention of the Experimental Sample over Time

Since regular validation of the mobility data collected by GoEco! Tracker and GoEco! are essential (lacking them, no data is available to test our research hypotheses), to keep the sample of participants engaged over time and limit attrition, we set up an incentivizing system based on tangible prizes:
  • jackpot: in the three tracking periods, every week a participant is randomly chosen and rewarded with a 50 CHF voucher if she has confirmed the transport mode (validation) for all her routes registered by the GoEco! app;
  • quizzes: three monthly quizzes are run during tracking period B, each one offering two vouchers of the value of 100 CHF each;
  • random draw: a final random draw at the end of tracking period C offers larger prizes, such as a folding bicycle, a tablet, a smartphone or vouchers for walking holidays.
For vouchers, users are allowed to choose between Swiss retailers, public transport tickets, or charity donations. Since gathering correct mobility data is essential for the quantitative assessment of our research hypotheses, such prizes are only attributed if participants have validated all their routes and are only distributed at the end of the tracking period when they are issued. Please note that such prizes are introduced with the only aim of maintaining the users’ interest over time, namely to guarantee collection of a sufficiently large and reliable amount of data. Since their attribution is not related to any specific transport mode choice by the users, and only depends on trip-validation in the app, they are not expected to produce any influence on the users’ mobility behaviour. Neither the potential folding bicycle prize offered by the final random draw can influence the users’ mobility patterns and introduce a bias in the experiment, since the draw takes place after the end of the three tracking periods.
To invoke the feeling of belonging to a community and in anticipation of a critical decrease of commitment by the sample of participants during the intervention (period B), two in-person events outside the GoEco! app are also organized (one in Ticino and one in Zurich) for the treatment groups. Participants are invited to join recreational events providing practical examples of more sustainable mobility practices (visits to exhibitions and lazy bicycle rides across the city). During such events, participants are expected to get to know each other, share their experiences and tips to overcome difficulties in achieving challenges and, in general, support each other, fostering a long-lasting change into the new mobility behaviour.
Apart from these meetings, no other in-person interaction with the experimental sample is performed throughout the GoEco! intervention, and all activities are developed online, through the project website, videos and presentations, a newsletter and email communications. An help-line phone number is also provided, for any technical problem with the app use.

2.7. Overall Effectiveness of the Intervention—Test of Hypothesis H1

The test of our research hypotheses is made by comparing baseline data (period A) with data collected during period C, namely after the intervention has been discontinued, in order to account for its persistence over time. From the start of period B to the end of period C, further drop-outs are possible, and participants could reduce the frequency of their interactions with the apps, thus ending up collecting poor quality data, not sufficient to summarize their mobility patterns with the needed accuracy. Therefore, in line with the requirements concerning data collected during period A, to test hypothesis H1 we only consider the sample of participants who have at least three active weeks of data collection per period (A–C), collected at least fifty routes per period, and validated at least 80% of them. Then, we only account for validated routes, ignoring all data about non-validated routes.
By referring to the resulting set of data, we obtain a measure of the average ecological impact of each individual in each period, by calculating the average value over all routes travelled by each participant, respectively, in periods A (pre-intervention) and C (post-intervention), of the following variables:
  • CO 2 emissions per km [gCO 2 /km];
  • average energy consumption per km [kWh/km].
Finally, the reduction of the CO 2 emissions and the related energy consumption of each individual between the two periods A and C are retained as two measures of the ecological improvement of travel behaviours. Paired comparison statistical hypothesis tests are performed to verify the existence of a significant difference between the CO 2 produced (or the energy consumed) in period A and that produced (consumed) in period C. For each variable, two separate tests are performed, one for each of the two regions Zurich and Ticino.

2.8. Effect of the Intervention on Systematic Routes—Test of Hypothesis H2

Hypothesis H2 only refers to systematic routes travelled by participants, namely those that they travel more frequently, automatically identified by GoEco! post-processing algorithms [36].
For this purpose, we first look for systematic loops each individual travelled both in period A and in period C. If a given systematic loop is found for a specific individual in both tracking periods, the related mobility data enters the test of hypothesis H2; otherwise, the related data is not considered in this analysis. Considering only systematic loops allows loosening requirements about the minimal number of active weeks and the minimal number of collected routes: if the same systematic loop is found both in period A and in period C, it does not really matter how many other routes the individual travelled in the same week, or for how many weeks she was active with the mobility tracking app: such a loop can be used in the test of hypothesis H2. Therefore, the only condition we keep on collected data is to consider validated routes and exclude all the others. As a consequence, hypothesis H2 is assessed on a different sample of participants with respect to the one used for hypothesis H1.
To test H2 we consider the same variables as for H1, i.e., CO 2 emissions and energy consumption per kilometer. Two measures of each individual’s ecological impact, one for each variable, are obtained in two steps: first, the two variables of interest are averaged over all repetitions of each systematic loop, to characterize the loop ecological impacts; then, for each participant, the loop average impacts are averaged over all her systematic loops. This way, the impacts of different systematic loops traveled by the same participant are not treated as independent. This choice is based on the following consideration: although each loop requires an independent decision about how to travel it, some characteristics of the participant (e.g., owning a season ticket for public transport) may represent a common factor influencing all her choices; this implies that modal choices made by participants about how to travel each loop may not be independent. The ecological impact of systematic travels before (period A) and after (period C) intervention is compared via a paired statistical hypothesis test for the difference between the means of two populations. To assess a significant improvement of the travel behaviour of the treated population, only individuals from the intervention group are considered in this analysis. In order to ascribe the observed improvement to the GoEco! app, the improvements of the treatment group are compared to those obtained by the control group. For this purpose, classical statistical tests for independent samples of the difference between two population means are performed. For each variable, two separate tests are performed, one for each of the two regions, Zurich and Ticino.

3. Results

The campaign to recruit voluntary participants for the GoEco! experiment took place between December 2015 and March 2016. At its conclusion, we obtained a total of 599 applications (277 in Ticino and 322 in Zurich), plus another 35 outside the study areas, who had to be rejected from the beginning. Of these 599 applicants, 26 owned neither an iOS nor an Android smartphone (the only two operating systems supported by the GoEco! apps), therefore they had to be rejected. 573 participants entered tracking period A, aimed at collecting their baseline mobility data using the GoEco! Tracker app.
Out of the initial 573 accepted participants at the start of period A, only 212 fulfilled the requirements presented in Section 2.5 and were assessed as “active participants”, thus eligible to enter period B. In fact, even though applying to the project was a totally voluntary decision, 138 accepted participants did not even install the GoEco! Tracker app, while 223 of them had not collected enough data to provide us with three active weeks of data. The sample of 212 active participants was then randomly assigned to the treatment and control groups (69 treatment in Ticino, 34 control in Ticino; 76 treatment in Zurich and 33 control in Zurich). Starting from these 212 participants who entered period B (the actual intervention period), however, further attrition occurred during both the intervention and the final period C.
Please note that in our app-based interventions, abandonment did not occur by participants officially stepping out of the experiment (we just received 28 explicit notifications by participants who requested to leave the project): it occurred when they either totally stopped using the GoEco! app(s), or when reduced their frequency of interaction with it, though keeping some level of activity. In both cases, they ended up not collecting enough data to fulfill the requirements indicated in Section 2.7 and Section 2.8, namely to summarize their mobility patterns with the needed accuracy to test hypothesis H1 and H2. Lacking these data, the widely recommended “intention to treat” analysis [42] (namely, testing hypotheses on the data collected by the full samples of randomly assigned treatment and control groups, no matter their level of activity within the experiment) could not be performed, and we were compelled to exclude non active participants from the test of our hypotheses.

3.1. Overall Effectiveness of the Intervention—Test of Hypothesis H1

After processing the collected data according to the rules summarized in Section 2.7, the overall number of participants for which data of sufficient quality to test hypothesis H1 was available (sample of active participants) decreased to just 52: 21 in the treatment and 10 in the control group in Ticino, and 13 in the treatment and 8 in the control group in Zurich.
Notwithstanding such a large decrease in the sample of participants, the relative size of the treatment with respect to the control groups remained roughly the same (two thirds treatment and one third control). Under the assumption that drop-outs occurred randomly [42], and having verified that there was no significant difference in the baseline (period A) distribution of the CO 2 emission and energy consumption per km between the active participants of control and treatment groups, we thus tested our research hypothesis H1 on the final sample of 52 active participants, instead of the initial sample of 212 participants who were randomly assigned to the treatment and control groups. As the field data clearly showed that the distribution of the variables of interest is not Gaussian, our hypotheses were tested using non-parametric tests, i.e., the Wilcoxon signed-rank test was used to compare the emissions and consummations of each individual in periods A and C (dependent samples), whereas the Wilcoxon rank-sum test was used to compare the improvements in the treatment and control groups (independent samples). The results of the Wilcoxon signed-rank test for H1 are shown in Table 2: comparing values before (period A) and after (period C) the intervention, a reduction in average CO 2 emissions per kilometer is observed in Ticino, while in Zurich the average CO 2 emissions per kilometer are observed to increase. For the average energy consumption per kilometer, instead, negligible differences are found, in both regions. None of these differences, however, are statistically significant. Therefore, due to the the small size of the final sample of participants, the large variability of the recorded routes, and the relatively short duration of periods A and C, there is no statistical evidence that the use of the GoEco! app produced any effect on the overall mobility patterns.

3.2. Effect of the Intervention on Systematic Routes—Test of Hypothesis H2

Following the procedure summarized in Section 2.8, the number of participants for whom at least one common systematic loop was found between period A and period C was instead 45: in Ticino, 15 in the treatment and 7 in the control group, and in Zurich 14 in the treatment an 9 in the control group.
Again, we noticed that the relative sizes of treatment with respect to control groups remained roughly the same (two thirds treatment and one third control). Under the assumption that drop-outs occurred at random and having verified that there was no significant difference in the baseline (period A) distribution of CO 2 emissions and energy consumption per kilometer between the active participants of the control and treatment groups, we tested our research hypothesis H2 on this sample of 45 participants. As already mentioned, for this purpose, considering that data are observably non Gaussian, we used the non-parametric Wilcoxon signed-rank test.
The results of test of hypothesis H2 are summarized in Table 3: comparing the variables before (period A) and after (period C) the intervention, a statistically significant reduction in CO 2 emissions and energy consumption per kilometer is found in Ticino. In Zurich, instead, no statistically significant after/before difference is found for any of the considered variables. Even though not statistically significant, the differences found show a slight tendency in the desired direction (a decrease in energy consumption and CO 2 emissions per kilometer).
To check whether these differences regarding systematic loops can actually be related to the use of the GoEco! app or depend on external factors affecting treatment group members, we compare the performance of the treatment group against the control group, both in Zurich and in Ticino. For this purpose, a Wilcoxon rank-sum test is used (Table 4).
According to the test, from period A to period C, in Ticino there is statistical evidence of a change in the systematic mobility behaviour of the treatment group (reduction of average energy consumption and CO 2 emissions per kilometer), which instead is not observed in the control group. In the Ticino treatment group, in fact, considering all the systematic loops common to periods A and C, CO 2 emissions per km decrease on average by 23.9 gCO 2 /km (corresponding to 22.4% of the average emissions per km of systematic loop in period A). On the other hand, in the Ticino control group they increase by 9.2 gCO 2 /km (corresponding to the 8.6% of the average emissions per km of systematic loop in period A): the GoEco! intervention thus results in net savings of 33.1 gCO 2 for every kilometer of systematic loops travelled, corresponding to 31.0% of the average emissions per km of systematic loop in period A.
Similarly, though with much less impact, the average energy consumption per kilometer of systematic loops is found to decrease by 0.107 kWh/km in the treatment group, while it increased by 0.029 kWh/km in the control group, with a net effect attributable to GoEco! equal to a decrease of 0.136 kWh/km. In both cases, the reported differences are significant at an α = 0.05 level (the respective p-values being equal to 0.049 and 0.036).
Finally, in Zurich, no statistically significant changes in systematic mobility were observed for any of the above variables. Therefore, we conclude that the hypothesis of a change in systematic mobility induced by the GoEco! app (H2) can be accepted only in Ticino, whereas for Zurich, no sufficient evidence in favor of it was collected.

4. Discussion

According to the above results, GoEco! is found to bring about a change in individual mobility patterns of its active users, reducing the average CO 2 emissions and energy consumption per kilometer. However, such a change is only found for systematic routes, namely the ones they frequently travel. Also, it is only found in Ticino: in Zurich a certain increase in soft mobility is found, but it is not statistically significant.
The fact that GoEco! is found to impact systematic routes only can be explained by considering that it is in general easier to change habits on paths one frequently travels, partly because their constraints are often satisfied by a wide range of mobility options (e.g., the distance to cover is small, there are no particular requirements to carry heavy loads, etc.), and partly because once a more sustainable (and suitable) alternative has been found, one can rely on it again and again over time. We explain the different impacts in Ticino and Zurich by referring to the differences in the average mobility patterns of the population in these areas: as indicated by average mobility data estimated by the Swiss Mobility and Transport Census [43], differently than in Ticino, the use of public transportation is already very common in Zurich: there, the tendency is to only use cars when other options are really not convenient (or even not available). Namely, systematic routes are in general already optimized with respect to avoiding car use, thus available room for change is quite limited, and bringing about additional change in Zurich is more difficult.
However, several factors affect both internal and external validity of the experiment and the overall possibility to generalize these results, suggesting to carefully handle them and highlighting the need for further investigation along this line of research. Therefore, in addition to its behavior change results, which might be difficult to generalize, the GoEco! experiment is valuable for the lessons we can draw regarding the development of randomized controlled trials in the field of mobility and the possibility of exploiting similar persuasive apps within urban mobility policy-making. In particular, here we discuss:
  • whether baseline and control data are reliable, considering they were collected through a mobility tracking app with which the experimental sample regularly had to interact with—and, if not, how to reduce biases;
  • if and how attrition bias can be reduced, thus strengthening the internal validity of the experiment;
  • whether the final experimental sample reflects the characteristics of the GoEco! target group, or instead is polarized by already “converted” public transport and soft mobility users—and, if so, if this can be avoided.

4.1. Mobility Tracking: Does It Influence Individual Mobility Patterns?

All participants of the GoEco! experiment, both in the treatment and control groups, are engaged in three mobility tracking periods, which require installing an app (either GoEco! or GoEco! Tracker, depending on the group and on the period) and interacting with it on a daily basis, in order to validate the automatically detected transport mode, for each recorded route.
Therefore, all GoEco! participants are somehow aware they are being monitored, and also receive a daily indirect feedback on their mobility patterns. This is in contrast with design requirements for randomized controlled trials, that, for internal validity purposes, state that experimental data collection should be as unobtrusive as possible [42,45,46], so that the collected data reflects how participants would have ordinarily behaved. Thus, the question arises whether data collected through the GoEco! Tracker app can be regarded as reliable, unbiased representations of pre-intervention baseline mobility patterns (period A, all groups), of post-intervention mobility patterns (period C, all groups), and also of control mobility patterns (period B, control groups).
In such a situation, two complementary phenomena might in fact come into play. First, being aware of being observed, participants might be led to alter their behaviour in order to better comply with a resource-saving, socially desirable one, particularly trying to behave in ways they believe researchers expect them to. These aspects were referred to as the “social desirability effect” [47], the “experimenter demand effect” [48], “the good subject effect” [49], or, more in general, “the Hawthorne effect” [50,51]. Second, daily requests for validation might act as unintended information feedback on users’ current mobility patterns, activating awareness about them, and thus actively starting to persuade them to opt for different transport modes, introducing a bias in the baseline data.
This might change the above experimental results, suggesting that the persuasive effect of GoEco! might be under-estimated: if the control group is indirectly persuaded by use of GoEco! Tracker, an improvement of the average emissions and consumption per kilometer could have occurred also in the control data. On the other side, the actual average emissions and consumption per kilometer recorded in period A (baselines) for the treatment groups could be smaller than their actual value before the GoEco! intervention. These two phenomena would imply a positive impact of the GoEco! Tracker on the control group and a smaller impact of the GoEco! app on the treatment groups, thus reducing the measurable treatment effect. Please note that a questionnaire-based assessment of the experiment, asking for example to summarize one’s mobility patterns before and after the experiment, would produce even more significant biases, therefore we never considered it. In fact, responses would be heavily affected by the above biases as well, in addition to the general response biases and distortions that usually affect self-reporting, such as wording of the questions, rating scales, type of questions, etc. [52].
Acknowledging this problem, during the final interviews with a random selection of participants of the experiment, we explicitly investigated whether this phenomenon had taken place. We asked interviewees whether, while using GoEco! Tracker, they felt any pressure to modify their mobility choices. Half of the interviewees confirmed this happened (partly due to the awareness of being included in a project fostering sustainable mobility and partly due to direct effect of feedback), even though they were not able to quantify the magnitude of the phenomenon.
This phenomenon can barely be avoided with the currently available location tracking technology, however. In contrast to other energy-related fields, where the effectiveness of behaviour change interventions can be analyzed through randomized controlled trials fed by energy consumption data collected by already in place (smart) metering networks [42,53], no network for automatic and unobtrusive mobility data collection is currently available. The GPS-enabled mobility tracking technology we opted for in GoEco! is in fact still limited, with an 80% average accuracy in automatic route and transport mode detection [35,54], which calls for manual validation by app users. Alternatively, attempts to automatically infer user routes and transport modes by exploiting the information tracked by cellphone towers or wi-fi in urban areas have been widely explored, though they are still unable to produce the fine-grained mobility tracking data needed by persuasive apps, and further research in this field is needed [55]. Both these directions are worth being further explored, since they could greatly remove those biases: in the former case, individuals would just be informed they are going to be monitored and requested a consent, in order to guarantee compliance with ethical data protection regulations. In the latter, they would also be requested to install a mobility tracking app, but then they could forget about it, letting it run in the background of their phone. In both cases, feedback-related bias would be removed, while awareness-related biases would be limited to a first “onboarding” period, and then significantly reduced.
Therefore, while calling for further progress in automatic mobility tracking, a safe strategy to collect less biased data could be to prolong the duration of the tracking periods (which would not be an additional effort for the experimental sample, since tracking would automatically take place), and then to discard data collected in the initial “onboarding” period, during which awareness-related bias is expected to be higher.

4.2. Abandonment over Time: How Can We Limit Attrition and Keep Interest Alive?

The GoEco! experiment was designed to address the key limitations affecting app-based persuasive interventions highlighted in Section 1, particularly the limited size of the sample, the short duration of the intervention, and the lack of rigorous experimental procedures. For this purpose, we designed a large-scale experiment, involving around 600 individuals over a time period of one full year. However, a very large attrition phenomenon occurred, thus preventing us from performing the large-scale experiment we had envisioned. Nonetheless, a comparison against several similar app-based, persuasive interventions in the field of mobility, based on data collected by [23], shows that in GoEco! we were definitely able to perform a longer experiment than on average, also engaging a corresponding, if not higher than average, number of participants (Figure 3).
Even if we managed to guarantee a long-term duration, with several participants at least comparable to similar app-based persuasive interventions, the problem of attrition and abandonment over time remains and it is worth being addressed, for at least three reasons:
  • it might endanger the internal validity of the experiment itself: if abandonment in the control and the treatment groups is not randomly distributed, but follows specific, and different patterns, such groups end up not to be comparable;
  • if the abandonments occur so frequently in the frame of a research experiment that they lead at least some of the participants to feel morally obliged to remain active (as they declared in the interviews), one can expect that the use of a GoEco!-like app in real life would be flawed by even stronger drop-out rates, which would prevent attaining tangible benefits for urban mobility problems;
  • it reduces the power of the experiment, i.e., if this is indeed the case, that the intervention has been effective.
The difficulty of retaining participants’ interest for long periods of time, thus avoiding attrition phenomena and guaranteeing internal validity of experiments, is widely acknowledged, particularly in attempts to promote individual behaviour change by means of voluntary interventions [31,57]. Moreover, app-based interventions specifically suffer from the so-called “app-churn” phenomenon, which affects the use of any kind of apps: in a few weeks, users lose interest in new apps, thus precluding to fully exploit the behaviour change potential of its motivational mechanics [58].
To reduce experimental attrition, one should for instance reduce the operational burden on app users for both GoEco! and GoEco! Tracker apps, limiting the need for manual validation of the transport mode, as already indicated in the previous section: pre- and post-intervention data, as well as counterfactual data, would be automatically collected, without specific efforts by the experimental sample.
Moreover, to reduce app churn and foster retention of interest in the app, improvements in the current GoEco! app features could be performed, and new components could be included, with the aim of increasing the app’s attractiveness and creating additional reasons for individuals to use it. For this purpose, we directly asked GoEco! participants to indicate which other features they would have liked to find in future versions of the GoEco! app. The recommendations we collected through the final GoEco! questionnaire and interviews, reported in detail in another work [34], can be summarized as follows:
  • increase the frequency of push-notifications, provided that they are made more user-specific and personal;
  • make the eco-feedback more intuitive and improve its connection to the specific user’s value system (such as, if she values money more than the environment, provide her with monetary feedback);
  • offer more occasions for social interaction and add “social network”-like features;
  • create the need for users to access the app more frequently, by integrating a multi-modal travel planning component.

4.3. Representativeness of the Sample: Are We “Preaching to the Converted”?

Even though the final sample of GoEco! participants is small, the tests of our research hypotheses produced statistically significant results in Ticino. The question arises, however, whether these results can be generalized to the whole society—namely whether the external validity of the GoEco! experiment is guaranteed or not. This is strictly related to the key design elements of the GoEco! experiment, and particularly the voluntary nature of the experimental sample. It is well-known that voluntary behaviour change processes are affected by polarization that endangers the representativeness of the sample (volunteer selection bias [59,60]): self-selection recruitment strategies tend to raise interest in already motivated subgroups of the general population, frequently individuals with high environmental awareness and pro-environmental attitude who may even have already adopted sustainable consumption patterns, instead of the “mainstream car driver” citizens that the intervention is expected to target. In opt-in frameworks, such as GoEco!, pro-environmental individuals are stimulated to join, looking for confirmations about how good their behavior is, while mainstream citizens simply ignore the invitations. Similar tendencies might occur during the experiment, with higher drop-out rates by individuals with lower environmental awareness and attitude. A self-selection bias has therefore to be taken into account.
Nonetheless, when experiments are fed by individual mobility data, and pre-existing monitoring networks are not available, no opt-out strategy can be implemented (joining the experiment requires active and voluntary activities by the individuals, starting from installing the mobility tracking app), and no obligations to join can be put into force. Therefore, a self-selection of participants can barely be avoided. It is important, however, to analyze its effects and its implications.
To investigate this aspect, we consider the sample of 52 GoEco! participants that remained active until the end of the experiment (though similar conclusions would also emerge by analysing the sample of GoEco! participants for which baseline data are available, namely the 212 participants at the end of period A), and analyze their baseline mobility patterns (period A) against those of the average population in Ticino and Zurich, as they are summarized by the Swiss Mobility and Transport Census 2015 [43].
In particular, we consider the daily average kilometers travelled (29.17 km/day in Ticino and 34.94 km/day in Zurich) and the daily average percentage of kilometers travelled by private motorized transport modes (PMT, namely car and motorbike, equal to 74% in Ticino and 57% in Zurich), and classify each participant into one of the following categories:
  • soft eco: uses PMT less than average, however travels more than daily average;
  • hard eco: uses PMT less than average and also travels less than daily average;
  • soft private motorised: uses PMT more than average, however travels less than daily average;
  • hard private motorised: uses PMT more than average and also travels more than daily average.
The result of this classification indicates that the subsample of n = 21 active participants in Zurich is biased towards lower use of public motorized transport (PMT, i.e., car and motorbike) than the average population of Zurich: baseline data shows 81% of them can be classified as “eco”. Considering the subsample of the n = 31 active participants in Ticino, instead, the percentage of “eco” individuals is only equal to 48%. The amount of daily travelled kilometers is more evenly distributed, both in Zurich and in Ticino, with a predominance of participants travelling more than average (Figure 4).
From this point of view, therefore, the sample of GoEco! active participants in Ticino seems to be better comparable to the average population than the Zurich one, which suggests that external validity is better met in Ticino than in Zurich. Together with the fact that statistical significant results were found for test of hypothesis H2 in Ticino, this strengthens the conclusion that, in Ticino, a new policy measure targeting the large scale use of the GoEco! app could be beneficial as a policy measure for the transition towards more sustainable mobility. Regarding Zurich, instead, on the one hand this can explain why no significant effects were found, when testing our H1 and H2 hypotheses: since the majority of participants were already using the car less than average, possibilities for further reducing car use were low, and most likely limited to an increase in soft mobility. On the other hand, this shows that during recruitment of GoEco! project participants in Zurich we did not fully manage to raise the interest of average citizens, and especially of our “mainstream car drivers” target individuals: our initial expectation was to mostly address “private motorized” individuals, with the aim of turning them into “eco” individuals.
We explain such a polarization in the group of Zurich participants by acknowledging that the overall GoEco! approach is probably more effective in raising the interest of individuals already characterized by higher pro-environmental awareness than average, who are more likely to have already implemented more sustainable lifestyles, also in their everyday mobility patterns. In Zurich, where high quality infrastructures for alternatives to car use are available, this attitude of the sample would then tangibly translate into more sustainable mobility patterns than average, while in Ticino an attitude-behaviour gap [61] would appear, and, lacking valid alternatives to car, individuals would tend to behave more similarly to the average population.
This hypothesis is corroborated by responses to the final GoEco! questionnaire, explicitly aimed at assessing the pro-environmental attitude of the participants. In total, 48 out of the above 52 final GoEco! active participants answered these questions, indicating a medium to high pro-environmental attitude (higher in Ticino than in Zurich), and also the feeling of a personal responsibility to control pollution and climate change, both in Ticino and in Zurich (Table 5).
In this framework, a strategy to raise the interest of mainstream citizens might be to explicitly include tangible and/or monetary rewards, namely to rely on extrinsic motivational factors much more than we have done in the GoEco! experiment. Such a strategy might be useful both for future experiments (as a way to engage a representative sample of participants) and outside them, when using the app within voluntary behaviour change programmes. In the latter case, tangible prizes could be exploited to start engaging people with low intrinsic motivation for change, and could gradually be replaced by other motivational factors, as long as individuals progress through the stages of behaviour change, under the effect of GoEco!.
A totally different approach would consist in trying to replace the voluntary, opt-in framework by joining forces with possible other companies that are already collecting mobility data with the needed fine-grained accuracy, and are already used by a wide and diverse amount of people. Namely, one could create a partnership with companies offering other app-based services that already perform location tracking, such as Google, whose app is currently automatically activated in many smartphones as a default option, or REGA, which is a Swiss rescue agency that recently launched an app individuals can use to send alarms in case of emergencies, transmitting their coordinates to the rescue centers in Switzerland and abroad (https://www.rega.ch). Alternatively, partnerships could be created with any of the existing carpooling or car-sharing companies or, more generally, with companies offering Mobility-as-a-Service solutions [62], requiring their customers to enable location tracking services. Such a collaboration would not only simplify the location tracking, but also allow integrating their services into the Gamification part, e.g., by rewarding the use of carpooling. Note, however, that most of their customers are already “converted” users of public transport or innovative mobility services, which would still provide a biased sample.
Depending on the partner company, one would either collect already processed mobility data (such as routes and transport mode used, as provided by Google Maps), or just GPS trackpoints (such as those provided by the REGA app), to be then post-processed in order to identify the mobility patterns. In both cases, the collected data would only be reliable if the already indicated improvement in automatic mobility detection has taken place, since users would provide no route validation. Users would in fact only be requested to manually export the collected data and/or to give their consent to access it, and in exchange for this a reward could be offered.
This way, less biased data for the control group, as well as pre- and post-intervention data for the treatment group could be collected, by randomly assigning all users of the partner service to the experimental groups. For the intervention itself, instead, the partner company should be willing to offer new GoEco!-like mobility persuasive features and components, within their own app, and offer them to all the customers of the treatment group, within an opt-in framework. Such an agreement would be more difficult to negotiate, but it is worth exploring it. While in fact the inclusion of behaviour change features would look odd in REGA-like apps, it would quite fit Google, which is increasingly providing timely and customised information regarding available mobility options. Also in the case of such a partnership, however, limitations to validity of the experiment would emerge, particularly in terms of internal validity and attrition, since the control on who is using the partner app would be very limited—however possibly compensated by a definitely larger number of users. Ultimately, further research is needed to assess overall reliability and feasibility of this approach.

5. Conclusions

In this paper, we have presented GoEco!, a soft policy measure aimed at reducing car use in urban areas, thus providing direct benefits on transport-related energy consumption and CO 2 emissions, local pollution, safety, and soil sealing, to cite the main domains currently impacted by dominant car use. Acknowledging the large potential of coupling ICTs with voluntary behaviour change approaches, we developed the GoEco! mobile app aimed at persuading individuals to reduce their car use and opt for already available more sustainable transport modes. Such an app performs automatic mobility tracking, exploits information feedback elements, provides users with guidance on existing alternatives and promotes a social comparison of their performance, within a gamified framework. The effectiveness of GoEco! was tested in two different urban contexts in Switzerland: the region of Zurich, a dense urban area, characterized by very high quality public transport and cycling lanes, and the region of Ticino, characterized by urban sprawl and less efficient public transport and cycling infrastructures instead. The test engaged several voluntary citizens from both regions in a one year long randomized controlled experiment.
The experiment started with 573 voluntary participants, but ended with data of sufficient quality for less than 10% of the sample of participants at sign-in. Notwithstanding such a dramatic reduction in sample size, GoEco! was found to bring about a statistically significant change in systematic individual mobility patterns, reducing both average energy consumption and CO 2 emissions per kilometer of “systematic loops”, in a context where car-dependency is deeply rooted, such as the Swiss Ticino region. In Zurich, where individual mobility patterns are already optimized and car-dependency is lower, no significant effects were found. Also, external validity of the experiment was better met in Ticino than in Zurich, which leads to strengthen the conclusion that in contexts where car-dependency is still high, such as Ticino, new policy measures targeting the large scale use of the GoEco! app could be beneficial for the transition towards more sustainable mobility. Instead, in contexts where public transport is already widely used, such as Zurich, persuasive interventions might be more effective if, instead of targeting generic reductions in car use, they explicitly target the increased use of soft transport modes. In particular, by providing bicycle and walking-friendly suggestions for alternatives and weather-aware personalized recommendations, challenges and badges, GoEco!-like persuasive apps could effectively complement the launch of new infrastructural measures aimed at promoting bicycle use and/or support programmes promoting walking and cycling for public health reasons.
The GoEco! experiment provided an example of performing a randomized controlled trial in the field of mobility, showing how current limitations in automatic mobility tracking still affect the practical possibility to develop fully internally and externally valid experiments.
In particular, currently unresolved limitations related to the obtrusiveness of the data collection tool, the need for voluntary enrollment in the experiment, which lead to limited representativeness of the sample of the Zurich region, and the attrition in the experimental sample, suggest to carefully handle these results and indicate the need for further investigations along this line of research. In particular, future works might be aimed at quantitatively investigating if and how the potential behaviour change is affected by initial individual mobility patterns and environmental attitudes.
Given that improved automatic transport mode detection capabilities are available, for future interventions we recommend to enlarge the duration of the tracking periods and discard the initial “onboarding” data, and to offer tangible prizes. Furthermore, we suggest to explore the possibility to partner with already existing companies that offer app-based services requiring their users to enable location tracking. Partnering with them would allow collecting data less affected by volunteer selection bias, for both the treatment and the control group, better meeting the requirements for external validity of the experiment, and might allow the direct integration of strongly ICT-supported mobility concepts such as carpooling or car-sharing. However, such an approach might lead to lower internal validity of the experiment, due to reduced possibilities to guarantee retention over time of the sample of participants, and therefore calls for in-depth investigation in future research.

Author Contributions

Conceptualization, F.C., R.R., M.R.; Methodology, F.C., D.B., F.M.; Formal Analysis, D.B., F.M., J.V.S., F.C.; Writing—Original Draft Preparation, F.C.; Writing—Review & Editing, D.B., F.M., J.V.S.; Supervision, R.R., M.R.

Funding

This research was supported by the Swiss National Science Foundation (SNF) within NRP 71 “Managing energy consumption” and is part of the Swiss Competence Center for Energy Research SCCER Mobility of the Swiss Innovation Agency Innosuisse.

Acknowledgments

We thank all the researchers involved in the GoEco! project who do not figure among the authors of this paper, as well as the supporting institution that helped us throughout the project. We are also very grateful to all the citizens who actively engaged with us in the GoEco! field activities in Zurich and Canton Ticino.

Conflicts of Interest

The authors declare no conflict of interest. The founding sponsors had no role in the design of the study; in the collection, analyses, or interpretation of data; in the writing of the manuscript, and in the decision to publish the results.

References

  1. Miller, H.J. Beyond sharing: Cultivating cooperative transportation systems through geographic information science. J. Transp. Geogr. 2013, 31, 296–308. [Google Scholar] [CrossRef]
  2. Kramers, A. Designing next generation multimodal traveler information systems to support sustainability-oriented decisions. Environ. Model. Softw. 2014, 56, 83–93. [Google Scholar] [CrossRef]
  3. Arnott, B.; Rehackova, L.; Errington, L.; Sniehotta, F.F.; Roberts, J.; Araujo-Soares, V. Efficacy of behavioural interventions for transport behaviour change: Systematic review, meta-analysis and intervention coding. Int. J. Behav. Nutr. Phys. Act. 2014, 11, 133. [Google Scholar] [CrossRef] [PubMed]
  4. Herring, H.; Roy, R. Technological innovation, energy efficient design and the rebound effect. Technovation 2007, 27, 194–203. [Google Scholar] [CrossRef] [Green Version]
  5. Diekstra, R.; Kroon, M. Cars and behaviour: Psychological barriers to car restraint and sustainable urban transport. In The Greening of Urban Transport: Planning for Walking and Cycling in Western Cities; John Wiliy & Sons Ltd.: Hoboken, NJ, USA, 1997. [Google Scholar]
  6. Stopher, P.R. Reducing road congestion: A reality check. Transp. Policy 2004, 11, 117–131. [Google Scholar] [CrossRef]
  7. Steg, L. Car use: Lust and must. Instrumental, symbolic and affective motives for car use. Transp. Res. Part A Policy Pract. 2005, 39, 147–162. [Google Scholar] [CrossRef]
  8. Cairns, S.; Sloman, L.; Newson, C.; Anable, J.; Kirkbride, A.; Goodwin, P. Smarter choices: Assessing the potential to achieve traffic reduction using ‘soft measures’. Transp. Rev. 2008, 28, 593–618. [Google Scholar] [CrossRef]
  9. Bamberg, S.; Fujii, S.; Friman, M.; Gärling, T. Behaviour theory and soft transport policy measures. Transp. Policy 2011, 18, 228–235. [Google Scholar] [CrossRef] [Green Version]
  10. Steg, L.; Tertoolen, G. Sustainable transport policy: The contribution from behavioural scientists. Public Money Manag. 1999, 19, 63–69. [Google Scholar] [CrossRef]
  11. Graham-Rowe, E.; Skippon, S.; Gardner, B.; Abraham, C. Can we reduce car use and, if so, how? A review of available evidence. Transp. Res. Part A Policy Pract. 2011, 45, 401–418. [Google Scholar] [CrossRef]
  12. Chatterjee, K.; Bonsall, P. Editorial for special issue on ‘Evaluation of programmes promoting voluntary change in travel behaviour’. Transp. Policy 2009, 16, 279–280. [Google Scholar] [CrossRef]
  13. Banister, D.; Stead, D. Impact of information and communications technology on transport. Transp. Rev. 2004, 24, 611–632. [Google Scholar] [CrossRef]
  14. Gössling, S. ICT and transport behavior: A conceptual review. Int. J. Sustain. Transp. 2018, 12, 153–164. [Google Scholar] [CrossRef]
  15. Fogg, B. Persuasive Technology: Using Computers to Change What We Think and Do; Interactive Technologies: Cumming, GA, USA, 2002. [Google Scholar]
  16. Jariyasunant, J.; Abou-Zeid, M.; Carrel, A.; Ekambaram, V.; Gaker, D.; Sengupta, R.; Walker, J.L. Quantified traveler: Travel feedback meets the cloud to change behavior. J. Intell. Transp. Syst. 2015, 19, 109–124. [Google Scholar] [CrossRef]
  17. Bothos, E.; Mentzas, G.; Prost, S.; Schrammel, J.; Röderer, K. Watch your Emissions: Persuasive Strategies and Choice Architecture for Sustainable Decisions in Urban Mobility. PsychNol. J. 2014, 12, 107–126. [Google Scholar]
  18. Wells, S.; Kotkanen, H.; Schlafli, M.; Gabrielli, S.; Masthoff, J.; Jylhä, A.; Forbes, P. Towards an Applied Gamification Model for Tracking, Managing, & Encouraging Sustainable Travel Behaviours. ICST Trans. Ambient Syst. 2014, 1, e2. [Google Scholar]
  19. Jylhä, A.; Nurmi, P.; Sirén, M.; Hemminki, S.; Jacucci, G. Matkahupi: A persuasive mobile application for sustainable mobility. In Proceedings of the 2013 ACM Conference on Pervasive and Ubiquitous Computing Adjunct Publication, Zurich, Switzerland, 8–12 September 2013; pp. 227–230. [Google Scholar]
  20. Bie, J.; Bijlsma, M.; Broll, G.; Cao, H.; Hjalmarsson, A.; Hodgson, F.; Holleis, P.; van Houten, Y.; Jacobs, K.; Koolwaaij, J.; et al. Move better with Tripzoom. Int. J. Adv. Life Sci. 2012, 4, 125–135. [Google Scholar]
  21. Froehlich, J.; Dillahunt, T.; Klasnja, P.; Mankoff, J.; Consolvo, S.; Harrison, B.; Landay, J.A. UbiGreen: Investigating a mobile tool for tracking and supporting green transportation habits. In Proceedings of the SIGCHI Conference on Human Factors in Computing Systems, Boston, MA, USA, 4–9 April 2009; pp. 1043–1052. [Google Scholar]
  22. Shaheen, S.; Cohen, A.; Zohdy, I.; Kock, B. Smartphone Applications to Influence Travel Choices: Practices and Policies; Technical Report; U.S. Department of Transportation, Federal Highway Administration: Washington, DC, USA, 2016.
  23. Anagnostopoulou, E.; Bothos, E.; Magoutas, B.; Schrammel, J.; Mentzas, G. Persuasive technologies for sustainable urban mobility. arXiv 2016, arXiv:1604.05957. [Google Scholar]
  24. Sunio, V.; Schmöcker, J.D. Can we promote sustainable travel behavior through mobile apps? Evaluation and review of evidence. Int. J. Sustain. Transp. 2017, 11, 553–566. [Google Scholar] [CrossRef]
  25. Vlahogianni, E.I.; Barmpounakis, E.N. Gamification and sustainable mobility: Challenges and opportunities in a changing transportation landascape. In Low Carbon Mobility for Future Cities: Principles and Applications; Hussein, D., Ed.; Institution of Engineering and Technology: London, UK, 2017; p. 277. [Google Scholar]
  26. Deterding, S.; Sicart, M.; Nacke, L.; O’Hara, K.; Dixon, D. Gamification. Using game-design elements in non-gaming contexts. In Proceedings of the CHI’11 Extended Abstracts on Human Factors in Computing Systems, Vancouver, BC, Canada, 7–12 May 2011; pp. 2425–2428. [Google Scholar]
  27. Weiser, P.; Bucher, D.; Cellina, F.; De Luca, V. A taxonomy of motivational affordances for meaningful gamified and persuasive technologies. In Proceedings of the 3rd International Conference on ICT for Sustainability, ICT4S, Copenhagen, Denmark, 7–9 September 2015. [Google Scholar]
  28. Froehlich, J. Gamifying green: Gamification and Environmental Sustainability. In The Gameful World: Approaches, Issues, Applications; Walz, S.P., Deterding, S., Eds.; MIT Press: Cambridge, MA, USA, 2015. [Google Scholar]
  29. Möser, G.; Bamberg, S. The effectiveness of soft transport policy measures: A critical assessment and meta-analysis of empirical evidence. J. Environ. Psychol. 2008, 28, 10–26. [Google Scholar] [CrossRef]
  30. Michie, S.; Prestwich, A. Are interventions theory-based? Development of a theory coding scheme. Health Psychol. 2010, 29, 1–8. [Google Scholar] [CrossRef] [PubMed]
  31. Bonsall, P. Do we know whether personal travel planning really works? Transp. Policy 2009, 16, 306–314. [Google Scholar] [CrossRef]
  32. Hamari, J.; Koivisto, J.; Sarsa, H. Does gamification work?—A literature review of empirical studies on gamification. In Proceedings of the 2014 47th Hawaii International Conference on System Sciences (HICSS), Waikoloa, HI, USA, 6–9 January 2014; pp. 3025–3034. [Google Scholar]
  33. Prochaska, J.O.; Velicer, W.F. The transtheoretical model of health behavior change. Am. J. Health Promot. 1997, 12, 38–48. [Google Scholar] [CrossRef] [PubMed]
  34. Cellina, F.; Bucher, D.; Veiga Simão, J.; Rudel, R.; Raubal, M. Beyond Limitations of Current Behaviour Change Apps for Sustainable Mobility: Insights from a User-Centered Design and Evaluation Process. Sustainability 2019, 11, 2281. [Google Scholar] [CrossRef]
  35. Bucher, D.; Cellina, F.; Mangili, F.; Raubal, M.; Rudel, R.; Rizzoli, A.E.; Elabed, O. Exploiting fitness apps for sustainable mobility-challenges deploying the GoEco! app. In ICT for Sustainability (ICT4S); Atlantis Press: Paris, France, 2016. [Google Scholar]
  36. Bucher, D.; Mangili, F.; Cellina, F.; Bonesana, C.; Jonietz, D.; Raubal, M. From location tracking to personalized eco-feedback: A framework for geographic information collection, processing and visualization to promote sustainable mobility behaviors. Travel Behav. Soc. 2019, 14, 43–56. [Google Scholar] [CrossRef]
  37. Tuchschmid, M.; Halder, M.; Bauer, C. mobitool–Grundlagenbericht. In Hintergrund, Methodik & Emissionsfaktoren; Schweizerische Bundesbahnen (SBB): Bern, Switzerland; Swisscom: Bern, Switzerland; BKW, öbu: Bern, Switzerland, 2010. [Google Scholar]
  38. Jonietz, D.; Bucher, D. Continuous trajectory pattern mining for mobility behaviour change detection. In LBS 2018: 14th International Conference on Location Based Services; Springer: Cham, Switzerland, 2018; pp. 211–230. [Google Scholar]
  39. Deci, E.L. Effects of externally mediated rewards on intrinsic motivation. J. Personal. Soc. Psychol. 1971, 18, 105–115. [Google Scholar] [CrossRef]
  40. Hills, D.; Junge, K. Guidance for Transport Impact Evaluations. Choosing an Evaluation Approach to Achieve Better Attribution. Tavistock Institute & Aecom. Prepared for Department for Transport, London. Technical Report. 2010. Available online: http://www.tavinstitute.org/projects/report-new-guidance-for-evaluation-in-the-transport-sector (accessed on 22 May 2018).
  41. Vine, E.; Sullivan, M.; Lutzenhiser, L.; Blumstein, C.; Miller, B. Experimentation and the evaluation of energy efficiency programs. Energy Effic. 2014, 7, 627–640. [Google Scholar] [CrossRef]
  42. Frederiks, E.R.; Stenner, K.; Hobman, E.V.; Fischle, M. Evaluating energy behavior change programs using randomized controlled trials: Best practice guidelines for policymakers. Energy Res. Soc. Sci. 2016, 22, 147–164. [Google Scholar] [CrossRef] [Green Version]
  43. SMTC. Distance Journaliere, Temps de Trajet Journalier et Nombre D’etapes Selon la Classe de Moyen De Transport et le Motif—Suisse. 2015. Available online: https://www.bfs.admin.ch/bfs/fr/home/statistiques/mobilite-transports/transport-personnes/comportements-transports/tableaux-2015.assetdetail.2004984.html (accessed on 30 April 2018).
  44. The Nielsen Company. The Mobile Consumer: A Global Snapshot. 2013. Available online: http://www.nielsen.com/content/dam/corporate/us/en/reports-downloads/2013%20Reports/Mobile-Consumer-Report-2013.pdf (accessed on 22 May 2018).
  45. Kazdin, A.E. Unobtrusive measures in behavioral assessment. J. Appl. Behav. Anal. 1979, 12, 713–724. [Google Scholar] [CrossRef] [Green Version]
  46. Webb, E.J.; Campbell, D.T.; Schwartz, R.D.; Sechrest, L. Unobtrusive Measures; Sage Publications: Saunders Oaks, CA, USA, 1999; Volume 2. [Google Scholar]
  47. King, M.F.; Bruner, G.C. Social desirability bias: A neglected aspect of validity testing. Psychol. Mark. 2000, 17, 79–103. [Google Scholar] [CrossRef]
  48. Zizzo, D.J. Experimenter demand effects in economic experiments. Exp. Econ. 2010, 13, 75–98. [Google Scholar] [CrossRef]
  49. Nichols, A.L.; Maner, J.K. The good-subject effect: Investigating participant demand characteristics. J. Gen. Psychol. 2008, 135, 151–166. [Google Scholar] [CrossRef]
  50. Adair, J.G. The Hawthorne effect: A reconsideration of the methodological artifact. J. Appl. Psychol. 1984, 69, 334–345. [Google Scholar] [CrossRef]
  51. Tiefenbeck, V. On the magnitude and persistence of the Hawthorne effect—Evidence from four field studies. In Proceedings of the 4th European Conference on Behaviour and Energy Efficiency, Coimbra, Portugal, 8–9 September 2016; pp. 8–9. [Google Scholar]
  52. Donaldson, S.I.; Grant-Vallone, E.J. Understanding self-report bias in organizational behavior research. J. Bus. Psychol. 2002, 17, 245–260. [Google Scholar] [CrossRef]
  53. Allcott, H.; Mullainathan, S. Behavior and energy policy. Science 2010, 327, 1204–1205. [Google Scholar] [CrossRef]
  54. Harding, C.; Srikukenthiran, S.; Zhang, Z.; Nurul Habib, K.; Miller, E. On the user experience and performance of smartphone apps as personalized travel survey instruments: Results from an experiment in Toronto. In Proceedings of the 11th International Conference on Transport Survey Methods (ISCTSC), Estrel, QC, Canada, 24–29 September 2017. [Google Scholar]
  55. Huang, H.; Gartner, G.; Krisp, J.M.; Raubal, M.; Van de Weghe, N. Location based services: Ongoing evolution and research agenda. J. Locat. Based Serv. 2018, 12, 63–93. [Google Scholar] [CrossRef]
  56. Anagnostopoulou, E.; Bothos, E.; Magoutas, B.; Schrammel, J.; Mentzas, G. Persuasive technologies for sustainable mobility: State of the art and emerging trends. Sustainability 2018, 10, 2128. [Google Scholar] [CrossRef]
  57. Stopher, P.; Clifford, E.; Swann, N.; Zhang, Y. Evaluating voluntary travel behaviour change: Suggested guidelines and case studies. Transp. Policy 2009, 16, 315–324. [Google Scholar] [CrossRef]
  58. Guerrouj, L.; Azad, S.; Rigby, P.C. The influence of app churn on app success and stackoverflow discussions. In Proceedings of the 2015 IEEE 22nd International Conference on Software Analysis, Evolution and Reengineering (SANER), Montreal, QC, Canada, 2–6 March 2015; pp. 321–330. [Google Scholar]
  59. Hartman, R.S. Self-selection bias in the evolution of voluntary energy conservation programs. Rev. Econ. Stat. 1988, 70, 448–458. [Google Scholar] [CrossRef]
  60. Tiefenbeck, V.; Wörner, A.; Schöb, S.; Fleisch, E.; Staake, T. Real-time feedback promotes energy conservation in the absence of volunteer selection bias and monetary incentives. Nat. Energy 2019, 4, 35–41. [Google Scholar] [CrossRef]
  61. Anable, J.; Lane, B.; Kelay, T. An Evidence Base Review of Public Attitudes to Climate Change and Transport Behaviour; The Department: London, UK, 2006. [Google Scholar]
  62. Jittrapirom, P.; Caiati, V.; Feneri, A.M.; Ebrahimigharehbaghi, S.; Alonso-González, M.J.; Narayan, J. Mobility as a Service: A Critical Review of Definitions, Assessments of Schemes, and Key Challenges. Urban Plan. 2017, 2, 13–25. [Google Scholar] [CrossRef]
Figure 1. A selection of screenshots of the GoEco! app: (a) List of tracked routes; (b) Validation of the transport mode; (c) Goal setting; (d) Weekly summary of mobility patterns and progress towards goal achievement; (e) Hall of fame and leaderboard. Screenshots (a,b) are also offered by the GoEco! Tracker app.
Sustainability 11 02674 g001
Figure 2. Timeline of the GoEco! experiment, showing the three tracking periods and the final questionnaire and interviews. All activities are performed in parallel in Ticino and Zurich.
Sustainability 11 02674 g002
Figure 3. Comparison between GoEco! (n = 52, 24 mobility tracking weeks overall), based on data provided by [56].
Sustainability 11 02674 g003
Figure 4. Baseline mobility patterns of the n = 52 active GoEco! participants, against average mobility patterns of the population in Zurich and Ticino, as indicated by the 2015 Swiss Mobility and Transport Census data.
Sustainability 11 02674 g004
Table 1. Features and components of the persuasive app GoEco!, with respect to stages and processes of change identified by the Transtheoretical model [33].
Stages of ChangeProcesses of ChangeGoEco! Components/Features
Pre-contemplationConsciousness raising
Increase awareness for causes, consequences and cues about a behavior
Feedback on each travelled route
Baseline mobility patterns
ContemplationSelf-reevaluation
Cognitive and affective assessment of one’s self-image, with and without a particularly unhealthy habit
Alternatives for systematic routes
Overall potentials for change
PreparationSelf-liberation
The belief that one can change and commitment to act on such a belief
Goal setting
Counterconditioning
Learning of more sustainable behaviours, that can substitute the less sustainable ones
Challenges
Weekly report
Action and MaintenanceContingency management
Provide consequences (rewards) for taking steps in a particular direction
Trophies and Badges
Leaderboard/Hall of Fame
Helping relationship
Social support (care, trust, openness, acceptance and general support) for new behaviour
Notification system to stimulate action maintenance
In-person events outside the app
Table 2. Test of hypothesis H1: effect of GoEco! on the treatment groups (nTicino = 21, nZurich = 13).
CO 2 Emissions per kmEnergy Consumption per km
p-valuesTicino0.120.12
(one side Wilcoxon signed-rank test)Zurich0.190.19
Average difference between periodsTicino−12.03 gCO 2 /km−0.05 kWh/km
C and A ( X C X A )Zurich5.96 gCO 2 /km0.02 kWh/km
* sig. at 0.05 level (this condition is never met in the above table).
Table 3. Test of hypothesis H2: effect of GoEco! on systematic loops of the treatment group members (nTicino = 15, nZurich = 14).
CO 2 Emissions per kmEnergy Consumption per km
p-valuesTicino0.023 *0.018 *
(one side Wilcoxon signed-rank test)Zurich0.3420.458
Average difference between periodsTicino−23.931 * gCO 2 /km−0.107 * kWh/km
C and A ( X C X A )Zurich−7.776 gCO 2 /km−0.047 kWh/km
* sig. at 0.05 level.
Table 4. Test of hypothesis H2: differences between effects on the treatment and control groups, considering only systematic loops (nTicino = 22, nZurich= 23).
CO 2 Emissions per kmEnergy Consumption per km
p valuesTicino0.049 *0.036 *
(one side Wilcoxon rank sum test)Zurich0.1570.264
Difference between treatment and control groupTicino−33.137 * gCO 2 /km−0.136 * kWh/km
( X C X A )Treatment− ( X C X A )Control Zurich−1.439 gCO 2 /km−0.036 kWh/km
* sig. at 0.05 level.
Table 5. Pro-environmental attitude of the active GoEco! participants, based on the final questionnaire (48 respondents out of 52 active participants). A 7-point Likert score is used, where 1 = “Totally disagree” and 7 = “Totally agree”.
Ticino (n = 29)Zurich (n = 19)
M (SD)M (SD)
Climate change is a problem for society6.59 (.87)6.32 (.82)
Saving energy helps to limit climate change6.31(.97)5.90 (1.20)
The quality of our environment will improve if we use less energy6.41 (.98)6.32 (.82)
I feel responsible for pollution and climate change: it is not just a matter of governments and industries5.72 (1.64)5.47 (1.12)
I try to use the car as little as possible5.59 (1.32)5.16 (1.34)

