Article

Muddied Waters: Perceptions and Attitudes towards Mangroves and Their Removal in New Zealand

by
Amrit Melissa Dencer-Brown
1,
Andrea C. Alfaro
1,* and
Simon Milne
2
1
School of Science, Institute for Applied Ecology, Auckland University of Technology, Auckland 1010, New Zealand
2
New Zealand Tourism Research Institute, Auckland University of Technology, Auckland 1142, New Zealand
*
Author to whom correspondence should be addressed.
Sustainability 2019, 11(9), 2631; https://doi.org/10.3390/su11092631
Submission received: 10 February 2019 / Revised: 4 April 2019 / Accepted: 28 April 2019 / Published: 7 May 2019
(This article belongs to the Section Environmental Sustainability and Applications)

Abstract

:
Seaward expansion of New Zealand’s mangrove Avicennia marina (subsp.) australasica in estuaries has led to disparity in opinion over their social-ecological value. This study investigated existing stakeholders and interested parties’ perceptions and attitudes towards mangroves, focusing on four sites in Auckland. A mixed methods design was used consisting of semi-structured interviews, ratings of importance of mangrove ecosystem services and issues and Q-sorts on mangrove social-ecological statements. 29 participants were interviewed in person. Results revealed a disparity in perceptions and attitudes towards mangroves. Community Groups displayed strongly negative opinions towards mangrove preservation and Conservation Organisations expressed a strongly positive stance. The occupation of participants was a significant factor in the ratings. Overall, sediment and nutrient retention were rated as the most important ecosystem services. The desire for reversion of estuaries to a “pre-mangrove” state is the greatest issue affecting mangroves. Q-analysis revealed loading of participants onto two factors representing (1) a pro-preservation attitude towards mangrove and (2) a neutral view. Managing sediment loads and nutrient run-off in the wider catchment were highlighted as ways to reduce mangrove expansion. Improving water quality and the health of the harbour was of utmost priority to kaitiaki (Māori guardians of the environment). This study provides critical insights into the management of mangroves as social-ecological systems.

1. Introduction

Mangroves are salt-tolerant trees or shrubs, which grow in the intertidal zones between land and sea. They are situated between 32° N and 38° S, predominantly in the tropics and sub-tropics [1].
Globally, there has been a reduction in mangrove area, mainly due to the conversion of this ecosystem for agriculture or aquaculture [2]. New Zealand has some of the world’s most southerly mangroves, with the grey mangrove Avicennia marina (subsp.) australasica existing here for at least 11,000 years [3]. Seaward expansion of this species into estuaries exacerbated by high sediment loads from land-use change (through anthropogenic practices such as farming and industrialisation) has altered the ecology of coastal areas [4,5,6]. Mangrove preservation and removal in New Zealand is a contentious issue. Previously, this temperate forest and shrub ecosystem was thought to possess the ecological values of tropical and subtropical mangroves, with a predominantly conservation-based approach to their management [7,8]. However, viewpoints towards mangroves in New Zealand have shifted over time. In the past twenty years, attitudes towards mangroves in New Zealand have become polarized, with applications for resource consents (official permission to conduct operations which have an environmental impact) to remove expanded areas of mangroves [9,10].
Much of the drive for removal comes from local community groups wanting restoration of open-water areas for access and views, with a return to a pre-urbanised coastal setting [9]. However, community aspirations may be unrealistic in certain areas due to reduced tidal flushing and ongoing urbanisation, which creates more sediment loading and nutrient run-off into estuaries [8]. Whilst mangroves are recognised as being part of New Zealand’s indigenous flora, and therefore protected under the Resource Management Act (RMA) 1991 [10], they may be removed in particular areas for a range of social and ecological reasons. Each regional council where mangroves are present has their own policies on removal. The Auckland Council Unitary Plan (2013) F2 coastal-General Coastal Marine Zone states that mangrove seedlings may be removed from Significant Ecological Areas- Marine (SEA-M1) where: “mangroves are a minor component, or absent”, or specific “wading bird areas”. Removal of mangroves is also permitted in “significant wading bird areas” and to “enable the operation, maintenance, use and functioning of existing lawful structures, infrastructure, or to ensure public health and safety in the use or operation of infrastructure” and to allow the maintenance or enhancement of ecological areas or public access [11]. Large-scale removal of mangroves (particularly with mechanical machinery) can cause macroalgal blooms and reduced oxygen levels in both the sediment and water, impacting negatively on benthic communities and indirectly on wading birds [12]. The management of New Zealand’s mangroves has received much attention in the past few years due to the increase in applications for removal. An in-depth review of socio-cultural, economic and environmental studies pertaining to New Zealand’s mangroves is provided in a recent review paper [13].
With applications for removal continuing, there is a need to understand the drivers for removal and how perceptions and attitudes can influence alterations of the coastal landscape. A perception may be seen as how humans organise and interpret sensory information in order to produce a meaningful experience of the world in which we live [14], whereas an attitude involves a deeper behavioural insight, defined as “a mind-set or a tendency to act in a particular way due to both an individual’s experience and temperament” [15]. These are closely linked and can mutually influence each other [16].
To investigate and understand how the expansion of mangroves affects aspects of society and culture in Aotearoa New Zealand, it was deemed important to speak with Māori stakeholders and interested parties. A strong element of Māori culture is based on caring for the environment. Guardianship or kaitiakitanga of marine and freshwater environments is a priority for Māori [14]. In particular, listening to the views of kaitiaki (Māori guardians of the environment) through mātauranga Māori (Māori knowledge and knowing) is imperative to understand the cultural significance of estuarine ecosystems in New Zealand [17].
Whilst there has been a substantial body of work on the ecology of New Zealand mangroves, there are still gaps in our knowledge of this ecosystem. In addition, little work has been carried out on the socio-cultural value of mangroves [13]. Due to the complexity in addressing mangrove management in New Zealand, a mixed methods approach was adopted to provide deep insight from multiple angles. One type of data collection and analysis alone would not allow for the complexity of this social-ecological system and its issues to be fully realized. The use of mixed methods in social-ecology is becoming more widespread as we understand the holistic nature of human-environment interactions [18,19,20].
This study employed the metaparadigm of dialectical pluralism, defined as “an operative process, which is both dialectical and dialogical with the acceptance and expectancy of difference in virtually every realm of inquiry, including reality” [21]. Dialectical pluralism centralizes diversity of both physical and human reality [22], as this study is around a complex social-ecological system, this axiology was deemed the best fit.
Q-methodology was used as part of this study to explore differences in participant’s perceptions and attitudes towards mangroves and their removal. Q is used in a variety of fields ranging from social sciences [23] through to health sciences [24]. It is an inductive and exploratory analysis, which can reveal holistic and detailed information about participant’s perspectives [25]. Q-methodology is used to study subjectivity, it can reveal perspectives towards particular issues, which is particularly useful in understanding the opinions of stakeholders [24]. It was hoped that by employing Q-Methodology, areas of distinct polarity and disagreement between stakeholders and interested parties with regards to mangrove preservation and removal would be identified.
In addition to Q-methodology, two points-based scales [26] were constructed for the rating of mangrove ecosystem services and issues facing mangroves. Rating scales are one of the most commonly used methods to measure attitudes towards statements around a topic [27], and the extent to which participants feel they are important/agree with them [28].
Aim: To investigate the perceptions and attitudes of existing stakeholders and interested parties towards mangrove ecosystems in New Zealand
Objectives:
  • To interview previous consultees from resource consents for removal of areas of mangrove in the Manukau Harbour, Auckland
  • To explore perceptions and attitudes towards preservation and removal of mangroves in New Zealand and specifically at four removal sites in the Manukau Harbour, Auckland
  • To investigate whether demographics such as occupation, age and gender influence responses to the ratings of mangrove ecosystem services and issues facing mangroves
As part of this research, an ethics application was submitted to the ethics committee at the researchers’ University and accepted prior to interviews taking place. This ethics application included interviews with kaitiaki for whom a project kaupapa (principle) was written.

2. Materials and Methods

2.1. Semi-Structured Interviews

Potential participants were identified from Auckland Council resource consents for mangrove removal at four sites in the Manukau Harbour, Auckland (Figure 1). These participants had already been contacted and involved in consultation processes as required before the granting of a resource consent for mangrove removal as a permitted discretionary activity [10]. The consent records are publicly available to view as hard copies at Auckland Council Offices (Graham St, Auckland, New Zealand).
Fifty potential participants were identified from the four sites and contacted by email with an invitation to interview. 29 participants were interviewed in person. Upon acceptance, an information sheet was provided documenting the background to the study and a confidentiality agreement drawn up for each participant who accepted the invitation to interview. Face-to-face individual semi-structured interviews were held at either the offices of the primary researcher or at the work places and homes of the participants. Interviews lasted between twenty minutes and one hour, depending on the participant’s level of engagement. The participant’s occupation was listed according to their occupation at the time of mangrove removal, as follows: AC = Auckland council representative, CG = Community Group member, CO = Conservation Organisation member, LB = Local board member, K = Kaitiaki, PR = Park Ranger, IE = Independent ecologist and IP = Independent planner. The views of the participants were their own individual opinions and did not necessarily represent those of their organisations. (The opinions of the individuals are personal perceptions and attitudes and any statements pertaining to scientific information was seen as the individual’s perceived knowledge). The interviews consisted of questions on five broad themes related to temperate mangroves in New Zealand:
  • Presence of mangroves
  • Importance of mangroves
  • Expansion of mangroves
  • Current and future consultation process
  • Mangrove management
Questions related to each theme can be found in Appendix A. Demographic information of age group, ethnicity, gender, occupation, place of residence and years at residence were also recorded.

2.1.1. Māori Participants

As this research involved both the land and water of Aotearoa, it was vital to speak with kaitiaki around the issues of mangrove removal. The kaupapa (principle) of the research was provided to all kaitiaki. The interviews were either carried out kanohi-ki-te-kanohi (face-to-face) (two interviews) following a series of hui (meetings) or on the phone (three interviews) following acceptance of interview by email, with signed consent forms delivered electronically in the case of telephone interviews. The interviews consisted of open-ended questions, focusing on the importance of mangroves in New Zealand and at the specific sites. It was the intention of the primary researcher to ask questions around the past and present state of coastal ecosystems including water quality issues, taonga species (native flora and fauna of special culture significance), taiao (natural world) and hauora (well-being) in reference to mangroves (mānawa) and the wider coastal environment.

2.1.2. Scale-Data

Ecosystem services or attributes of mangroves in New Zealand were rated by the participants as being ‘very important’, ‘important’, ‘neither’, ‘not important’ or ‘don’t know’. Issues affecting mangroves at the sites were also rated in this way. Ratings were assigned numbers from 4 to 1 (with very important rated 4, in descending order to not important, rated as 1). ‘Don’t know’ was a necessary addition to the 4-point scale as this highlights gaps in knowledge that participants may have towards ecosystem services of temperate mangroves and potential issues facing them. This design was unbalanced, with a skew towards the ‘important’ ratings. Unbalanced designs can be used when the researcher has an indication that respondents may show a preference to one end of the scale [29]. Extensive research from resource consent applications of the participants consulted indicated that of those who accepted interview, only a minority were staunch opposers of mangrove preservation. Results were converted to scores ranging from 4–1 (with any ‘don’t know’ data removed from the calculations) and averaged for each ecosystem service and issue to investigate which services and issues were rated as most important. ‘Don’t know’ data were viewed separately to ascertain which services and issues were least known about. Table 1 shows the two scale ratings for mangrove ecosystem services (a) and (b) issues facing mangroves.

2.2. Q-Sort

After the first set of interviews was conducted (n = 10), a Q-sort [25] was conducted around perceptions and attitudes towards mangrove removal based on these interviews and comments recorded from the resource consents. These were gathered from a wider concourse of information to form a set of 33 statements (16 ecological and 17 social-related) around perceptions and attitudes towards mangroves and removal. In Q-methodology, participants are seen as the variables and so a large sample size is not required [25,30]. The remainder of participants from the semi-structured interviews (n = 18), known as the P-set, carried out the sorting of statements. Table 2a shows the ecological statements and Table 2b the social statements constructed.
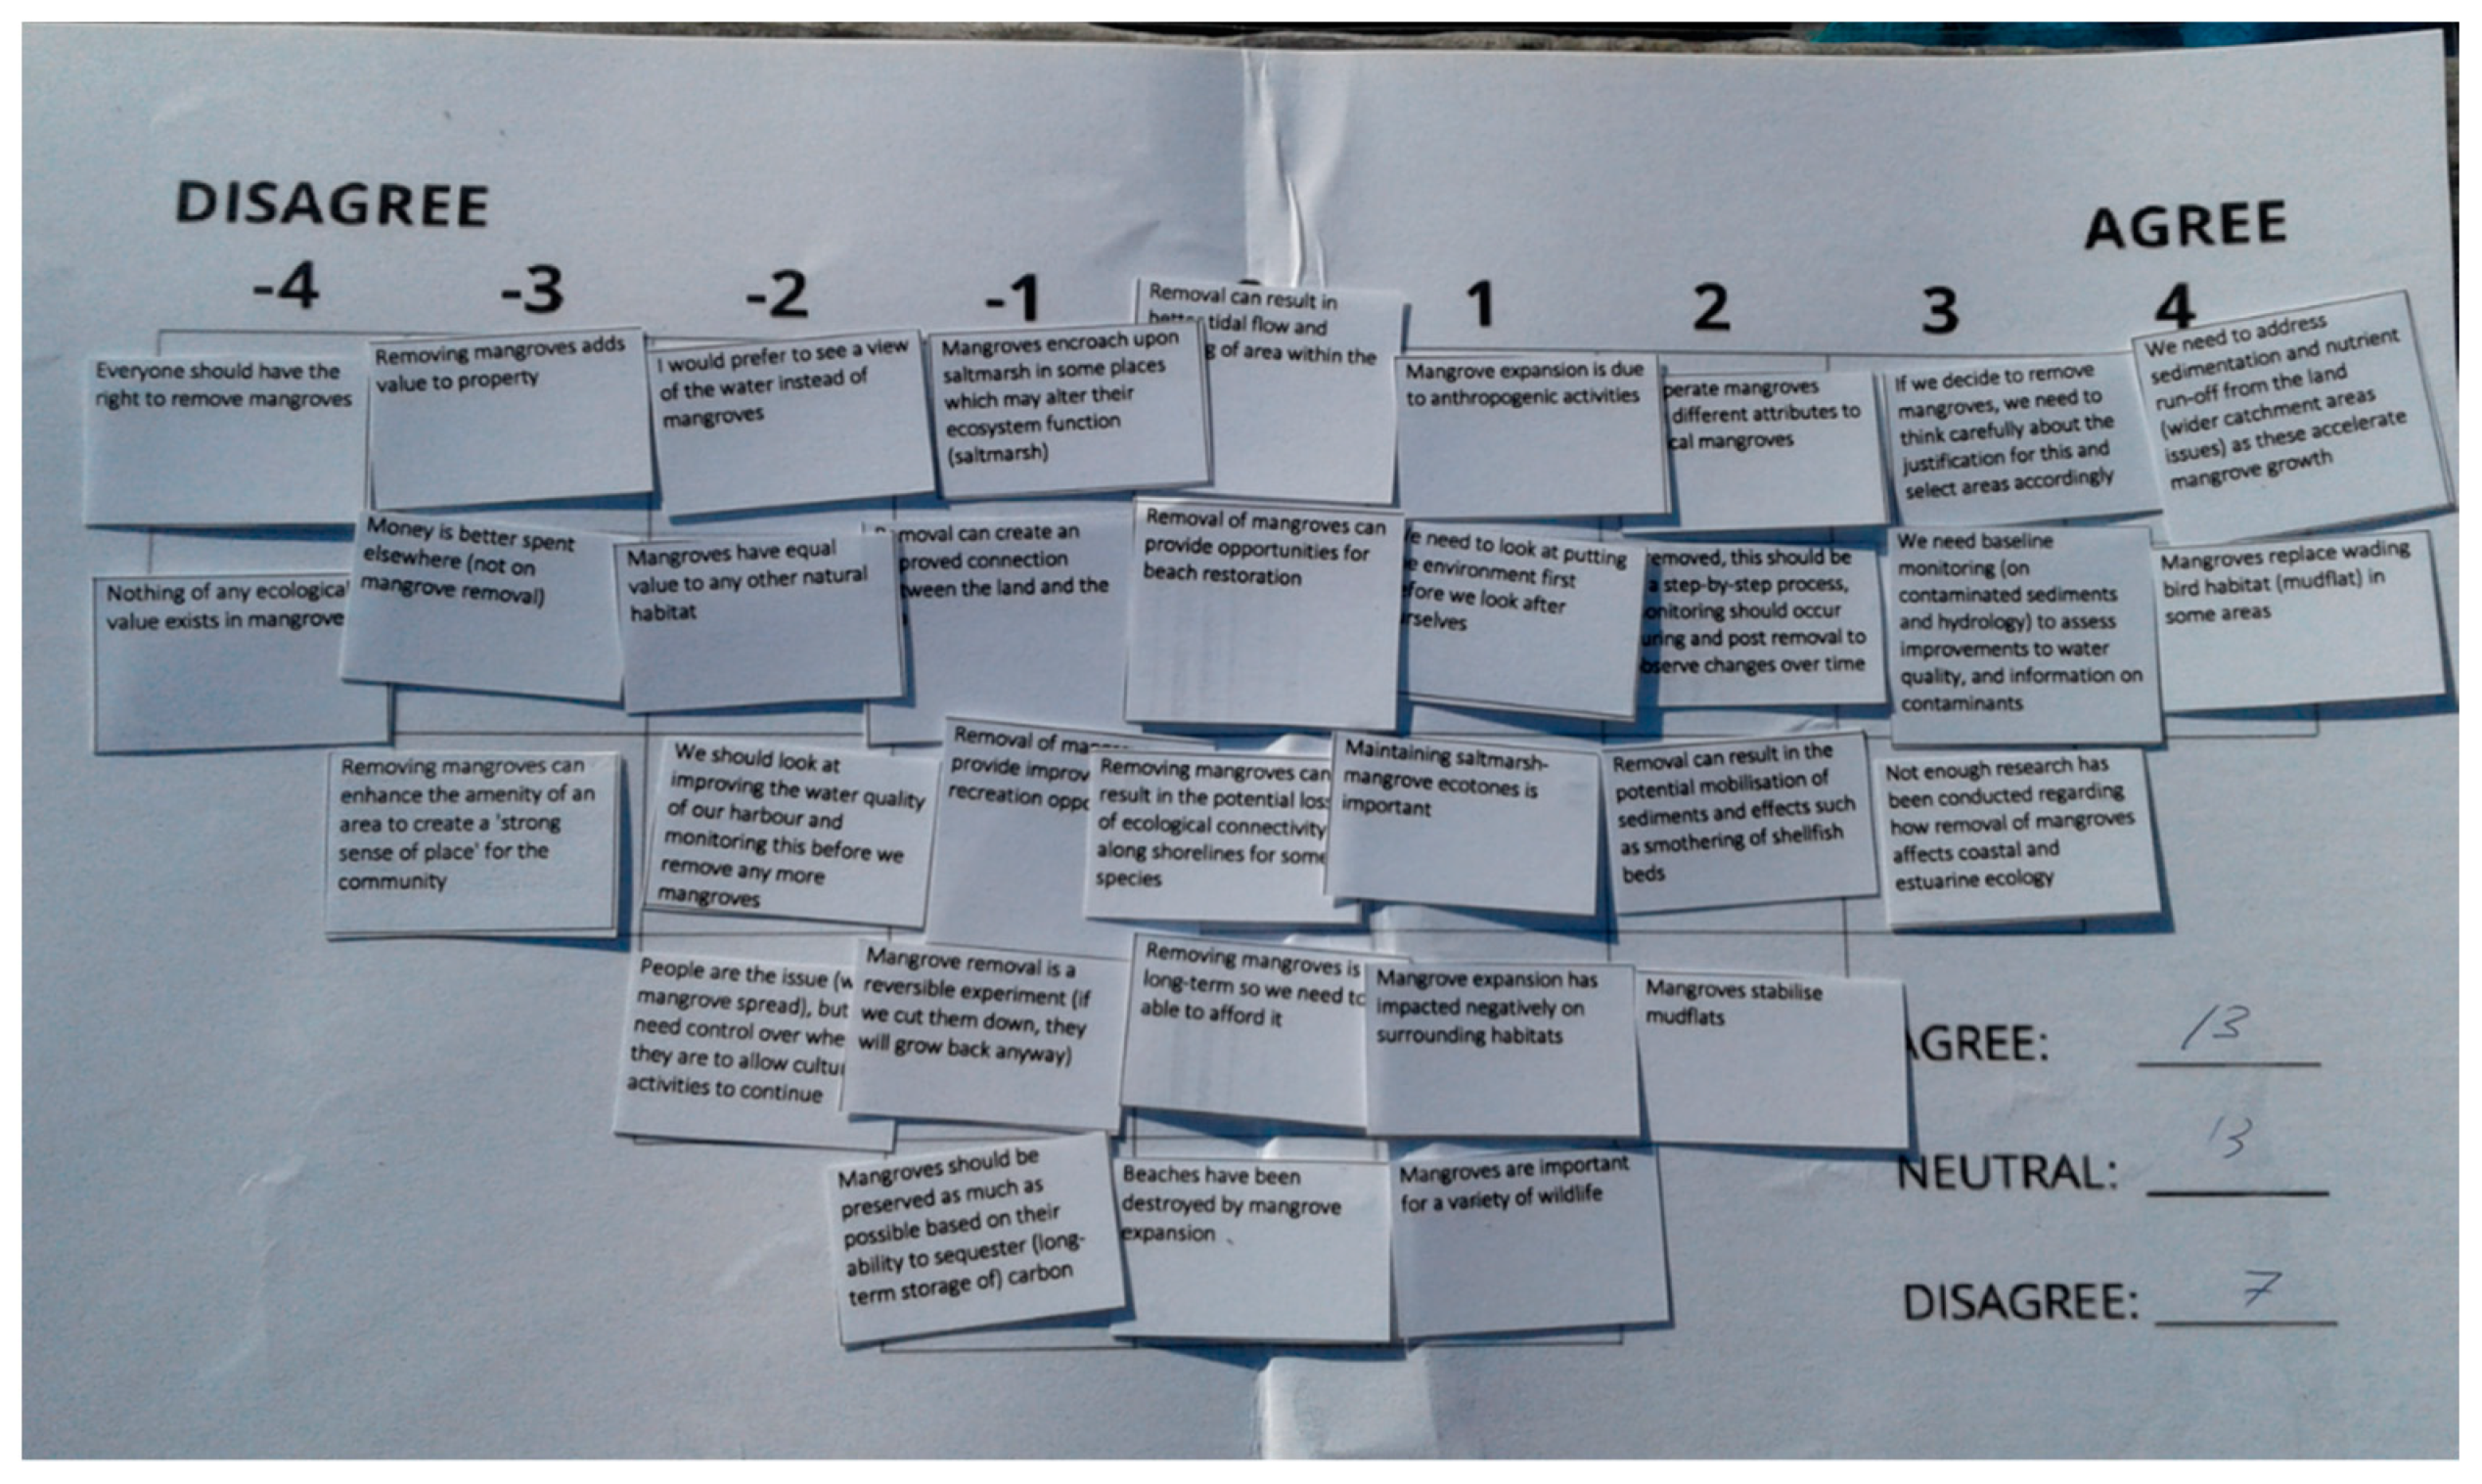
The 18 participants were given the Q-Sort at the beginning of the interview. Participants ranked the statements into three categories: ‘agree’, ‘disagree’ and ‘neutral’. They then placed the statements on the Q-grid (Figure 2), which is divided into 33 squares ranging from −4 (statements disagreed with the most) to +4 (statements agreed with the most), with 0 as neutral opinion towards the statement. A photo was taken for each participant’s Q-sort and the data was entered into Q statistical software PQ Method [31] for analysis.
PQ Method carries out factor analyses on the data, through the correlation matrix, which was manually entered for each participant. The results display the similarities of how participants sorted the statements [32]. Participants with similar ranking of statements were loaded onto the same factor. Principal Component Analysis (PCA) with Varimax rotation was used. This allowed the researchers to reduce any subjectivity they may have had [33].

2.3. Statistical Analyses

2.3.1. Transcripts

Transcripts were typed out from the audio files by the primary researcher and sent back to each participant for member checking. Upon acceptance of the final transcript, the documents were uploaded into NVivo 12 software and coded thematically [34]. Thematic analysis can be used to examine similarities and differences in the perspectives of participants [34]. Inductive coding was used to both condense the raw data into summary findings and to link research objectives and findings [35]. After initial coding was completed, with a coding framework to define each code, themes and subthemes emerged from the data, which were defined and named [36]. Qualitative data was analysed further using the Queries and Classifications procedures in NVivo [37] in order to look for patterns in responses associated with different demographics (age, gender, occupation). All names were removed following the final coding. Transcripts from kaitiaki were reflexively read and were included in NVivo coding and integrated into themes and sub-themes.

2.3.2. Ecosystem Services and Issues Facing Mangroves

Scale-data was analysed through multivariate techniques using Primer-E (Plymouth Routines in Multivariate Ecological Research) software [38] to enable a deeper investigation into the factors driving differences in perceptions and attitudes towards mangroves.
PERMANOVA+ (Permutational analyses of variance) was used to analyse differences in participant responses to the rating of mangrove ecosystem services and issues facing mangroves in New Zealand. PERMANOVA is a semi-parametric statistical technique which separates data through geometric partitioning of variation across multivariate data, in response to factors in an ANOVA design [39]. PERMANOVA is becoming more frequently used in social science data analyses and allows for robust quantitative analyses of multivariate response data [39].
The effect of occupation on response data for both ecosystem services and issues was investigated in the PERMANOVA design of “Occupation” as a fixed factor in an unordered design was tested. Age and gender were also tested as factors driving differences in responses of participants towards ecosystem services and issues and interactions between “Occupation” with “Age”, “Occupation” with “Gender” and “Age” with “Gender” were tested for (age and gender as fixed factors). Response data was square-root transformed to down weight the effect of high responses and a resemblance matrix based on Bray–Curtis index of similarity was created. Non-metric multidimensional scaling (MDS) [38] was conducted to represent and visualize the position of responses with significant independent variables in multidimensional space. SIMPER (one-way similarity percentage) analyses were conducted to see which ecosystem services and issues drove dissimilarities and within and between groups [40].

3. Results

3.1. Semi-Structured Interviews

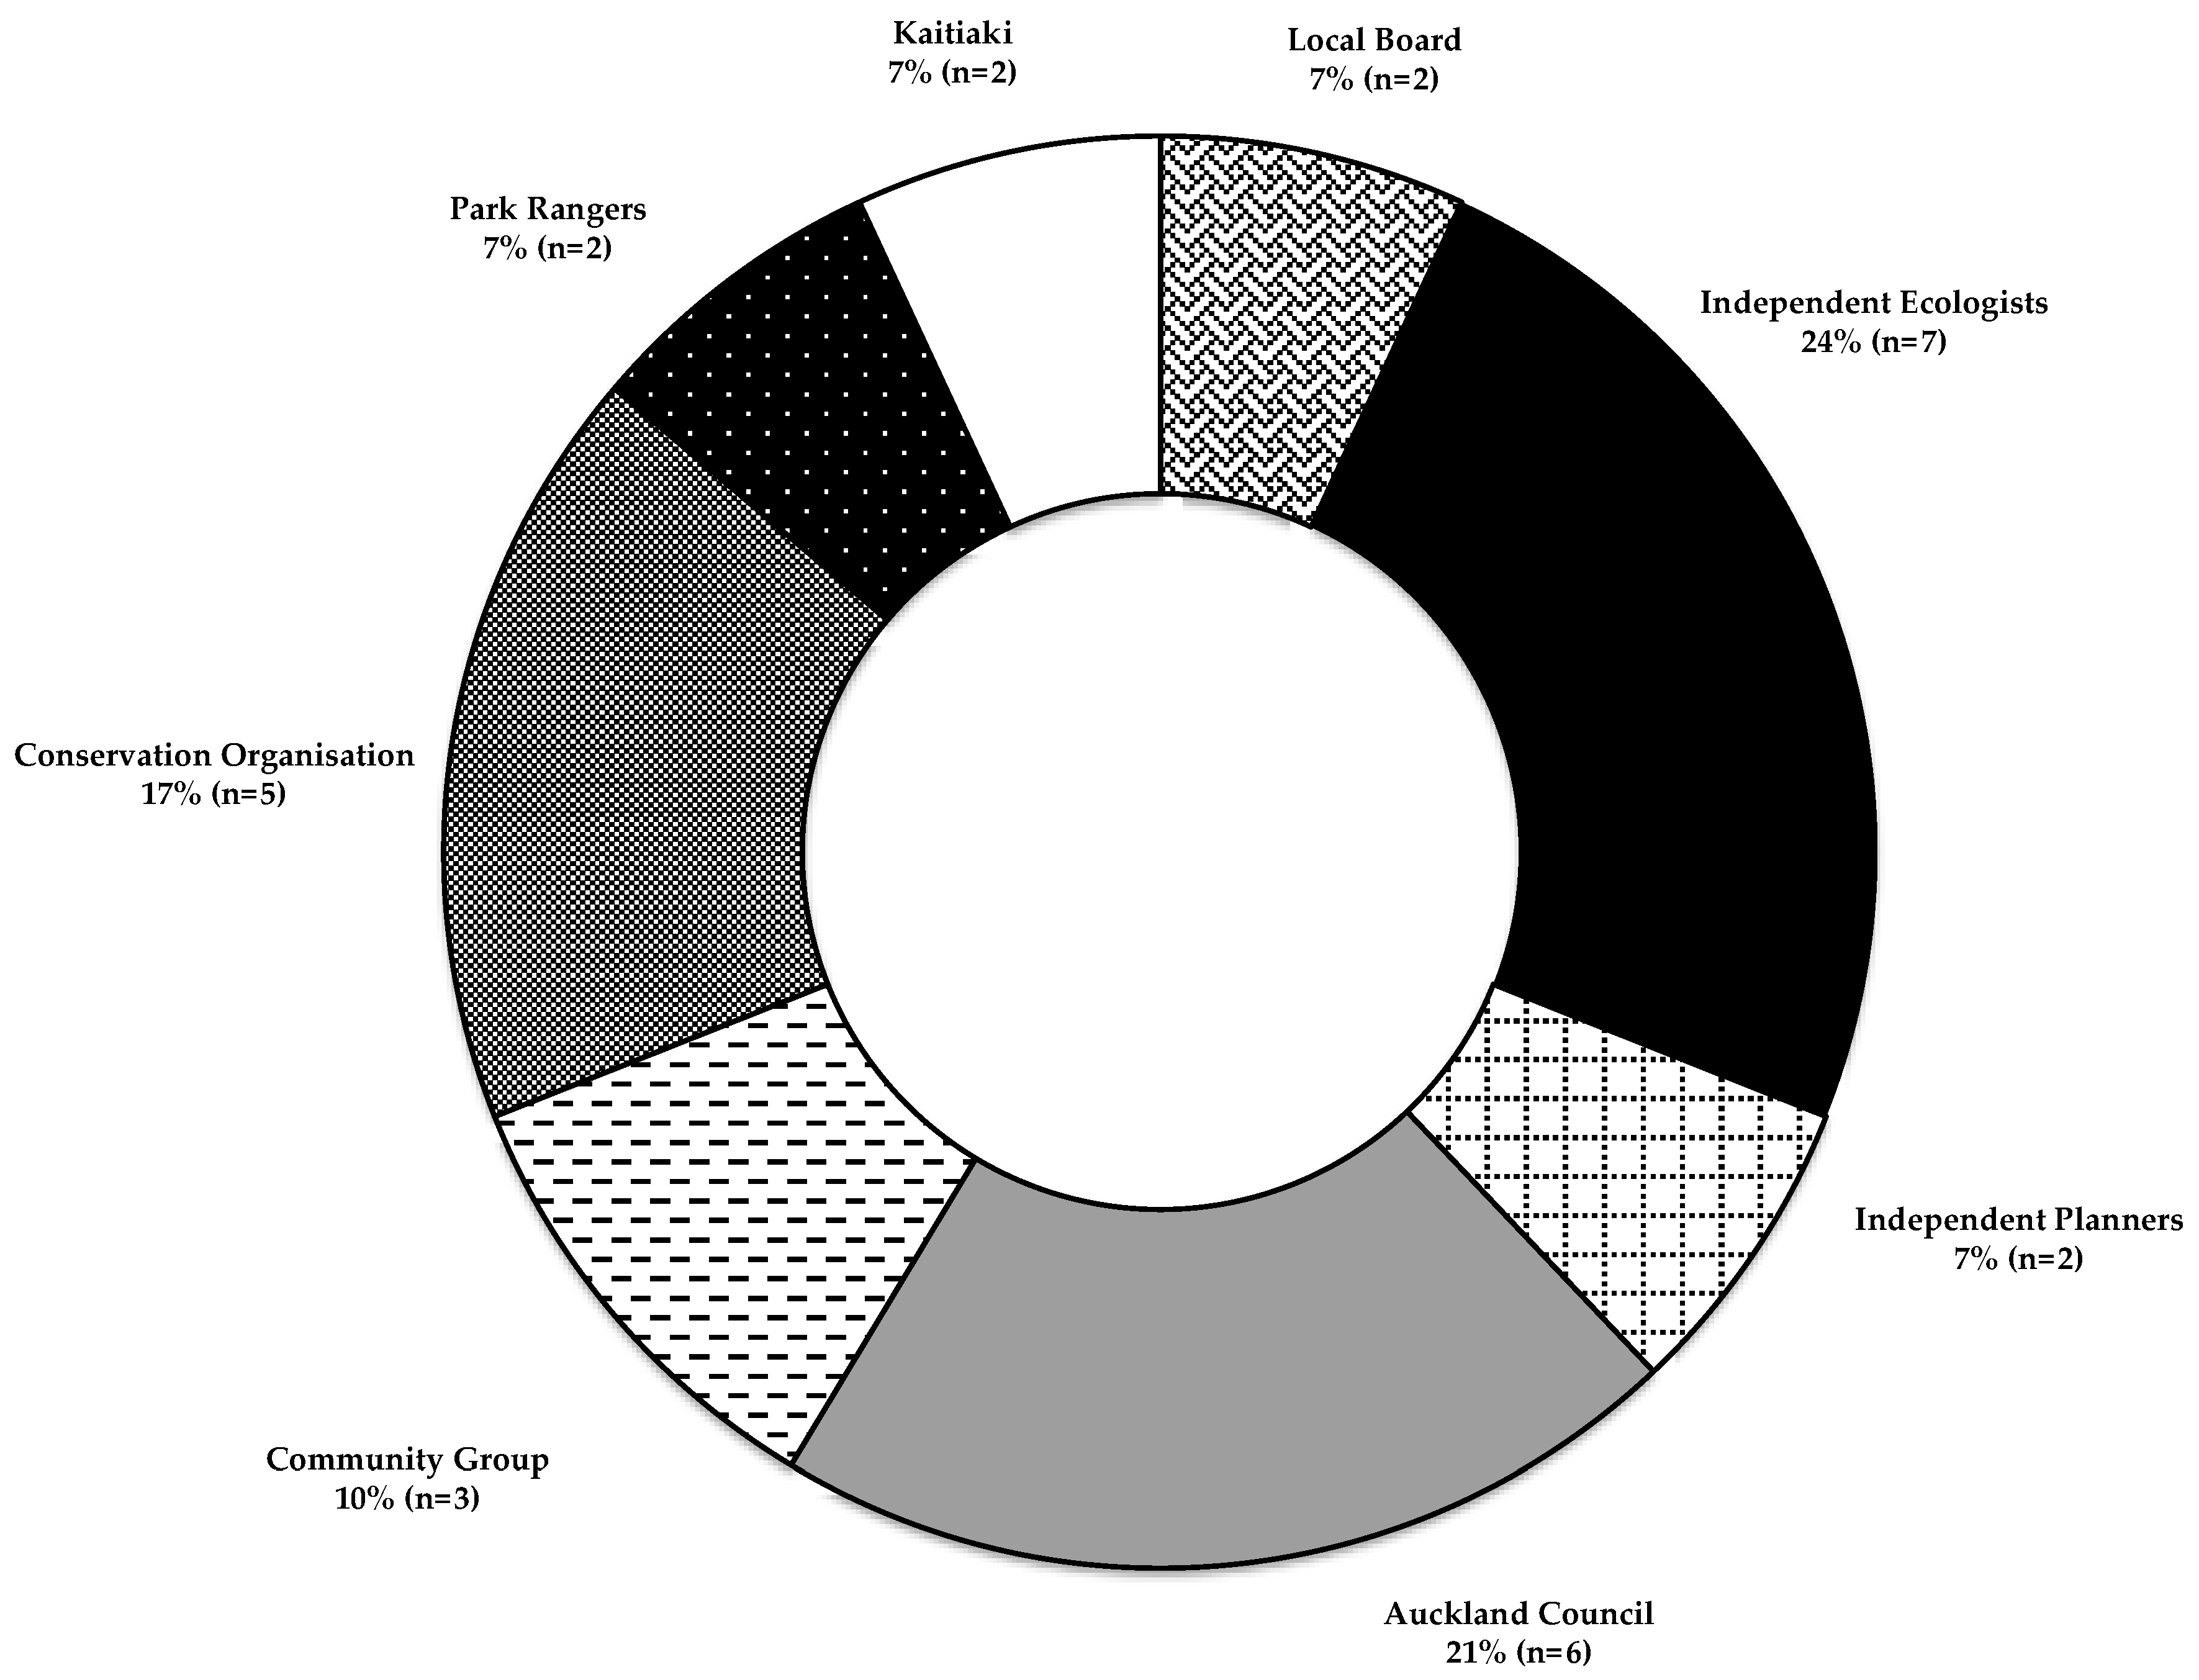
A total of 29 participants completed the semi-structured interviews (19 male, 10 female). Five kaitiaki each from a different iwi/hapu (Māori tribes/subtribes) were spoken with kanohi-ki-te-kanohi and on the telephone. Figure 3 shows the breakdown of participants who were part of the semi-structured interviews by percentage and number of individuals.
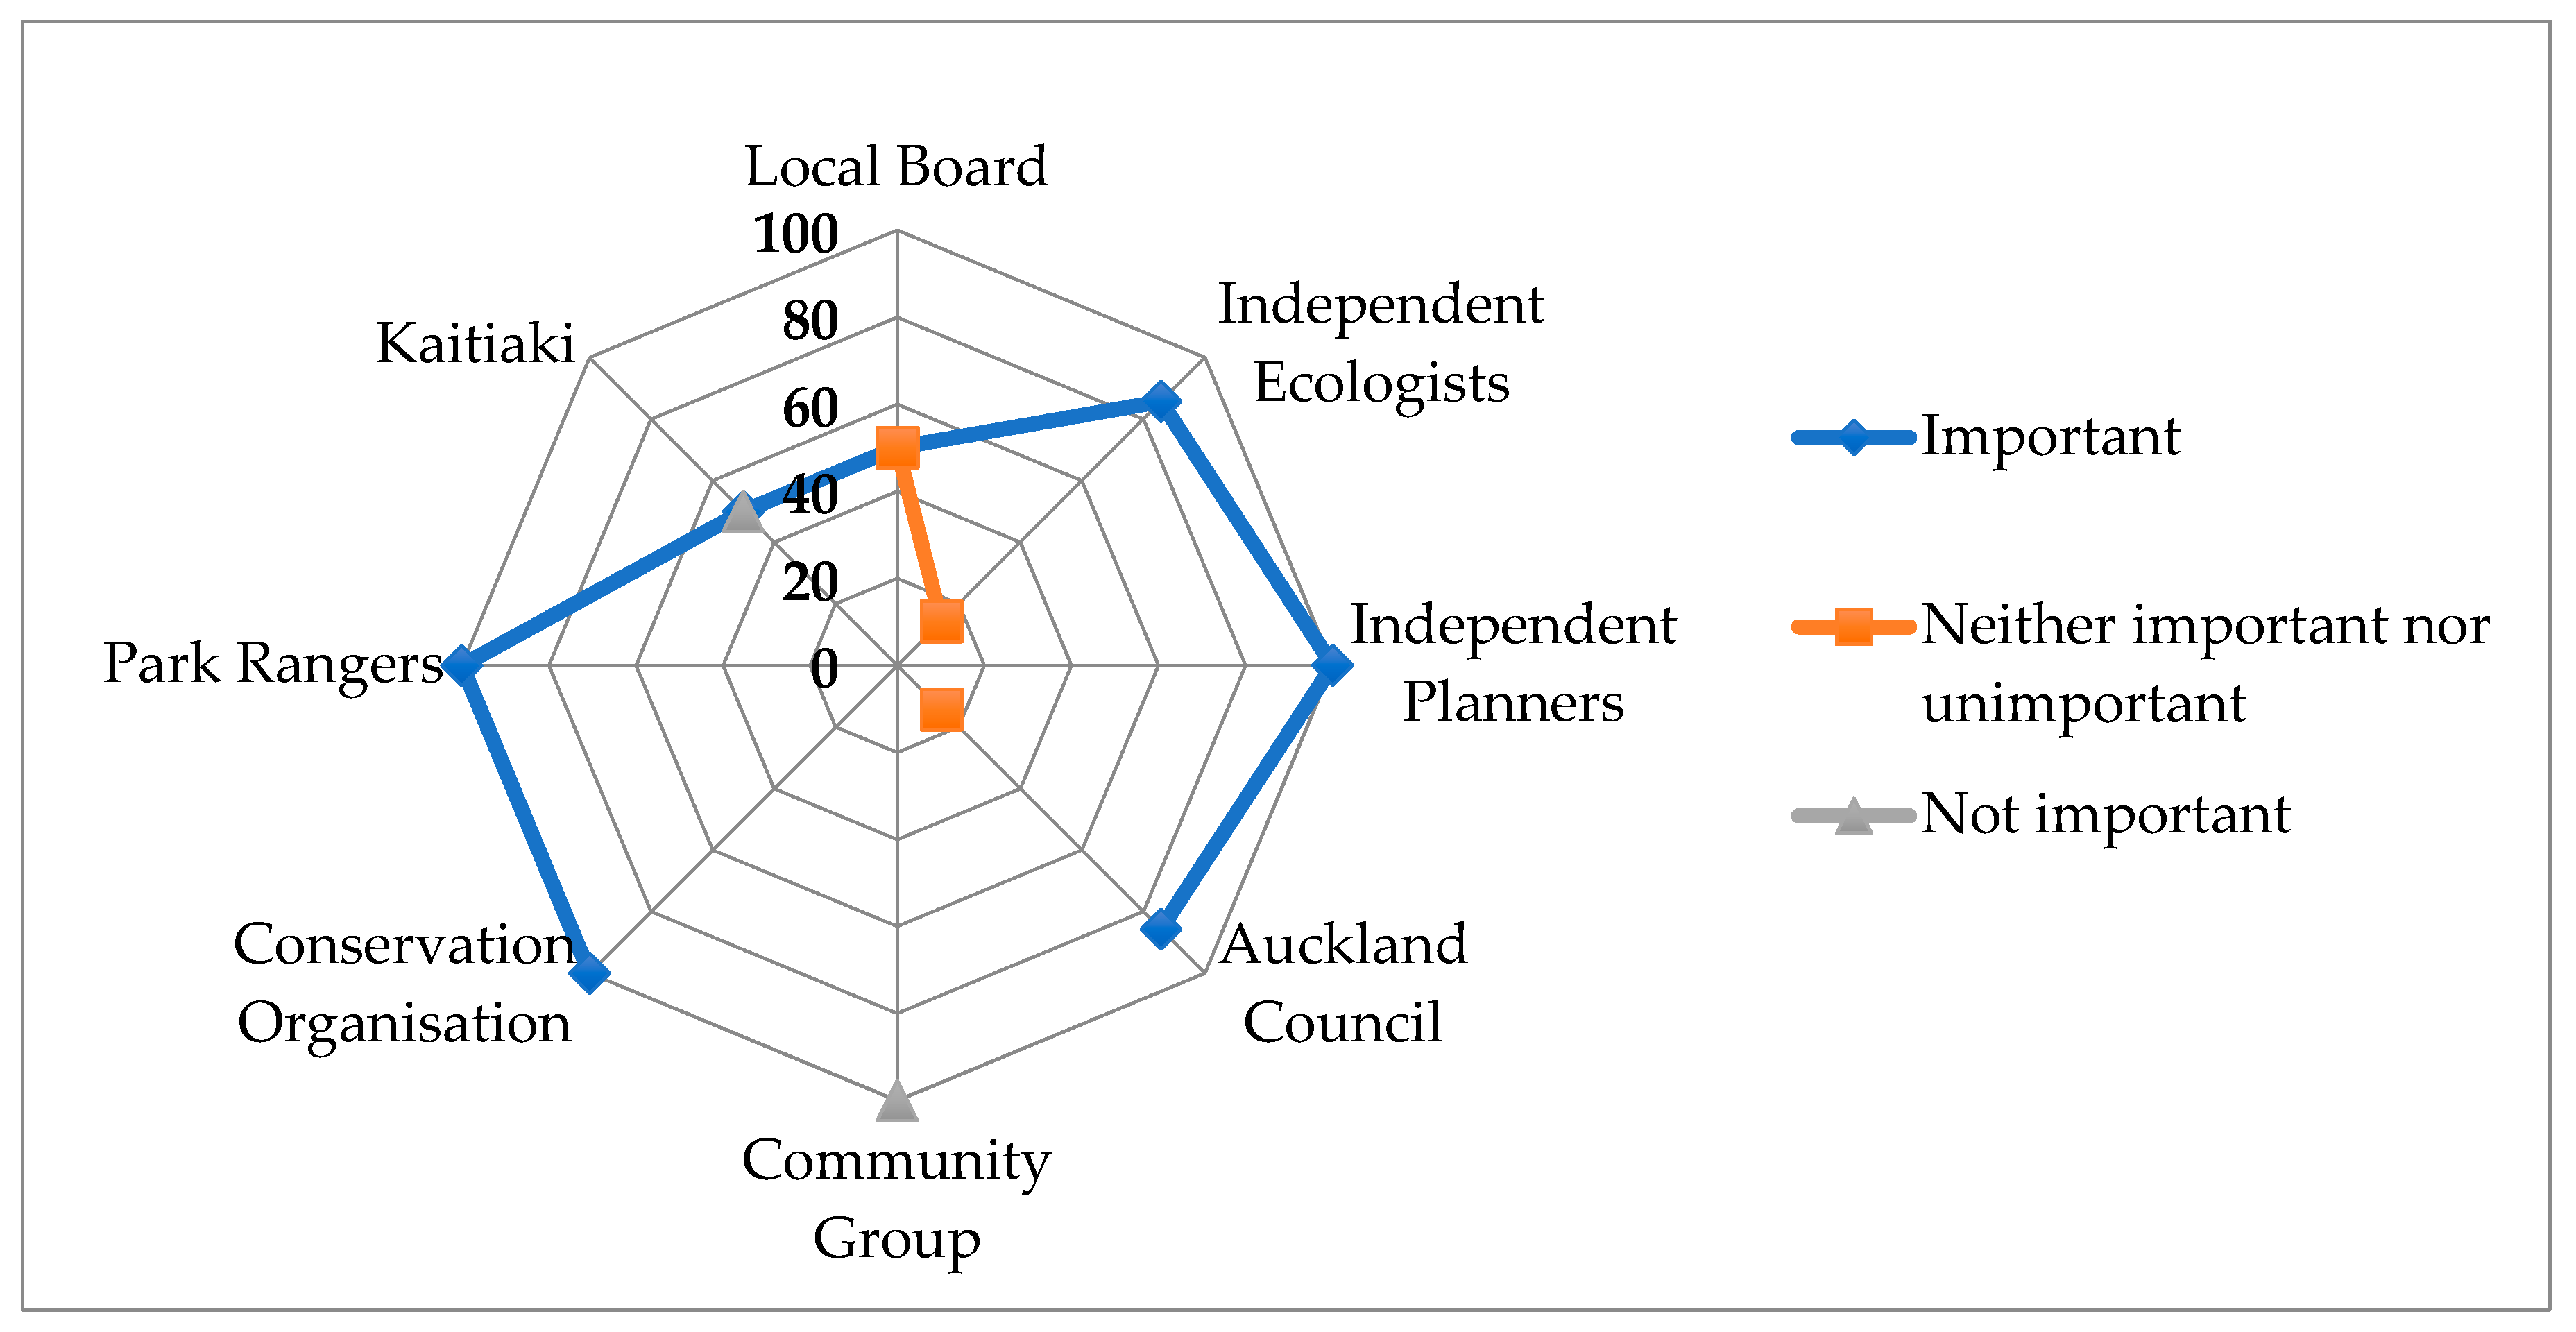
79.3% of participants believed that mangroves performed an important role in coastal ecosystems in New Zealand. 13.8% believed that mangroves do not play an important role and 6.9% had a neutral point of view. Figure 4 shows the percentage of each occupation stating the importance of mangroves in New Zealand.
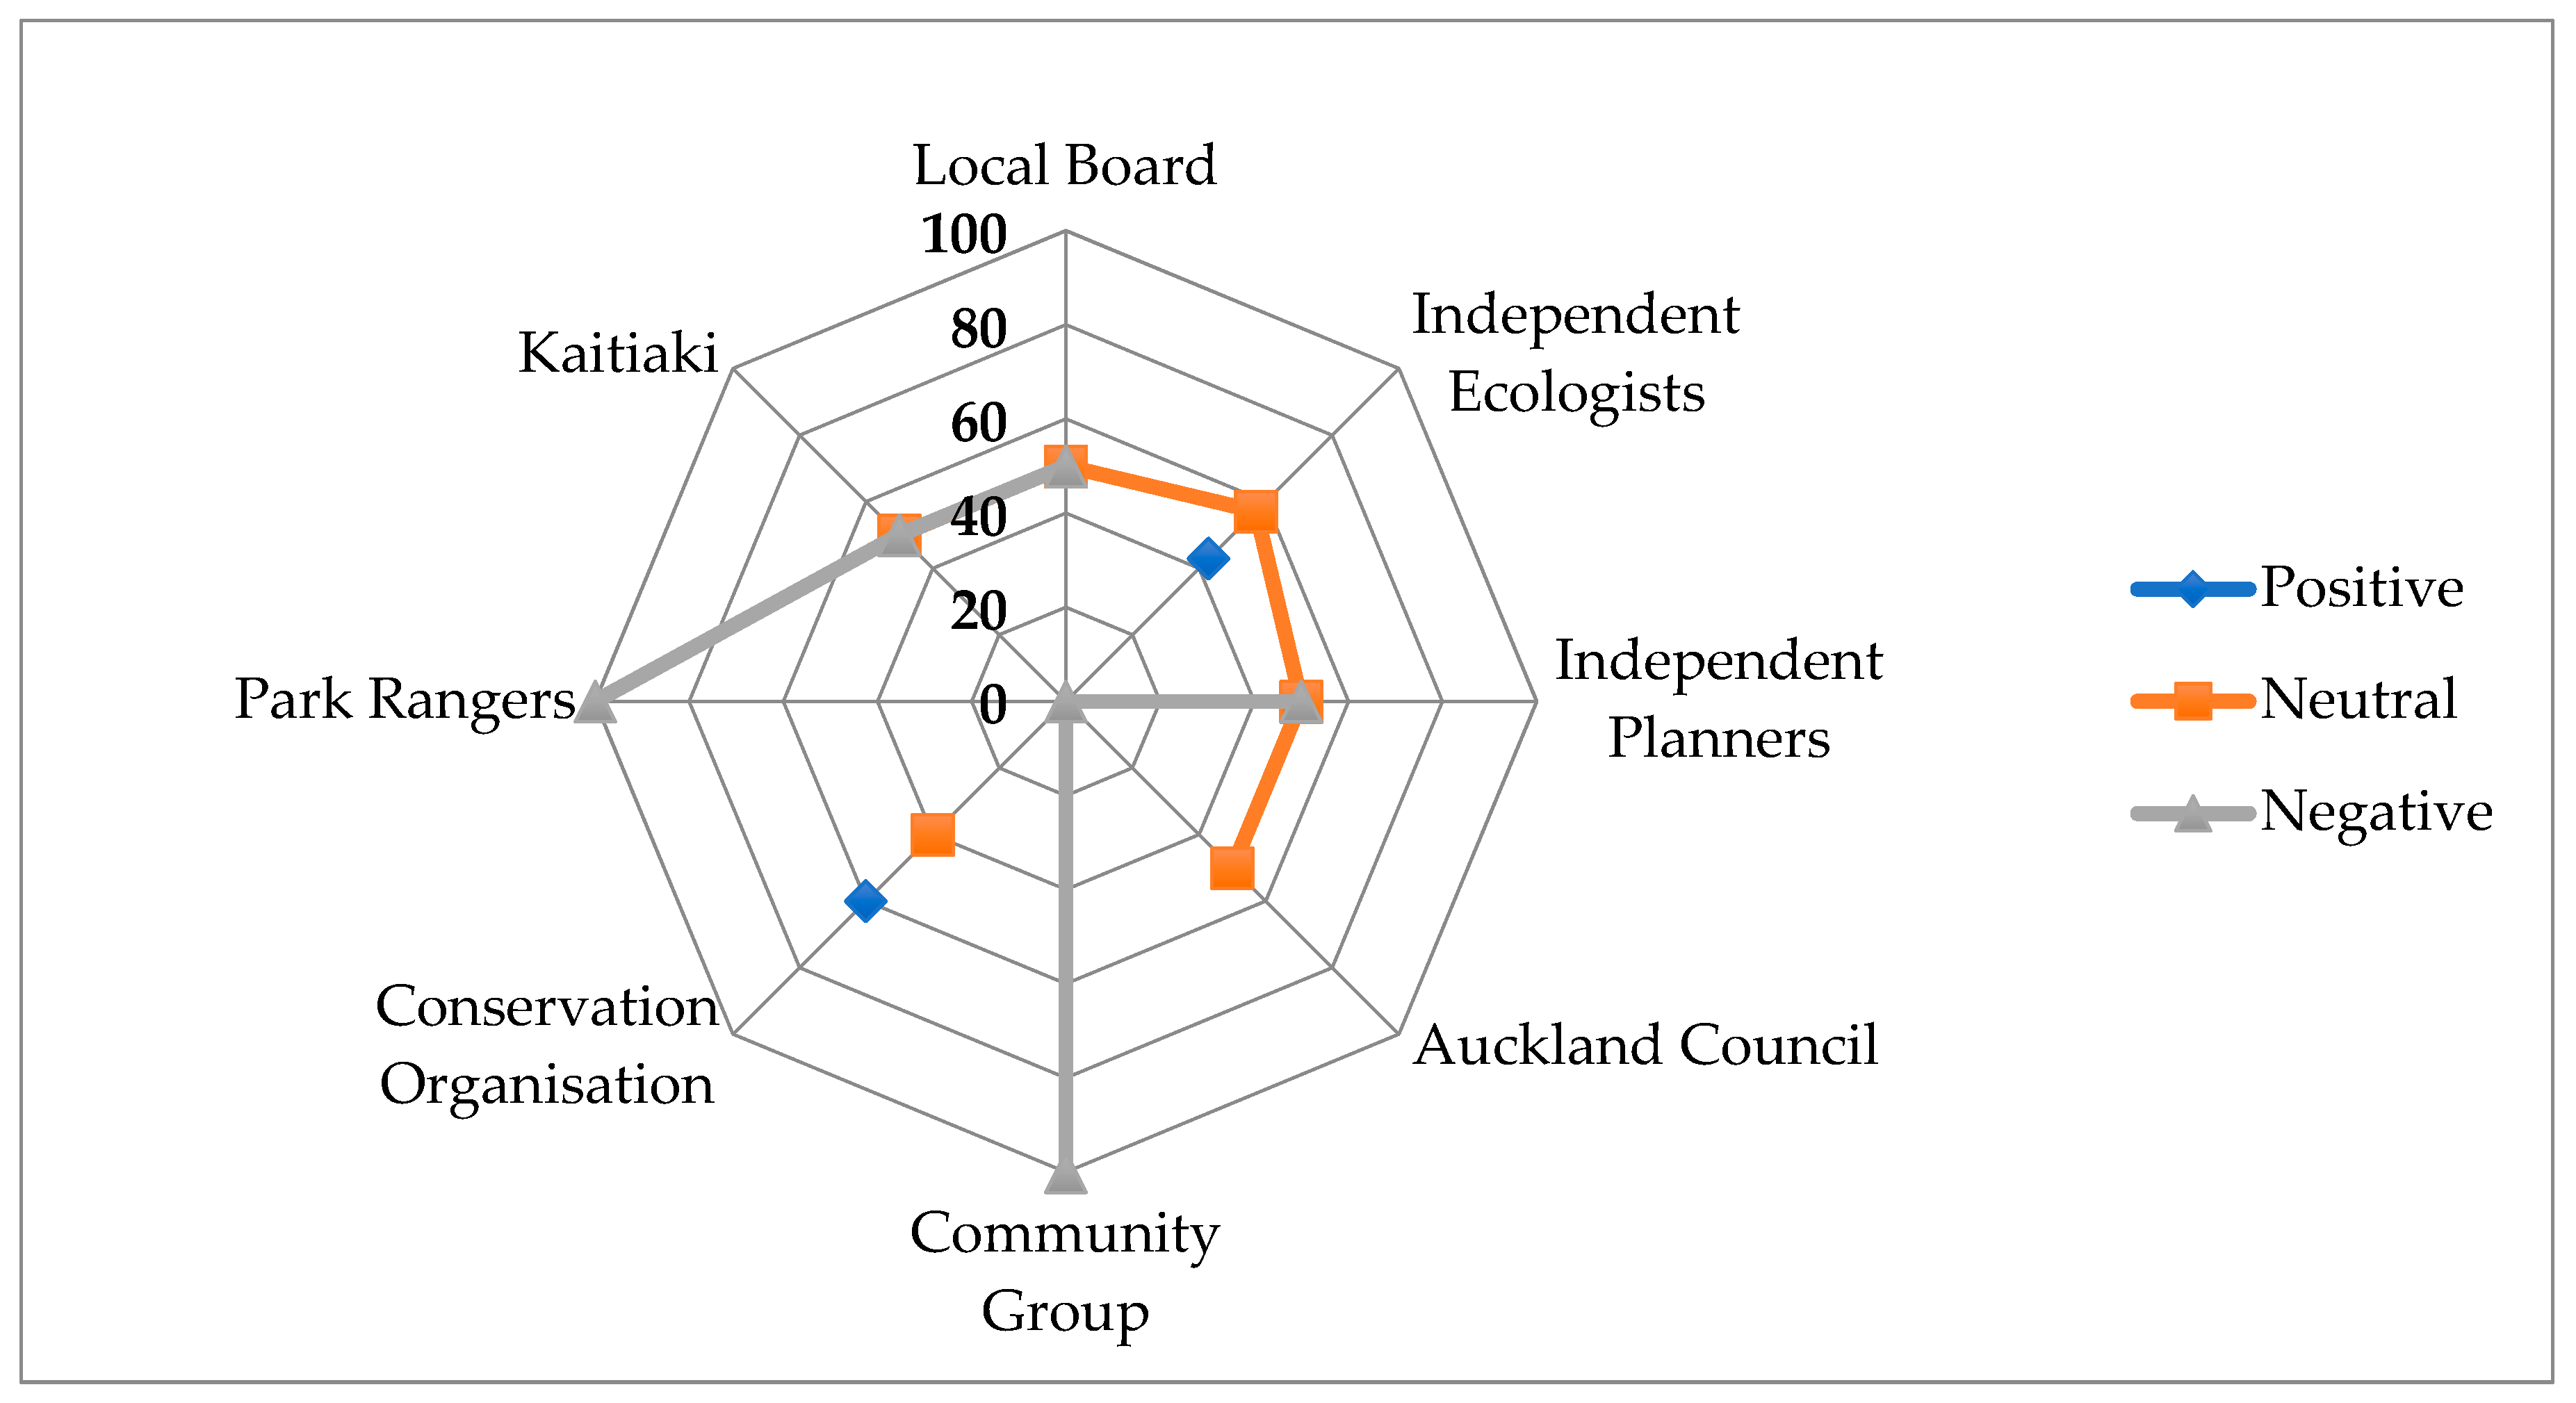
Participants were asked whether they felt positively, neutrally or negatively towards mangroves at the sites in question. 31.0% felt positively towards the presence of mangroves, 41.4% were neutral and 27.6% felt negatively towards the presence of mangroves at the sites. Figure 5 shows the percentage of each occupation in terms of positive, neutral or negative feeling towards mangroves at the sites.
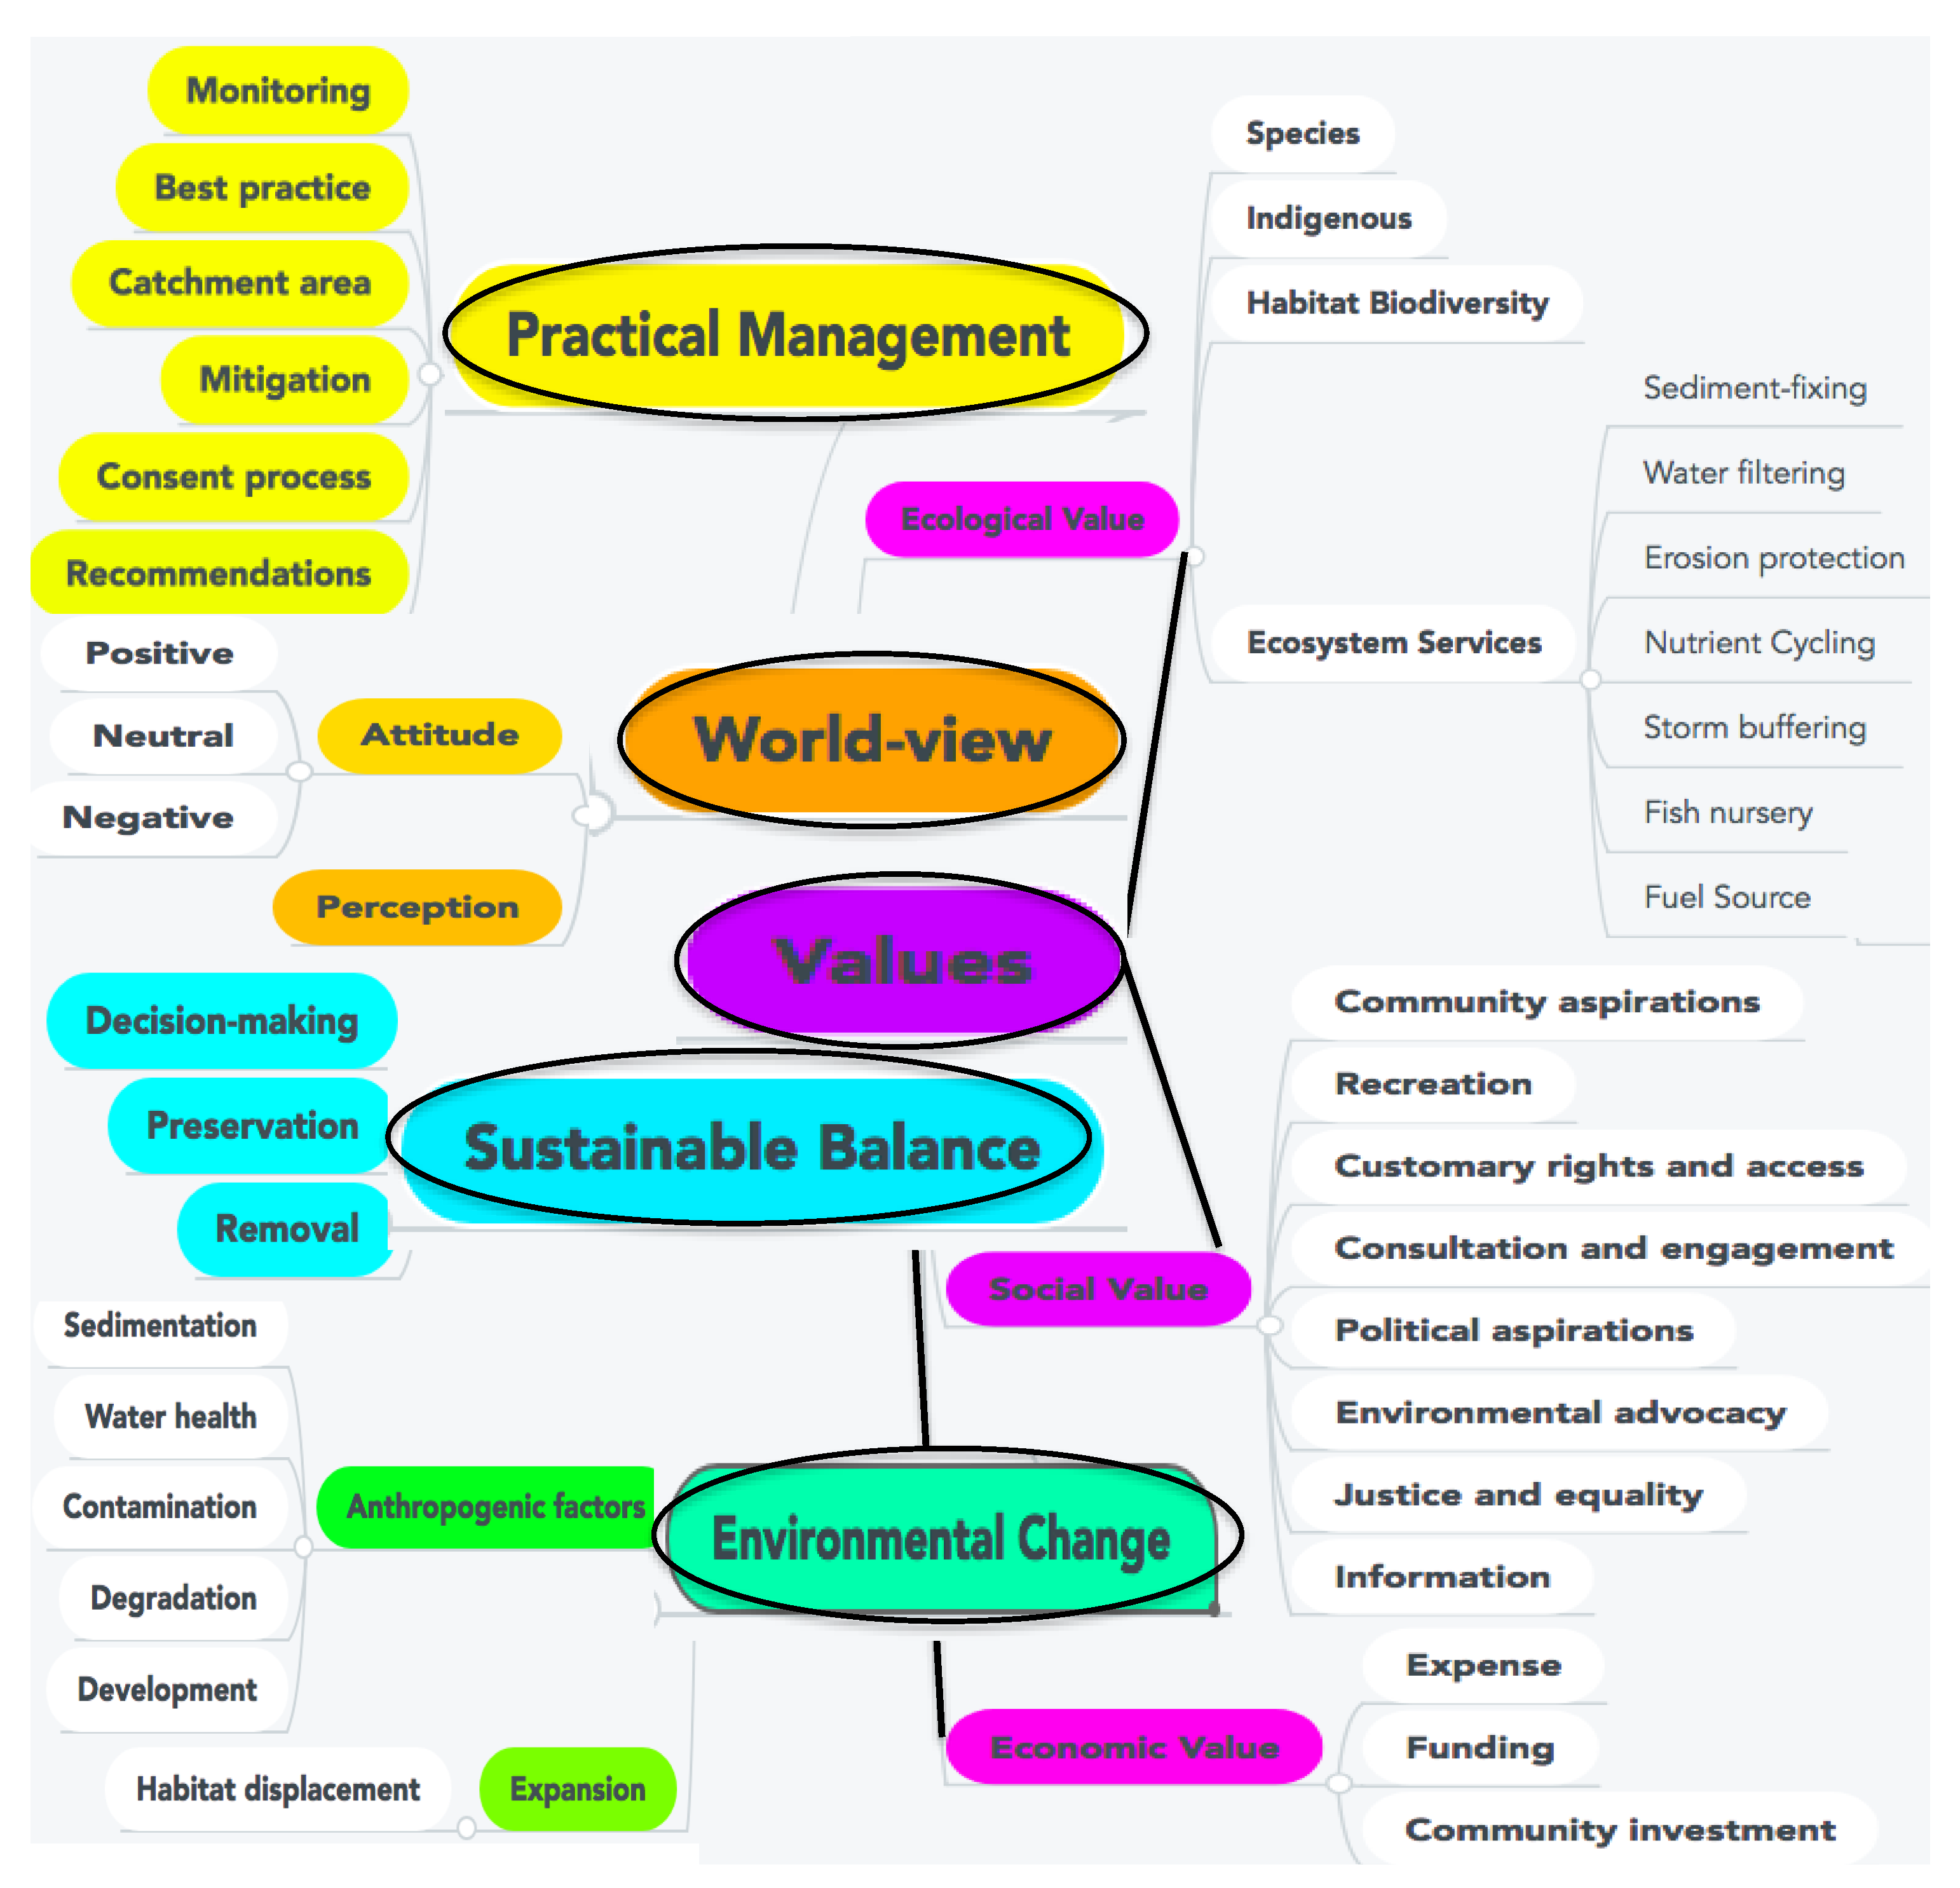
Overall a diverse range of opinions emerged from the data, with beliefs driven by experience and observations. The qualitative data revealed five broad themes of Sustainable Balance, World-view, Practical Management, Environmental Change and Values. These are discussed and evaluated below. The quotes by the participants are their individual opinions and not stated as fact. Figure 6 shows the themes and sub-themes emerging from the qualitative data.

3.1.1. Sustainable Balance

The theme of Sustainable Balance consisted of removal and preservation of mangroves and the decision-making factors involved in this. The balance of use values of the estuaries for people and nature was mentioned. Access to the water for cultural activities such as waka ama (outrigger canoes) and amenities were deemed as important and removal of certain areas should be allowed for these reasons. Aesthetics (views of the water) were not seen by some participants as a valid reason for removal.
I think that going in to clear mangroves solely for the reason that landowners views have changed in the last twenty to thirty years is maybe not quite so relevant anymore and we need to stop treating mangroves as the problem”.
(IE4)
The idea of wholesale removal of mangroves was generally opposed by participants, the questioning of whether removal was a “sensible” course of action came up. Targeted removal of some areas was seen as appropriate, however, the idea that removal is not a one-off practice was also highlighted.
Firstly, I don’t have a problem with them being removed in a sensible way”.
(CO3)
So, it’s finding a careful balance, but the fragmentation of that habitat and the effects that it has, balanced with the management feasibility, you start having to ask some serious questions whether it’s a sensible thing to do”.
What we’ve tried to help communities really understand is that it is never a once-off removal and then nothing comes back”.
(AC2)
Ongoing seedling removal (by hand) was seen as important to maintain the areas which had faced mangrove removal. There was some concern expressed about the long-term nature of investing in removal with community involvement of seedling and sapling removal seen to be an important aspect of maintenance. Long-term buy-in by the community was mentioned. There was the concern that short-term solutions (adding value to property, improving aesthetics) outweighed the long-term effects of removal.
That concerns me a bit. It’s all very well clearing these areas of mangroves, but you are creating an awful lot of work going forward for somebody and it won’t necessarily be the people who clear them, it will be their children and grandchildren”.
(IE6)
It is not an instant one-off solution to remove mangrove, it’s like mowing a lawn. It needs continued maintenance and management, people are not looking long-term”.
(K1)
There was a split in opinion among iwi regarding mangrove removal. Some individual kaitiaki did not oppose removal as long as water quality was not affected. Others wanted no more removal until further monitoring was done in terms of contaminants and sediment. It was spoken that “a holistic view must be taken when people advocate for the wholesale removal of mangroves”. (K1)
The purpose of removal and what people are trying to achieve with this was questioned by many participants. The idea of a balance of different ecosystems working together as a mosaic was expressed as was the concept that there may be natural decline of mangrove if the system is left to equilibrate.

3.1.2. World-View

The viewpoints of participants towards mangrove ecosystems and the perceived value that they have were highly polarised. Community groups had a strong negative perspective and attitude towards the presence of mangroves in New Zealand. They thought that tropical mangroves were ecologically valuable, but that New Zealand’s temperate mangroves do not have the same function or value as tropical mangroves.
… this attitude has misled generations of people since the 1970′s when it (temperate mangroves) was embued with all the qualities of tropical mangals”.
(CG2)
My instinctive, but uninformed, view would have been that they would have provided a beneficial environment for wildlife, though probably through confusing them with their tropical counterpart, as seen on TV, which has quite a different ecology”.
(CG3)
Community group participants said that the adverse effects of removal have been unjustified. They also expressed that if mangroves were found to have ecological value in New Zealand, removed areas would grow back very fast and so there is not so much of an issue with removal.
If for some reason, mangrove removal was found to be a horrible thing, you stop and it will all grow back and it will grow back very quickly. It’s a reversible experiment”.
(CG2)
The experience from Pahurehure is that the predictions by so-called Council experts of the dire effects of removal have proved completely unfounded”.
(CG3)
Council representatives and ecologists thought that community perceptions towards mangroves were negative and this was reinforced by the views of community group participants (Table 3).
In comparison to the negative attitudes and perceptions towards mangroves held by some community group participants, there was a positive feeling and attitude characterising some council members, independent ecologists and conservation groups. Mangroves were viewed by some as being “native” and “an important part of estuarine ecosystems”. The role of mangroves as coastal buffers and the question of how long it would take to see adverse effects of mangrove removal was commented on. Some spoke strongly against removal, referring to it as a “disaster”. One Council representative spoke of a site visit to a recently removed area with local board members from another area in Auckland. Feedback from those who saw the site was negative, with some members being “appalled” by the removal of such a large area of mangroves.
There was also a degree of neutrality towards mangroves and their presence in New Zealand. Site specificity was spoken about, with mangroves having an important role in areas transitioning to salt marsh and connecting to upper estuarine regions. Older mangroves (dating back to 1940s/50s and beyond) were perceived to have greater value than those which had recently expanded. There was also the idea of shifting viewpoints and opinions by some participants over time based on personal observations.
I’ve changed my opinion of them over the years from positive to back a bit because I’ve seen encroachment of them on shorebird habitat”.
(PR1)
An interesting viewpoint was put forward by one kaitiaki who said that it is not a matter of opinion towards mangrove, but rather a “control argument” in reference to the spread of mangrove. The concept of mitigation by expansion was commented on by an independent planner who stated that some people thought that expansion in urban areas “offsets” the loss of mangrove in rural areas due to farming practices.

3.1.3. Practical Management

The need for more baseline monitoring of mangrove sites including thorough habitat assessments, data collection on contaminants in mangrove soils and water quality monitoring prior to any mangrove removal was spoken about. Some participants thought that managing mangroves should involve wider catchment management in order to identify areas of expansion. Suggestions included that communities should think more about land management control and sedimentation, instead of focusing solely on mangrove removal.
It’s not just a mangrove problem, it’s a whole sediment coming down from the catchment problem”.
(IE2)
I believe that they are more of a symptom of other issues that are going on within a catchment”.
(IE4)
An adaptive management plan by the council is implemented in order to understand what conditions may occur post-mangrove removal. However, some council participants said that when an application is lodged to remove an area of mangroves, there is usually not enough information to do an ecological assessment provided by the people who lodge the consents. Site selection and ongoing maintenance of the site (seedling removal) were raised as issues faced by council members processing applications. The idea of communicating to the application lodgers about the suitability of removal of mangroves was spoken about, with a clear understanding of what the benefits would be to removal and managing community expectations around this.
… had been requested by local people and we actually said that from an ecological perspective, there was no benefit to clearing the mangroves”.
(IE4)
The idea of selecting areas where mangroves provide ecosystem services and keeping them, then removing areas where amenity access is important was suggested in order to create “tapestry of environments”. Post-removal monitoring was suggested to ask the question: “What has the improvement been?” This was also emphasized by individual kaitaiki who spoke about the resources themselves being important, not the people. The care of the environment is the utmost priority.
We need to look at putting the environment first before we look after ourselves”.
(K5)
General recommendations from participants included the following:
  • water quality assessments (incoming and outgoing tides) to ascertain the role of mangroves in filtering the water
  • production of a set of guidelines between regional councils to create clearance options and future predicted outcomes of removal
  • keeping mangroves around stormwater outlets until contaminants are removed
  • maintaining the removed area free of propagules
  • identification of areas of mangrove to be preserved
  • no blanket removal of mangroves
  • removal of juvenile mangroves without consents being required
  • leaving mangroves until natural equilibrium is reached
  • designating mangrove reserves in pristine areas
  • stopping further encroachment of mangrove through seedling removal
  • looking at sediment management and the effects if mangrove were to be removed
  • taking responsibility for management
For best practice it was suggested that a clear, strategic feasibility process of removal should be put in place. Thinking long-term about why removal should go ahead, with any removal being small scale and “specific to a purpose” was recommended. Realistic management objectives need to be set in order to “limit the ongoing burden you are putting on future generations”.

3.1.4. Environmental Change

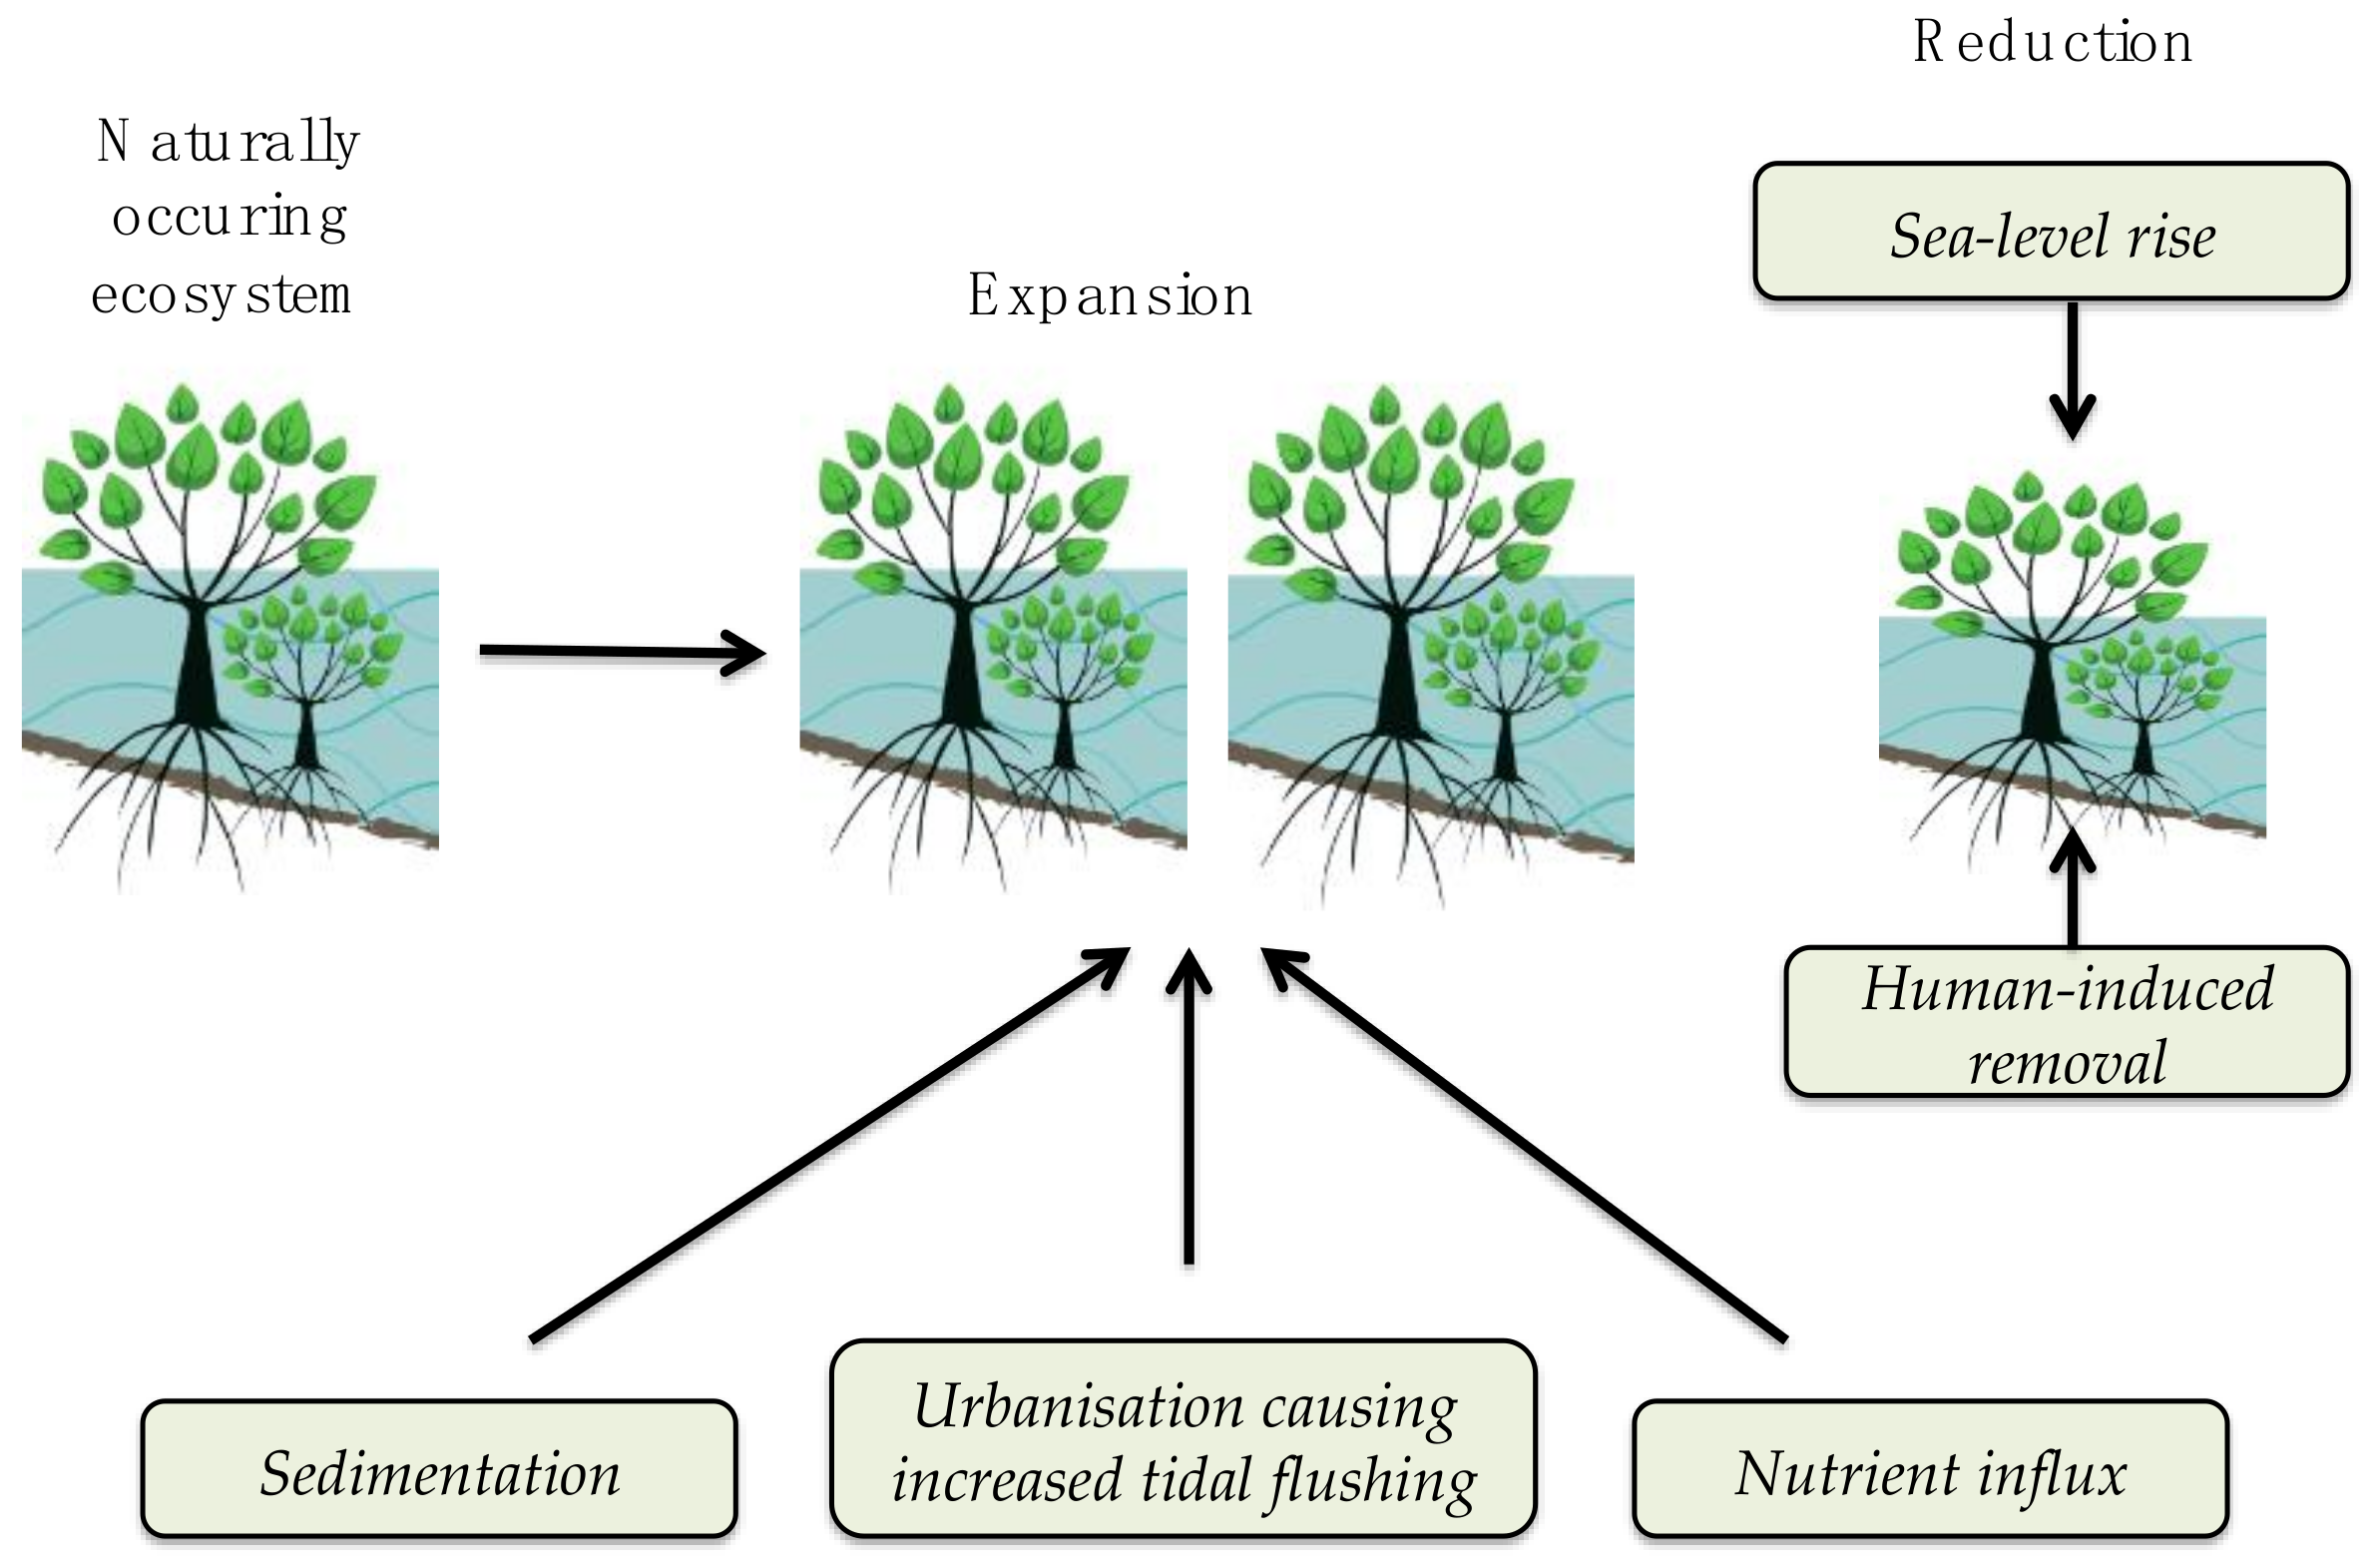
All participants agreed that mangroves were expanding at the sites spoken about. Reasons for expansion were thought to be driven by land clearances through urbanisation causing high levels of sediment and nutrient run-off from the land into estuaries of the Manukau Harbour. Farming practices increasing sediment loads were also mentioned as a contributing factor prior to urbanisation. Sea-level rise caused by climate change was mentioned as a potential future factor limiting growth of mangrove.
They’ll get to some limit and potentially are balanced by things like sea-level increase”.
(AC2)
The idea of intense industrialisation and urbanisation, including building of motorways, causeways and housing developments over the past fifty years were thought of as contributing factors to the colonisation and rapid growth of mangroves in these areas. Figure 7 shows potential causes of expansion and reduction of mangrove habitat as voiced by participants.
The expansion of mangroves was seen by some participants as a “natural response” to human-induced changes to the environment. Some participants thought that for this reason that they should be removed or at least managed to some extent. Others saw the benefit in expansion as a way of buffering the waters against the large sediment loadings and stormwater contaminants which mangrove contained.
I’d prefer to have sediment stabilised rather than washing backwards and forwards in the ecosystem”.
(CO1)
I think there’s still a massive amount of storm water contamination that’s not being picked up and to a degree mangroves sequester that. They tie it up and stop it getting into the food chain”.
(CO3)
… they will bind sediments, so they have the potential to sequester contaminants and various other bits and pieces and for sediments in contaminated areas, that’s not such a bad thing”.
(AC1)
In terms of addressing expansion, many participants saw that reducing sedimentation input from the land as a key factor. The idea of improving stormwater outlets and addressing contaminated sediments before mangrove removal was seen as important by some participants. The notion of placing water quality above aesthetics to improve the overall health of the harbour was put forward by kaitiaki. They also advocated for removal of the causeway to increase tidal flushing at one site.
Aesthetics are not important, it’s the quality of the water”.
We also advocated for the removal of the causeway in order to improve the flow of water in the inlet and potential restoration of the harbour overtime but consultation occurred too late”.
(K1)

3.1.5. Values

Social, economic and ecological values in relation to mangroves were spoken about in the interviews. The social values of communities and expectations from removal of mangroves to restore areas back to pre-urbanised environments were viewed as unrealistic by some participants. A strong drive to improve the recreation and amenity value of the harbour came across.
Generally people think that if you remove mangroves, you end up with nice white sandy beaches, which may have shown up in black and white photographs from 1952. That’s not going to happen, those days are gone, so that’s an unreasonable expectation”.
(AC1)
Reasons for removal there were recreational, so opening up navigable space for the community and the views. People want things to go back to yester year”.
(AC3)
The current situation of localised, community-driven removal was viewed as “haphazard” by some and successful by others. The removal of an area of mangrove for waka launching and retrieval at one site through balancing “recreational, cultural, landscape and ecological constraints” was achieved by consultation with iwi and council. Achieving the balance of community aspirations and what is perceived as best for the environment was seen as the best way to benefit humans and nature.
I think it really has to be balanced with what’s best for the ecology and the motivation for removal”.
(LB1)
The cost of removing and subsequently maintaining removed areas of mangroves was a key issue for participants. The idea of obligation to provide ongoing funding by the applicant and to think long-term about costs was a key issue by Auckland Council participants. Concerns by community groups that local boards will not always have the funding for removal and repopulation of seedlings in removed areas was mentioned. This was also mentioned by independent ecologists and suggested that in some cases, money is better spent in other areas of the harbour in terms of improving coastal ecology.
The ecological value of mangroves revealed a range of opinions with regards to different species using mangroves and the roles mangroves play in coastal ecology. The Banded Rail (Gallirallus philippensis) was mentioned frequently as occupying mangroves, although some participants questioned whether they used only the edges of the mangrove or the interior. The role of mangroves as a fish nursery was debated, with a general consensus that they are occupied by some fish species, however, not comparably to tropical mangroves and only during high tide.
The erosion-buffering, sediment-fixing and water-filtering roles of mangrove were mentioned by a wide-range of participants. The idea that the expansion of mangroves has reduced area for wading birds was also mentioned (Table 4).

3.2. Ecosystem Services and Issues of New Zealand’s Mangroves

3.2.1. Ecosystem Services

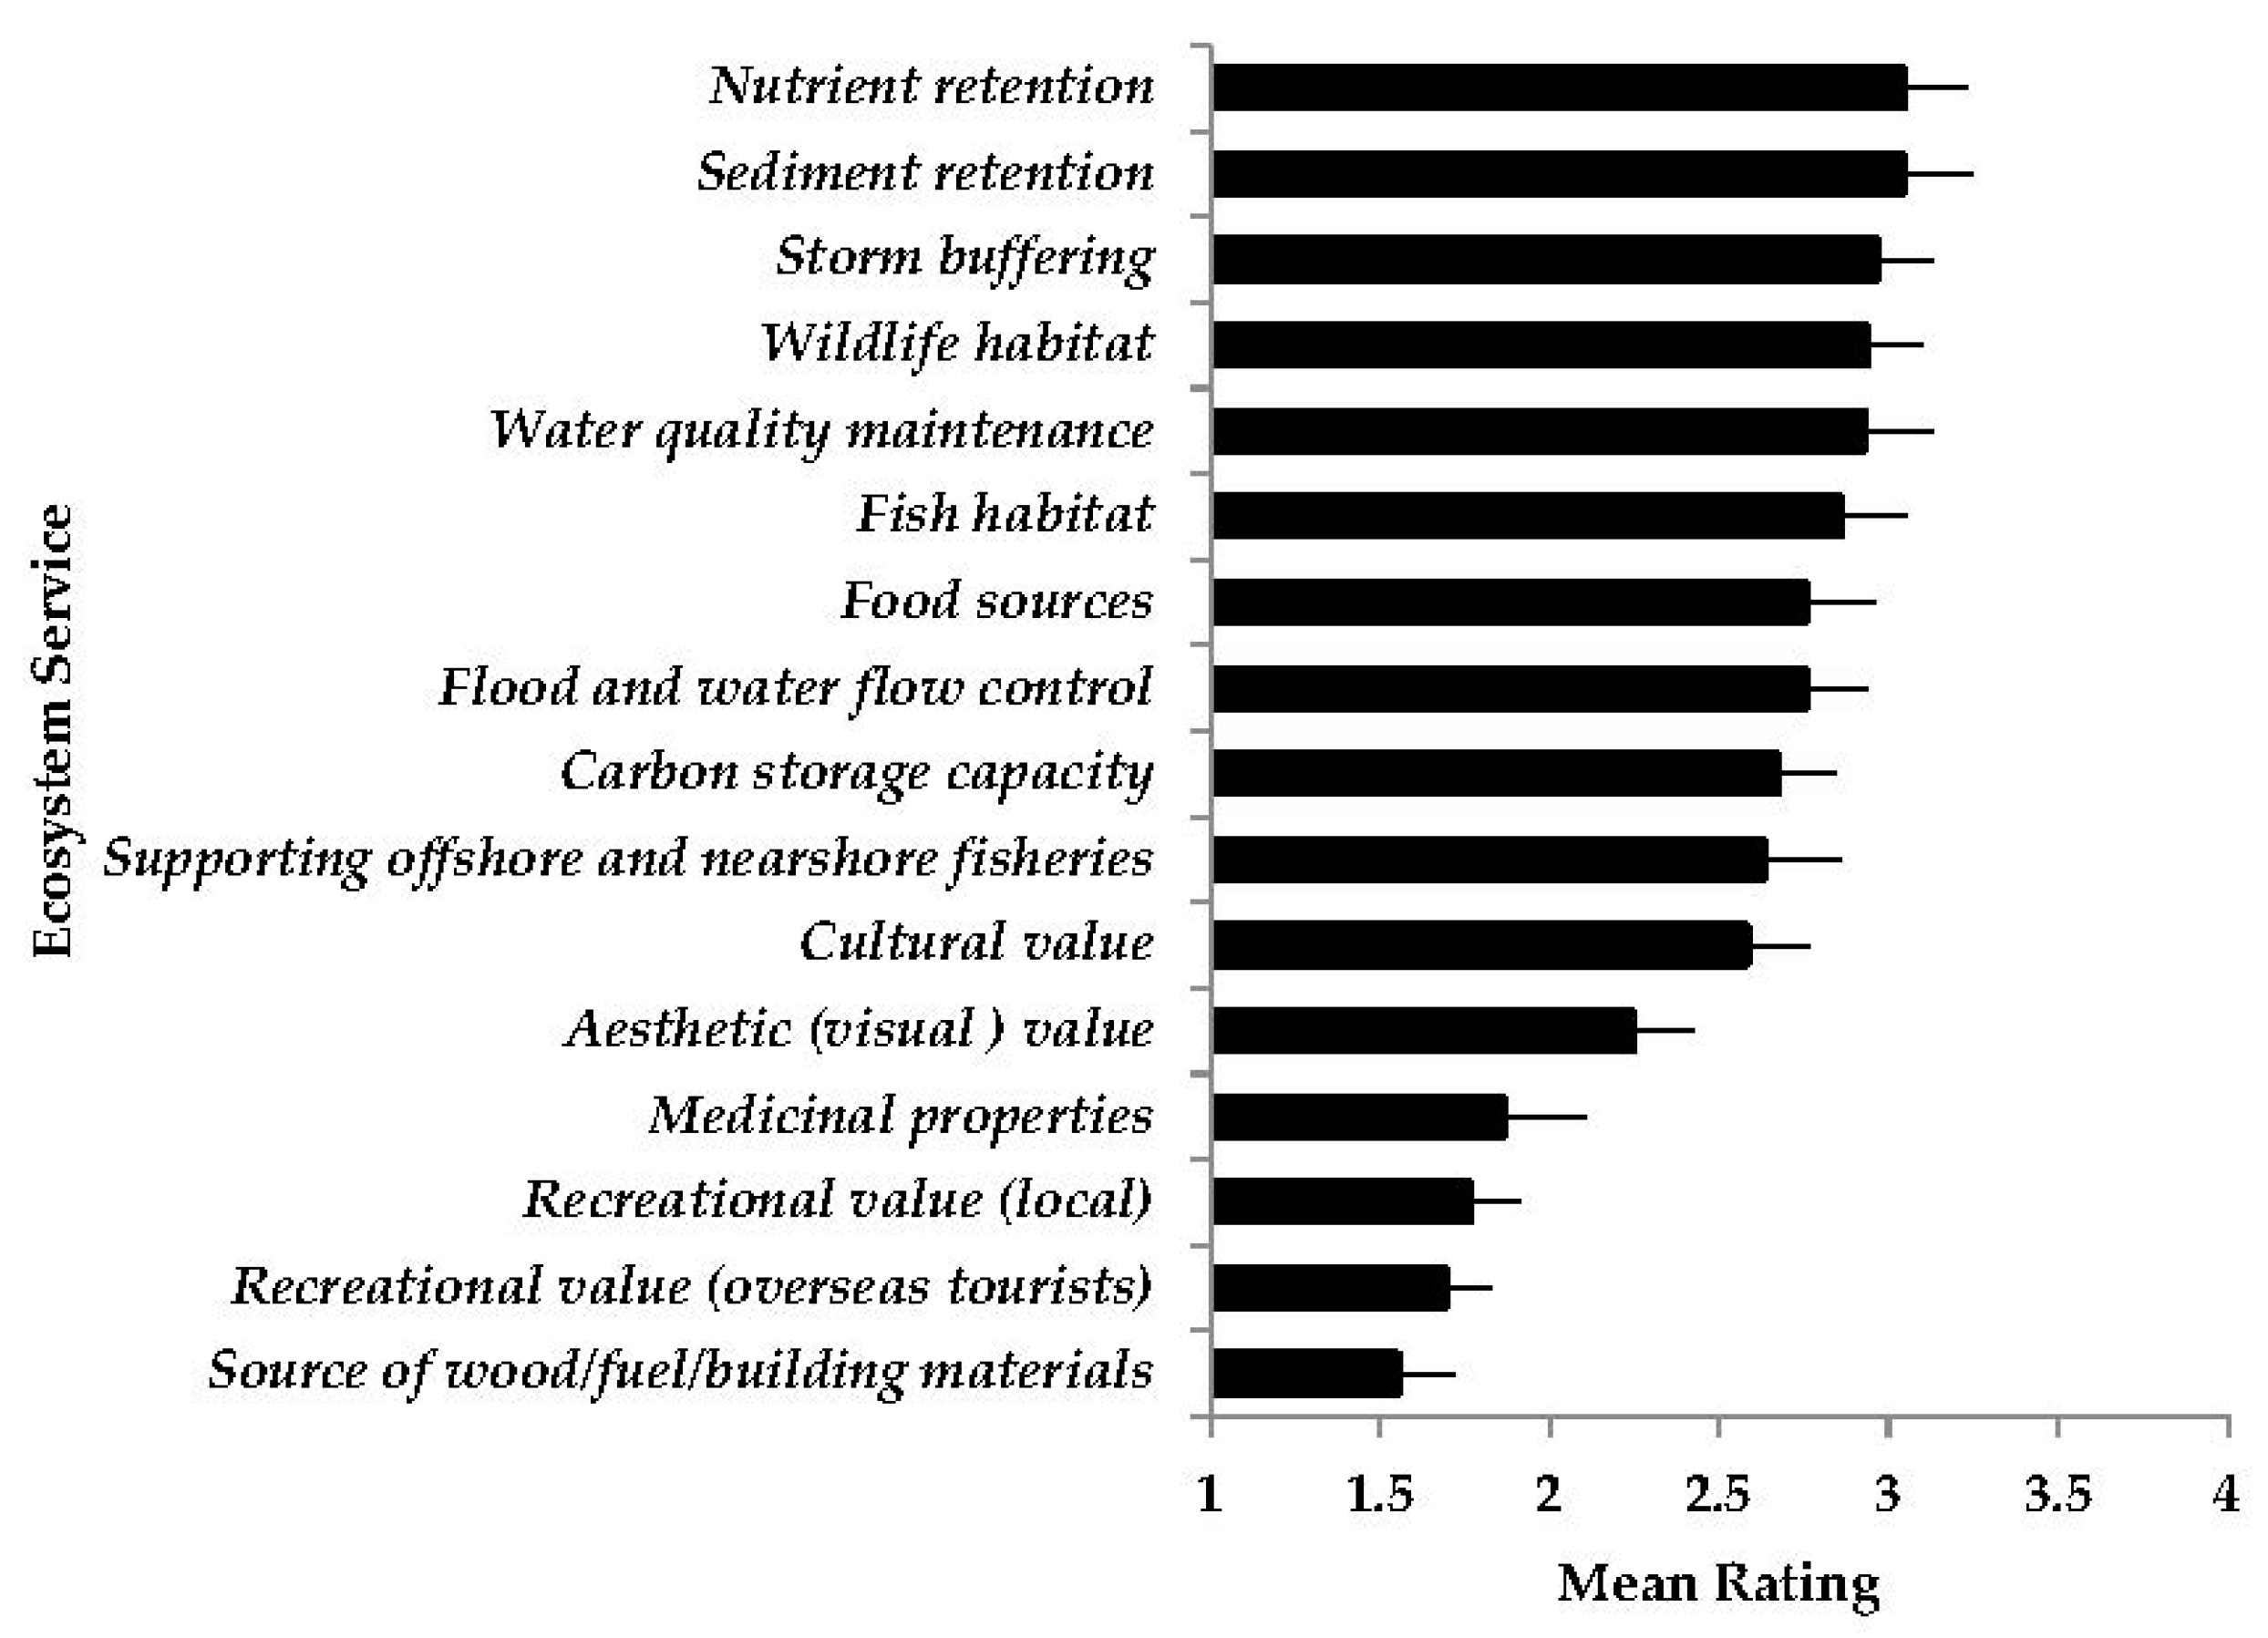
Results of ratings of ecosystem services were averaged (scale of 1–4), with any ‘don’t know’ responses removed. The highest rated ecosystem service of mangroves was nutrient retention and sediment retention
The lowest rated ecosystem service of mangroves was as a source of wood, fuel or building material. Figure 8 shows the mean rating of each mangrove ecosystem service by participants.
Almost half (48.3%) of participants rated medicinal properties as “Don’t know”, this was followed by mangroves as a source of wood/fuel/building materials (31.0%).
‘Don’t know’ responses were entered as ‘missing data’ in Primer-E and PERMANOVA designs were created and run. The outcomes in terms of significant factors were compared with entering ‘don’t know’ data as ‘zero’. There were no significant differences in the outcome of which factors were significant and so in order to do post-hoc tests (SIMPER), treating ‘don’t know’ data as zero was decided upon. This allowed for pairwise comparisons between different groups (which was not possible with entering data as ‘missing’).
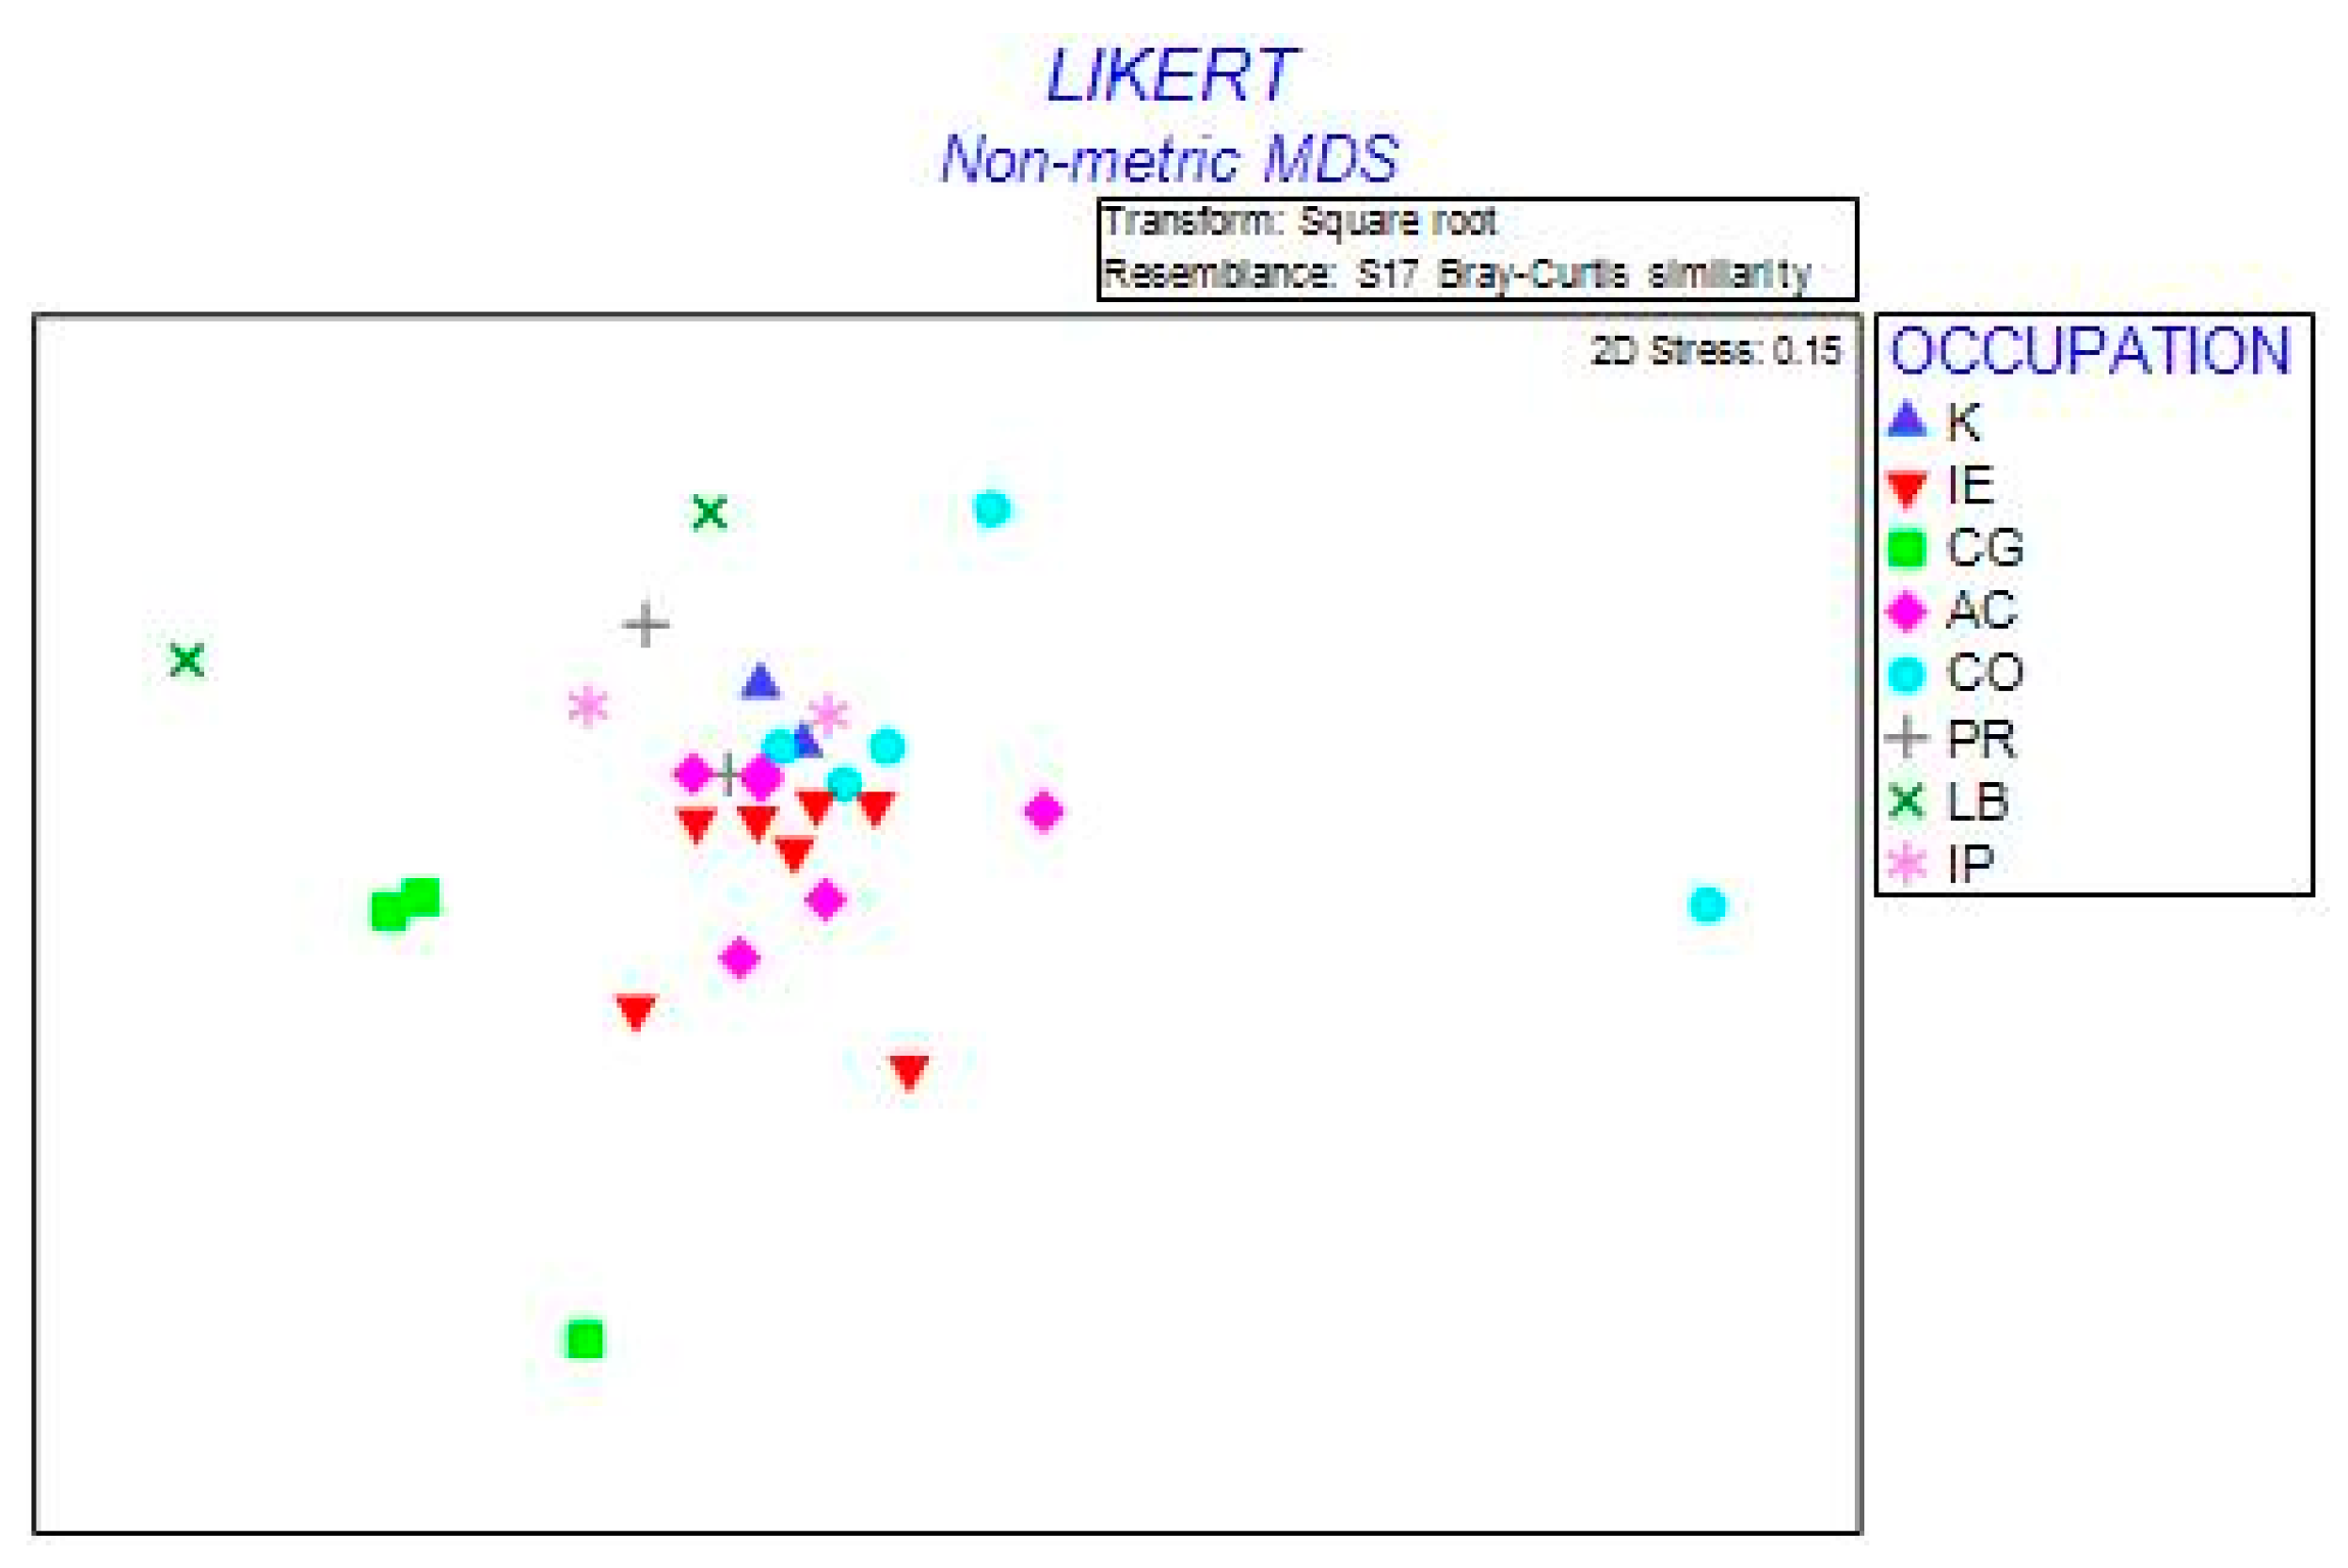
There was a significant difference between the responses of participants towards the importance of mangrove ecosystem services with occupation. PERMANOVA; F7,28 = 2.64, p < 0.05. Table 5 shows the significant pairwise comparisons between groups (for a full output see Appendix B.1). Significant differences lay between the participants listed as independent ecologists (IE) with Community Groups (CG), Conservation Organisations (CO) and Local Board (LB). Community Groups (CG) differed significantly in responses compared to Auckland Council (AC) and Conservation Organisations (CO). Auckland Council participants had significantly different responses in the rating of mangrove ecosystem services to Conservation Organisations and Local Board (LB).
SIMPER analyses showed that the greatest differences between groups were those between Community Groups and Conservation Organisations (34.86%). The nMDS plot shows the differences between groups in multidimensional space (Figure 9).
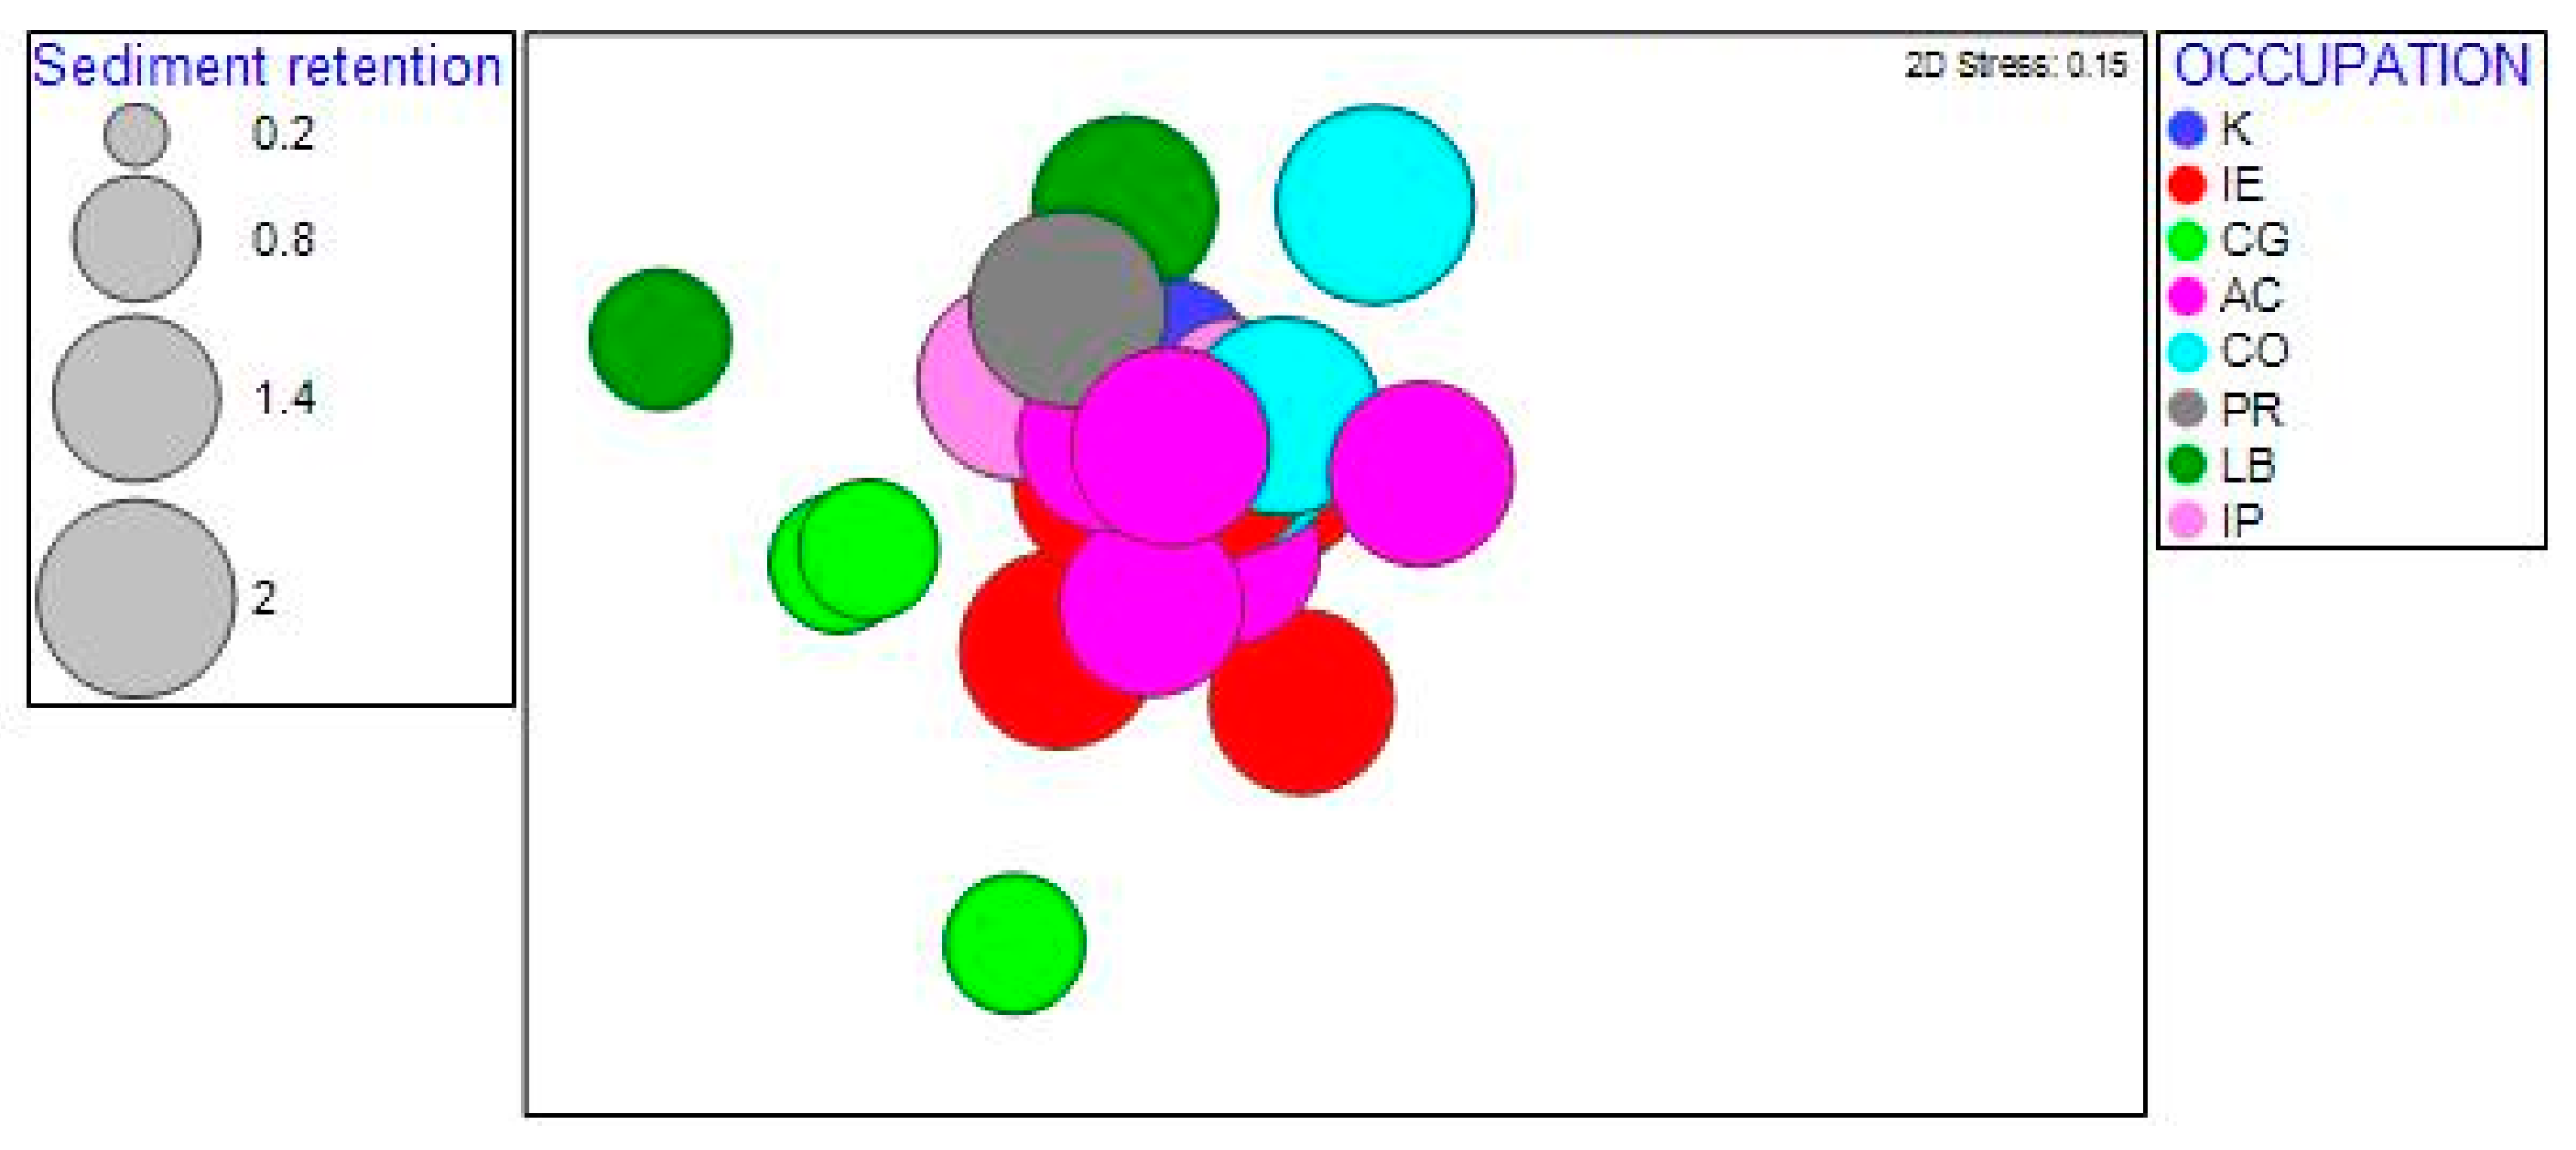
Sediment retention was the top factor in contributing to dissimilarities in these two groups (7.83%) (Figure 10), with Conservation Organisations rating sediment retention more highly than Community Groups a service of mangroves. The second largest dissimilarities were seen between Local Board and Auckland Council (27.59%). The top factor driving dissimilarities was carbon storage capacity (15.61%). Auckland Council ranked carbon storage capacity as being more important than Local Boards did.
Table 6 shows the significant pairwise differences, and contribution of dissimilarities of all significant groups, with the top two factors for each pair. For a full output, see Appendix B.2. There were no significant differences between participant responses and age or gender or interactions of all three factors (“Occupation”, “Gender” and “Age”.

3.2.2. Issues Affecting New Zealand’s Mangroves

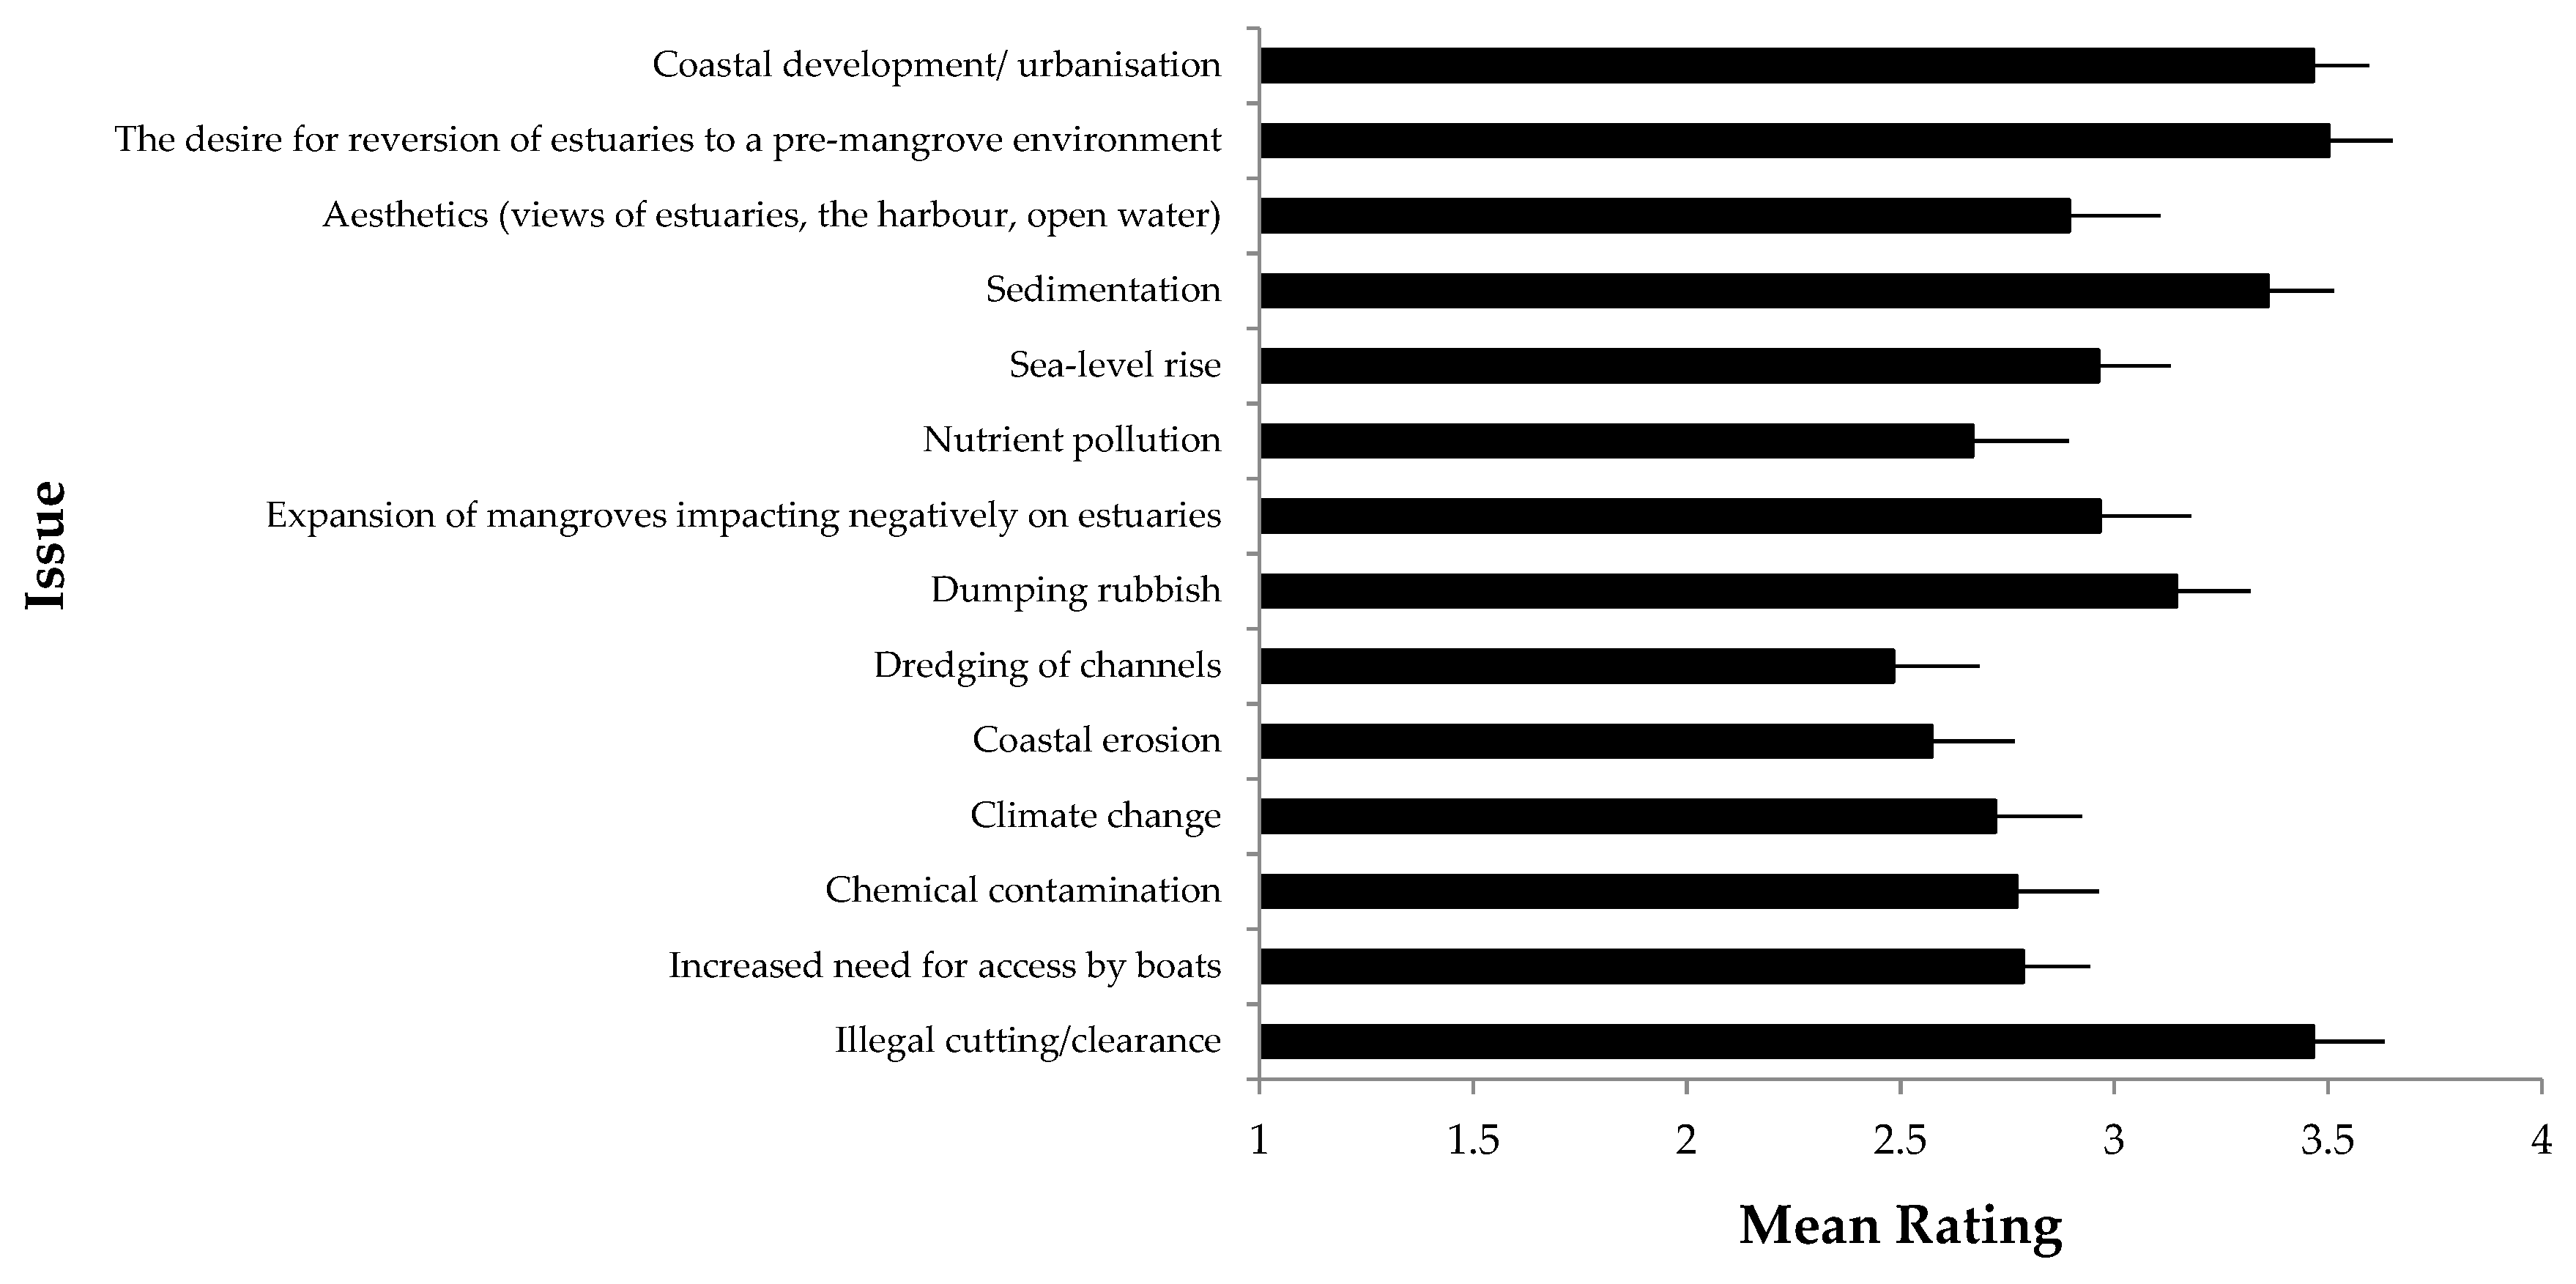
The highest rated issue facing mangroves was the desire for reversion of estuaries to a pre-mangrove state. This was followed by coastal development/urbanisation, illegal cutting and clearance. The lowest rated issue facing mangroves was the dredging of channels. 7% of participants listed the issues of mangroves in New Zealand facing chemical contamination, climate change and sea-level rise as “Don’t know”. Figure 11 shows the mean ranking of issues facing mangroves in New Zealand.
There were significant differences between occupations and the rating of issues affecting mangroves in New Zealand. PERMANOVA “Occupation”, F7, 27 = 2.009, p < 0.05. Pairwise comparisons showed that responses between Independent Ecologists with Community Groups, Auckland Council and Conservation Organisations were significantly different in their rating of issues. There were also significant differences between Community Groups with Auckland Council and Conservation Organisations and that of Auckland Council with Conservation Organisations. Table 7 shows groups with significantly different responses. For a full output, see Appendix B.3.
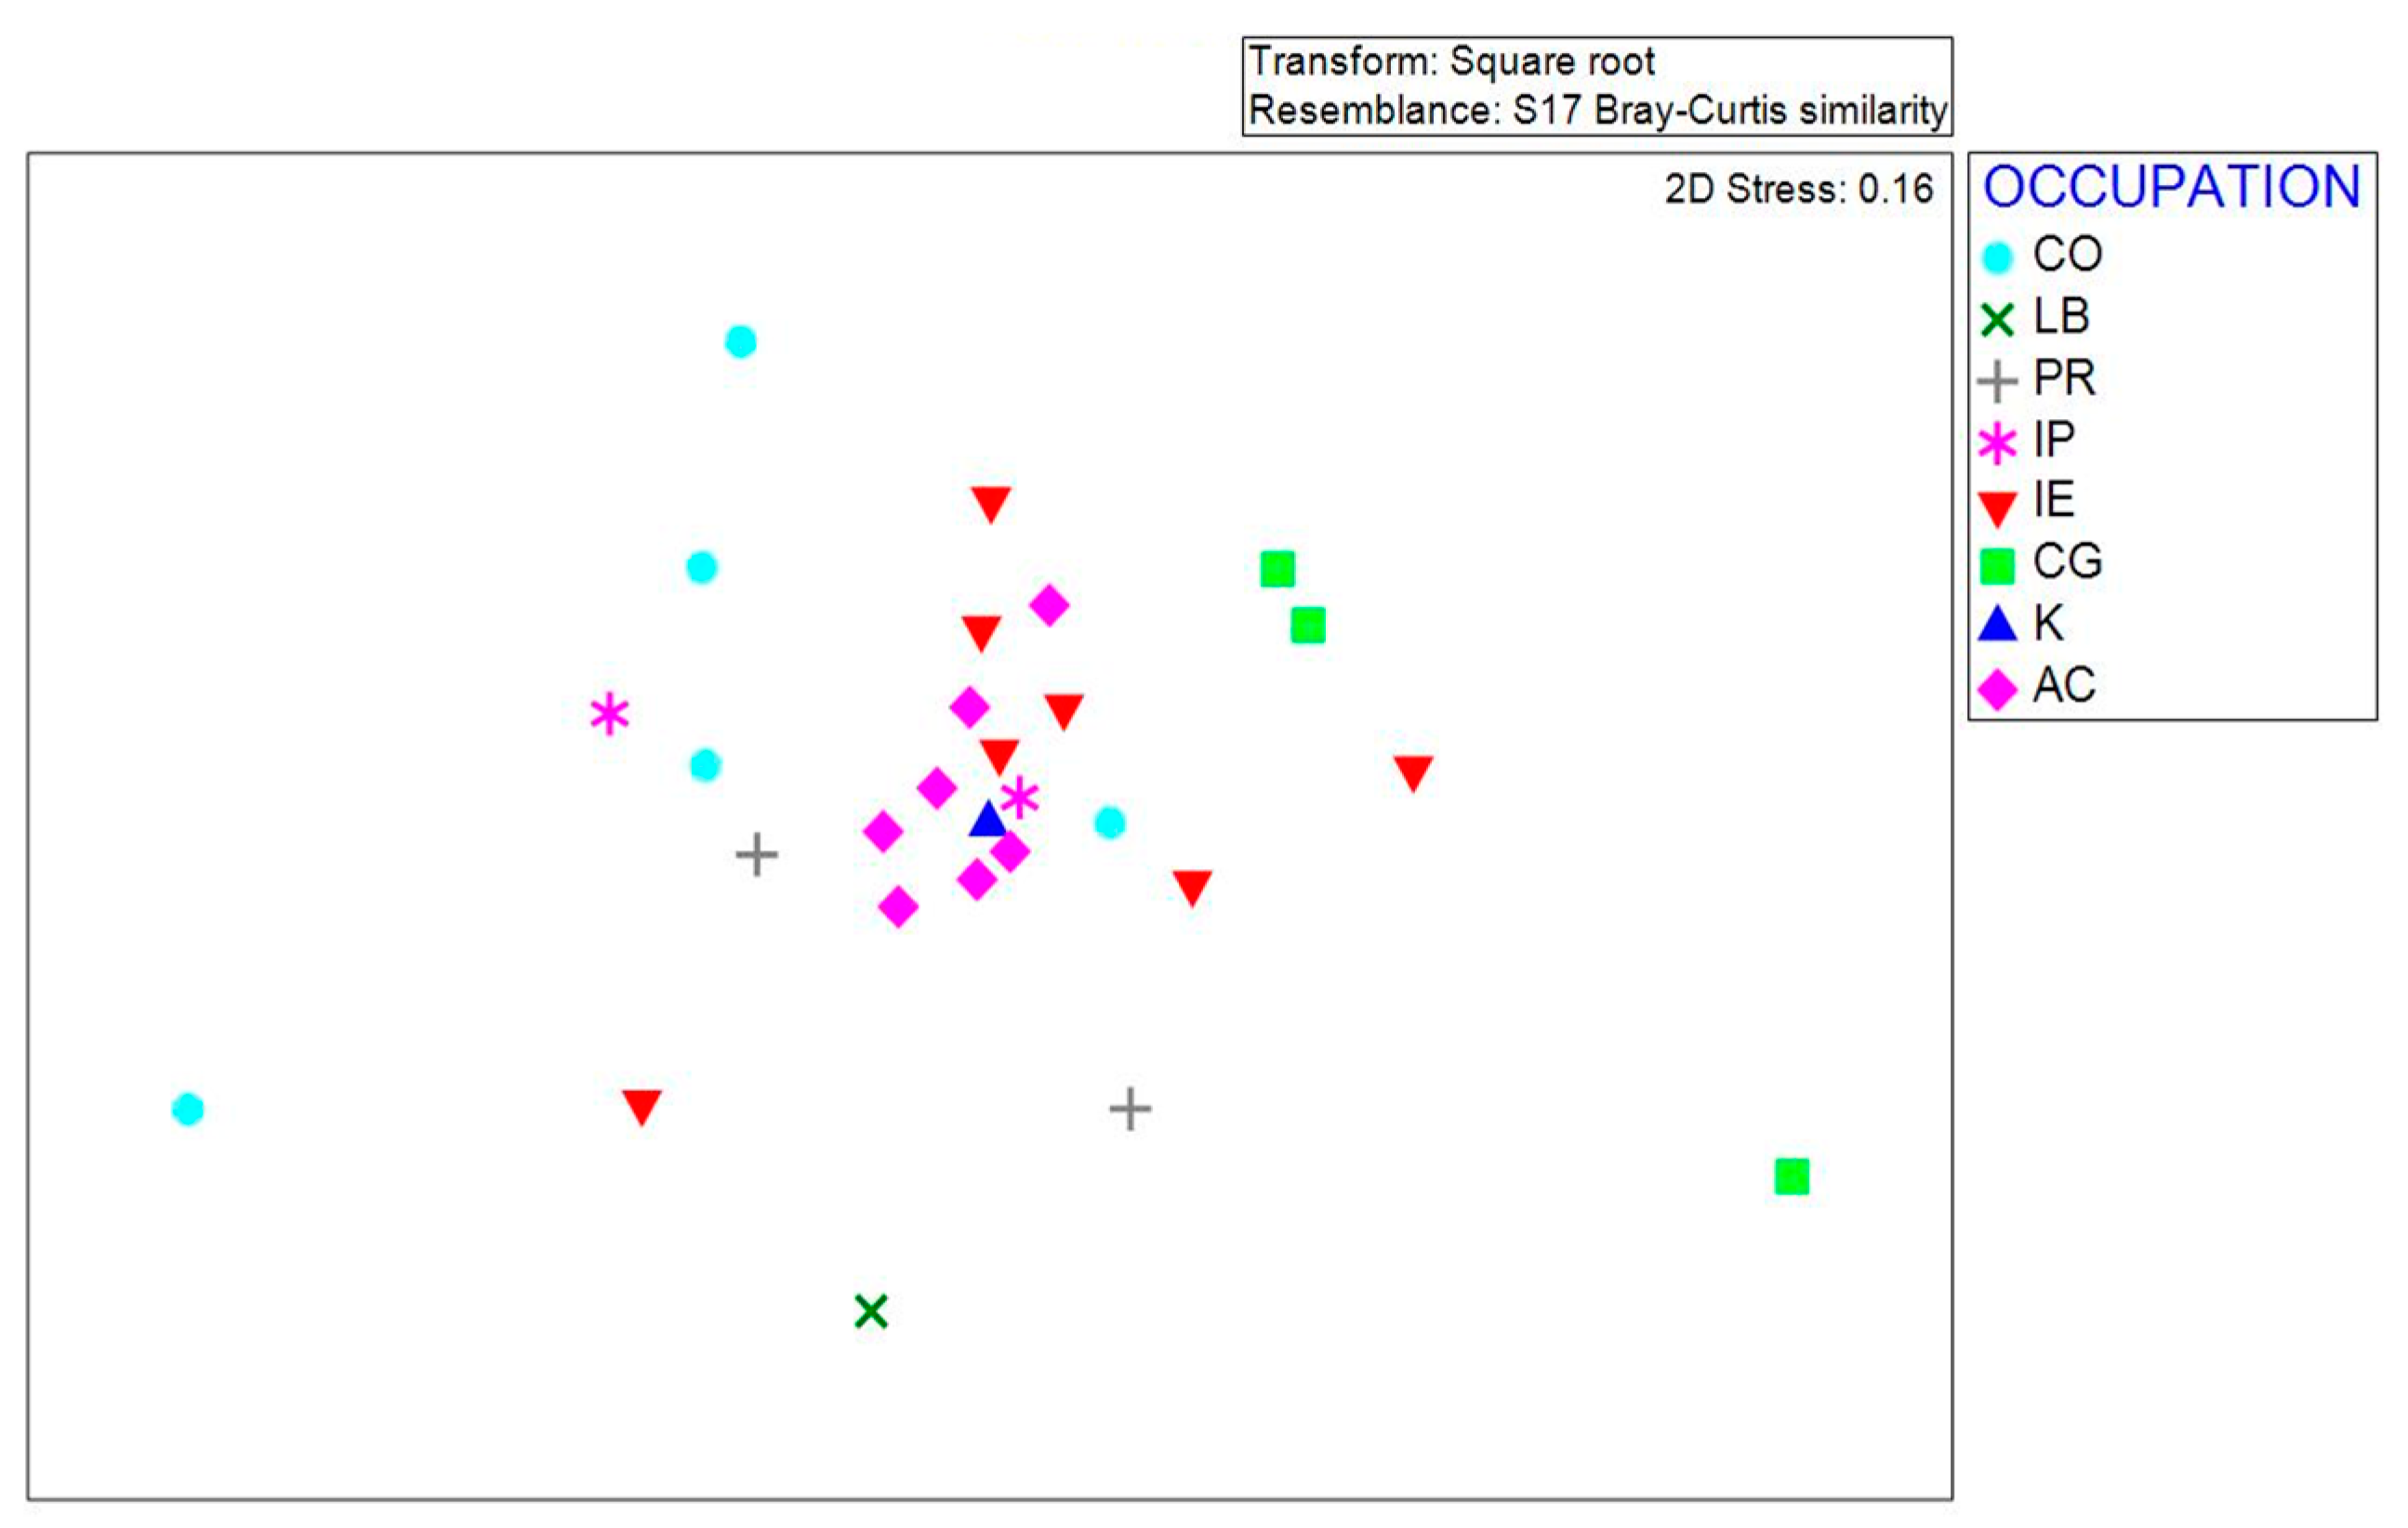
SIMPER analysis showed that the greatest dissimilarity between groups lay between Community Groups and Conservation Organisations (18.55%) with the second most between Community Groups and Independent Ecologists (13.77%). The non-metric multidimensional scaling (nMDS) shows the spatial differences between groups in terms of ranking issues affecting mangroves (Figure 12).
Table 8 shows pairwise differences, and contribution of dissimilarities of all significant groups, with the top two factors for each pair. For a full output, see Appendix B.4.
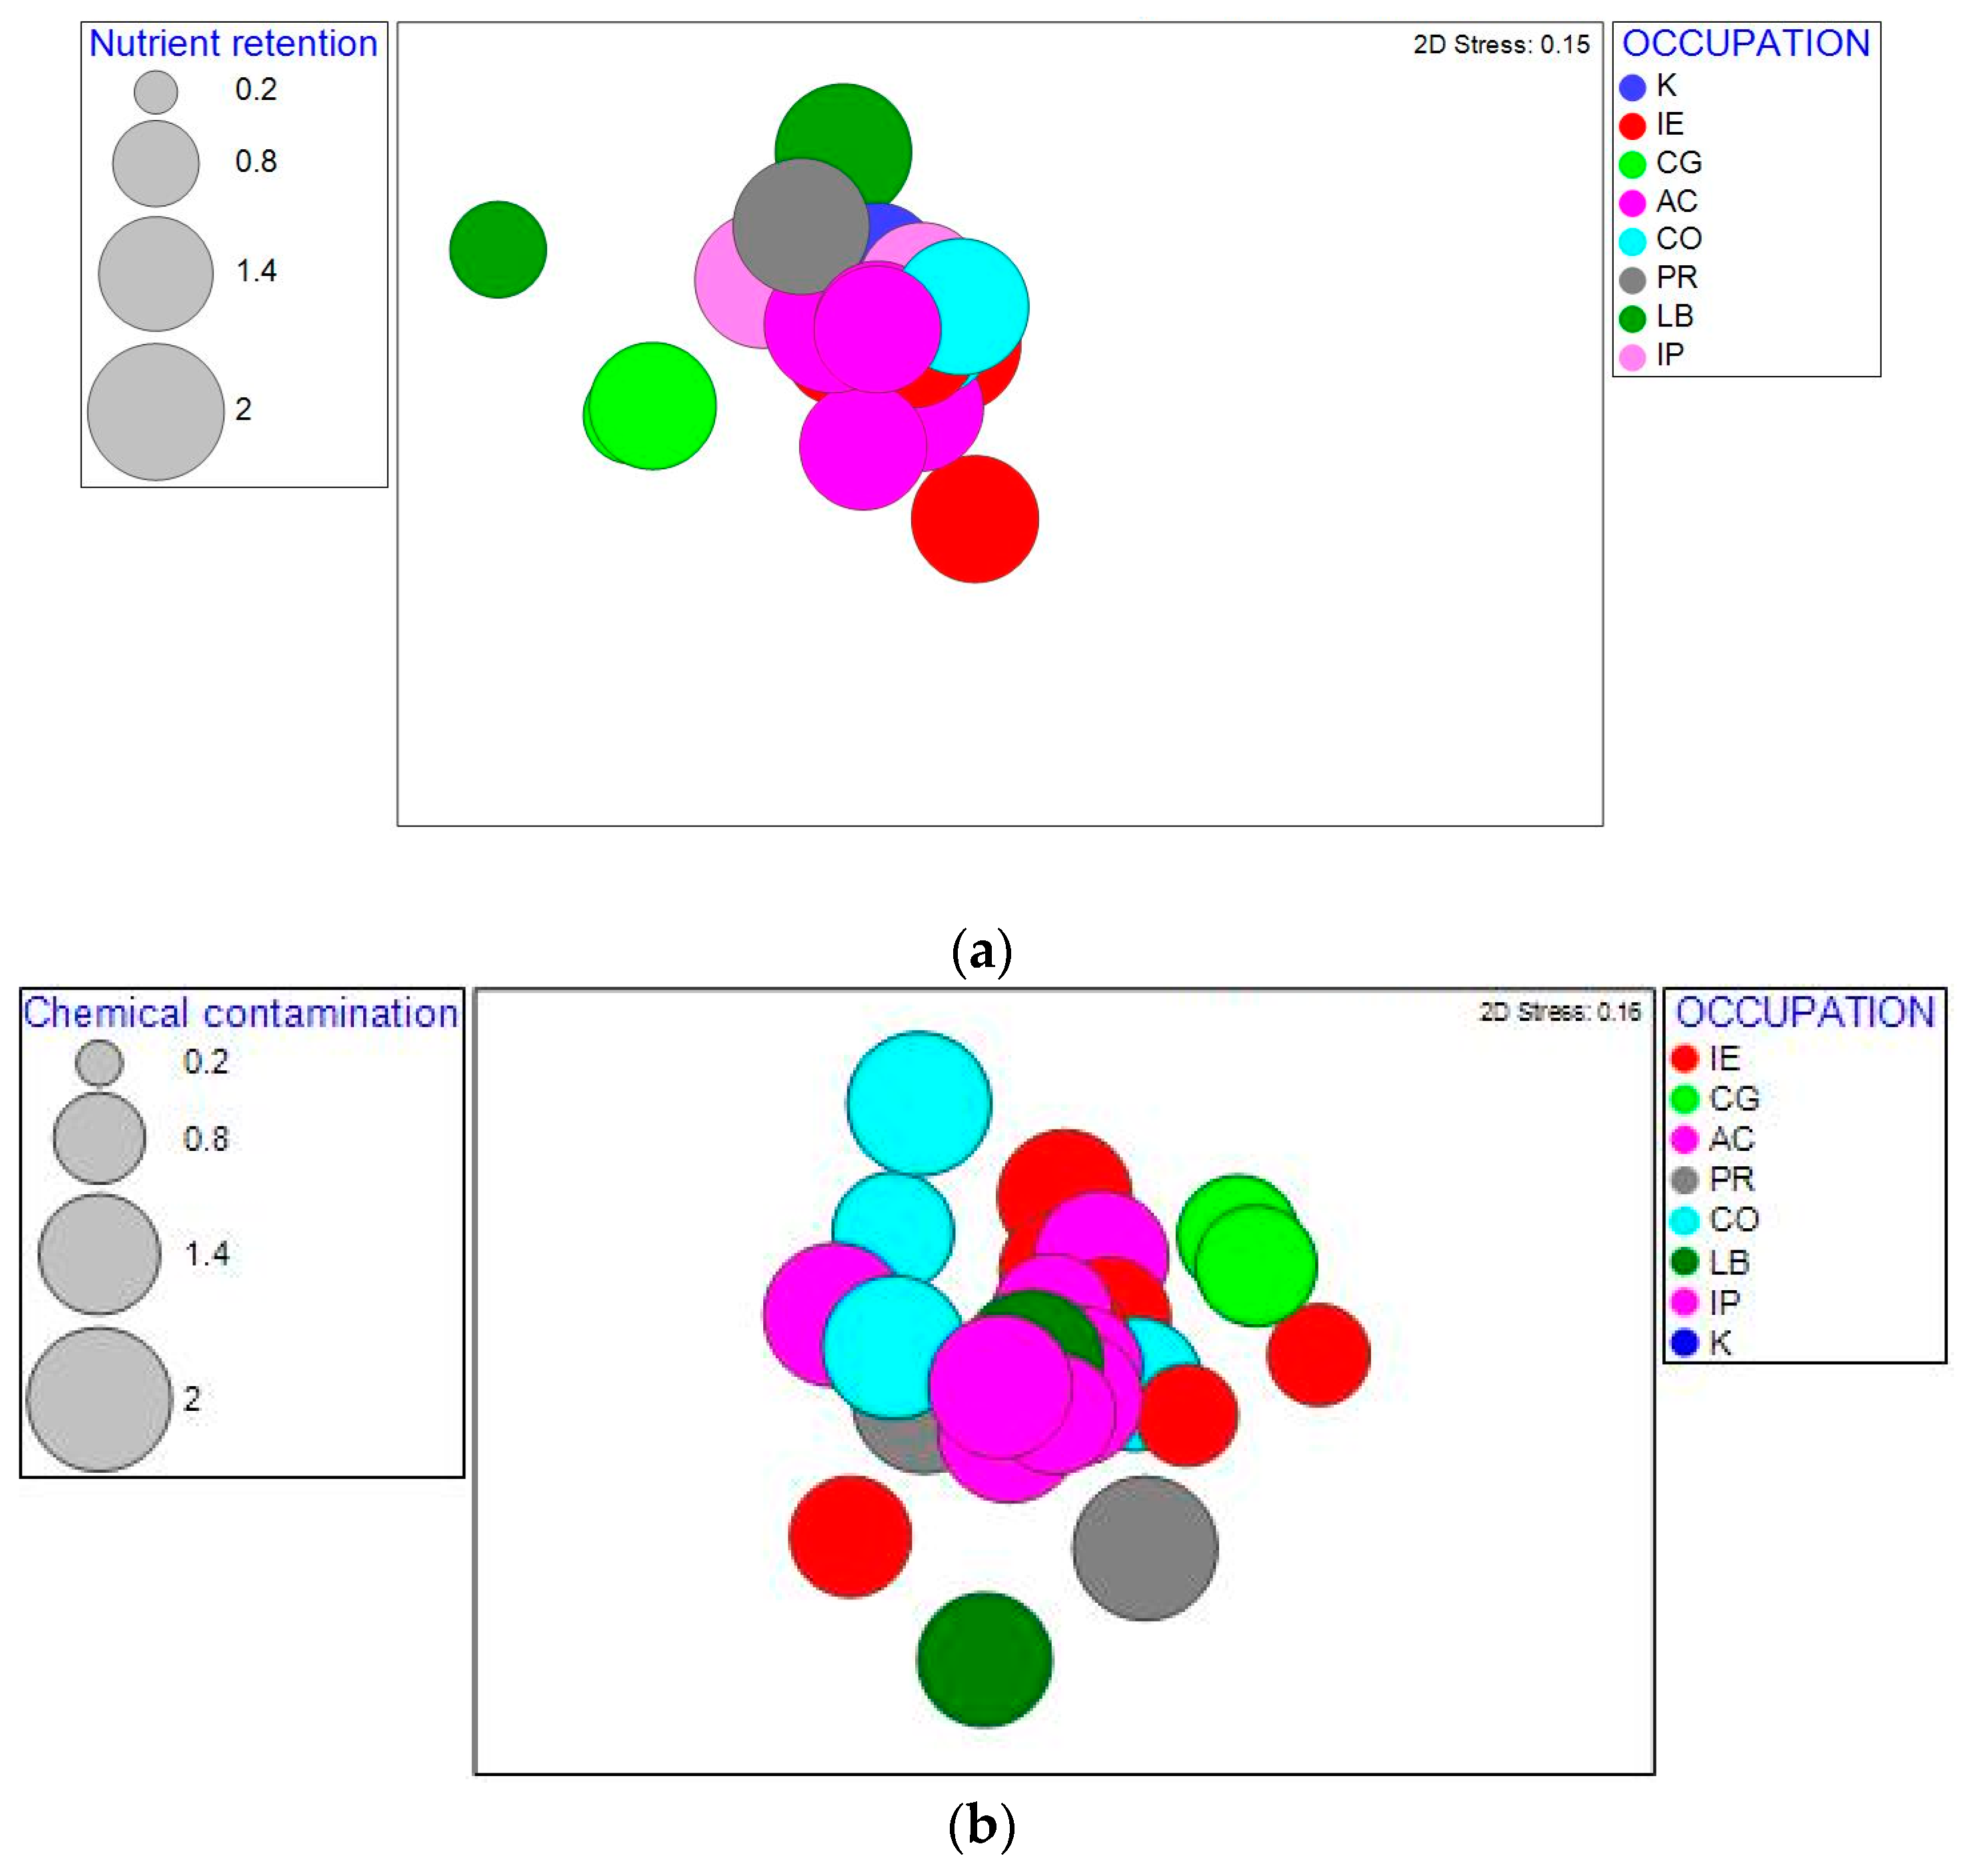
MDS bubble plots show the distribution of two of the top factors driving dissimilarities between groups of (a) nutrient pollution and (b) chemical contamination (Figure 13a,b).

3.3. Q-Sort

Two factors were found after Varimax rotation for significant subject loadings. Factor 1 explained 35% of the variance and Factor 2 explained 19%. Giving a total of 54% of total variance explained. Table 9a shows Factor 1 extreme statements with high and low Z-Scores and Table 9b shows Factor 2 extreme statements.
Factor 1 exhibited a pro-protection attitude towards mangroves. Ten participants loaded positively onto this factor. They agree strongly that mangroves are important for a variety of wildlife and that sedimentation and wider catchment issues need to be addressed before we remove mangroves. They did not think that expansion of mangroves has created a negative impact. They strongly disagree that mangroves do not have any ecological value. One participant loaded strongly negatively onto this factor, they do not agree with any of these statements.
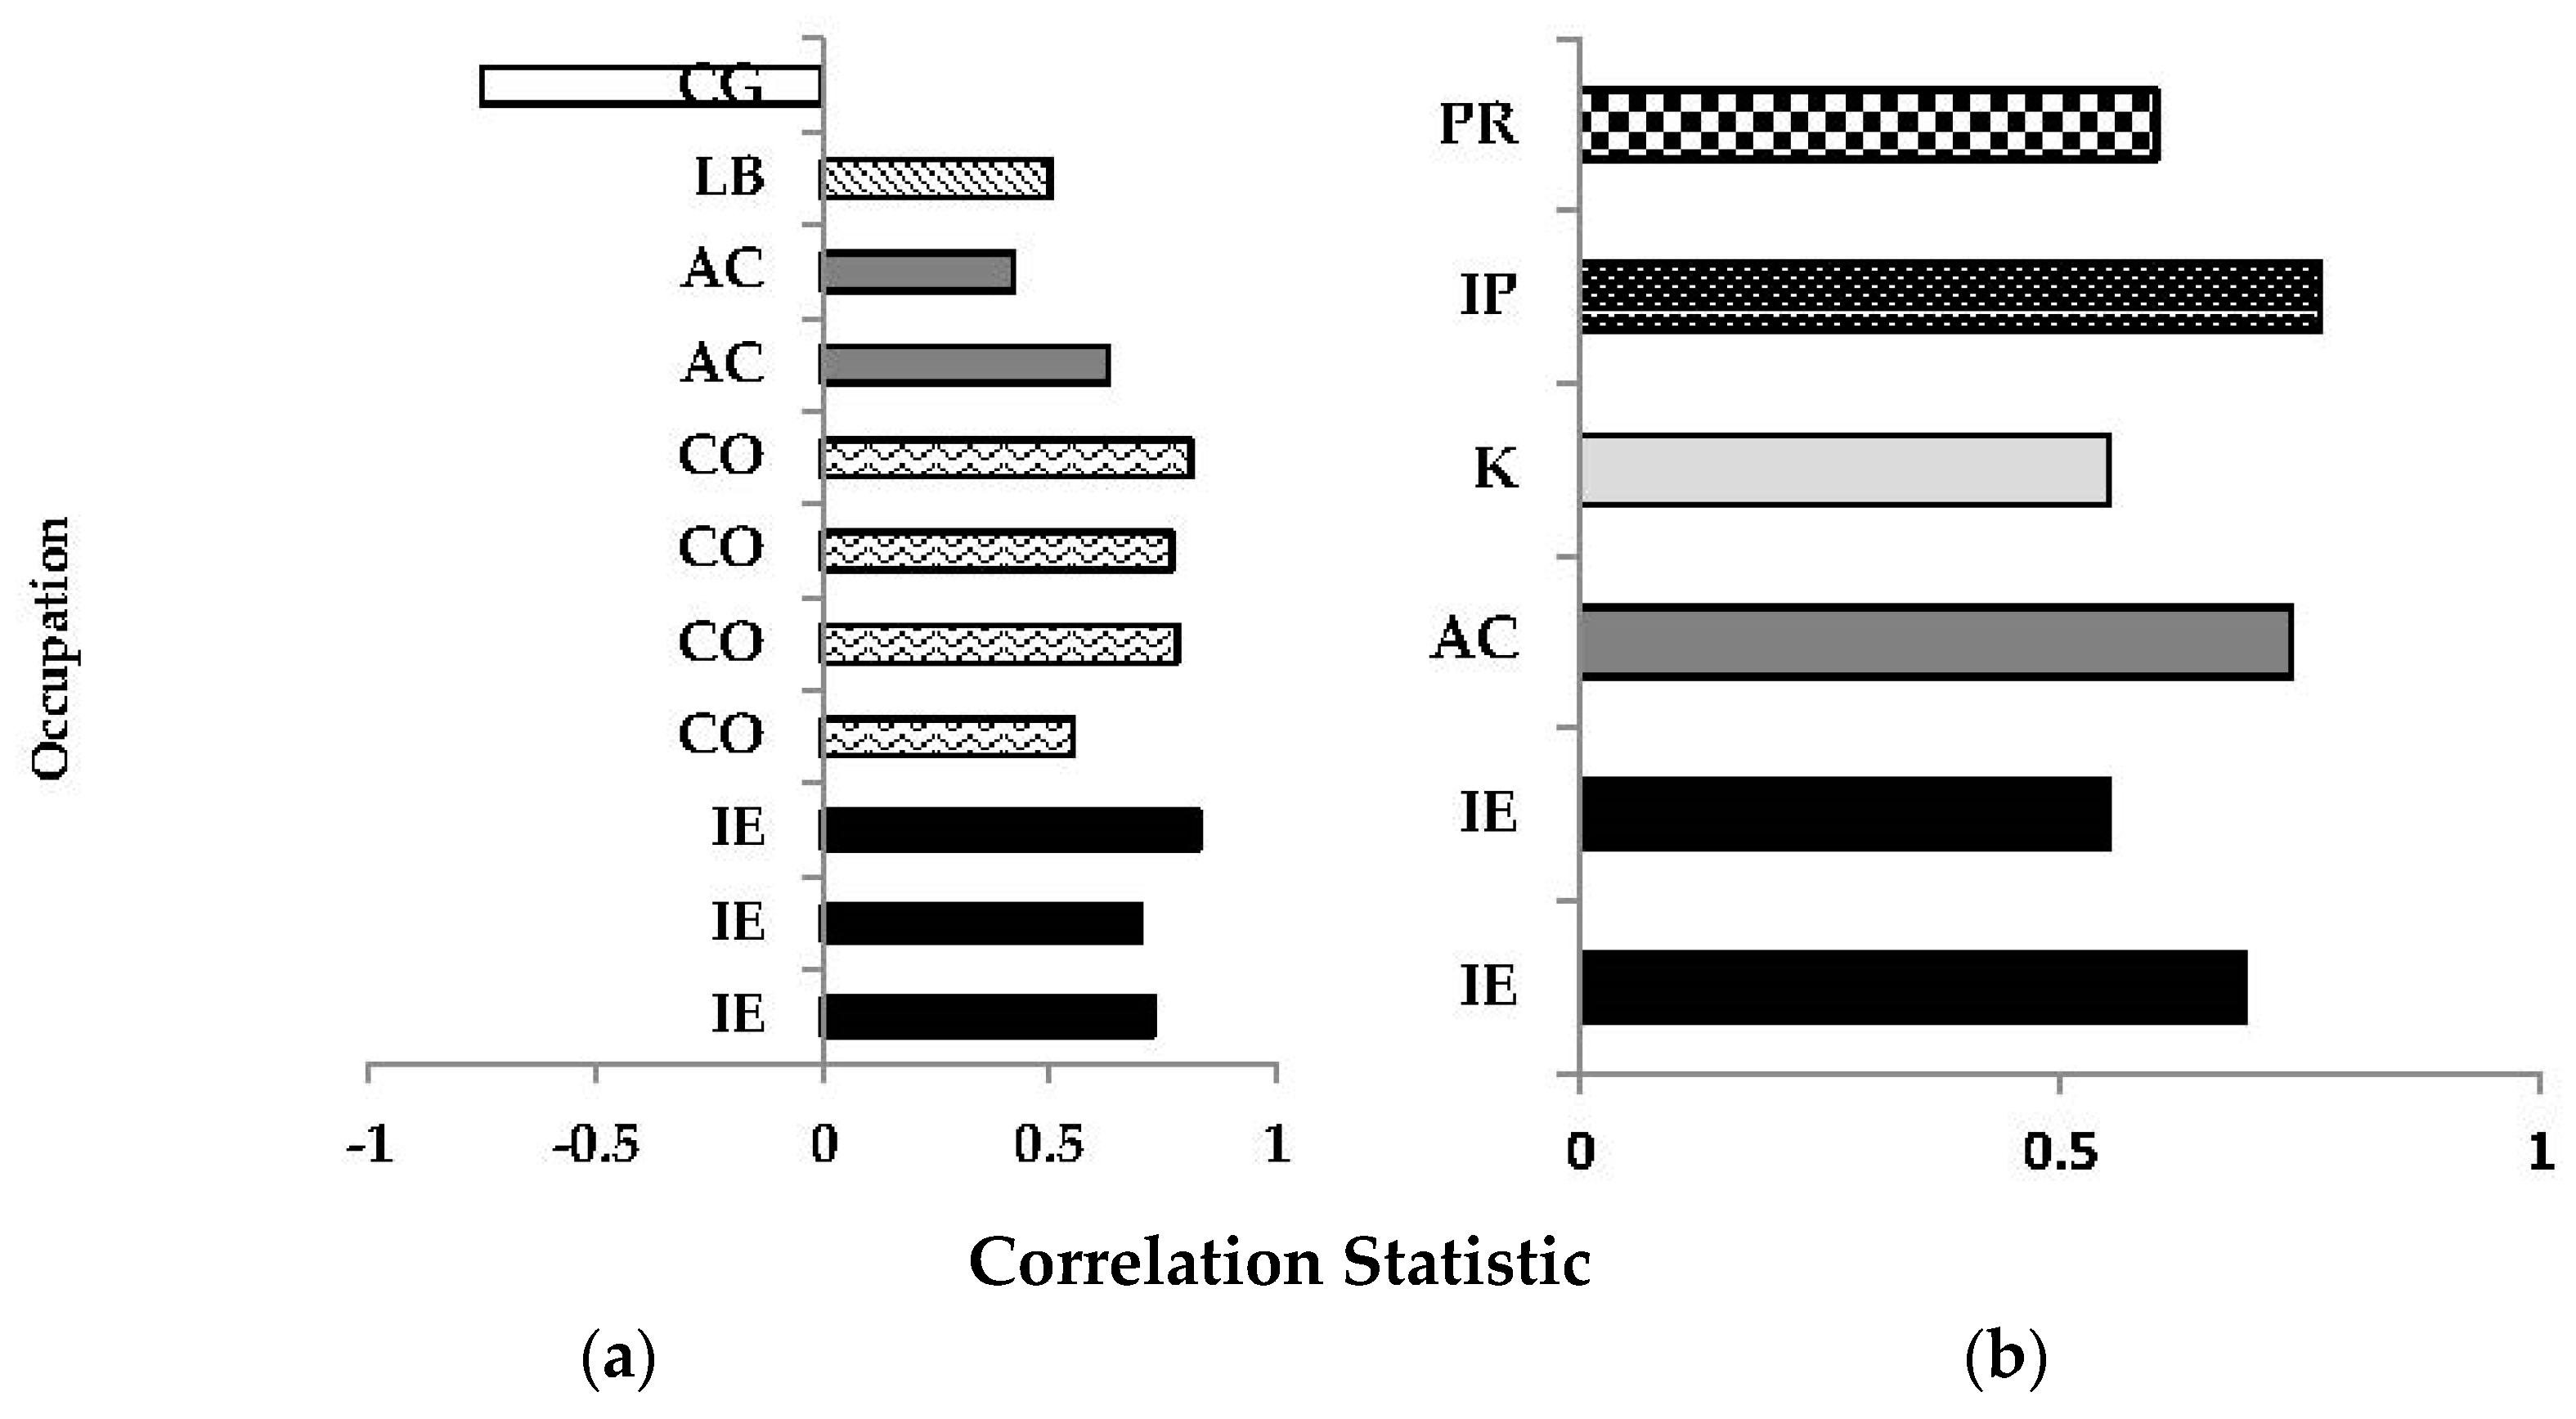
Factor 2 exhibited more of a neutral view towards mangroves. Of the six participants loading onto this factor, all agreed that sedimentation and nutrient run-off should be addressed to slow the growth of mangroves. They wanted more monitoring on contaminants and water quality, but also thought that mangroves do replace mudflat in some areas. Participants disagreed that mangroves should be preserved as much as possible for carbon storage. They also disagreed that nothing of any ecological value lives in a mangrove.
Participants loading highly onto the factors were linked to their occupations to see if any patterns existed with attitude and perception and occupation. The majority of participants who loaded strongly onto factor one were the Conservation Organisation members (n = 4), followed by the Independent Ecologists (n = 3). Two members from Auckland Council and one local board member also loaded significantly onto this factor. One Conservation Group member loaded onto this factor, strongly negatively (Figure 14a). Factor 2 participants were fewer (n = 6), from a wider range of occupations. Two Independent Ecologists, one Kaitiaki, one Park Ranger, one Independent Planner and one Auckland Council employee. The Independent Planner and Auckland Council employee loaded the highest onto factor 2 (Figure 14b).

4. Discussion

The results from the mixed methods analyses revealed many differences and similarities between the perceptions and attitudes of participants towards mangroves. It was known previously that polarity existed on the issue of preserving or removing mangroves in New Zealand [9]. This study reinforces the idea that considerable disparity exists in the perspectives of stakeholders and interested parties towards mangroves. It also highlights that many people are aligned in some of their opinions, possessing more of a neutral point of view to the issues of mangrove preservation and removal, in addition to the two extremes.

4.1. Polarity in Perceptions and Attitudes

It became apparent that the largest differences in perceptions and attitudes were between the Community Groups, who are generally advocates of mangrove removal, and the Conservation Organisations, who wanted mangroves preserved. Community Groups were of the mind-set that mangroves in New Zealand do not possess the ecosystem services which mangroves elsewhere possess. Indeed, temperate mangroves have lower diversity in terms of tree species and no organisms are obligate inhabitants of temperate mangroves [41], however, their importance as part of coastal ecosystems should not be overlooked. The perceived value of New Zealand’s mangroves held by these two groups contrasted dramatically. Community groups held other habitats in higher regard than mangroves, seeing them as having very little benefit to humans or nature.
Their presence has only been detrimental”.
(CG3)
Conversely, Conservation Organisations viewed mangroves in New Zealand as having a plethora of positive roles in coastal ecosystems.
Yes, there’s no question that mangroves are beneficial, they offer so many benefits …”.
(CO5)
In addition to the transcripts revealing such a contrast between these two groups, SIMPER analyses of both ecosystem services and issues facing mangroves exemplified differences between these two groups. The importance of sediment retention properties of mangroves in New Zealand was the biggest dissimilarity in ecosystem service raised between these groups. This was reinforced by the transcript data, where the Conservation Organisations widely-accepted sedimentation as the main reason for mangrove expansion at the four sites, seen as a positive service due to mangrove roots holding the sediment in place. One Community Group member did not accept that mangrove expansion was due to sedimentation caused by human-induced land-changes; however, this was the general consensus from all other participants and in the literature [4,5,6].
Nutrient retention as a service and nutrient pollution as an issue facing mangroves also drove dissimilarities between Community Groups and Conservation Organisations. Nutrient retention, along with sediment retention was rated the highest ecosystem services of mangroves in New Zealand as averaged by all groups. New Zealand mangrove sediments store considerable amounts of nitrogen, with removal likely to result in significant alterations in coastal nitrogen stocks [42]. However, there is considerable heterogeneity between sites. A recent study by Gritcan et al. (2017) showed that nitrogen and phosphorous levels were significantly higher in mangroves in Manukau Harbour, Auckland, New Zealand than at two other mangrove sites (Mangawhai and Waitemata) [43].
All Conservation Organisation participants who were part of the Q-sort loaded significantly (and positively) onto Factor 1 in the Q-analyses. This Factor was identified as a ‘Pro-preservationist’ attitude, with high importance placed on the habitat value for a variety of species and a strong disagreement with any aesthetic reason for removal or lack of ecological value. All Conservation Group members (n = 1) who conducted the Q-Sort loaded significantly (and negatively) on this factor, strongly disagreeing with statements in this group. This further demonstrated the disparity between these two groups. Table 10 shows a joint display of disparity between Community Groups and Conservation Organisations from all aspects of this study.

4.2. Role of Mangroves in New Zealand and at Sites

Over two-thirds of participants saw mangroves as playing an important role in the coastal ecology of New Zealand. Reasons for importance included mangroves being an “important part of estuarine ecosystems” and “providing an important ecological role”. Mangroves were described as “native” to New Zealand by the majority of participants; however, others saw them as “invasive” and “choking up estuaries” (CG1, CG2, CG3, K2, K5, PR1). Mangroves are indigenous to New Zealand [8], however, their expansion into estuaries where they did not exist previously has created issues [6]. All participants agreed that expansion had occurred at the four sites (prior to any removals). This shifted the opinion of mangroves for some, from positive to neutral or negative. The modification of these areas through urbanisation and industrial practices was seen as a cause of expansion, which in turn has changed the character of some coastal areas, affecting navigation and recreational usage. The value of all habitats was recognised by many participants. “I think that all habitats have their own values and I value all of them” (AC1). The idea of connectivity between habitats such as saltmarsh, mudflat and mangrove, to create a mosaic of landscapes, instead of wholesale removal of any one habitat was seen as important to sustain the health of coastal ecosystems.

4.3. Social Divides

The rapid change in landscape through human-induced land alterations in the Manukau Harbour, over one generation, is at the core of the community drive to remove mangroves. “The Manukau Harbour is the area where we get the most complaints about mangroves” (AC1). Coastal development/urbanisation and desire for the reversion of estuaries to a pre-mangrove state were ranked the top issues facing mangroves overall. Expectations that mangrove removal will result in the reversion to previous beaches is unrealistic in many cases, as recovery towards a sand flat environment can take over a decade and is dependent on geophysical factors such as tidal flushing, rates of sedimentation and erosion [44]. Removing mangroves for aesthetic reasons alone was not seen as a viable reason by the majority of participants, however a few thought that people would “rather see a view of the water than mangroves” (CG1, CG2).
Launching of waka was viewed as a legitimate reason for mangrove removal by participants. Recommendations included that removal should be small scale and specific to a purpose. Much of the issue with removal was the long-term investment required to keep mangroves from re-establishing, community buy-in and realistic expectations were seen as imperative to applications for removal. Due to removal being an ongoing practice, a cost-benefit analyses is recommended to be conducted for each proposed removal site [45].

4.4. Ecological Divides

Ecological values of mangroves were diverse, from sediment retention properties, to providing a habitat for wildlife. Factor 1 participants in the Q-analysis strongly agreed that mangroves are important for a variety of wildlife. The trade-off between mangroves providing habitat for bird species requiring cover, such as the Banded Rail, versus mudflats as a habitat for wading birds was spoken about by all groups. “You’ve got a competition issue if you’ve got mangrove habitat, you don’t have wading birds, …, so there’s a balance there” (AC1).
Carbon storage capacity was a key service rated by Auckland Council participants and Independent Ecologists. In the Q-analysis, the preservation of mangroves based on the ability to sequester large amounts of carbon was disagreed with by Factor 2 participants, who adopted more a neutral view towards mangrove preservation. The ability of mangrove sediments to store large amounts of carbon is becoming widely recognised internationally [46,47] and studies in New Zealand mangroves have shown that this is an important ecosystem service [42,48].
The ecosystem services little known about were the medicinal properties of the New Zealand grey mangrove and whether it can be used as a source of wood/fuel/building materials. Avicennia marina leaves are used in some traditional medicines in the treatment of small pox, ulcers and rheumatism across the world [49]. There has been no direct utilisation of the subspecies in New Zealand for fuelwood, charcoal or timber [50,51]; however, it has been documented that boat-builders used the wood for shaping of the bow and stern post-colonisation in New Zealand [7].

4.5. Kaitiaki

All Kaitiaki saw the issue of mangrove expansion and subsequent removal from an all-encompassing, holistic perspective. The long-term nature of removal was spoken about, recognising that continued maintenance and management are required. Expansion was seen as a “natural response to an unnatural situation” (K3) There was a strong objection to further removal of mangroves at one site, until more monitoring on sediment flushing and contaminants held in mangrove sediments is carried out (K1). Chemical contamination was a driving factor for dissimilarity between other participants, with Auckland Council and Conservation Organisations ranking this as an important issue affecting mangroves.
Kaitiaki strongly disagreed that aesthetics was an important reason for removal. “The resource should be the priority, not the person”. (K3)
Priority for kaitiaki was water quality, restoring kaimoana (seafood) habitat and waka access (K1, K2, K4, K5). Tipping points in terms of pollution affecting biodiversity of fish and harming wairua (spirit) of the harbour was spoken about. Some thought that there were bigger issues at hand to deal with than removing mangroves (K1, K3, K4). Overall restoration of the degraded environments surrounding the coast of the Manukau was an important goal, as well as recognising that mangrove expansion was a wider problem, related to land-use change including rural practices and industrialisation. This is a view reflected in the literature as part of kaitiakitanga (guardianship); the responsibility to maintain both the well-being of humans and natural resources [17].

4.6. Design, Recommendations and Future Directions

This innovative mixed methods design allowed for an in-depth evaluation of perceptions and attitudes towards mangroves in New Zealand, with a specific focus on sites in the Manukau Harbour, Auckland. Combining semi-structured interviews with scale ratings and Q-methodology could be applied to the investigation of many social-ecological systems. Each method revealed specific information, which was reinforced and triangulated with the results of the others. The process of gathering information, interviewing and analysing the data was lengthy. Although the sample size was small, it was adequate to provide an in-depth look at the social-ecological trade-offs between removing and preserving mangroves at these sites, and in a wider context. The nature of conducting such research is that sample size is not guaranteed; however, it should be determined by the aims of the research [52], which this study justified. However, these are the opinions of a small section of society, who have particular vested interests in mangrove preservation and removal. The perspectives of the general public or members of local communities living in the areas where mangroves have expanded are recommended to be investigated through, for example, online surveys. Although this method would lose some of the rich data provided by semi-structured interviews, it would reach a wider audience and allow for more robust statistical analyses.
Recommendations flowing from this study are that more communication is required between all stakeholders when an application for mangrove removal is lodged. Knowledge based on research, with realistic expectations after removal, investment from the community and long-term ecological monitoring is a necessity for coastal sustainability. Increased awareness and a holistic understanding of wider catchment area issues is required prior to any application for mangrove removal. Indeed, this applies in a more general context to other social-ecological systems globally. We require effective consultation with a wide-range of stakeholders and interested parties, including the understanding of cultural knowledge, values and holistic perspectives on how to protect our environment. There will always be trade-offs in the removal of an ecosystem. Balancing social and ecological aspirations to benefit both humans and nature is imperative for future livelihoods.

Author Contributions

A.M.D.-B. conceptualized, wrote, analysed and evaluated the study. Interviews, transcript writing and editing were conducted by A.M.D.-B. A.C.A. and S.M. supervised the study, assisted with the design and reviewed and edited the paper.

Funding

Funding was provided by Auckland University of Technology (interview software, audio recorder). This research received no external funding.

Acknowledgments

Thank you to Margaret Brown and John Perrott for advice in working with kaitiaki, Andries Meinties, Iana Gritcan and Rebecca Jarvis for trialing the Q-sort and to all participants, without whom this study would not have been possible.

Conflicts of Interest

The authors declare no conflicts of interest.

Appendix A

Questions for Semi-Structured Interviews

Theme 1: Presence of mangroves in New Zealand
  • Do you think mangroves are part of the natural landscape in New Zealand?
  • What are your opinions on mangrove presence in New Zealand (in general) and why?
  • What are your opinions on mangrove presence in Pahurehure inlet 2/Mangere/Puhinui Waimahia inlets and are these different to those above? (If so, why?)
Theme 2: Importance of mangroves in New Zealand
  • Do you believe mangroves in New Zealand (in general) have an important role in coastal ecosystems?
  • Do you think that mangroves have an important role in the coastal ecology of Pahurehure inlet 2/Mangere/Puhinui/Waimahia inlets? If so, why? If not, why?
  • What coastal habitats do you value the most and why?
Theme 3: Expansion of mangroves
  • Do you think mangroves have expanded, remained the same in area or retracted (at Pahurehure inlet 2/Mangere/Puhinui/Waimahia inlets)?
  • Why do you think mangroves have expanded/remained the same/retracted in these areas?
  • What effects do you think this has had on the ecology of these areas?
Theme 4: Current and future consultation process
  • What was the level of consultation you had for the resource consent(s)?
  • What was your role (if any) in the resource consent hearing for Pahurehure Inlet 2?
  • Were your opinions accurately portrayed in the hearing/written report you submitted (if applicable)?
  • What needs to be improved in the future in terms of the consent process?
Theme 5: Mangrove management
  • What are your opinions on current mangrove management? At Pahurehure inlet 2/Mangere/Puhinui/Waimahia inlets? In New Zealand as a whole?
  • Do you think anything needs to be done regarding the presence of mangroves at Pahurehure inlet 2/Mangere/Puhinui/Waimahia inlets? In New Zealand as a whole?
  • What (if any) management recommendations do you have?
  • What do you think the future holds for coastal environments in Pahurehure Inlet 2/Mangere/Puhinui/Waimahia inlets in terms of balancing human interest and the health of our estuaries and open water?

Appendix B

Appendix B.1. PERMANOVA Output of Pairwise Comparisons between Occupations and Ranking of Mangrove Ecosystem Services

Table A1. PAIRWISE TESTS. Term ‘OC’.
Unique
GroupstP (perm)perms
K, IE1.21710.29836
K, CG2.38980.10510
K, AC1.06820.38628
K, CO0.886150.37121
K, PR1.1180.6323
K, LB1.26820.3323
IE, CG2.93610.011120
IE, AC1.18640.197780
IE, CO1.51320.023547
IE, PR1.22470.20836
IE, LB2.14070.0336
IE, IP0.975510.53136
CG, AC3.17790.01484
CG, CO2.3050.01656
CG, PR2.11640.10410
CG, LB1.72550.110
CG, IP1.72030.08810
AC, CO1.57610.011408
AC, PR1.23850.24128
AC, LB2.24480.03528
AC, IP1.01840.53328
CO, PR1.21130.28821
CO, LB1.56380.15121
CO, IP0.688610.80421
PR, LB1.11510.6823
PR, IP0.6561513
LB, IP0.861780.6593

Appendix B.2. SIMPER Output for Significant Pair Comparisons of Dissimilarity in Rating of Mangrove Ecosystem Services

Table A2. Groups IE & LB. Average dissimilarity = 26.90.
Group IEGroup LB
SpeciesAv.AbundAv.AbundAv.DissDiss/SDContrib%Cum.%
Carbon storage capacity1.6404.046.315.0315.03
Medicinal properties0.291.52.881.8710.7225.75
Food sources1.6412.641.359.8135.56
Water quality maintenance1.620.712.561.279.545.07
Fish habitat1.2812.521.49.3754.44
Supporting offshore and nearshore fisheries1.370.52.341.718.763.14
Nutrient retention1.371.51.621.236.0269.15
Source of wood/fuel/building materials0.711.371.531.075.6874.83
Table A3. Groups IE & CG. Average dissimilarity = 25.65.
Group IEGroup CG
SpeciesAv.AbundAv.AbundAv.DissDiss/SDContrib%Cum.%
Medicinal properties0.291.052.431.389.479.47
Cultural value1.380.82.251.328.7518.23
Sediment retention1.8512.235.188.6826.9
Nutrient retention1.370.912.221.168.6535.56
Storm buffering1.8112.135.128.2943.85
Wildlife habitat1.7211.894.87.3551.2
Supporting offshore and nearshore fisheries1.3711.691.696.6157.81
Food sources1.6411.684.246.5364.34
Fish habitat1.2811.481.555.7870.12
Table A4. Groups CG & AC. Average dissimilarity = 27.19.
Group CGGroup AC
SpeciesAv.AbundAv.AbundAv.DissDiss/SDContrib%Cum.%
Nutrient retention0.911.492.291.158.418.41
Cultural value0.81.582.231.298.2116.61
Wildlife habitat11.822.075.527.6124.22
Storm buffering11.822.066.267.5831.8
Medicinal properties1.050.81.971.247.2439.04
Sediment retention11.781.958.337.1646.21
Fish habitat11.721.7836.5652.76
Carbon storage capacity1.141.821.732.686.3859.14
Recreational value (local)11.631.593.495.8564.99
Source of wood/fuel/building materials0.670.41.551.225.770.69
Table A5. Groups IE & CO. Average dissimilarity = 20.03.
Group IEGroup CO
SpeciesAv.AbundAv.AbundAv.DissDiss/SDContrib%Cum.%
Water quality maintenance1.621.22.211.1611.0511.05
Nutrient retention1.371.152.171.110.8321.88
Carbon storage capacity1.641.032.041.0110.232.07
Supporting offshore and nearshore fisheries1.371.551.831.019.1341.2
Fish habitat1.281.951.651.028.2449.44
Cultural value1.381.321.50.87.556.94
Source of wood/fuel/building materials0.711.051.461.217.364.25
Flood and water flow control1.631.491.40.796.9871.23
Table A6. Groups CG & CO. Average dissimilarity = 34.86.
Group CGGroup CO
SpeciesAv.AbundAv.AbundAv.DissDiss/SDContrib%Cum.%
Sediment retention11.62.735.087.837.83
Medicinal properties1.0502.721.37.8115.64
Water quality maintenance1.141.22.712.717.7723.41
Supporting offshore and nearshore fisheries11.552.63.947.4530.85
Nutrient retention0.911.152.61.257.4538.3
Fish habitat11.952.574.587.3745.67
Food sources11.892.443.786.9952.66
Wildlife habitat11.892.443.786.9959.65
Storm buffering11.442.313.276.6366.28
Carbon storage capacity1.141.032.291.696.5772.85
Table A7. Groups AC & CO. Average dissimilarity = 21.28.
Group ACGroup CO
SpeciesAv.AbundAv.AbundAv.DissDiss/SDContrib%Cum.%
Carbon storage capacity1.821.032.15110.0810.08
Water quality maintenance1.651.22.121.119.9520.03
Nutrient retention1.491.152.070.989.7429.77
Source of wood/fuel/building materials0.41.051.821.338.5538.32
Supporting offshore and nearshore fisheries1.271.551.791.118.446.72
Medicinal properties0.801.761.38.2955.02
Cultural value1.581.321.480.916.9561.97
Flood and water flow control1.651.491.430.826.7168.68
Sediment retention1.781.61.360.756.3975.06
Table A8. Groups AC & LB. Average dissimilarity = 27.59.
Group ACGroup LB
SpeciesAv.AbundAv.AbundAv.DissDiss/SDContrib%Cum.%
Carbon storage capacity1.8204.317.6215.6115.61
Water quality maintenance1.650.712.561.339.2824.89
Fish habitat1.7212.541.229.2234.11
Food sources1.5212.491.349.0443.15
Source of wood/fuel/building materials0.41.372.411.828.7451.89
Supporting offshore and nearshore fisheries1.270.52.111.677.6459.53
Medicinal properties0.81.51.91.326.8966.43
Nutrient retention1.491.51.621.325.8872.31

Appendix B.3. PERMANOVA Output of Pairwise Comparisons between Occupations and Rating of Mangrove Issues

Table A9. PAIRWISE TESTS. Term ‘OC’.
Unique
GroupstP(perm)Perms
IE, CG1.89860.019120
IE, AC1.76060.005762
IE, CO1.49450.051579
IE, PR1.12450.28136
IE, LB1.50690.10536
IE, IP1.23680.19936
IE, K0.652310.7438
CG, AC2.57780.01184
CG, CO2.15020.01956
CG, PR1.54430.10810
CG, LB1.67050.2210
CG, IP1.94280.10910
CG, K1.04580.5054
AC, CO1.44450.044411
AC, PR1.08640.34828
AC, LB1.78920.03628
AC, IP1.04840.27828
AC, K0.768640.8627
CO, PR0.999060.53121
CO, LB1.25460.2421
CO, IP0.49825121
CO, K0.693870.6616
PR, LB0.85410.6353
PR, IP0.625513
PR, K0.3054313
LB, IP1.3080.3243
LB, K0.5755713
IP, K0.5425313

Appendix B.4. SIMPER Output of Significant Pairwise Dissimilarities in Rating of Issues Facing Mangrove by Occupation

Table A10. Groups IE & CG. Average dissimilarity = 13.77.
Group IEGroup CG
SpeciesAv.AbundAv.AbundAv.DissDiss/SDContrib%Cum.%
Nutrient pollution1.430.671.831.2713.3213.32
Sea-level rise1.571.151.660.9512.0325.36
Climate change (more severe droughts, floods and storms)1.241.671.61.3111.5836.94
Illegal cutting/clearance1.841.241.431.7910.3547.29
Chemical contamination1.340.941.360.899.8657.15
Dredging of channels1.4711.081.317.8665.02
Coastal erosion1.410.941.916.871.82
Table A11. Groups IE & AC. Average dissimilarity = 9.84.
Group IEGroup AC
SpeciesAv.AbundAv.AbundAv.DissDiss/SDContrib%Cum.%
Climate change (more severe droughts, floods and storms)1.241.721.090.8911.111.1
Nutrient pollution1.431.6211.4810.221.3
Dumping rubbish1.561.790.911.149.2130.51
Coastal erosion1.41.820.881.788.9539.45
Chemical contamination1.341.720.851.338.6148.06
Sea-level rise1.571.960.831.38.3956.45
Dredging of channels1.471.60.811.248.2664.71
Aesthetics (views of estuaries, the harbour, open water)1.521.870.730.947.472.11
Table A12. CG & AC. Average dissimilarity = 13.68.
Group CGGroup AC
SpeciesAv.AbundAv.AbundAv.DissDiss/SDContrib%Cum.%
Nutrient pollution0.671.622.091.3815.2815.28
Sea-level rise1.151.961.810.9213.2128.49
Coastal erosion11.821.787.111341.49
Chemical contamination0.941.721.731.0312.6754.15
Illegal cutting/clearance1.241.961.51211.0365.19
Dredging of channels11.61.31.859.5374.72
Table A13. Groups CG & CO. Average dissimilarity = 18.55.
Group CGGroup CO
SpeciesAv.AbundAv.AbundAv.DissDiss/SDContrib%Cum.%
Nutrient pollution0.671.632.271.4512.2412.24
Chemical contamination0.941.432.031.1510.9523.18
Expansion of mangroves impacting negatively on estuaries21.151.982.7410.6633.85
Sea-level rise1.151.581.690.979.0942.94
Coastal erosion11.691.611.818.6651.6
Illegal cutting/clearance1.241.951.591.938.5760.17
Climate change (more severe droughts, floods and storms)1.671.481.540.928.2868.45
Dredging of channels11.631.461.587.8776.31
Table A14. Groups AC & CO. Average dissimilarity = 11.42.
Group ACGroup CO
SpeciesAv.AbundAv.AbundAv.DissDiss/SDContrib%Cum.%
Expansion of mangroves impacting negatively on estuaries1.871.151.52.1913.1813.18
Climate change (more severe droughts, floods and storms)1.721.481.240.910.8324
Aesthetics (views of estuaries, the harbour, open water)1.871.351.221.4710.6534.65
Chemical contamination1.721.431.20.8510.5245.17
Nutrient pollution1.621.630.941.148.2653.43
Increased need for access by boats1.771.450.851.577.4360.86
Sea-level rise1.961.580.841.157.3568.2
Dredging of channels1.61.630.811.247.0975.3
Table A15. Groups AC & LB. Average dissimilarity = 9.51.
Group ACGroup LB
SpeciesAv.AbundAv.AbundAv.DissDiss/SDContrib%Cum.%
Sea-level rise1.960.872.311.1724.3324.33
Climate change (more severe droughts, floods and storms)1.7212.121.2622.3146.64
Nutrient pollution1.621.730.791.38.2954.92
Dumping rubbish1.791.730.631.276.6161.53
Increased need for access by boats1.771.570.521.155.4366.97
Chemical contamination1.721.870.491.175.1472.1

References

  1. Quisthoudt, K.; Schmitz, N.; Randin, C.F.; Dahdouh-Guebas, F.; Robert, E.M.; Koedam, N. Temperature variation among mangrove latitudinal range limits worldwide. Trees 2012, 26, 1919–1931. [Google Scholar] [CrossRef]
  2. Thomas, N.; Lucas, R.; Bunting, P.; Hardy, A.; Rosenqvist, A.; Simard, M. Distribution and drivers of global mangrove forest change, 1996–2010. PLoS ONE 2017, 12, e0179302. [Google Scholar] [CrossRef]
  3. Pocknall, D.T. Late Eocene to Early Miocene vegetation and climate history of New Zealand. J. R. Soc. N. Z. 1989, 19, 1–18. [Google Scholar] [CrossRef]
  4. Green, M.; Ellis, J.; Schwarz, A.; Green, N.; Lind, D.; Bluck, B. For and Against Mangrove Control; NIWA Information Series 31; NIWA: Auckland, New Zealand, 2003; pp. 31–39. [Google Scholar]
  5. Harty, C. Mangrove planning and management in New Zealand and South East Australia–A reflection on approaches. Ocean Coast. Manag. 2009, 52, 278–286. [Google Scholar] [CrossRef]
  6. Lundquist, C.J.; Morrisey, D.J.; Gladstone-Gallagher, R.V.; Swales, A. Managing mangrove habitat expansion in New Zealand. In Mangrove Ecosystems of Asia; Springer: New York, NY, USA, 2014; pp. 415–438. ISBN 978-1-4614-8582-7. [Google Scholar]
  7. Crisp, P.; Daniel, L.; Tortell, P. Mangroves in New Zealand: Trees in the Tide; GP Books: Wellington, New Zealand, 1990; 69p, ISBN 0-477-01396-1. [Google Scholar]
  8. Morrisey, D.; Beard, C.; Morrison, M.; Craggs, R.; Lowe, M. The New Zealand mangrove: Review of the current state of knowledge. In Auckland Regional Council Technical Publication; No. 325; Auckland Regional Council: Auckland, New Zealand, 2007; Available online: http://www.nzpcn.org.nz/publications/ARC-325%20Mangrove-review.pdf (accessed on 13 December 2018).
  9. De Luca, S. Mangroves in NZ—Misunderstandings and Management. Available online: http://www.boffamiskell.co.nz/downloads/publications/mangroves-in-nz-misunderstandings-and-management.pdf (accessed on 13 December 2018).
  10. Resource Management Act 1991. Available online: http://www.legislation.govt.nz/act/public/1991/0069/latest/DLM230265.html (accessed on 11 January 2019).
  11. Auckland Council Unitary Plan (F2 Coastal- General Coastal Marine Zone) (2013). Available online: http://unitaryplan.aucklandcouncil.govt.nz/Images/Auckland%20Unitary%20Plan%20Operative/Chapter%20F%20Coastal/F2%20Coastal%20-%20General%20Coastal%20Marine%20Zone.pdf (accessed on 13 December 2018).
  12. Bell, J.; Blaney, A. Use of mangrove habitat by Threatened or At Risk birds. Report for Waikato Regional Council, 2017. Available online: https://www.waikatoregion.govt.nz/assets/WRC/Services/publications/technical-reports/2017/TR2017-23-Use-of-mangrove-habitat-by-threatened-or-at-risk-birds.pdf (accessed on 13 December 2018).
  13. Dencer-Brown, A.M.; Alfaro, A.C.; Milne, S.; Perrott, J. A Review on Biodiversity, Ecosystem Services, and Perceptions of New Zealand’s Mangroves: Can We Make Informed Decisions about Their Removal? Resources 2018, 7, 23. [Google Scholar] [CrossRef]
  14. Lindsay, P.; Norman, D.A. Human Information Processing: An Introduction to Psychology, 2nd ed.; Academic Press: New York, NY, USA, 1977; 777p. [Google Scholar]
  15. Pickens, J. Attitudes and Perceptions. In Organizational Behavior in Health Care; Jones & Bartlett Learning: Burlington, MA, USA, 2005; pp. 43–76. Available online: http://healthadmin.jbpub.com/borkowski/chapter3.pdf (accessed on 15 December 2018).
  16. Reibstein, D.J.; Lovelock, C.H.; Dobson, R. The Direction of Causality between Perceptions, Affect, Behavior: An Application to Travel Behaviour. J. Consum. Res. 1980, 6, 370–376. [Google Scholar] [CrossRef]
  17. Clapcott, J.; Ataria, J.; Hepburn, C.; Hikuroa, D.; Jackson, A.M.; Kirikiri, R.; Williams, E. Mātauranga Māori: Shaping marine and freshwater futures. N. Z. J. Mar. Freshw. Res. 2018, 52, 457–466. [Google Scholar] [CrossRef]
  18. BenDor, T.K.; Shoemaker, D.A.; Thill, J.C.; Dorning, M.A.; Meentemeyer, R.K. A mixed-methods analysis of social-ecological feedbacks between urbanization and forest persistence. Ecol. Soc. 2014, 19. [Google Scholar] [CrossRef]
  19. Murray, G.; D’Anna, L.; MacDonald, P. Measuring what we value: The Utility of mixed methods apporaches for incorporating values into marine social-ecological system management. Mar. Policy 2016, 73, 61–68. [Google Scholar] [CrossRef]
  20. Liehr, S.; Röhrig, J.; Mehring, M.; Kluge, T. How the Social-Ecological Systems Concept Can Guide Transdisciplinary Research and Implementation: Addressing Water Challenges in Central Northern Namibia. Sustainability 2017, 9, 1109. [Google Scholar] [CrossRef]
  21. Burke Johnson, R. Dialectical Pluralism: A Metaparadigm Whose Time Has Come. J. Mixed Methods Res. 2017, 11, 156–173. [Google Scholar] [CrossRef]
  22. Creamer, E. An Introduction to Fully Integrated Mixed Methods Research; SAGE Publishing: London, UK, 2018; 296p. [Google Scholar]
  23. Zografos, C. Rurality discourses and the role of the social enterprise in regenerating rural Scotland. J. Rural Stud. 2007, 23, 38–51. [Google Scholar] [CrossRef]
  24. Kufeld, C. A Q-Methodological Study Investigating the Identity of Self-Descriptions of a Group of Ex-Smokers. Dissertation Research Project, University of Luton, 2004. Available online: https://psydok.psycharchives.de/jspui/bitstream/20.500.11780/354/1/MScDissKufeld.pdf (accessed on 14 December 2018).
  25. McKeown, B.; Thomas, D. Quantitative Applications in the Social Sciences: Q Methodology; Sage University Press: Thosand Oaks, CA, USA, 1988. [Google Scholar] [CrossRef]
  26. Ho, G.W.K. Examining Perceptions and Atittudes: A Review of Likert-Type Scales Versus Q-Methodology. West. J. Nurs. Res. 2016, 39, 674–689. [Google Scholar] [CrossRef]
  27. Menold, N.; Bogner, K. Design of Rating Scales in Questionnaires; GESIS Survey Guidelines; GESIS – Leibniz Institute for the Social Sciences: Manheim, Germany, 2016; Available online: https://www.gesis.org/fileadmin/upload/SDMwiki/MenoldBogner_Design_of_Rating_Scales_in_Questionnaires.pdf (accessed on 13 December 2018).
  28. Burns, N.; Grove, S.K. The Practice of Nursing Research Conduct, Critique, & Utilization; W.B. Saunders and Co.: Philadelphia, PA, USA, 1997. [Google Scholar]
  29. Naresh, K.M. Questionnaire Design and Scale Development. 2006. Available online: https://www.researchgate.net/ profile/Naresh_Malhotra/publication/266864633_Questionnaire_design_and_scale_development/ links/566708fe08ae34c89a0220f9/Questionnaire-design-and-scale-development.pdf (accessed on 11 January 2019).
  30. Brown, S.R. A primer on Q-methodology. Operant. Subj. 1993, 16, 91–138. [Google Scholar]
  31. Schmolk, P. The Qmethod Page. Available online: http://schmolck.org/qmethod/ (accessed on 18 June 2018).
  32. Herrington, N.; Coogan, J. Q Methodology: An Overview. Res. Second. Teach. Educ. 2011, 1, 24–28. [Google Scholar]
  33. Yang, Y.; Bliss, L.B. A Q factor analysis of college undergraduate students’ study behaviours. Educ. Res. Eval. Int. J. Theory Pract. 2014, 20, 433–453. [Google Scholar] [CrossRef]
  34. Braun, V.; Clarke, V. Using thematic analysis in psychology. Qual Res Psychol. 2006, 3, 77–101. [Google Scholar] [CrossRef] [Green Version]
  35. Thomas, D.R. A general inductive approach for analyzing qualitative evaluation data. Am. J. Eval. 2006, 27, 237–246. [Google Scholar] [CrossRef]
  36. Nowell, L.S.; Norris, J.M.; White, D.E.; Moules, N.J. Thematic Analysis: Striving to Meet the Trustworthiness Criteria. Int. J. Qual. Methods 2017, 16, 1–13. [Google Scholar] [CrossRef]
  37. QSR International. Available online: http://help-nv11.qsrinternational.com/desktop/welcome/welcome.htm (accessed on 3 April 2018).
  38. Clarke, K.R.; Ainsworth, M. A method of linking multivariate community structure to environmental variables. Mar. Ecol. Prog. Ser. 1993, 92, 205–219. [Google Scholar] [CrossRef]
  39. Anderson, M.J. Permutational Multivariate Analysis of Variance (PERMANOVA), 3rd ed.; John Wiley & Sons, Ltd.: Chichester, UK, 2014. [Google Scholar] [CrossRef]
  40. Anderson, M.J.; Gorley, R.N.; Clarke, K.R. PERMANOVA+ for PRIMER: Guide to Software and Statistical Methods; PRIMER-E: Plymouth, UK, 2008. [Google Scholar]
  41. Morrisey, D.J.; Swales, A.; Dittmann, S.; Morrison, M.A.; Lovelock, C.E.; Beard, C.M. The ecology and management of temperate mangroves. In Oceanography and Marine Biology: An Annual Review; Gibson, R.N., Ed.; CRC Press: Boca Raton, FL, USA, 2010; Volume 48, pp. 43–160. [Google Scholar]
  42. Bulmer, R.H.; Schwendenmann, L.; Lundquist, C.J. Carbon and nitrogen stocks and below-ground allometry in temperate mangroves. Front. Mar. Sci. 2016, 3, 150. [Google Scholar] [CrossRef]
  43. Gritcan, I.; Duxbury, M.; Leuzinger, S.; Alfaro, A. Leaf Stable Isotope and Nutrient Status of Temperate Mangroves as Ecological Indicators to Assess Anthropogenic Activity and Recovery from Eutrophication. Front. Plant Sci. 2017, 7, 1922. [Google Scholar] [CrossRef]
  44. Lundquist, C.J.; Hailes, S.F.; Carter, K.R.; Burgess, T.C. Ecological Status of Mangrove Removal Sites in the Auckland Region. Prepared by the National Institute of Water and Atmospheric Research for Auckland Council. Auckland Council Technical Report, 2014a, TR2014/033. Available online: http://temp.aucklandcouncil.govt.nz/SiteCollectionDocuments/aboutcouncil/planspoliciespublications/technicalpublications/tr2014033ecologicalstatusofmangroveremovalsitesintheaklregion.pdf (accessed on 18 December 2018).
  45. Murray, C. An Assessment of Cost-Benefit Analysis Approaches to Mangrove Management; Auckland Council Technical Report, 2013/006; Auckland Council: Auckland, New Zealand, 2013; ISBN 978-1-927216-31-6. Available online: http://temp.aucklandcouncil.govt.nz/EN/planspoliciesprojects/reports/technicalpublications/Documents/TR2013006anassessmentofcostbenefitanalysisapproachestomangrovemanagement.pdf (accessed on 18 December 2018).
  46. Pendleton, L.; Donato, D.C.; Murray, B.C.; Crooks, S.; Jenkins, W.A.; Sifleet, S.; Megonigal, P. Estimating global “blue carbon” emissions from conversion and degradation of vegetated coastal ecosystems. PLoS ONE 2012, 7, e43542. [Google Scholar] [CrossRef] [PubMed]
  47. Alongi, D.M. Carbon cycling and storage in mangrove forests. Annu. Rev. Mar. Sci. 2014, 6, 195–219. [Google Scholar] [CrossRef]
  48. Bulmer, R.H.; Schwendenmann, L.; Lundquist, C.J. Allometric models for estimating aboveground biomass, carbon and nitrogen stocks in temperate Avicennia marina forests. Wetlands 2016, 36, 841–848. [Google Scholar] [CrossRef]
  49. Bandaranayake, W.M. Traditional and medicinal uses of mangroves. Mangrov Salt Marshes 1998, 2, 133–148. [Google Scholar] [CrossRef]
  50. Küchler, A.W. The Mangrove in New Zealand. N. Z. Geogr. 1972, 28, 113–129. [Google Scholar] [CrossRef]
  51. Dingwall, P.R. Overcoming problems in the management of New Zealand mangrove forests. In Physiology and Management of Mangroves; Teas, H.G., Ed.; Dr. W. Junk Publishers: The Hague, The Netherlands, 1984; pp. 97–106. [Google Scholar]
  52. Marshall, M.N. Sampling for qualitative research. Fam. Pract. 1996, 13, 522–525. [Google Scholar] [CrossRef] [PubMed]
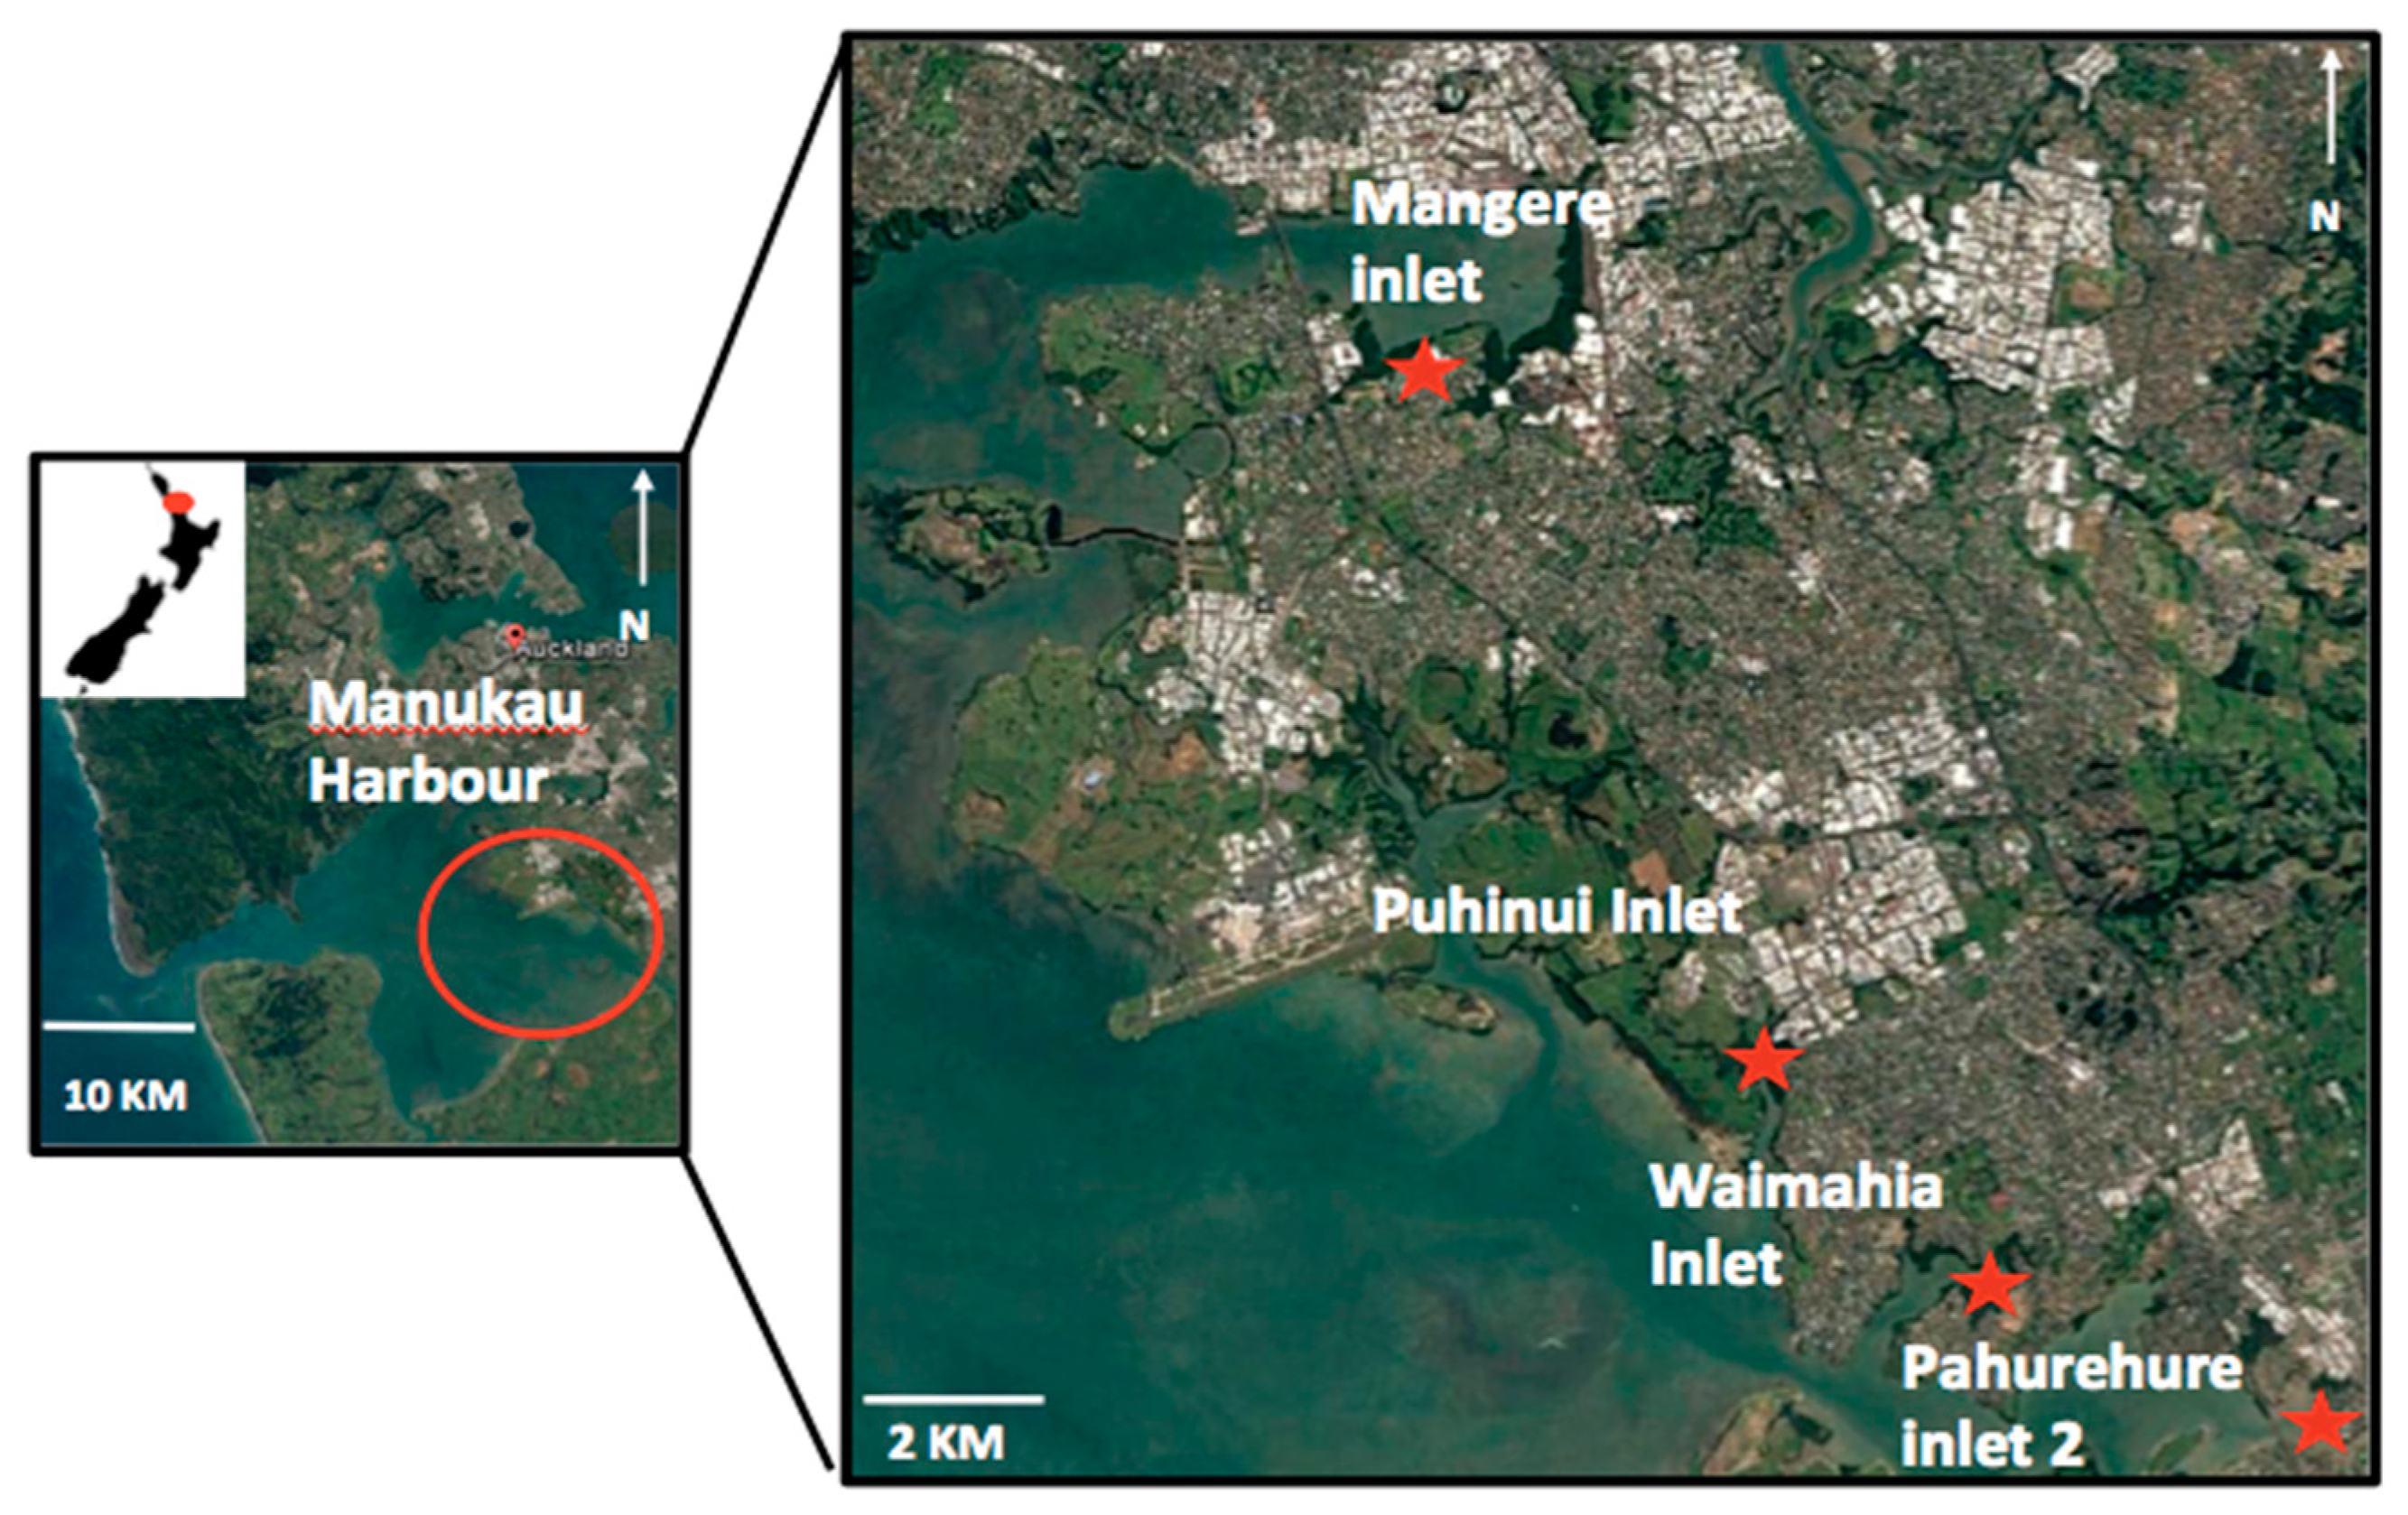
Figure 1. Mangrove removal sites in the Manukau Harbour, Auckland, New Zealand. Adapted from Google Earth, 2018.
Sustainability 11 02631 g001
Figure 2. Example of Q-Sort with 33 ecological and social statements ranked from strongly disagree (−4) to strongly agree (+4).
Sustainability 11 02631 g002
Figure 3. Occupations of participants with percentage contribution to participant pool.
Sustainability 11 02631 g003
Figure 4. Participant’s views on the importance of mangroves in New Zealand’s coastal ecology. Stated as “important”, “neither important nor unimportant” or “not important” by percentage per occupation.
Sustainability 11 02631 g004
Figure 5. Participant’s views on the presence of mangroves at four sites in the Manukau harbour, Auckland, New Zealand. Stated as “positive”, “neutral” or “negative” as percentages per occupation.
Sustainability 11 02631 g005
Figure 6. Themes and sub-themes emerging from the semi-structured interviews by inductive coding.
Sustainability 11 02631 g006
Figure 7. Causes of mangrove expansion and reduction in New Zealand spoken about by participants.
Sustainability 11 02631 g007
Figure 8. Mean rating of mangrove ecosystem services as ranked by participants on a scale of 1–4, 1 = not important, 2 = Neither important nor unimportant, 3 = Important, 4 = Very important.
Sustainability 11 02631 g008
Figure 9. Non-metric multidimensional scaling (nMDS) based on Bray–Curtis of rating of ecosystem services of mangrove in New Zealand by different occupations. K = Kaitiaki, IE = Independent Ecologist, CG = Community Group, AC = Auckland Council, CO = Conservation Organisation, PR = Park Ranger, LB = Local Board and IP = Independent Planner.
Sustainability 11 02631 g009
Figure 10. 2-D Bubble Plot based on Bray–Curtis similarity matrix showing occupations rating of sediment retention as an ecosystem service of mangroves in New Zealand.
Sustainability 11 02631 g010
Figure 11. Mean rating of issues facing mangroves in New Zealand as rated by participants (‘don’t know’ data removed).
Sustainability 11 02631 g011
Figure 12. nMDS based on Bray–Curtis similarity showing differences between occupations on the issues facing mangroves in New Zealand.
Sustainability 11 02631 g012
Figure 13. (a) 2-D bubble plot based on Bray–Curtis similarity for nutrient pollution and (b) chemical contamination ranking by participants.
Sustainability 11 02631 g013
Figure 14. (a) Factor one loadings and (b) Factor two loadings by Occupation.
Sustainability 11 02631 g014
Table 1. (a) Scale ratings of importance of mangrove ecosystem services in New Zealand; (b) Magnitude of mangrove-related issues in New Zealand.
(a)
Rating
Very ImportantImportantNeither Important nor UnimportantNot importantDon’t Know
Mangrove Service
Aesthetic (visual value)
Carbon storage capacity
Cultural value
Fish habitat
Flood and water flow control
Food sources
Medicinal properties
Nutrient retention
Recreational value (local)
Recreational value (overseas tourists)
Sediment retention
Source of fuel/wood/building materials
Storm buffering
Supporting offshore and near-shore fisheries
Water quality maintenance
Wildlife habitat
(b)
Rating
Big issueIssuePotential to be an issueNo issueDon’t know
Issues facing mangroves
Illegal cutting/clearance
Increased need for access by boats
Chemical contamination
Climate change (more severe droughts, floods and storms)
Coastal erosion
Dredging of channels
Dumping rubbish
Expansion of mangroves impacting negatively on estuaries
Nutrient pollution
Sea-level rise
Sedimentation
Aesthetics (views of estuaries, the harbour, open water)
The desire for reversion of estuaries to a pre-mangrove environment
Coastal development/urbanisation
Table 2. (a) Ecological mangrove statements; (b) Social statements created from extracting information of resource consents for removal at four sites in the Manukau Harbour, Auckland, New Zealand and data from the first ten interviewees.
(a)
Mangrove expansion has impacted negatively on surrounding habitats
Mangroves encroach upon saltmarsh in some places which may alter their ecosystem function (saltmarsh)
Mangroves replace wading bird habitat (mudflat) in some areas
Mangroves stabilise mudflats
Maintaining saltmarsh-mangrove ecotones is important
Temperate mangroves have different attributes to tropical mangroves
Not enough research has been conducted regarding how removal of mangroves affects coastal and estuarine ecology
Mangroves should be preserved as much as possible based on their ability to sequester (long-term storage of) carbon
Mangroves are important for a variety of wildlife
Nothing of any ecological value exists in mangroves
Removing mangroves can result in the potential loss of ecological connectivity along shorelines for some species
Removal can result in the potential mobilisation of sediments and effects such as smothering of shellfish beds
Removal can result in better tidal flow and flushing of area within the inlets
Removal can create an improved connection between the land and the sea
We need baseline monitoring (on contaminated sediments and hydrology) to assess improvements to water quality, and information on contaminants
We need to address sedimentation and nutrient run-off from the land to slow the growth of mangroves
(b)
Removal of mangroves can provide improved recreation opportunities
Removal can provide opportunities for beach restoration
I would prefer to see a view of the water instead of mangroves
Mangrove removal is a reversible experiment (if we cut them down, they will grow back anyway)
We should look at improving the water quality of our harbour and monitoring this before we remove any more mangroves
Money is better spent elsewhere
If we decide to remove mangroves, we need to think carefully about the justification for this and select areas accordingly
Removing mangroves is long-term so we need to be able to afford it
Removing mangroves adds value to property
Mangroves have equal value to any other natural habitat
Everyone should have the right to remove mangroves
Beaches have been destroyed by mangrove expansion
Mangrove expansion is due to anthropogenic activities
If removed, this should be in a step-by-step process, monitoring should occur during and post removal to observe changes over time
Removing mangroves can enhance the amenity of an area to create a ‘strong sense of place’ for the community
People are the issue (with mangrove spread), but we need control over where they are to allow cultural activities to continue
We need to look at putting the environment first before we look after ourselves
Table 3. Selected negative perceptions of local communities towards mangroves in New Zealand by Community Groups (CG), Auckland Councils members (AC) and Independent Ecologists (IE).
Community Perception towards MangroveParticipantQuote
No community benefitCG3They are not perceived as having any redeeming community benefit at all. They are certainly highly detrimental to the health of any estuary”.
Not good due to expansionAC5The community’s perception is that mangroves are not good, that’s unfortunate, I don’t like that perception, but because of the rapid expansion of mangroves, people think they are everywhere”.
Visual improvement with removalIE2So I’m not convinced that clearing mangroves does anything apart from people having a visual improvement in their minds
Negative impact on ecologyCG2A magnificent tree and incredibly adapted tree with lovely smelling flowers but overall having a negative impact on the ecology in New Zealand”.
Table 4. Ecological value of mangroves in terms of ecosystem services and species inhabiting mangroves as spoken about by participants; AC = Auckland Council, CG = Community Group, IE = Independent Ecologist, CO = Conservation Organisation.
EcologySentimentQuoteParticipant
Banded RailMangroves as habitat“… it’s probable or possible that the increase in mangrove habitat has actually formed a very good bastion for Banded Rail
… so Banded Rail use mangroves as cover when they are foraging and they breed at the interface of mangroves and saltmarsh
AC1
AC2
FishNot important Temporary habitatThey provide a different ecosystem service and we are not seeing them as important for fish nurseries
There are some fish species that use the mangroves as a temporary nursery habitat, if that was the case, it’s only going to be for at a very small part of the tide
AC2
CG1
ErosionBuffer against erosionin terms of erosion management to create a buffer along those coastlines”.
There had been mangroves along that shoreline. No doubt they would have prevented the erosion”.
AC3
CG3
SedimentSediment-fixing… roles that I see are fixing sediment..”
I think they have a role in trapping sediment
CO3
IE1
Water qualityImproving water qualityIf we take all of those mangroves away, then we are taking the water and flushing it straight into the harbour with no improvement in water quality in between”.CO5
Table 5. Significant pairwise comparisons between participants of different occupations with mangrove ecosystem services, with t value, p value and unique permutations by occupation pairs where IE = Independent Ecologist, CG = Community Group, CO = Conservation Organisation, AC = Auckland Council, LB = Local Board.
Occupationtp (PERM)Unique Perms
IE, CG2.940.01120
IE, CO1.510.023547
CG, AC3.180.01484
CG, CO2.30.01656
AC, CO1.490.011408
IE, LB2.140.0336
AC, LB2.240.03528
Table 6. Top two ecosystem services for significant pairwise comparisons between occupations (occupation with higher rating in brackets), with overall dissimilarity, percentage contribution and cumulative contribution.
OccupationOverall DissimilarityEcosystem Service%Cumulative%
CG, CO34.86Sediment retention (CO)
Nutrient retention (CO)
7.83
7.81
7.83
15.64
AC, LB27.59Carbon storage capacity (AC)
Water quality maintenance (AC)
15.61
9.28
15.61
24.89
CG, AC27.33Nutrient retention (AC)
Cultural value (AC)
8.20
8.13
8.20
16.33
IE, LB26.90Carbon storage capacity (IE)
Medicinal properties (LB)
15.03
10.72
15.03
25.75
IE, CG25.65Medicinal value (CG)
Cultural value (IE)
9.47
8.75
9.47
18.23
AC, CO23.74Water quality (AC)
Carbon storage capacity (AC)
9.42
9.26
9.42
18.68
IE, CO20.03Water quality (IE)
Nutrient retention (IE)
11.05
10.83
11.05
21.88
Table 7. Significant pairwise differences between occupations with T-values and p-values.
OccupationTp
IE, CG1.900.019
IE, AC1.760.005
CG, AC2.580.011
CG, CO2.150.019
AC, CO1.440.044
AC, LB1.790.036
Table 8. Top two issues for significant pairwise comparisons between occupations, with overall dissimilarity, percentage contribution and cumulative contribution.
OccupationOverall DissimilarityIssuePercentage ContributionCumulative Percentage
CG, CO18.55Nutrient Pollution (CO)
Chemical Contamination (CO)
12.24
10.95
12.24
23.18
IE, CG13.77Nutrient Pollution (IE)
Sea-Level Rise (IE)
13.32
12.03
13.32
25.36
CG, AC13.68Nutrient Pollution (AC)
Chemical Contamination (AC)
15.28
13.21
15.28
28.49
AC, CO11.42Expansion of mangroves (AC)
Aesthetics (AC)
13.18
10.83
13.52
24.00
IE, AC9.77Climate Change (AC)
Nutrient Pollution (AC)
11.93
7.93
11.93
21.66
LB, AC9.51Sea-level rise (AC)
Climate Change (AC)
24.33
22.31
24.33
46.64
Table 9. (a). Factor 1 statements about mangroves with highest and lowest Z-Scores. (b) Factor 2 extreme statements about mangroves with high and low Z-Scores.
(a)
NumberStatementZ-Scores
9Mangroves are important for a variety of wildlife1.735
16We need to address sedimentation and nutrient run-off from the wider catchment...1.697
23If we decide to remove mangroves, we need to think carefully about the justification for this and select areas accordingly1.451
30If removed this should be a step-by-step process1.004
1Mangrove expansion has impacted negatively on surrounding habitats−1.134
19I would prefer to see a view of the water instead of mangroves−1.447
27Everyone should have the right to remove mangroves−2.258
10Nothing of any ecological value exists in mangroves−2.296
(b)
Statement NumberStatementZ-Scores
16We need to address sedimentation and nutrient run-off from the land to slow the growth of mangroves1.774
15We need baseline monitoring (on contaminated sediments and hydrology) to assess improvements to water quality, and information on contaminants1.717
23If we decide to remove mangroves, we need to think carefully about the justification for this and select areas accordingly1.649
29Mangrove expansion is due to anthropogenic activities1.231
3Mangroves replace wading bird habitat (mudflat) in some areas1.110
25Removing mangroves adds value to property−1.472
8Mangroves should be preserved as much as possible based on their ability to sequester (long-term storage of) carbon−1.326
10Nothing of any ecological value exists in mangroves−1.843
27Everyone should have the right to remove mangroves−2.483
Table 10. Mixed method joint display of interviews, scale data and Q-sort to show polarity between Community Groups (CG) and Conservation Organisations (CO).
MethodAnalysesEvaluation
Semi-structured interviewsQueries and Classifications matrix coding query (CG and CO) with all nodesGreater perceived value and positive attitude towards mangroves by CO, highlighted in themes of world-view, sustainable balance, environmental change, values and practical management
Scale rating of ecosystem services and issuesPERMANOVA with “Occupation” as fixed factor, Bray–Curtis similarity matrixSignificant differences between groups p < 0.05. Greatest dissimilarity of all groups for both ecosystem services and issues. Driven by ranking of sediment and nutrient retention as services and nutrient pollution and chemical contamination as issues facing mangroves, CO ranking these higher than CG.
Q-SortSorting of 33 social and ecological statementsLoading of all CO’s onto “pro-protectionist” attitude, only CG in sort loading negatively onto this factor.