Article

Mountain Farming Systems’ Exposure and Sensitivity to Climate Change and Variability: Agroforestry and Conventional Agriculture Systems Compared in Ecuador’s Indigenous Territory of Kayambi People

by
Raúl Córdova
1,*,
Nicholas J. Hogarth
1,2 and
Markku Kanninen
1
1
Viikki Tropical Resources Institute (VITRI), Department of Forest Sciences, University of Helsinki, Latokartanonkaari 7, P.O. Box 27, 0014 Helsinki, Finland
2
Helsinki Institute of Sustainability Science (HELSUS), University of Helsinki, 0014 Helsinki, Finland
*
Author to whom correspondence should be addressed.
Sustainability 2019, 11(9), 2623; https://doi.org/10.3390/su11092623
Submission received: 21 March 2019 / Revised: 27 April 2019 / Accepted: 30 April 2019 / Published: 7 May 2019
(This article belongs to the Special Issue Sustainable Agroforestry Systems)

Abstract

:
Smallholder farming is considered one of the most vulnerable sectors to the impacts of climate change, variability, and extremes, especially in the developing world. This high vulnerability is due to the socioeconomic limitations and high environmental sensitivity which affect the biophysical and socioeconomic components of their farming systems. Therefore, systems’ functionality and farmers’ livelihoods will also be affected, with significant implications for global food security, land-use/land-cover change processes and agrobiodiversity conservation. Thus, less vulnerable and more resilient smallholder farming systems constitute an important requisite for sustainable land management and to safeguard the livelihoods of millions of rural and urban households. This study compares a comprehensive socioeconomic and environmental dataset collected in 2015–2016 based on household interviews of 30 farmers of highland agroforestry systems and 30 farmers of conventional agriculture systems, to determine which system provides better opportunities to reduce exposure and sensitivity. A modified Climate Change Questionnaire Version 2 of the World Overview of Conservation Approaches and Technologies (WOCAT) was applied to collect the data. The interview data are based on the perceptions of Kayambi indigenous farmers about the levels of exposure and sensitivity of their farming systems during the last decade. Descriptive statistics were applied to analyze the data from the 60 farms. Results indicate that both agroforesters and conventional farmers clearly perceived increases in temperature and reductions in precipitation for the last decade, and expected this trend to continue in the next decade. Furthermore, conventional farmers perceived greater exposure to droughts (20%), solar radiation (43%), and pests, weeds and disease outbreaks (40%) than agroforesters. Additionally, results emphasize the better ability of agroforestry systems to reduce exposure and sensitivity to climate change and variability. These findings support the well-known assumptions about the key role played by agroforestry systems for climate change adaptation and mitigation, especially in developing countries.

1. Introduction

Despite the fact that smallholder farms occupy only 24% of global agricultural land, this sector represents an important contributor to global crop production (28–31%) and food supply (30–34%) [1]. Smallholders are commonly characterized as those with less than 10 ha of land [2] and employing limited or no hired labor, and they often live in poverty and endure food insecurity, with limited access to markets and services [3,4]. The smallholder farming sector makes a well-known contribution to agrobiodiversity conservation, food supply, and economies at the local, regional, and global levels, especially in developing countries [1,2,3,4,5,6,7,8].
About 3 billion rural people in developing countries are considered to be part of the smallholder farmer sector [3,9] (representing about 42% of the world’s total population of 7.3 billion [10]). Their extensive dependency on agriculture and natural resources combined with poverty, lower education levels, isolation, and the lack of climate-related policies, make their agricultural systems vulnerable to the impacts of climate change and variability (CCV) and extreme climate events (ECE) [9]. The agricultural sector worldwide, including smallholder farming, is affected by the increases in global mean temperature, shifts in precipitation regimes, increased ECE (especially droughts), stimulatory effects of rising carbon dioxide (CO₂) and the damaging effects of elevated tropospheric ozone (O₃) [9,11,12]. In addition, subsistence and smallholder livelihood systems are also impacted by multiple non-climate stressors such as the access to main productive assets (water, land, markets, financial resources, technology, knowledge and information), governance, migration, gender, health, armed conflicts, disease, etc., [13,14,15]. In this context, the evaluation of CCV and ECE impacts on agricultural systems becomes a complicated task (due to their socioeconomic and environmental complexity, the context-site specificities and the influence of several climate and non-climate stressors [9,15]). Despite this, an extensive body of evidence indicates that the main expected impacts on smallholder and subsistence systems in developing countries will mostly affect the main staple crops (wheat, rice, maize, potato, beans and soybean) and livestock, causing decreased yields, increased water requirements, and increased incidence of pests, weeds and diseases (PWD) [9,12,15].
The livelihoods and farming systems in the Andes, the geographical focal point of this study, are considered to be highly vulnerable to CCV and ECE due to their low adaptive capacity that is characterized mainly by the prevalence of high poverty levels, limited access to productive assets, increasing degradation of water and soil resources, lack of infrastructure, sanitation, adequate housing, and institutional marginalization [9,16,17,18,19]. As is the general case globally, Andean farming systems will also be affected by temperature increase, changes in precipitation regimes, and increased frequency of extreme events, experiencing some of the most severe climatic changes in South America [17,20,21]. One of the most dramatic and well documented impacts of global warming in the Andes is the retreat of tropical glaciers, caused mainly by increased temperatures at higher elevations and changes in precipitation patterns [20,21]. Tropical glacier retreat is already causing water stress and affecting the availability of water for ecosystem functioning, agricultural uses, and human consumption for millions of rural and urban people whose supply depends on glaciers (and the associated wet highland ecosystems “Páramo”) as their main water sources [17,20,21,22]. The main expected impacts of CCV and ECE in Andean farming systems are also related to reductions in productivity of major crops, farm animals (mostly beef, dairy cattle, pigs and chickens), and with the increased risk of PWD affecting crops, animals and people [12,19,21,22].
Even though it is expected that the smallholder sector will be strongly affected by CCV and ECE, as in many other parts of the world, the smallholder sector in the Andean region has also developed a variety of resilience strategies (e.g., livelihood diversification, traditional knowledge about local agricultural practices and natural resources management, informal institutions for risk-sharing and risk management) to cope with CCV and ECE, enhancing its adaptation capacity [9,13].
The aim of this paper is to provide a comprehensive vulnerability analysis of smallholder production systems in the Andean highlands of Ecuador in the context of CCV. The analysis compares smallholder farmers’ perceptions about climate and climate-related stressors influencing the exposure and sensitivity of highland production systems to CCV. Vulnerability comparisons were made between two smallholder farming system types: agroforestry systems (AFS) and conventional agricultural systems (CAS).
The main research question addressed in this study is: How vulnerable are the smallholder AFS and CAS to the impacts of CCV? The farming systems’ vulnerability was addressed by analyzing the exposure and sensitivity of the systems.
This paper builds on a previous paper called “Sustainability of Smallholder Livelihoods in the Ecuadorian Highlands: A Comparison of Agroforestry and Conventional Agriculture Systems in the Indigenous Territory of Kayambi People” [23], which focused on the main socioeconomic and environmental components influencing the sustainability of the systems.

2. Materials and Methods

2.1. Study Area

The research was conducted in the Indigenous Territory of Kayambi People (ITKP) (Figure 1), covering an approximate area of 1329 km² [24], located in the Northern Highland Andes of Ecuador. The ITKP includes 168 rural highland communities distributed along three provinces: Pichincha, Imbabura and Napo [25,26,27]. The territory extends along an altitude range of 2000 m (inter-Andean valleys) to 5790 m (Cayambe Volcano). The altitude variation and the geomorphological and topographic features of the territory contribute to the wide variety of bioclimatic and biotic zones [28,29]. ITKP includes areas under agricultural production, and natural/semi-natural native ecosystem remnants, especially the wet highland grasslands (Páramo) [23].
The soils in the ITKP are formed from volcanic ash and classified as andisols, mollisols, and inceptissols, distinguished by their productivity and fertility [30]. Mean annual rainfall ranges from 250 to 2000 mm distributed from September to April [28,31]. The temperature varies along the territory due mainly to the altitude. Low inter-Andean valleys have dry and temperate conditions with average annual temperatures of 12 to 18 °C, while the cold and humid highland grasslands present average annual temperatures of 3 to 6 °C [32]. According to the last national population census in 2010, the ITKP had a population of 154,437 inhabitants, approximately 40% of which are self-recognized as indigenous people [33].
The studied sample farms were located along highlands at an altitudinal range of 2500 to 3300 m.a.s.l. distributed around Cayambe and Imbabura volcanoes, and around Olmedo, Cangahua and Tabacundo villages (Figure 1). Highland grasslands are considered an essential Andean ecosystem because their hydrological functions related to fresh water supply and regulation. The main drivers of depletion of this ecosystem are related to the increasing expansion and intensification of agriculture and livestock farming activities [34].
The ITKP was selected as the study area mainly due to the presence of smallholder agroforestry and conventional agricultural farms in highlands, and the farmers’ livelihoods being based mainly on agricultural activities. Other factors considered for the selection of the area were the favorable logistics and access conditions (basic road infrastructure, good security levels, and the relatively easy access from the capital Quito). It is important to remark that the keen interest shown by the Kayambi People’s organization in the research topic was a key issue that facilitated access to the territory and provided local technicians for the logistic and cultural support.

2.2. Sampling and Data Collection

The 60 smallholder sample farms considered for this study were selected randomly from the 633 smallholder farms belonging to a smallholder farmers’ organization called RESSAK (Network for Food Sovereignty and Solidarity Economy of the Kayambi’s territory), whose member’s farms are characterized by incorporating agroecological principles into the production process [35]. These farms are part of the approximately 12,000 smallholder farms located in the ITKP [36]. The 60 sampled farms included 30 agroforestry and 30 conventional smallholder farms. The farms were evaluated and selected by the lead author of this paper and three local technicians from the Kayambi People’s Confederation (KPC), considering the socioeconomic and environmental context and three main criteria that were also used in our previous study [23]: (1) farm size up to 10 ha [2], (2) high altitude between 2500 and 4000 m.a.s.l, and (3) percentage of the farm area covered by trees and/or shrubs. Farms with 10% or more of the area covered by trees and/or shrubs in any spatial arrangement were considered AFS [37], while farms with less than 10% of the area covered by trees and/or shrubs were considered CAS.
To collect the data, 60 household surveys (30 AFS and 30 CAS) were conducted using a modified World Overview of Conservation Approaches and Technologies (WOCAT) Climate Change Questionnaire Version 2 (WCCQV2) (Table A1 in Appendix A). WOCAT is a global network promoting the documentation, sharing and use of knowledge to support adaptation, innovation and decision-making in issues related to sustainable land management (SLM) [38]. WOCAT has developed widely accepted methods and tools for documentation, monitoring, evaluation and dissemination of SLM such as: Questionnaire on SLM Technologies, Questionnaire on SLM Approaches, Mapping Questionnaire, an additional questionnaire on Watershed Management (Module), and the additional module of Climate Change Adaptation Questionnaire [39]. These WOCAT methods and tools have been recognized by the United Nations Convention to Combat Desertification (UNCCD) as the main recommended database for SLM best practices and adaptation measures [40]. The WOCAT questionnaire for climate change adaptation was used in this study due to its high level of detail for the analysis of vulnerability/resilience (exposure and sensitivity) of the studied farming systems, called in the WOCAT context as SLM Technologies [41,42] (Table A1, Table A2 and Table A3 in Appendix A).
The WCCQV2 was simplified to be part of a wider survey for a more complex study related to highland agroforestry systems and smallholder famers’ adaptation to CCV. The WCCQV2 Section 2.2 (Timeline: frequency of ECE to which the technology has been exposed in the last 10 years), 2.3 (Seasonal calendar of climate change observations), and 2.4 (Crop seasonal sensitivity), were simplified to optimize the farmer’s and surveyor’s time. As a substitute for these very detailed sections in the survey, farmers were instead asked about the main gradual climate changes, extreme climatic events and other climate-related events which affect their farming systems during the last 10 years (Table A1 in Appendix A).
The 60 surveys were conducted by the lead author of this paper together with a local technician from the KPC (especially in the first surveys), as face-to-face interviews from December 2015 to May 2016. The interviews took between two to three hours and the data were directly entered into a database. This time was needed in order to provide adequate explanations of the underlying concepts to the farmers for some of the more complex parts of the questionnaire (such as the biophysical capacity of the systems to control the impacts of extreme climatic events and gradual climate changes, or the on- and off-site economic, cultural, and ecological impacts).
The data collected represents the perceptions of smallholder farmers about different elements influencing the vulnerability of their farming systems. Vulnerability is analyzed taking into account the exposure and sensitivity of the systems. Therefore, the WOCAT climate change questionnaire represents a comprehensive tool for vulnerability analysis, since it includes the interactions among environmental, biophysical, social, cultural, institutional and economic components of the farming systems (Table A1, Table A2 and Table A3 in Appendix A).

2.3. Data Analysis

A comparative analysis approach was applied to analyze the exposure and sensitivity of the two farming system types. The qualitative variables included in the exposure and sensitivity components were analyzed using descriptive statistics (crosstabs and Chi-square). Mann–Kendall tests and Sen’s slope estimations were conducted to determine trends on the temperature and precipitation changes in the study area. The analysis was carried out using MAKENSES tool developed by the Finnish Meteorological Institute [43]. These estimations were also used to evaluate if the farmers’ perceptions on temperature and precipitation respond to climate change or to inter/intra-annual variability (between the years or between the seasons, respectively) according to official climatic data.

3. Results

3.1. Exposure

3.1.1. General Observations of Climate Change and Climate Variability between Farming Systems

Table 1 presents the differences in the farmers’ general perceptions related to gradual climate changes, extreme events, and other climate-related events that affect the studied area. These perceptions take into account the last decade of farmer’s observations and the expected tendency of CCV in the future (next decade).
The results show that perceptions of the gradual climate changes during last decade are similar between agroforesters and conventional farmers. Among gradual climate changes, there are clear perceptions of the increase of annual temperature and a reduction of annual precipitation. The same perception tendencies were found also in rainy and dry seasons.
In the case of extreme climatic events, a clear perception tendency in both farming system types was the reduction of heavy rainfall and hail events, and the increase of heavy windstorms, droughts/dry periods, heat waves/warm periods and cold periods/frost. Furthermore, perceptions of agroforesters and conventional farmers about other climate-related events are also similar, indicating stable conditions (not changes). In addition, farmers’ perceptions of gradual climate changes, extreme events and other climate-related events for the next decade are similar in both system types, and coincide with the perception tendencies described above.

3.1.2. Characterization of the Main Gradual Climate Changes, Extremes and Other Climate-Related Events Affecting AFS and CAS

Table 2 shows the characterization of smallholder farmers’ perceptions about gradual climate changes, extremes and other climate-related events (climate and climate-related stressors (CCRS)) that affect their farming systems. To characterize and prioritize the main CCRS, farmers were asked to identify and order them from the most to the least influential stressor. Farmers identified seven CCRS distributed across 12 prioritized sequences/categories (Table 2). Categories consist of combinations of two to seven CCRS. The number of stressors included in each category could define its complexity and therefore the exposure level of the farming system. A farming system included in a less complex CCRS category could be seen as a less exposed farming system and vice versa, while a more complex category could indicate more exposure of the system.
Most of the perceptions of conventional farmers (67%) included categories with five and six stressors, while the agroforesters’ perceptions for the same categories only represents 17%. Results of Table 2 also indicate the specific incidence (in percentage) of each climate stressor identified by farmers. These perception percentages were calculated summing the partial percentages where the specific stressor appear in the respective category. Taking into account the specific incidence of climate stressors, temperature increase and rain reduction are perceived at similar levels (100%) in both farming systems. In addition, conventional farmers perceived greater exposure to droughts (20%), solar radiation (43%) and PWD outbreaks (40%) than agroforesters.

3.2. Sensitivity

3.2.1. Perceptions of Farming System’s Biophysical Capacities to Control the Impacts of Main Gradual Climate Changes, Extremes and Other Climate-Related Events

To estimate how sensitive the studied farming systems are to the main CCRS described in Section 3.1, the questionnaire included two subsections (Table A1 in Appendix A) related to: (1) How the farming systems and the applied management approach (AFS or CAS) help to control the impacts of the main CCRS (Table 2 and Table 3), and the influence of these impacts in the socioeconomic, sociocultural and ecological components and functions of the systems (Table 4). In the first case, results of Table 3 indicate how farmers have qualified the impacts produced by the main CCRS. Impact qualification was made using a simple scale: level 1 when the controlling capacity of the systems was less important or little extent, Level 2 for important or medium extent, and level 3 for very important or a large extent of controlling capacity.
The results of Pearson Chi-square shown in Table 3 indicate clear differences among all controlling capacity estimations between agroforesters and conventional farmers (p ≤ 0.001). Most agroforesters consider that their farming approach (characterized by the incorporation of trees/shrubs to the system, based on agroecological principles), is very important to control the deterioration of the main biophysical components of the system such as soil, water, and biodiversity. Between 71–88% of agroforesters estimated that the implementation of AFS in highlands is a very important approach (Controlling Level 3 in Table 3) to control the different types of soil erosion caused by water and wind, chemical and physical soil deterioration, and biological and water degradation of their farming system. On the other hand, a smaller proportion of conventional farmers (7–25%) indicated that their farming approach (dominated mainly by monocrops/pastures with poor agroecological application) is very important to control the biophysical deterioration of their farming system. Indeed, most conventional farmers (39–60%) responded that their current farming approach has a limited influence in controlling biophysical degradation (Controlling Level 1 in Table 3).

3.2.2. Impact Levels of Gradual Climate Changes, Extremes and Other Climate-Related Events to Main Farming Systems’ Components and Functions

To complement the sensitivity results of Table 3, which concentrate mainly on the biophysical elements of the systems, farmers were asked to grade the socioeconomic, sociocultural, and ecological impacts caused by the CCRS that affect the farming systems. The impacts were analyzed at farm and landscape levels (on-site and off-site impacts respectively in Table 4 and Table 5). In the case of on-site impacts, the Chi-square results for most of the socioeconomic, sociocultural and ecological perceptions (Table 4) indicate a statistically difference between systems at different significance levels (p ≤ 0.1, 0.05, 0.01 and 0.001).
Most agroforesters indicate that the main CCRS (Table 1 and Table 2) do not influence neither positively nor negatively (no impacts) the functionality of their systems, with greater positive influence tendencies for most of the processes and attributes. On the other hand, conventional farmers mostly consider that CCRS negatively influence the functionality of their systems (Table 4).
Among the socioeconomic processes and attributes, only the perceptions on irrigation water demand, production area (the necessity of new land under cultivation or use), and labor constraints, show no significant differences between systems (p ≥ 0.1). Both agroforesters and conventional farmers perceived that the CCRS have increased the demand for irrigation water, while on the other hand the necessity of new production areas and the labor constraints have not been impacted by CCRS.
In the case of the sociocultural component, results emphasize that conventional farmers perceive greater negative influence of the CCRS on their cultural and recreational opportunities (p ≤ 0.05), conservation of traditional/indigenous knowledge (p ≤ 0.01), food security/self-sufficiency (p ≤ 0.05), and health (p ≤ 0.1). In addition, both agroforesters and conventional farmers perceived similarly (p ≥ 0.1) that stressors have increased conflicts (especially for the control and supply of drinking and irrigation water), and at the same time have positively influenced community institutions, being strengthened due to the increase of water conflicts with other communities and users. Complementary to this, the perceptions related to impacts on the position of socially and economically disadvantaged groups (gender, age, status, ethnicity, etc.) did not show any influence in both systems (p ≥ 0.1).
With respect to the ecological component, Table 4 results indicate that the majority of agroforesters’ perceptions emphasize that all ecological attributes and processes are not influenced by the CCRS, showing positive effects with most of these attributes and processes (p ≤ 0.1, 0.05, 0.01, 0,001). In contrast, conventional farmers perceive mostly negative effects.
Finally, most of the off-site impact perceptions of both agroforesters and conventional farmers (Table 5) do not indicate statistically significant differences between systems (p > 0.1). At the landscape level, CCRS have a negative influence on water availability (groundwater, springs), stream flow in dry season, groundwater/river pollution, buffering/filtering capacity (by soil, vegetation, wetlands) and wind transported sediments. On the other hand, farmers perceive a positive influence on the reduction of downstream flooding and sediment yield. Moreover, perceptions on damage on neighbors’ field and damage on public/private infrastructure, do not show impacts. Downstream siltation is the only process that at the landscape level shows statistically significant differences between systems (p ≤ 0.1). In this case, conventional farmers perceive more reductions on downstream siltation than agroforesters.

4. Discussion

4.1. Exposure

Even though the perceptions of exposure to CCV in this study did not show a difference between AFS and CAS (Table 1), some perceptions differ, and others are aligned with last decade’s observations and future climatic changes and extreme events scenarios. The perceptions of both agroforesters and conventional farmers indicate a clear exposure of their systems to temperature increases in all seasons throughout the year for the last and next decade. Temperature increase perceptions coincide with documented observations and projected trends according to different climate change scenarios for northern and Tropical Andes [17,21,22,44,45]. In the case of precipitation, the smallholder farmers in both production systems perceive a clear precipitation reduction trend throughout the year for the last decade, and expect the same trend to continue for the next decade. Perceptions on precipitation reduction differ from the observed and projected precipitation changes for the Andean region, which mostly indicate an increase in precipitation during recent decades and for future scenarios [17,21,44,46,47]. The difference in precipitation changes between smallholder farmers’ perceptions and observed/projected changes (reported also in local studies for the Northern Andes) are, however, not reliable due to the multitude of microclimates in the region (influenced by internal variability/seasonality, the yearly and decadal variation of El Niño Southern Oscillation (ENSO) and the Pacific Decadal Oscillation (PDO) [20,48]) and the difficulty/inaccuracy of applying averages. The changes in precipitation are less evident than changes in temperature [44], and in the case of the Andes these changes are even less noticeable when there is a lack of long and high-quality precipitation records to establish long-term trends [20,49]. On the other hand, the smallholder farmers’ perceptions on temperature and precipitation changes in the study area are aligned with local observations and projections as indicated in other studies, showing trends of annual temperature increases (+1.4 to +2.4 °C) and annual precipitation reductions in Ecuadorian Northern Andes and areas around the equator (−5% to −20%) [50,51,52,53].
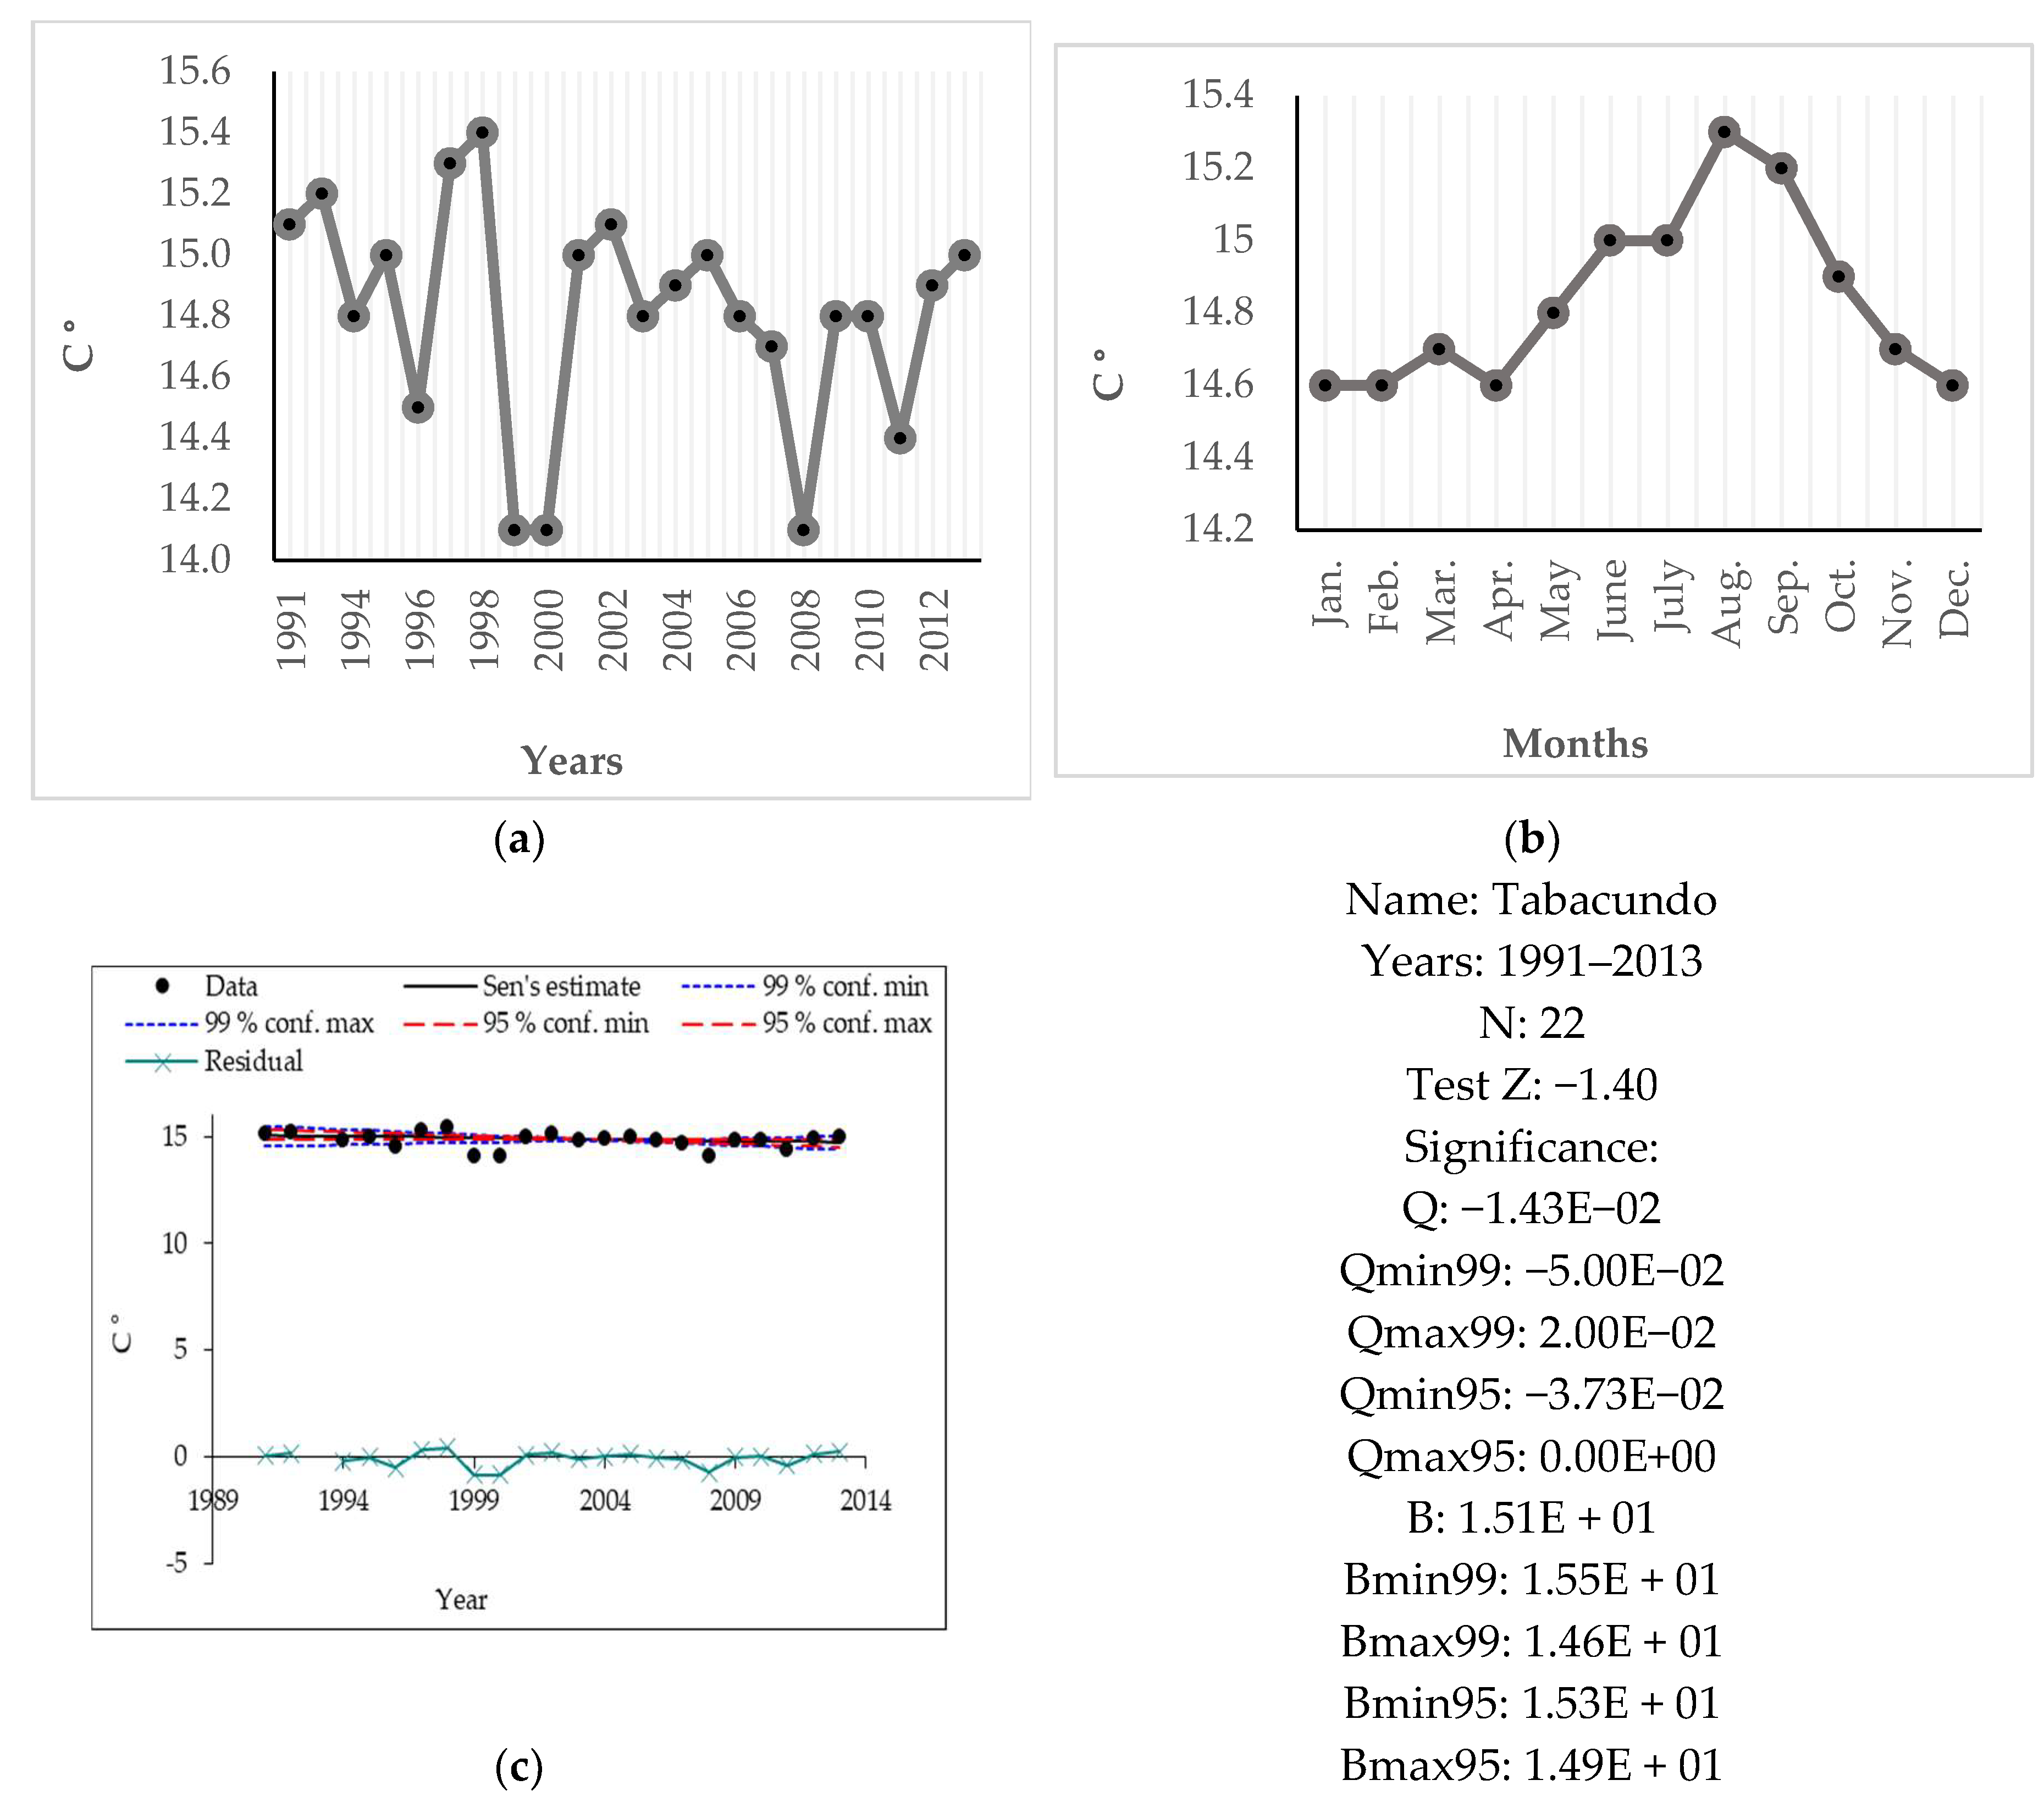
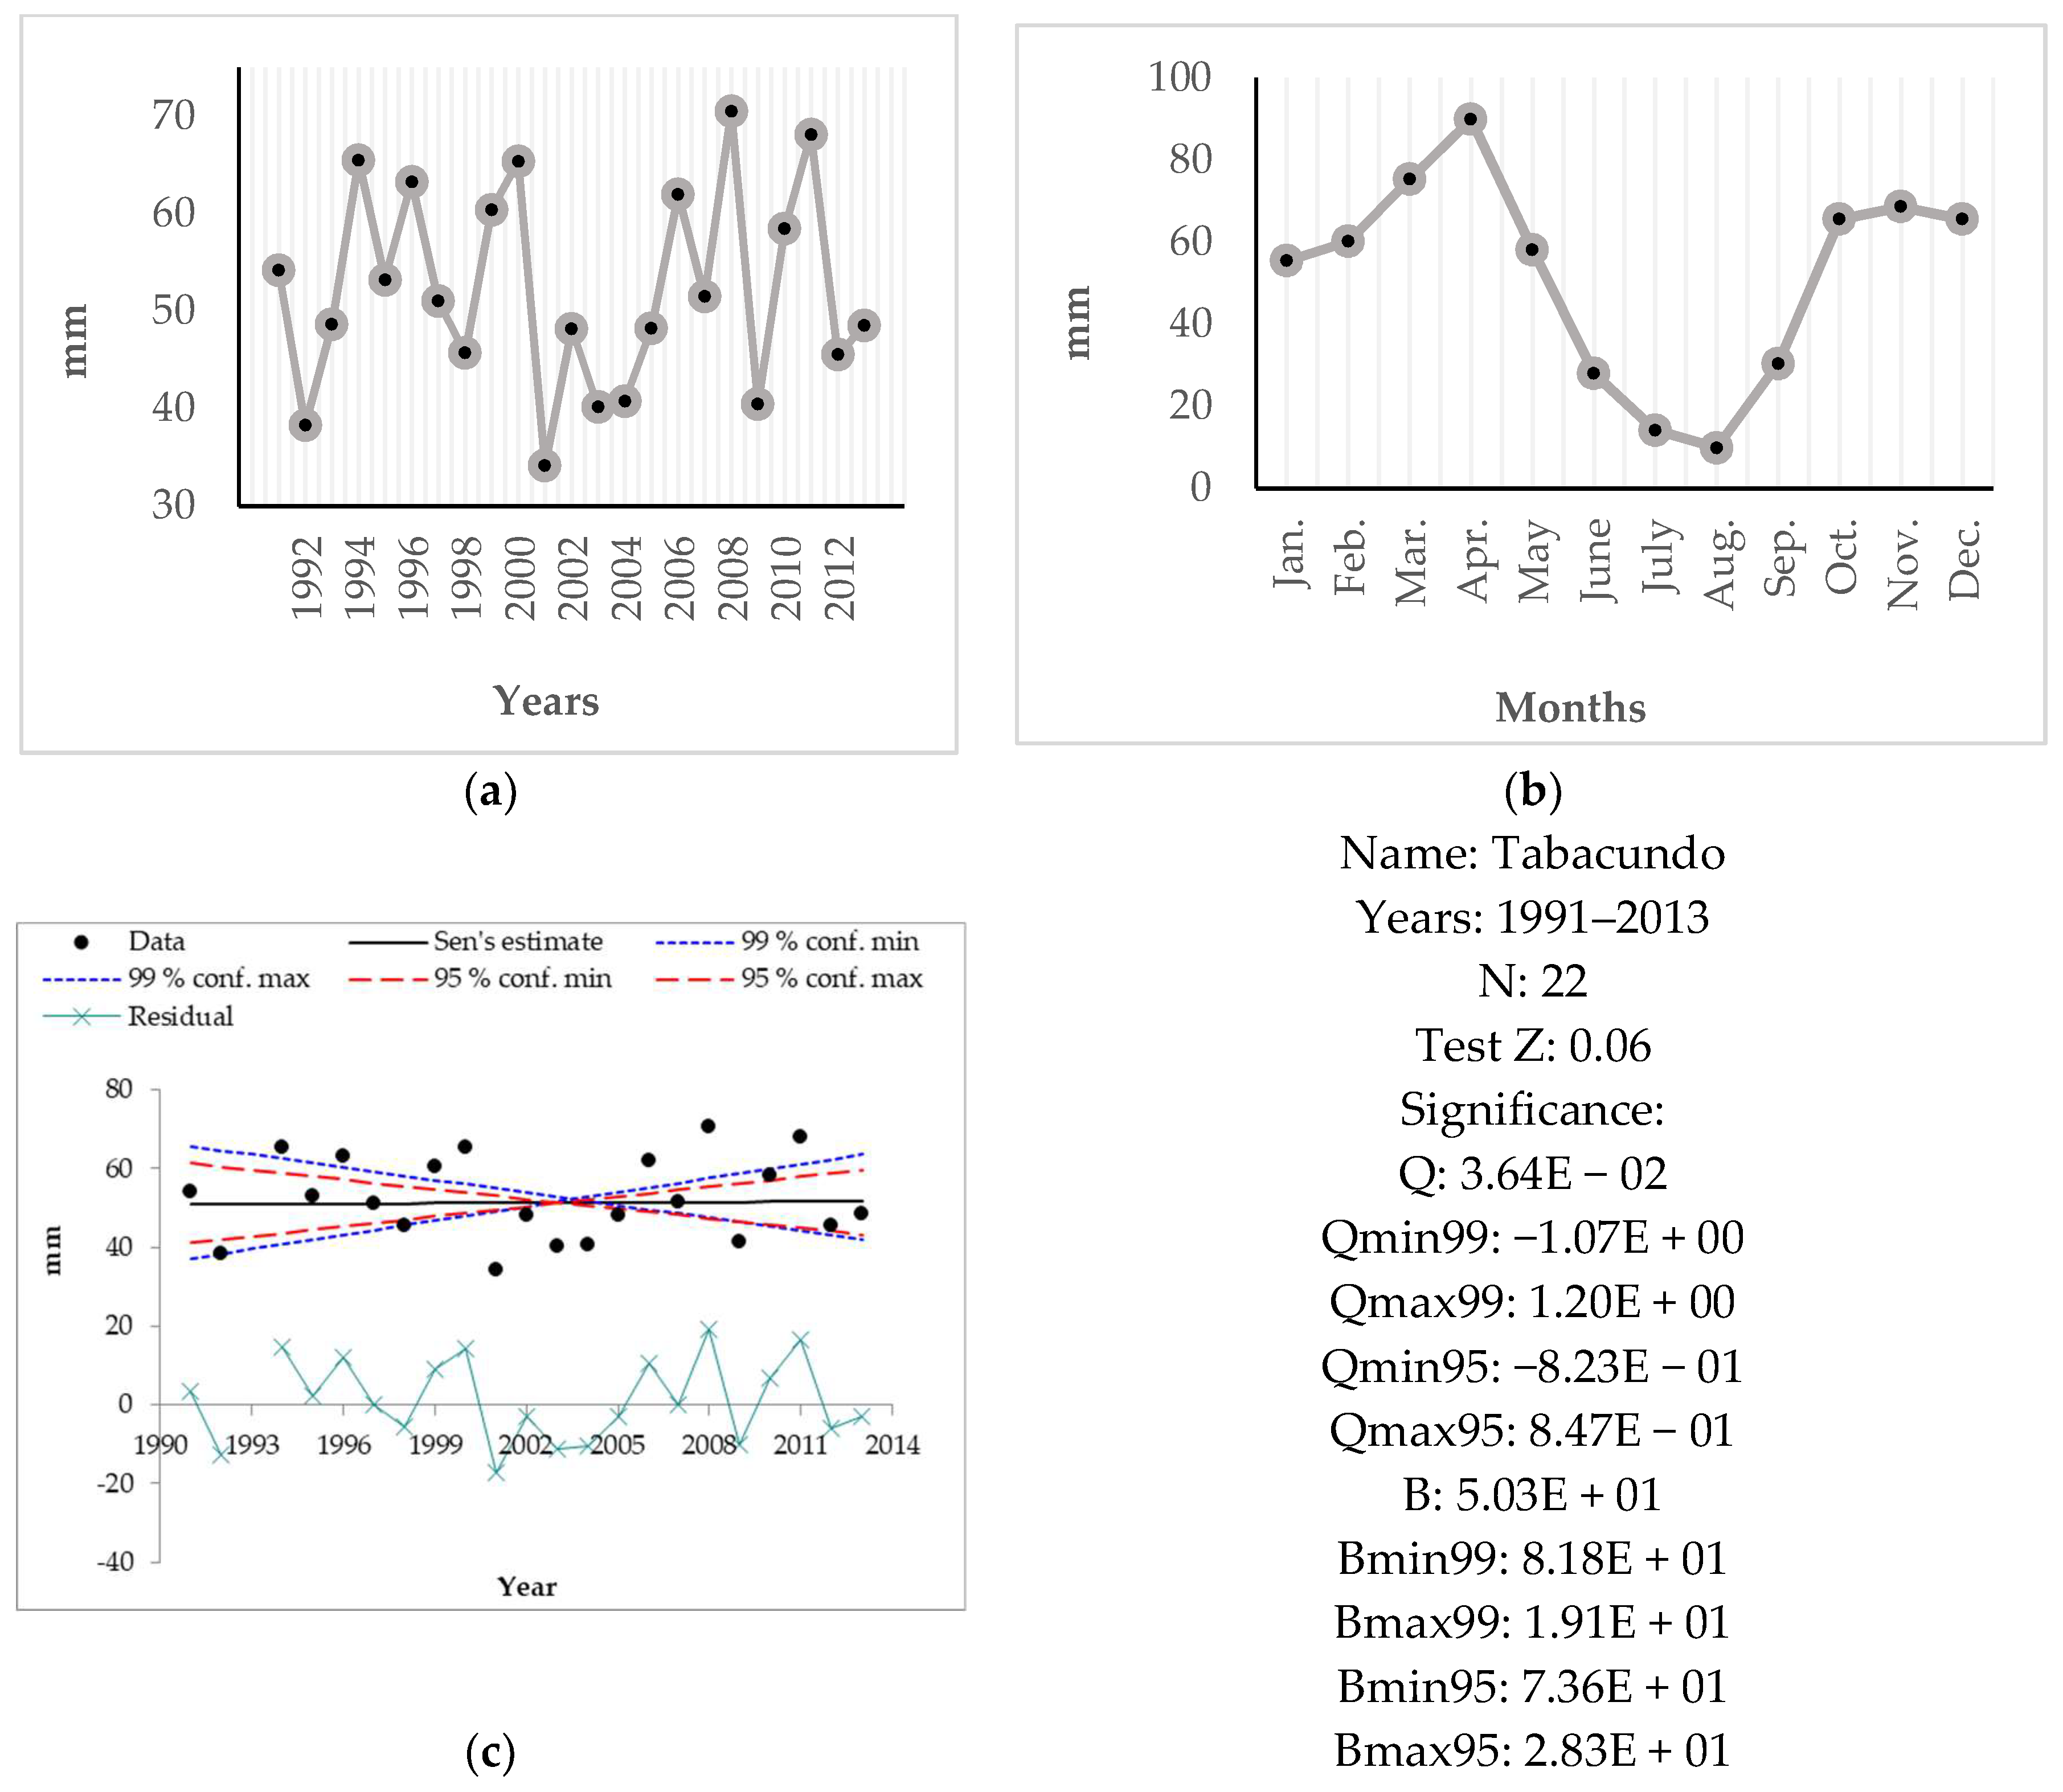
Despite the lack of long-term and high-quality records of precipitation and temperature in the study area, Figure A1, Figure A2, Figure A3 and Figure A4 in Appendix B show the available temperature and precipitation data from basic meteorological stations along the study area. These data—collected by the National Institute of Meteorology and Hydrology (INAMHI) as part of the national meteorological network—were useful to compare the perceptions of farmers and real measurements, in order to establish if the perceptions correspond to actual changes in climate or if they only represent perceptions of climatic variability. In that sense the Mann–Kendall test and Sen’s slope estimations, shown in
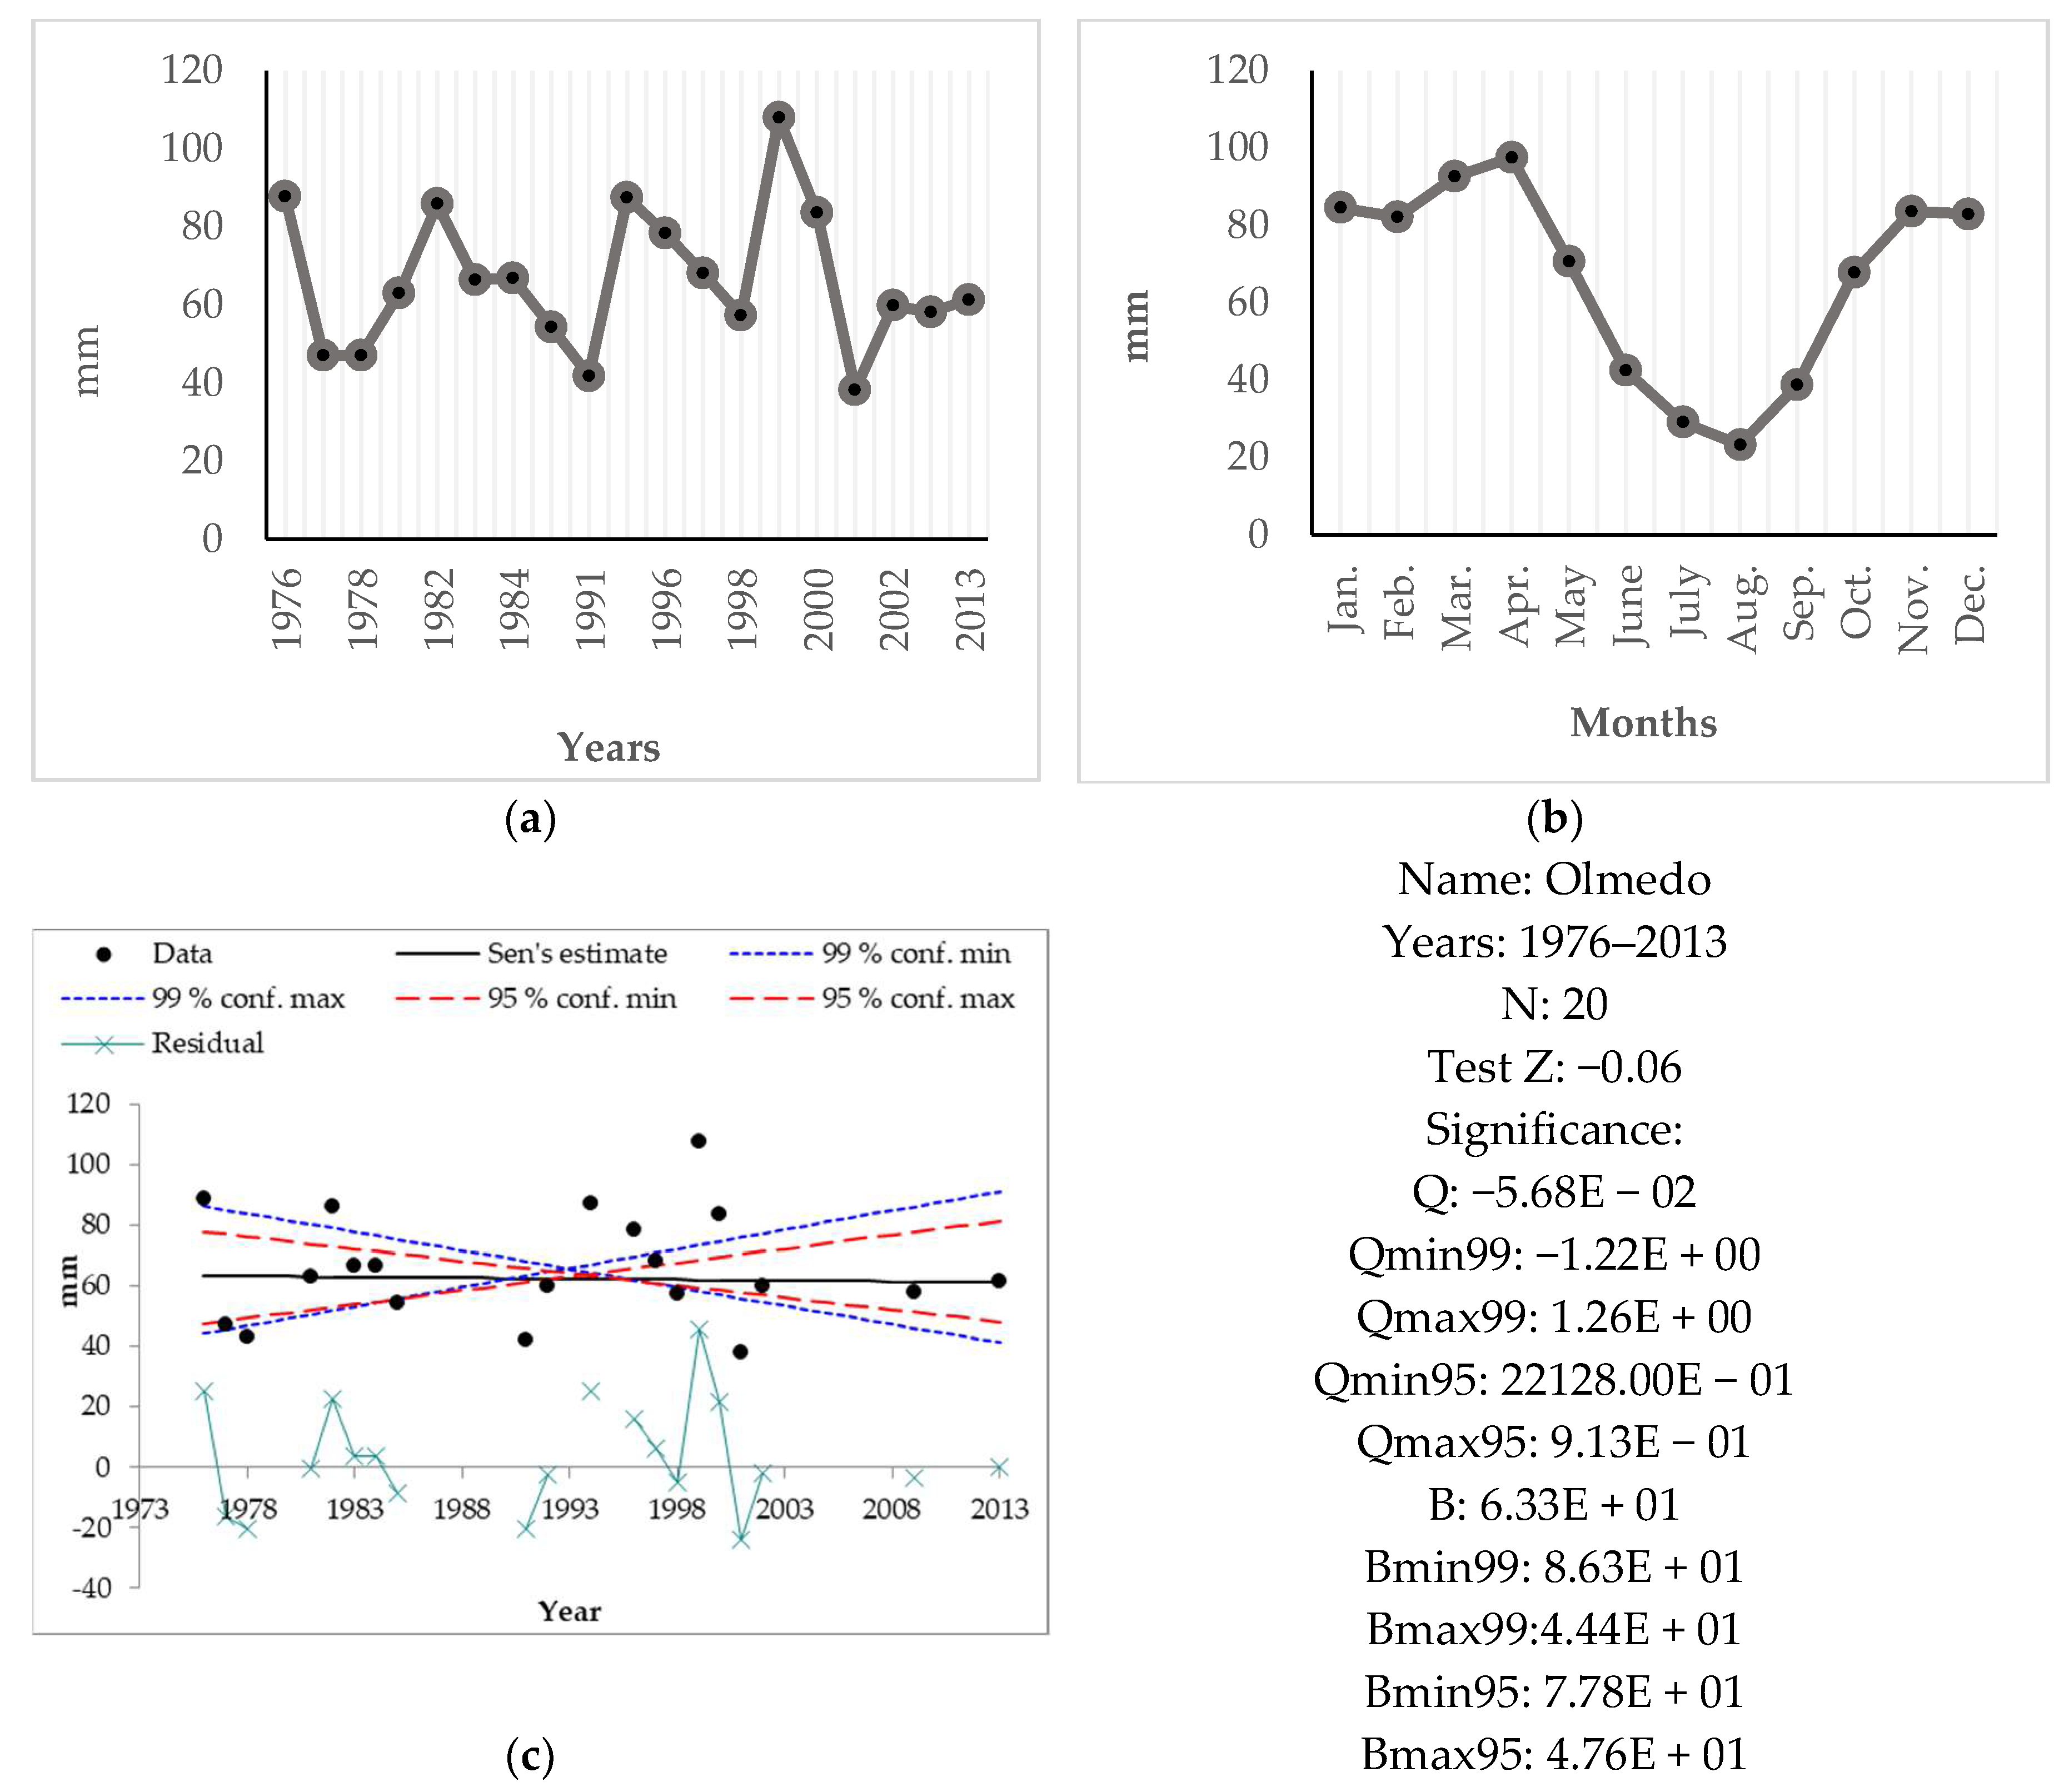
 Figure A1c, Figure A2c, and Figure A4c in 
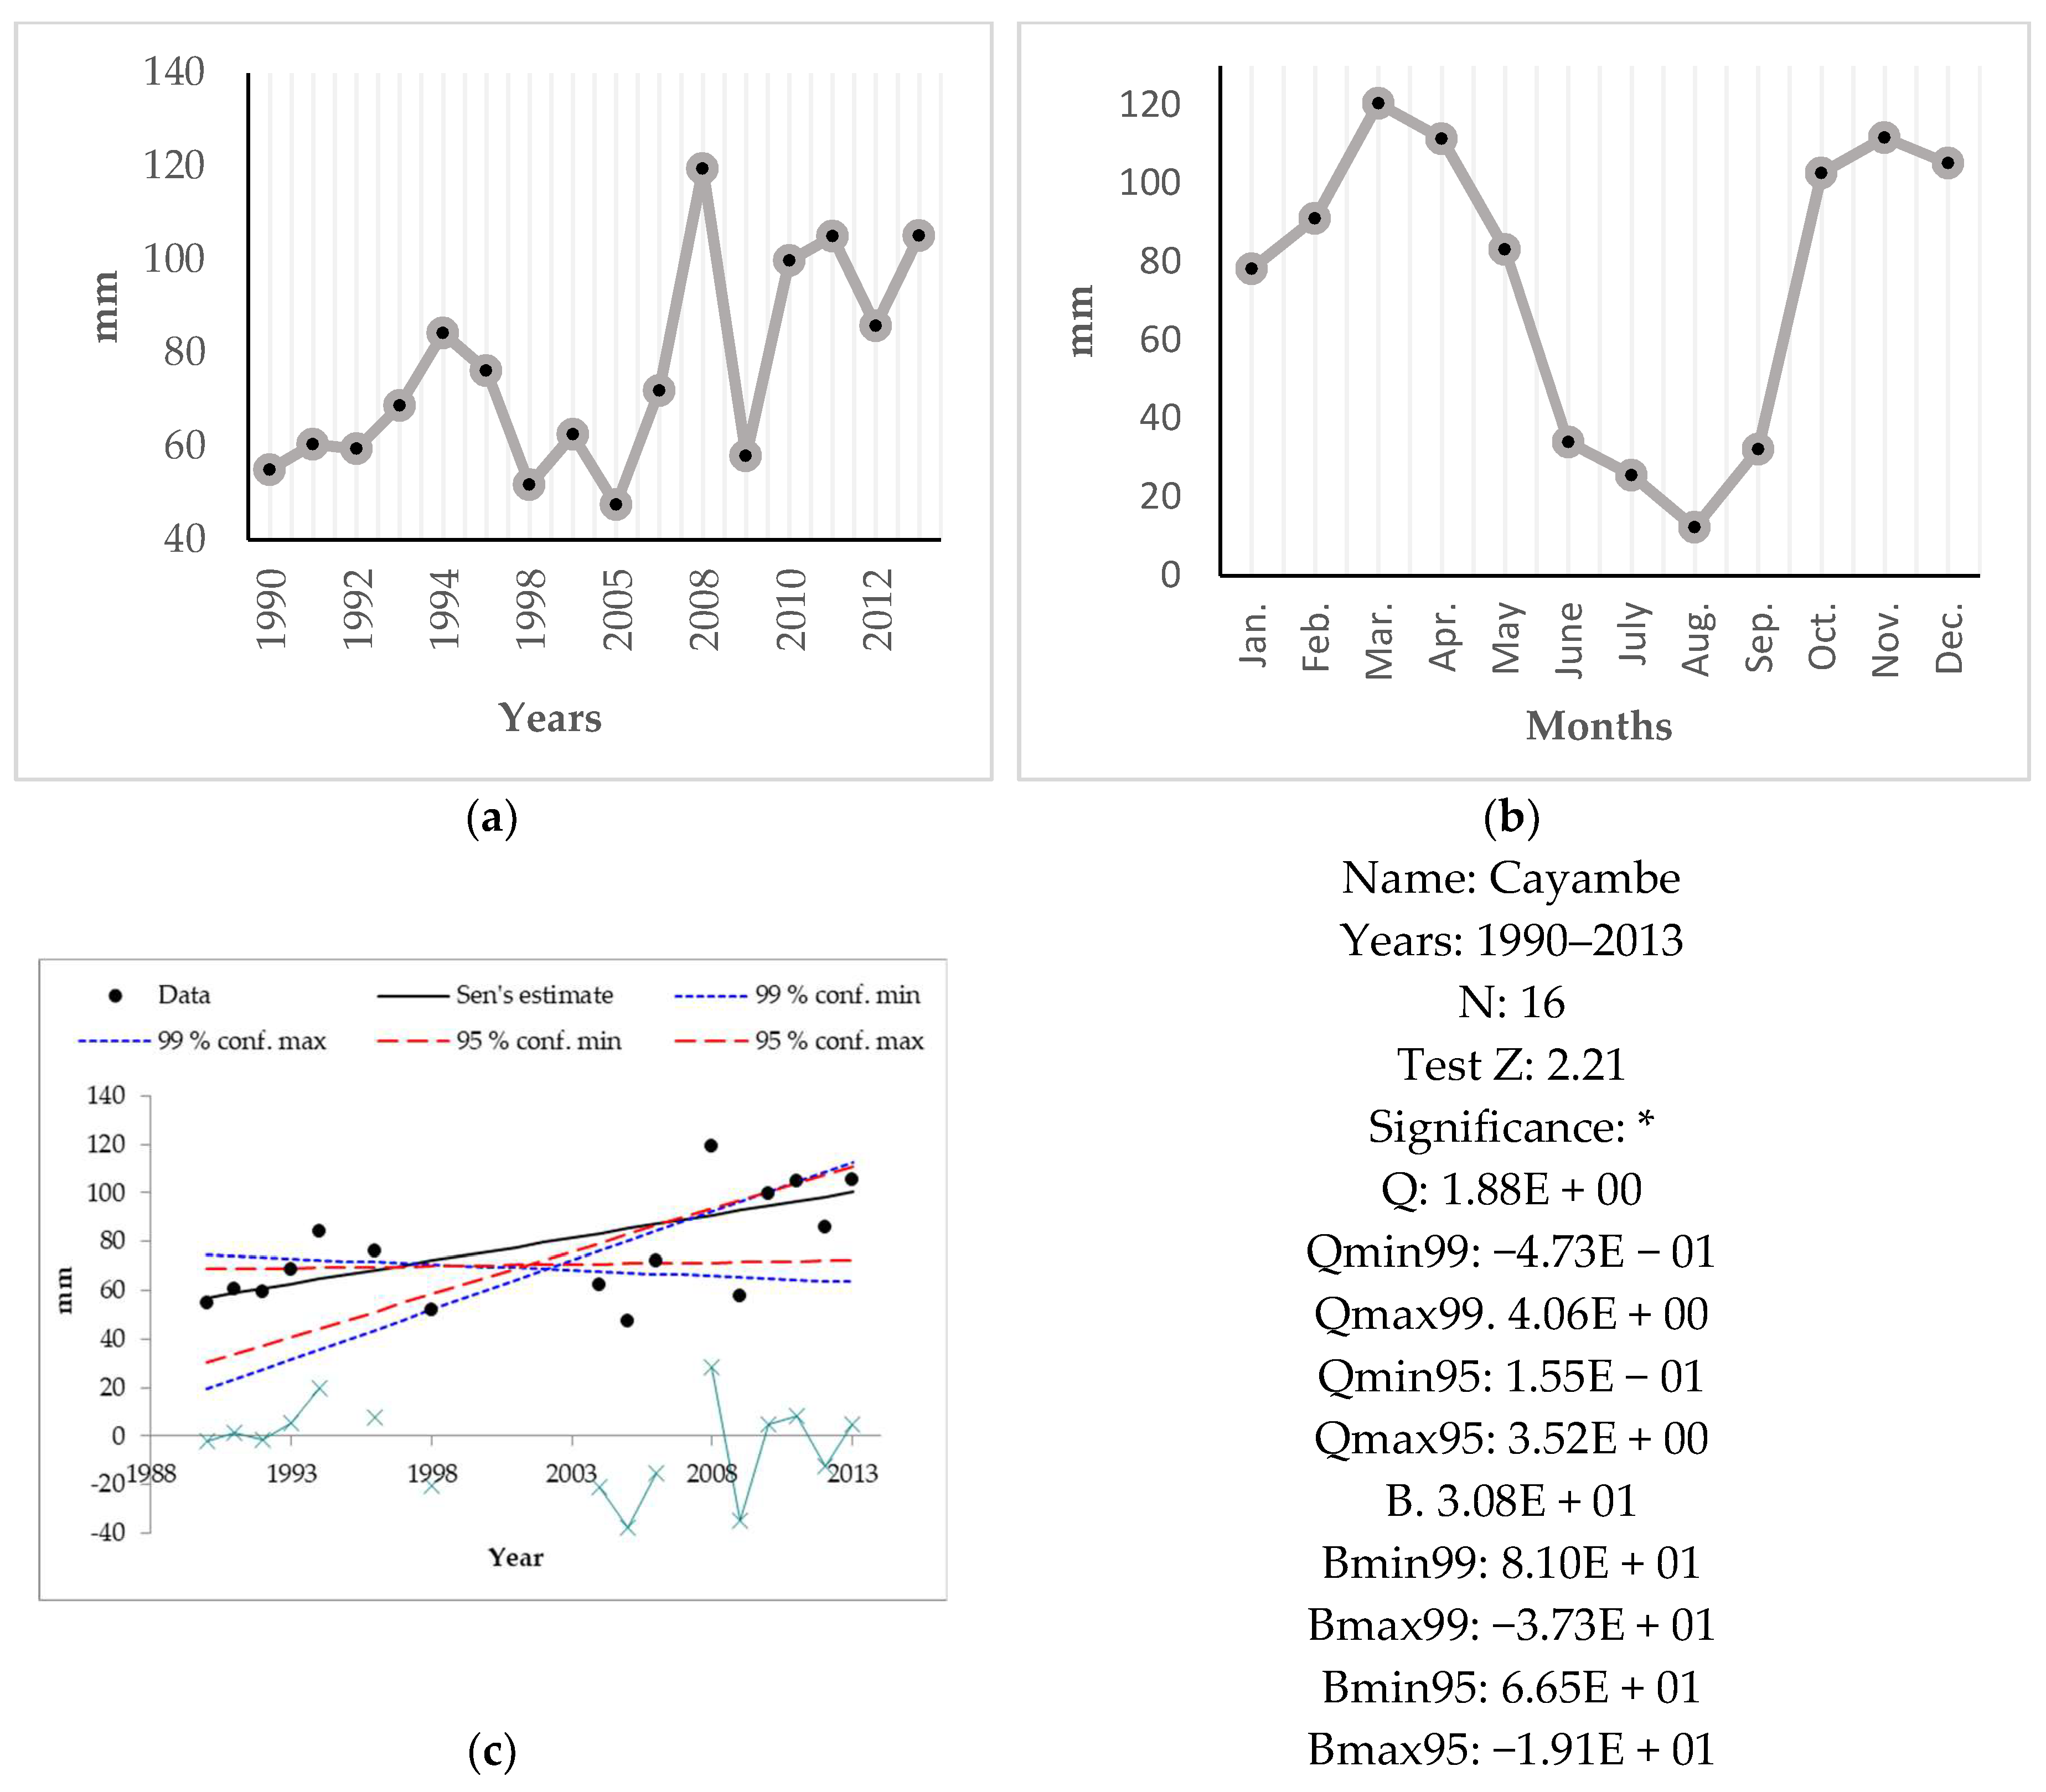
Appendix B, indicate that there are not clear trends for temperature and precipitation. Only in the case of precipitation at Cayambe station (Figure A3c), the Mann–Kendall test and Sen’s slope estimation indicate an upward trend (at 0.05 level of significance), coinciding with the scientific observations of precipitation increases observed/predicted for the Tropical Andes Region. The lack of clear temperature and precipitation trends for most of the available time series in the study area, may be due to the very limited and fragmented data available, reducing the accuracy of the Mann–Kendall test and Sen’s slope estimations. Thus, the trends perceived by farmers in this study may be related to the inter-annual variability (between the years) or the intra-annual variability (between the seasons), as it is clearly observed in the inter-annual and intra-annual variability on precipitation (Figure A2a,b, Figure A3a,b, Figure A4a,b in Appendix B).
The results about smallholder farmers’ perceptions on ECE and other related climate events occurrence (Table 1), during the last and next decade, did not show significant differences between systems, indicating also interesting coincidences and differences with the observed and projected events by science. Perceptions of heavy rainfall reductions are similar to observations and projections indicated in many Andean region studies (about three days above 10 mm per decade) [17,54], with some logical connection with the perceptions of annual and seasonal precipitation reductions stressed above. The reduction of hail events perceived by agroforesters and conventional farmers could be seen as a positive change due to the reduced crop damage when these events take place. It is, however, very difficult to compare perceptions of hail events and real observations due to the lack of long-term and consistent observations in the study area. Some recent studies from other regions on the influence of climate change on the frequency of hailstorm events indicate some similarities with the perceptions of smallholder farmers in this study. For example, hail event reductions and increased hail damage potential due to an increase in hail size were reported and projected for some parts of North America [55], while reductions in hail size and events were measured over China [56]. In the case of the Andean region, some inner tropics studies also report a decrease of hail events during recent decades [57], while outer tropics studies indicate both increases and reductions in the number of hailstorm events without consistent trends, and also highlight the site-specific dependence (region, topography, altitude, latitude, longitude) of this type of climatic event [58,59,60,61]. Furthermore, although farmers’ perceptions about increased incidence of heavy windstorms, droughts/dry periods, and heat waves/warm periods are clearly aligned with scientific observations and projections [17,20,22,54,62,63,64], the perceptions of cold periods/frost increments differ with scientific observations and projections, which show a robust reduction [17,21,45,54].
Among the other climate-related events shown in Table 1, the perception of glacial retreat is the most interesting and controversial. Although most agroforesters and conventional farmers did not perceive important changes related to the Cayambe glacier mass retreat during the last and next decade, a significant proportion of conventional farmers (33%) perceived a retreat process, while only 10% of agroforesters perceived the same process (Table 1). Considering that the retreat of tropical glaciers, accelerated during ENSO periods, represents such strong evidence of global warming [17,21,44,49,59,65,66], the results in this study are a surprising and unexpected result. The stable Cayambe glacier mass condition perceived by most of the farmers is not aligned with the retreat process indicated in some studies [67,68], which report a decrease between 25% and 48% of the glacier area during last decades (1979–2009). The lack of awareness about the Cayambe glacier retreat showed by farmers, may be explained by the lack of perceptible events and impacts related to the deglaciation process (Table 4).
Even though the perceptions of agroforesters and conventional famers about the trends of the main gradual climate changes, extremes, and other climate-related events affecting their production systems are practically the same (Table 1), the number and type of the affecting climate and non-climate stressors show important differences and similarities between systems (Table 2). The greater exposure perceived by conventional farmers, shown in the more complex CCRS categories (formed by five and six stressors) and the greater incidence of specific stressors, especially droughts, radiation and PWD outbreaks (Table 2), suggests that CAS are more vulnerable to CCV than AFS. The lower exposure for AFS support the findings of other studies suggesting that production systems with agroecological approaches, including agroforestry, tend to be less vulnerable to the negative effects of climate change, extremes and other climate-related events described above [69,70,71,72]. It is important to note that the greater radiation exposure indicated by conventional farmers (and perceived mainly as the heat stress suffered by farmers and animals during farming activities) is one of the less studied climate stressors, which will have important consequences in the productivity of the systems and in farmers’ health [18,73]. Furthermore, the less radiation/heat stress perceived by agroforesters may be explained by the favorable shade and environmental conditions (buffering functions) provided by trees and shrubs in these type of systems [69]. Considering the lack of data about ultraviolet radiation exposure and heat stress-related illnesses in agricultural workers worldwide, and the fact that the studied production systems are located in equatorial highlands (2500–3300 m.a.s.l) where the ultraviolet radiation index (UVI) measurements are probably the highest on the planet [74,75], the solar radiation increase reported by farmers in this study is an important subject for further research due to its influence on productivity and farmers’ health. Some farmers in this study have already indicated that the exposure to stronger solar radiation and hot temperatures are increasing the cases of heat exhaustion, sunburn, and the chronic effects on the skin and eyes, such as photoaging, cortical cataract, and pterygium. These are common disorders reported in other studies and specialized literature that emphasize the increase of skin cancers worldwide and in the Andean region [73,74,76,77,78].

4.2. Sensitivity

Farmers’ perceptions about the sensitivity of the main biophysical components of the farming systems (soil, water, and biodiversity) to the impacts of ECE and gradual climate changes indicate that AFS are less sensitive than CAS to negative impacts. Furthermore, AFS have better capacities to control land and soil degradation, including erosion control, chemical and physical deterioration of soil and the biological and water degradation of the system (Table 3). Taking into consideration that water and wind erosion are the most common drivers for soil deterioration worldwide (including Ecuador and the study area [50,79,80,81]), and that soil deterioration processes will be enhanced by the influence of CCV and ECE, the better capacity of AFS to control land and soil degradation represent important advantages in the maintenance of soil fertility (a basic requirement to guarantee the system’s productivity and food security of smallholder farmers’ households in developing countries [82]). It is also important to remark that the warmer conditions and the changes in precipitation regimes observed and expected for the Andes and other mountain regions are accelerating decomposition and reducing soil organic matter [83,84], one of the key soil fertility components. Therefore, the greater capacity showed by AFS to increase soil organic matter and nutrient availability/supply/recycling (Table 3) represents a significant contribution towards maintaining soil fertility and reducing vulnerability to CCV. The greater contribution of soil organic matter and nutrient availability perceived by agroforesters in this study support the findings of other studies that show how organic and agroecological farming systems, included AFS, contain higher soil organic matter content and lower nutrient losses per unit area than conventional systems [85,86]. In the case of physical properties of soils, the perceptions of agroforesters highlighted the better conditions of AFS to improve the texture and structure of top/subsoil, thereby contributing to less crusting, sealing, compaction, and hardpan problems. It is also interesting to note that the positive influence of agroecological practices and the incorporation of tress/shrubs in AFS is reflected in the more positive agroforesters’ perceptions on soil stabilization and infiltration properties than conventional farmers (Table 3). The perceived ability of AFS in reducing compaction and improving texture, structure and infiltration of top/subsoil, will also contribute to maintain soil fertility, enhancing the physical and chemical soil processes (such as mass flow, diffusion of water, ions and gases), avoiding wind and water erosion, and reducing the emission of greenhouse gases (such as CO2, CH4 and N2O); common benefits attributed to well-structured and non-compacted soils [87].
Among the biophysical controlling factors considered in the evaluation of production systems’ sensitivity in this study, the processes included in the control of biological degradation show the greater positive influence in the perceptions of agroforesters compared to conventional farmers (Table 3). Taking into consideration that global warming and climate change are contributing to the acceleration of processes related to biodiversity and agrobiodiversity loss at local, regional, and global levels [88,89,90,91,92,93], the greater agrobiodiversity of AFS are important advantages to reduce the vulnerability, maintain the functionality of systems, enhance food security of households, and therefore increasing the overall systems’ resilience [89,94,95,96]. The higher number of perceptions about the positive influence of AFS in avoiding biological degradation and promoting agrobiodiversity could be related to the greater cultivated and associated agrobiodiversity (in number of species, varieties and breeds) found for the same AFS in our previous paper [23]. It is important to remark that among the biological degradation factors presented in Table 3, the greater capacity of AFS to increase pest control and beneficial species, and reduce invasive alien species, represent undeniable advantages to maintain food security and yields, through reducing vulnerability to pests/diseases attacks and expansion, which are well documented problems expected to be intensified by global warming and CCV [12,17,97,98].
Finally, AFS in this study show better capacity to control water degradation than CAS, especially through increasing/maintaining water stored in soil, improving water harvesting/collection, reducing evaporation and supporting water spreading (Table 3). Taking into account that scientific observations and projections for the Tropical Andes indicate less and more erratic precipitation, temperature and evapotranspiration increases, and longer drought periods [12,17,20,21,50,54,98], the greater capacity of AFS to maintain and enhance water availability represents a fundamental advantage to reduce sensitivity and vulnerability of these systems to the predicted warmer and dryer conditions. The findings in this study of better water degradation control for AFS are consistent with other studies stressing the greater drought resilience and soil water-holding capacity of AFS compared to conventional systems [85]. In addition, the less vulnerability and the better water availability presented for AFS in this study could be enhanced by the greater access and diversification of irrigation sources indicated for the same AFS in our previous study [23]. The results clearly indicate that AFS are less sensitive at the farm level than CAS to the impacts of CCV, confirming the findings of other studies and extensive literature related to the better socioeconomic and environmental capacities of these systems to deal with gradual climate changes and extremes.
From the 50 attributes and processes considered for on-site impacts (farm level) in Table 2, the majority of them (44 attributes and processes) do not show any negative effects in the case of AFS, suggesting even more positive effects on the functionality of these systems. In contrast, CAS show greater negative effects and therefore higher sensitivity. The same tendency is found also in the socioeconomic and ecological components, being more remarkable among most of the ecological attributes and processes than in the socioeconomic component. Even though there is not a well-defined tendency of the impact levels among the sociocultural attributes and processes, the smallholder farmers perceptions suggest fewer negative impacts on the functionality of AFS. For example, cultural and recreational opportunities, traditional knowledge conservation, food security/self-sufficiency (dependence on external support) and health are not impacted by and CCRS, showing even more positive effects than in CAS. Conflicts have been impacted negatively in both systems, while community institution strengthening is positively impacted. Complementary to this, the position of socially and economically disadvantaged groups (gender, age, status, ethnicity, etc.) is not influenced or impacted in either system.
The reductions in the productivity of major crops (caused mainly by global warming and rain pattern changes) observed and projected for the tropics, are negatively influencing the livelihoods of farmers [12,18,97,99]. Therefore, farming systems that maintain and improve productivity will constitute the most suitable systems to guarantee food security and reduce poverty of millions of smallholder farmers. The lower sensitivity showed by AFS among key socioeconomic attributes and processes related to the system’s productivity (Table 4) represents a very important advantage in reducing the system’s vulnerability and increasing resilience to CCV. In addition, the better ability of AFS in maintaining and enhancing system’s productivity could be seen as an important element to guarantee the food security of smallholder agroforesters’ households. The better figures (indicating no impacts with more positive effects on AFS) perceived on the socioeconomic attributes and processes related to smallholder farmers’ livelihoods (Table 4), represents a greater competitive advantage to enhance agroforesters’ livelihoods and reduce poverty, common problems intensified by CCV [18].
Water availability and quality were also taken into account as key socioeconomic attributes influencing the systems’ productivity (irrigation water) and households’ welfare (drinking water). In that sense the less irrigation and drinking water availability/quality perceived by conventional farmers, suggest a greater vulnerability than in the case of agroforesters. Additionally, both agroforesters and conventional farmers perceived that CCRS have increase the demand of irrigation water (Table 4). These perceptions are consistent with global and regional studies (Tropical Andes) that indicate reductions in the availability and quality of water resources, especially in upland communities, and an increase in irrigation water demand, mainly due to temperature increase, precipitation patterns changes, glacial retreat and wetland damage [9,11,17,20,21,44,83,100]. It is important to add that the non-effect perceived by agroforesters on the availability/quality of irrigation water could be related to the better access and diversification of irrigation sources, as was found for AFS in our previous paper [23].
It is important to consider the negative and positive effects of CCRS in the context of some key sociocultural aspects. The reduction of cultural and recreational opportunities, especially in the case of conventional farmers, are already affecting the participation of farmers in important traditional ceremonies related to their agricultural calendar. Farmers have mentioned that CCV, especially the reduction and changes in precipitation regimes, and the more frequent drought periods, are affecting the sowing and harvesting seasons, reducing the yields of traditional crops (mainly potatoes and maize). Due to yield reductions and the increase of poverty, farmers are not motivated to participate in the celebrations, especially the harvest celebration know as Inti Raymi (Sun festival) in the Andes Region, and as San Pedro´s festivity by the Kayambi People. These celebrations include the sharing of harvest with relatives and other community members [101,102,103]. In the case of conflicts, farmers in both system types indicate that conflicts related to water resources have increased between communities and other users. Water sharing conflicts are more frequent during long drought periods. Agroforesters and conventional farmers’ perceptions of conflict increase for water resources are consistent with perceptions and studies on water availability reductions indicated at landscape level (Table 4) and for Tropical Andes. The deterioration of health conditions, perceived mostly by conventional farmers, are mainly related to temperature and solar radiation increase. Farmers complain that higher temperature and radiation are increasing the cases of heat exhaustion, skin, and eye disorders, as was mentioned and reported by other literature as discussed in the exposure Section 4.1.
Recreational opportunities, traditional/indigenous knowledge conservation, and food security/self-sufficiency also represent important sociocultural aspects, which are without impacts in the case of AFS, but negatively affected in the case of CAS. Recreational opportunities for most of the farmers in this study (more than 70% women) are understood as the opportunities to spend time doing their favorite activities at the farm. Farmers mentioned that their hobby is farming. In that sense, the better recreational opportunities indicated by agroforesters are consistent with their better perceptions on labor constraints, workload and difficulty of farm operations (Table 4). Considering that traditional/indigenous knowledge is one of the key aspects to enhance smallholder farmers’ adaptation and resilience [9,12,17,20,98], the lower effects of CCRS on traditional knowledge conservation indicated by agroforesters may suggest that these farmers have a crucial sociocultural asset to cope and deal with CCV. On the other hand, the decline of traditional/indigenous knowledge conservation perceived by most conventional farmers suggest a loss of important traditional approaches and land management techniques to reduce vulnerability, as has been reported in other literature [12,98,104,105].
Taking into consideration that smallholder farmers’ food security/self-sufficiency, including food access, use, and price stability, constitutes one of the most negatively affected aspects by CCV, especially in low-latitude developing countries [9,12,17,98]. The more positive perceptions by AFS in this regard constitute a relevant advantage to maintain/enhance smallholder farmers’ sustainable livelihoods and reduce the vulnerability to CCV. Most agroforesters perceived that CCRS do not affect their food security, with even a more positive effect in contrast of conventional farmers’ perceptions, which indicate a consistent negative effect on their food security. In addition, recent studies indicate that climate variability and extremes, especially severe droughts, are highly connected with the recent rise in global hunger, being also one of the leading causes of severe food crises. Currently, droughts are responsible for more than 80% of the total damage and losses in global agriculture, especially for the livestock and crop production subsectors [106]. In that sense the lower exposure to droughts for AFS (Table 2) represents an important resilience advantage of these systems compared with CAS. Finally, the no affect perceived by most of agroforesters and conventional farmers on the position of socially and economically disadvantaged groups (gender, age, status, ethnicity, etc.) may suggest that the impacts of CCRS are not yet so evident among specific social groups, or that the farmers in this study (most of them indigenous women) are not aware of the impacts of CCV on specific vulnerable social groups within the community. These perceptions are not consistent with studies indicating that in most developing countries, women and young children can be particularly vulnerable to climate variability and extremes, as can the elderly and socially isolated [9,17,106]. Studies also stress that the prevalence of severe food insecurity is slightly higher among women, with the largest differences found in Latin America [106].
The analysis of the impact level of CCRS in the ecological component show that most of AFS’ attributes and processes are less sensitive to the impacts of CCV than in the case of CAS (Table 4). Most of the agroforesters’ perceptions indicate a clear tendency of no affect, and show more positive influence of the main CCRS among the ecological component. On the contrary, conventional farmers indicate mostly negative effects on their systems. Thus, the more positive perceptions of the AFS in aspects related to water, soil, and biodiversity conservation in Table 4, could be associated with the greater biophysical controlling factors indicated also for AFS in Table 3, supporting the worldwide assumption that AFS are one of the most promising land-use management systems for water, soil and biodiversity conservation and enhancement [69,107,108,109,110]. These represent essential production systems’ elements to be negatively affected and exacerbated by global warming and CCV, especially in the Andes and other mountain regions [11,17,84,100,111]. In addition, it is important to remark that CAS show higher vulnerability in key water-related attributes, such as the reduction in water quantity, quality, soil moisture, and increased evaporation. These perceptions are also aligned with current and projected impacts indicated in the literature, especially for mountains and the Tropical Andes [11,17,20,98,112].
The similar farmers’ perceptions on the sensitivity of the landscape to the impacts of the main CCRS (off-site impacts in Table 5), highlight a common tendency related to the availability and quality of water resources. Water availability and supply are already considered an important problem at the landscape level, especially in the dry season. Less water availability and low flows perceived by agroforesters and conventional farmers are aligned with perceptions on reductions of sediment yields, downstream flooding, and increases in groundwater/river pollution (Table 5). It is interesting how wind erosion aspects (wind speed in Table 3 and wind transported sediments in Table 5) are perceived differently at the farm and landscape levels. Whereas most agroforesters perceived that their farming system approach is very important to control wind erosion at the farm level, and vice versa in the case of conventional farmers (Table 3), the negative effects of wind erosion at the landscape level are similarly perceived by agroforesters and conventional farmers (Table 5). Considering that many studies show that expected dryer conditions caused by CCV will intensify wind erosion processes [11,82,97,98,113,114], the perceptions described above could confirm the extended assumptions that AFS have better capacities than other productive systems to control wind erosion at the farm level, as well as having enormous potential to control erosion at the landscape level [69,85,108,114,115]. Finally, the ”no damage on neighbors’ field” and on ”public/private infrastructure” perceived by agroforesters and conventional farmers (Table 4), suggest that the CCRS, especially extreme events, do not have destructive impacts either at the farm or landscape levels. These perceptions are aligned with the exposure perceptions (Table 1) related to reductions of some destructive extreme events such as heavy rainfall/hail events, or the lack of perceived glacier retrieve, floods, thunderstorms, and fires. On the other hand, the “no damage” perceptions indicated above do not reflect the potential damages caused by the high exposure to heavy winds, drought/dry periods, heat waves/warm periods and cold periods/frost, perceived in Table 1, suggesting that these extremes do not yet have the destructive effects on the farming systems and landscape.

5. Conclusions

This study represents the first and most comprehensive study to evaluate smallholder farmers’ perceptions of the vulnerability of their production systems in the ITKP, and potentially for the whole Andean region. The findings of this research suggest that the complete set of socioeconomic and environmental qualitative data included in the WOCAT climate change questionnaire represents a valid tool for the analysis of farming systems’ vulnerability. Additionally, the qualitative data of this study, based exclusively on farmer’s perceptions, represents a good example of how traditional/indigenous knowledge can be incorporated into a scientific approach.
The results of this study provide an extensive body of qualitative evidence to suggest that the multifunctional properties of AFS have a positive influence in reducing socioeconomic and environmental vulnerability to climate change, variability, and extreme events. The exposure to gradual climate changes and extreme events were perceived similarly by farmers in both system types, coinciding in most cases with scientifically observed changes and projections in the Tropical Andes. It is important to remark that perceptions of agroforesters and conventional farmers on exposure during last decade coincide with their expectations for the future (next decade), being characterized mainly by increases in temperature, heavy windstorms, droughts/dry periods, heat waves/warm periods, cold periods/frost, and reductions in precipitation, heavy rainfall, and hail events. Furthermore, the other climate-related events, such as glacier retreat, thunderstorms, PWD outbreaks, fog, floods, and fires, will not present important changes. The reductions in precipitation perceived by farmers in this study were not aligned with the increases in precipitation observed and projected by science for the inner tropics, but coincide with the reductions reported by local studies for Northern Ecuadorian Andes and around the equator.
A surprising and unexpected result was related to the perceived stability of the Cayambe glacier mass by most agroforesters and conventional farmers. This result is not aligned with the retreat process indicated for other Ecuadorian and Tropical glaciers. On the other hand, perceptions on the exposure of productive systems to the main CCRS identified and prioritized by farmers indicate that CAS are more exposed and vulnerable to droughts, radiation, pests, weeds, and disease outbreaks than AFS. In the case of sensitivity, perceptions on the impacts of ECE and gradual climate changes in the main biophysical farming systems’ components (such as soil, water, and biodiversity) indicate that AFS are less sensitive than CAS to negative impacts, which represents enhanced capacity to control the degradation of land, soil, and water. In addition, sensitivity perceptions related with the impacts of the main gradual climate changes and extremes on key socioeconomic, sociocultural, and environmental process and attributes of the systems, also suggest that AFS—at least at the farm level—are less sensitive than CAS to the negative impacts.
Finally, the results of this study complement the findings of our previous study suggesting that AFS should be promoted in Ecuadorian highlands and other mountain regions, due to the socioeconomic and environmental advantages of these systems to reduce vulnerability, and in supporting and enhancing the sustainability of smallholder livelihoods.

Author Contributions

Conceptualization, R.C.; formal analysis, R.C., M.K. and N.J.H.; funding acquisition, R.C. and M.K.; investigation, R.C.; methods, R.C.; supervision, M.K.; validation, M.K.; writing—original draft, R.C.; writing—review and editing, R.C., M.K. and N.J.H.

Funding

This research received no external funding.

Acknowledgments

This study was supported by the Ecuadorian people and government through a scholarship from the National Secretariat of Higher Education, Science, Technology and Innovation (SENESCYT). We thank the University of Helsinki and the Viikki Tropical Resources Institute (VITRI) for the academic and extra financial support for the field work. We are grateful to the Kayambi People Organization and all the farmers who contributed and shared their traditional knowledge.

Conflicts of Interest

The authors declare no conflict of interest. The founding sponsors had no role in the design of the study, in the collection, analyses or interpretation of data, in the writing of the manuscript and in the decision to publish the results.

Appendix A

Table A1. Farmer’s perceptions on exposure to main gradual climate changes, extremes and other climate-related events. Based on WCCQV2.
1. General Information
Survey No:Date:
Farmer name:
Province:Canton:Community:
Altitude (m.a.s.l): Coordinates:
2. Exposure: General observations of climate change/climate variability
Observed by farmer in the last 10 yearsExpectation by the farmer for the future
Decr. (-)StableIncr. (+)Decr. (-)StableIncr. (+)
2.1. Gradual climate changes
2.1.1 Temperatureannual temperature
wet/rainy season
dry season
2.1.2 Precipitationannual rainfall
wet/rainy season
dry season
2.2. Extreme events
heavy * rainfall events
heavy hail events
heavy windstorms
droughts/dry periods
heat waves/warm periods
cold periods/Frost
2.3. Others climate-related events
Table A2. Farmer’s perceptions on the biophysical controlling factors levels to the impacts of to gradual climate changes, extremes and other climate-related events. Based on WCCQV2.
3. Sensitivity of the main farming system’s biophysical components: Control of impacts
How does the farming system help control impacts of extreme climate events and gradual climate changes?Ranking **Comments/specify
3.1 Controlling soil erosion by water
control of raindrop splash (splash erosion)
control of dispersed runoff: (sheet or interrill erosion)
control of concentrated runoff: (Rill and gully erosion)
reduction of slope angle
reduction of slope length
sediment retention/trapping, sediment harvesting
3.2 Controlling soil erosion by wind
reduction in wind speed
3.3 Controlling chemical soil deterioration
increase in organic matter
increase in nutrient availability (supply, recycling)
reduction of salinity
3.4 Controlling physical soil deterioration
increase of surface roughness
improvement of surface structure (crusting, sealing)
improvement of topsoil structure (compaction)
improvement of subsoil structure (hardpan)
stabilization of soil (e.g., by tree roots against landslides)
increase of infiltration
3.5. Controlling biological degradation
improvement of ground cover
increase of biomass (quantity)
promotion of suitable vegetation species and varieties (quality, e.g., palatable fodder)
promotion of suitable crop varieties
increase in crop < diversification
increase in pest control
increase of beneficial species
reduction of invasive alien species
control of fires
reduction of dry material (fuel for wildfires)
promotion of suitable livestock varieties
increase in livestock diversification
spatial arrangement and diversification of land use
3.6. Controlling water degradation
increase/maintain water stored in soil
improvement of harvesting/collection of water (runoff, dew, snow, etc.)
reduction of evaporation
increase of groundwater level, recharge of groundwater
water spreading
improvement of water quality, buffering/filtering water
3.7. Others (specify)
** 3 = very important/large extent, 2 = important/medium extent, 1 = less important/little extent.
Table A3. On and Off-site impact levels perceptions on gradual climate changes, extremes and other climate-related events affecting the farming system. Based on WCCQV2.
4. Gradual climate change, extreme climate events and other climate-related events impacts and causes
4.1. Indicate the main gradual climate changes, extreme climate events and other climate-related events affecting the farming system *:
4.2. Grading the impacts of gradual climate changes and extreme climate events
Indicate the impacts (benefits/disadvantages) of gradual climate changes and extreme climate events Impact
Decreased/deterioratedNo impactIncreased/Improved
4.2.1. On-site impacts
4.2.1.1. Socioeconomic impacts
Crop yield
Fodder production
Fodder quality
Animal production
Wood production
Risk of production failure
Drinking/household water availability/quality
Irrigation water availability/quality
Demand for irrigation water
Expenses on agricultural inputs
Farm income
Diversification of income sources
Production area (new land under cultivation/use)
Labor constraints
Workload
Difficulty of farm operations
Product diversification
4.2.1.2. Sociocultural impacts
Cultural opportunities (e.g., spiritual, aesthetic, others)
Recreational opportunities
Community institution strengthening
Traditional/Indigenous knowledge conservation
Conflicts
Position of socially and economically disadvantaged groups (gender, age, status, ethnicity, etc.)
Food security/self-sufficiency (dependence on external support)
Health
4.2.1.3. Ecological impacts
Water quantity
Water quality
Harvesting/collection of water
Soil moisture
Evaporation
Surface runoff
Excess water drainage
Recharge of groundwater table/aquifer
Wind velocity
Soil cover
Biomass/above ground C
Nutrient cycling/recharge
Soil organic matter/below ground C
Emission of carbon and greenhouse gases
Soil loss
Soil crusting/sealing
Soil compaction
Salinity
Fire risk
Animal diversity
Plant diversity
Invasive alien species
Beneficial species (predators, earthworms, pollinators)
Biological pests/diseases
Habitat diversity
4.2.2. Off-site impacts
Water availability (groundwater, springs)
Downstream flooding
Stream flow in dry season/reliable and stable low flows
Sediment yield
Downstream siltation
Groundwater/river pollution
Buffering/filtering capacity (by soil, vegetation, wetlands)
Wind transported sediments
Damage on neighbors’ field
Damage on public/private infrastructure
* Example: increase or decrease on temperature, rains, droughts, winds, radiation, cold periods/frost, winds, plagues, etc.

Appendix B

Figure A1. Temperature records 1991–2013 at Tabacundo station: (a) Mean annual temperature, (b) Mean monthly temperature, (c) Annual time series and trend statistics using Mann–Kendall test and Sen’s slope estimates. Based on INAMHI records.
Sustainability 11 02623 g0a1
Figure A2. Precipitation records 1991–2013 at Tabacundo station: (a) Mean annual precipitation, (b) Mean monthly precipitation, (c) Annual time series and trend statistics using Mann–Kendall test and Sen’s slope estimates. Based on INAMHI records.
Sustainability 11 02623 g0a2
Figure A3. Precipitation records 1990–2013 at Cayambe station: (a) Mean annual precipitation, (b) Mean monthly precipitation, (c) Annual time series and trend statistics using Mann–Kendall test and Sen’s slope estimates. Based on INAMHI records.
Sustainability 11 02623 g0a3
Figure A4. Precipitation records 1976–2013 at Olmedo station: (a) Mean annual precipitation, (b) Mean monthly precipitation, (c) Annual time series and trend statistics using Mann–Kendall test and Sen’s slope estimates. Based on INAMHI records.
Sustainability 11 02623 g0a4

References

  1. Ricciardi, V.; Ramankutty, N.; Mehrabi, Z.; Jarvis, L.; Chookolingo, B. How much of the world’s food do smallholders produce? Glob. Food Secur. 2018, 17, 64–72. [Google Scholar] [CrossRef]
  2. Food and Agriculture Organization of the United Nations (FAO). Smallholders and Family Farmers Factsheet. Available online: http://www.fao.org/fileadmin/templates/nr/sustainability_pathways/docs/Factsheet_SMALLHOLDERS.pdf (accessed on 3 November 2016).
  3. Rapsomanikis, G. The Economic Lives of Smallholder Farmers: An Analysis Based on Household Data from Nine Countries; I5251E/1/12.15; Food and Agriculture Organization of the United Nations (FAO): Rome, Italy, 2015. [Google Scholar]
  4. Berdegué, J.A.; Fuentealba, R. Latin America: The State of Smallholders in Agriculture. In New Directions for Smallholder Agriculture; International Fund for Agricultural Development: Rome, Italy, 2011. [Google Scholar]
  5. Lowder, S.K.; Skoet, J.; Raney, T. The Number, Size, and Distribution of Farms, Smallholder Farms, and Family Farms Worldwide. World Dev. 2016, 87, 16–29. [Google Scholar] [CrossRef] [Green Version]
  6. Vadjunec, J.; Radel, C.; Turner, B., II. Introduction: The Continued Importance of Smallholders Today. Land 2016, 5, 34. [Google Scholar] [CrossRef]
  7. Soto, B.; Rodriguez, M.; Falconí, C. (Eds.) Políticas para la Agricultura Familiar en America Latina y el Caribe, 1st ed.; Organización de las Naciones Unidas para la Alimentación y Agricultura (FAO): Santiago, Chile, 2007. [Google Scholar]
  8. Bélanger, J.; Pilling, D. The State of the World’s Biodiversity for Food and Agriculture; FAO Commission on Genetic Resources for Food and Agriculture Assessments: Rome, Italy, 2019; p. 572. [Google Scholar]
  9. Dasgupta, P.; Morton, J.F.; Dodman, D.; Karapinar, B.; Meza, F.; Rivera-Ferre, M.G.; Toure Sarr, A.; Vincent, K.E. Rural areas. In Climate Change 2014: Impacts, Adaptation, and Vulnerability. Part A: Global and Sector Aspects. Contribution of Working Group II to the Fifth Assessment Reports of the Intergovernmental Panel on Climate Change; Field, C.B., Barros, V.R., Dokken, D.J., Mach, K.L., Mastrandea, M.D., Bilir, T.E., Chatterjee, M., Ebi, K.L., Estrada, Y.O., Genova, R.C., et al., Eds.; Cambridge University: Cambridge, UK; New York, NY, USA, 2014; pp. 613–657. [Google Scholar]
  10. Division, P.; United Nations; Department of Economic and Social Affairs. World Population Prospects: The 2015 Revision, Key Findings and Advance Tables. Available online: https://esa.un.org/unpd/wpp/Publications/Files/Key_Findings_WPP_2015.pdf (accessed on 3 December 2016).
  11. Settele, J.; Scholes, R.; Betts, R.; Bunn, S.; Leadley, P.; Nepstad, D.; Overpeck, J.T.; Taboada, M.A. Terrestrial and inland water systems. In Climate Change 2014: Impacts, Adaptation, and Vulnerability. Part A: Global and Sectoral Aspects. Contribution of Working Group II to the Fifth Assessment Report of the Intergovernmental Panel on Climate Change; Field, C.B., Barros, V.R., Dokken, D.J., Mach, K.J., Mastrandrea, M.D., Bilir, T.E., Chatterjee, M., Ebi, K.L., Estrada, Y.O., Genova, R.C., et al., Eds.; Cambridge University: Cambridge, UK; New York, NY, USA, 2014; pp. 271–359. [Google Scholar]
  12. Porter, J.R.; Xie, L.; Challinor, A.J.; Cochrane, K.; Howden, S.M.; Iqbal, M.M.; Lobell, D.B.; Travasso, M.I. Food security and food production systems. In Climate Change 2014: Impacts, Adaptation, and Vulnerability. Part A: Global and Sectoral Aspects. Contribution of Working Group II to the Fifth Assessment Report of the Intergovernmental Panel on Climate Change; Field, C.B., Barros, V.R., Dokken, D.J., Mach, K.J., Mastrandrea, M.D., Bilir, T.E., Chatterjee, M., Ebi, K.L., Estrada, Y.O., Genova, R.C., et al., Eds.; Cambridge University: Cambridge, UK; New York, NY, USA, 2014; pp. 485–533. [Google Scholar]
  13. Easterling, W.; Aggarwal, P.; Batima, P.; Brander, K.; Erda, L.; Howden, M.; Kirilenko, A.; Morton, J.; Soussana, J.-F.; Schmidhuber, S.; et al. Food, fibre and forest products. In Climate Change 2007: Impacts, Adaptation and Vulnerability. Contribution of Working Group II to the Fourth Assessment Report of the Intergovernmental Panel on Climate Change; Parry, M.L., Canziani, O.F., Palutikof, J.P., van der Linden, P.J., Hanson, C.E., Eds.; Cambridge University: Cambridge, UK; New York, NY, USA, 2007; pp. 273–313. [Google Scholar]
  14. Ribot, J. Vulnerability Does not Fall from the Sky: Towards Multi-Scale Pro-Poor Climate Policy. In Social Dimensions of Climate Change: Equity and Vulnerability in a Warming World; Mearns, R., Norton, N., Eds.; The World Bank: Washington, DC, USA, 2010; pp. 47–57. [Google Scholar]
  15. Morton, J.F. The impact of climate change on smallholder and subsistence agriculture. Proc. Natl. Acad. Sci. USA 2007, 104, 19680–19685. [Google Scholar] [CrossRef] [Green Version]
  16. Sietz, D.; Mamani Choque, S.E.; Lüdeke, M.K.B. Typical patterns of smallholder vulnerability to weather extremes with regard to food security in the Peruvian Altiplano. Reg. Environ. Chang. 2012, 12, 489–505. [Google Scholar] [CrossRef]
  17. Magrin, G.O.; Marengo, J.A.; Boulanger, J.-P.; Buckeridge, M.S.; Castellanos, E.; Poveda, G.; Scarano, F.R.; Vicuña, S. Central and South America. In Climate Change 2014: Impacts, Adaptation, and Vulnerability. Part B: Regional Aspects. Contribution of Working Group II to the Fifth Assessment Report of the Intergovernmental Panel on Climate Change; Field, C.B., Barros, V.R., Dokken, D.J., Mach, K.J., Mastrandrea, M.D., Bilir, T.E., Chatterjee, M., Ebi, K.L., Estrada, Y.O., Genova, R.C., et al., Eds.; Cambridge University: Cambridge, UK; New York, NY, USA, 2014; pp. 1499–1566. [Google Scholar]
  18. Olsson, L.; Opondo, M.; Tschakert, P.; Agrawal, A.; Eriksen, S.H.; Ma, S.; Perch, L.N.; Zakieldeen, S.A. Livelihoods and poverty. In Climate Change 2014: Impacts, Adaptation, and Vulnerability. Part A: Global and Sectoral Aspects. Contribution of Working Group II to the Fifth Assessment Report of the Intergovernmental Panel on Climate Change; Field, C.B., Barros, V.R., Dokken, D.J., Mach, K.J., Mastrandrea, M.D., Bilir, T.E., Chatterjee, M., Ebi, K.L., Estrada, Y.O., Genova, R.C., et al., Eds.; Cambridge University: Cambridge, UK; New York, NY, USA, 2014; pp. 793–832. [Google Scholar]
  19. Postigo, J.; Peralvo, M.; López, S. Adaptación y vulnerabilidad de los sistemas productivos andinos. In Panorama Andino de Cambio Climático: Vulnerabilidad y Adaptación en los Andes Tropicales; Cuesta, F., Bustamante, M., Becerra, M.T., Postigo, J., Peralvo, J., Eds.; CONDESAN, SGCAN: Lima, Peru, 2012; pp. 141–171. [Google Scholar]
  20. Schoolmeester, T.; Saravia, M.; Andresen, M.; Postigo, J.; Valverde, A.; Jurek, M.; Alfthan, B.; Giada, S. Outlook on Climate Change Adaptation in the Tropical Andes Mountains. Mountain Adaptation Outlook Series. United Nations Environment Programme; GRID Arendal and CONDESAN: Nairobi, Kenya; Arendal, Norway; Vienna, Austria; Lima, Peru, 2016; p. 94. [Google Scholar]
  21. Urrutia, R.; Vuille, M. Climate change projections for the tropical Andes using a regional climate model: Temperature and precipitation simulations for the end of the 21st century. J. Geophys. Res. 2009, 114. [Google Scholar] [CrossRef] [Green Version]
  22. Reyer, C.P.O.; Adams, S.; Albrecht, T.; Baarsch, F.; Boit, A.; Canales Trujillo, N.; Cartsburg, M.; Coumou, D.; Eden, A.; Fernandes, E.; et al. Climate change impacts in Latin America and the Caribbean and their implications for development. Reg. Environ. Chang. 2017, 17, 1601–1621. [Google Scholar] [CrossRef]
  23. Córdova, R.; Hogarth, N.; Kanninen, M. Sustainability of Smallholder Livelihoods in the Ecuadorian Highlands: A Comparison of Agroforestry and Conventional Agriculture Systems in the Indigenous Territory of Kayambi People. Land 2018, 7, 45. [Google Scholar] [CrossRef]
  24. Maldonado, P. Mapa del Territorio de la Confederación del Pueblo Kayambi; Confederación del Pueblo Kayambi: Cayambe, Ecuador, 2016. [Google Scholar]
  25. Pilataxi, C. Plan Estratégico de Desarrollo del Pueblo Kayambi; Confederación del Pueblo Kayambi: Cayambe, Ecuador, 2001. [Google Scholar]
  26. INEC. Población, Superficie (km2), Densidad Poblacional a Nivel Parroquial. Available online: http://www.ecuadorencifras.gob.ec/informacion-censal-cantonal/ (accessed on 5 October 2016).
  27. Becker, M. Pueblo Kayambi. Available online: http://www.kayambi.org/index.html (accessed on 10 January 2016).
  28. Cañadas, L. El Mapa Bioclimático y Ecológico del Ecuador; Banco Central del Ecuador: Quito, Ecuador, 1983. [Google Scholar]
  29. Medina, G.; Mena, P. Los páramos en el Ecuador. In Los Páramos del Ecuador. Particularidades, Problemas y Perspectivas; Medina, G., Mena, P., Hofstede, R., Eds.; Abya Yala: Quito, Ecuador, 2001; pp. 1–23. [Google Scholar]
  30. Moreno, L. Actualización del Plan de Desarrollo y Ordenemiento Territorial del Gobierno Autónomo Descentralizado Intercultural y Plurinacional Municipal de Cayambe 2015–2025; GADIP Cayambe: Cayambe, Ecuador, 2015. [Google Scholar]
  31. INAMHI. Mapa de Precipitación Media Multianual (1965–1999). Available online: http://www.serviciometeorologico.gob.ec/wp-content/MapasBiblioteca/5%20PrecipitacionA0.pdf (accessed on 3 January 2017).
  32. López, M. Generación de Geo Información para la Gestión del Territorio a Nivel Nacional, Escala 1:25,000, Sistemas Productivos Cantón Cayambe; Instituto Espacial Ecuatoriano y Gobierno Autónomo Descentralizado Provincia de Pichincha: Quito, Ecuador, 2013. [Google Scholar]
  33. INEC. Población por Área, Según Provincia, Cantón y Parroquia de Empadronamiento y Grupos Étnicos. Available online: http://www.ecuadorencifras.gob.ec/informacion-censal-cantonal/ (accessed on 13 January 2017).
  34. Hofstede, R. El Impacto de las actividades humanas sobre el páramo. In Los Páramos del Ecuador. Particularidades, Problemas y Perspectivas; Mena, P., Medina, G., Hofstede, R., Eds.; Abya Yala: Quito, Ecuador, 2001; pp. 161–185. [Google Scholar]
  35. Otavalo, C. Sistematización RESSAK; Red de Economía Solidaria y Soberanía Aliemntaria del Territorio Kayambi (RESSAK): Cayambe, Ecuador, 2015. [Google Scholar]
  36. CODEMIA. Sistematización y Análisis de Los Resultados de la Caracterización Agropecuaria y Mapas Temáticos del Sistema de Riego Cayambe—Pedro Moncayo; Consorcio de Desarrollo de Manejo Integral de Agua y Ambiente (CODEMIA): Cayambe, Ecuador, 2015. [Google Scholar]
  37. Zomer, R.J.; Trabucco, A.; Coe, R.; Place, F.; van Noordwijk, M.; Xu, J.C. Trees on Farms: An Update and Reanalysis of Agroforestry’s Global Extent and Socio-Ecological Characteristics, Working Paper 179. Available online: http://www.worldagroforestry.org/downloads/Publications/PDFS/WP14064.pdf (accessed on 10 May 2015).
  38. World Overview of Conservation Approaches and Technologies (WOCAT). Available online: https://www.wocat.net/en/ (accessed on 24 May 2018).
  39. WOCAT Methods and Tools. Available online: https://www.wocat.net/en/global-slm-database/wocat-tools-and-modules/ (accessed on 24 May 2018).
  40. WOCAT United Nations Convention to Combat Desertification (UNCCD) Recognition. Available online: https://www.wocat.net/en/global-slm-database/unccd-recognition (accessed on 24 May 2018).
  41. WOCAT Climate Change Adaptation Module. Available online: https://www.wocat.net/en/global-slm-database/modules (accessed on 24 May 2018).
  42. WOCAT. Questionnaire on Adaptation of SLM Technologies to Gradual Climate Changes and Climate-Related Extremes. Available online: https://www.wocat.net/library/media/17/ (accessed on 24 May 2018).
  43. Salmi, T.; Määttä, A.; Anttila, P.; Ruoho-Airola, T.; Amnell, T. Detecting Trends of Annual Values of Atmospheric Pollutants by the Mann-Kendall Test and Sen’s Slope Estimates—The Excel Template Application MAKESENS. Available online: https://en.ilmatieteenlaitos.fi/documents/30106/335634754/MAKESENS-Manual_2002.pdf/25bbe115-7f7e-4de3-97d8-5a96ac88499f (accessed on 5 February 2019).
  44. Vuille, M.; Francou, B.; Wagnon, P.; Juen, I.; Kaser, G.; Mark, B.G.; Bradley, R.S. Climate change and tropical Andean glaciers: Past, present and future. Earth-Sci. Rev. 2008, 89, 79–96. [Google Scholar] [CrossRef]
  45. Magrin, G.O. Adaptación al Cambio Climático en América Latina y el Caribe. Available online: https://repositorio.cepal.org/bitstream/handle/11362/39842/S1501318_es.pdf;jsessionid=3AC5E521B7B7D0B5240BB99C152645B8?sequence=1 (accessed on 13 September 2018).
  46. Haylock, M.R.; Peterson, T.C.; Alves, L.M.; Ambrizzi, T.; Anunciação, Y.M.T.; Baez, J.; Barros, V.R.; Berlato, M.A.; Bidegain, M.; Coronel, G.; et al. Trends in Total and Extreme South American Rainfall in 1960–2000 and Links with Sea Surface Temperature. J. Clim. 2006, 19, 1490–1512. [Google Scholar] [CrossRef] [Green Version]
  47. Buytaert, W.; Ramírez-Villegas, J. Generación de escenarios desagregados del cambio climático para los Andes Tropicales. In Panorama Andino de Cambio Climático: Vulnerabilidad y Adaptación en los Andes Tropicales; Cuesta, F., Bustamante, M., Becerra, M.T., Postigo, J., Peralvo, J., Eds.; Consorcio para el Desarrollo Sostenible de la Ecoregión Andina (CONDESAN), Secretaría General de la Comunidad Andina (SGCAN): Lima, Peru, 2012; pp. 37–57. [Google Scholar]
  48. Buytaert, W.; Vuille, M.; Dewulf, A.; Urrutia, R.; Karmalkar, A.; Célleri, R. Uncertainties in climate change projections and regional downscaling in the tropical Andes: Implications for water resources management. Hydrol. Earth Syst. Sci. 2010, 14, 1247–1258. [Google Scholar] [CrossRef]
  49. Vuille, M.; Bradley, R.S.; Werner, M.; Keimig, F. 20th Century Climate Change in the Tropical Andes: Observations and Model Results. In Climate Variability and Change in High Elevation Regions: Past, Present & Future; Diaz, H.F., Ed.; Springer: Dordrecht, The Netherlands, 2003; pp. 75–99. [Google Scholar]
  50. Jiménez, S.; Castro, L.; Yépez, J.; Wittmer, C. Proyecto Impacto del Cambio Climático en la Agricultura de Subsistencia en el Ecuador. Available online: https://www.fundacioncarolina.es/wp-content/uploads/2014/08/AI66.pdf (accessed on 16 September 2018).
  51. Muñoz, A.G. Validación y Análisis de Consenso de Modelos de Escenarios de Cambio Climático para Ecuador. Available online: http://www.ambiente.gob.ec/wp-content/uploads/downloads/2014/07/Informe-An%C3%A1isis-de-Consenso.pdf (accessed on 17 September 2018).
  52. Palacios, E.; Céceres, L. Estudio de Cambio Climático en el Ecuador. Análisis de Vulnerabilidad y Adaptatción. Escenarios de Cambio Climático en el Ecuador. Investigación y Aplicación; Instituto Nacional de Meteorología e Hidrología (INAMHI): Quito, Ecuador, 1998; p. 124. [Google Scholar]
  53. Mejía, R.; Ontaneda, G.; Cáceres, L. Estudio del Cambio Climático en el Ecuador. Evidencia del Cambio Climático en el Ecuador; Instituto Nacional de Meteorología e Hidrología (INAMHI): Quito, Ecuador, 1998; p. 85. [Google Scholar]
  54. Donat, M.G.; Alexander, L.V.; Yang, H.; Durre, I.; Vose, R.; Dunn, R.J.H.; Willett, K.M.; Aguilar, E.; Brunet, M.; Caesar, J.; et al. Updated analyses of temperature and precipitation extreme indices since the beginning of the twentieth century: The HadEX2 dataset. J. Geophys. Res. 2013, 118, 2098–2118. [Google Scholar] [CrossRef] [Green Version]
  55. Brimelow, J.C.; Burrows, W.R.; Hanesiak, J.M. The changing hail threat over North America in response to anthropogenic climate change. Nat. Clim. Chang. 2017, 7, 516. [Google Scholar] [CrossRef]
  56. Ni, X.; Zhang, Q.; Liu, C.; Li, X.; Zou, T.; Lin, J.; Kong, H.; Ren, Z. Decreased hail size in China since 1980. Sci. Rep. 2017, 7, 10913. [Google Scholar] [CrossRef] [Green Version]
  57. Cepeda, E. Recopilación Histórica y Análisis Climatológico de Eventos de Granizada Ocurridos Sobre Bogotá y su Relación Con el Cambio Climático Global. Master’s Thesis, Universidad Nacional de Colombia, Bogotá, Colombia, 2010. [Google Scholar]
  58. Mezher, R.N.; Doyle, M.; Barros, V. Climatology of hail in Argentina. Atmos. Res. 2012, 114–115, 70–82. [Google Scholar] [CrossRef]
  59. Valdivia, C.; Thibeault, J.; Gilles, J.L.; García, M.; Seth, A. Climate trends and projections for the Andean Altiplano and strategies for adaptation. Adv. Geosci. 2013, 33, 69–77. [Google Scholar] [CrossRef]
  60. De la Torre, A.; Hierro, R.; Llamedo, P.; Rolla, A.; Alexander, P. Severe hailstorms near Southern Andes in the presence of mountain waves. Atmos. Res. 2011, 101, 112–123. [Google Scholar] [CrossRef]
  61. Rasmussen, K.L.; Zuluaga, M.D.; Houze, R.A. Severe convection and lightning in subtropical South America. Geophys. Res. Lett. 2014, 41, 7359–7366. [Google Scholar] [CrossRef] [Green Version]
  62. Fernandez, M.A.; Bucaram, S.J.; Renteria, W. Assessing local vulnerability to climate change in Ecuador. SpringerPlus 2015, 4, 738. [Google Scholar] [CrossRef] [PubMed]
  63. Marengo, J.A.; Soares, W.R.; Saulo, C.; Nicolini, M. Climatology of the Low-Level Jet East of the Andes as Derived from the NCEP–NCAR Reanalyses: Characteristics and Temporal Variability. J. Clim. 2004, 17, 2261–2280. [Google Scholar] [CrossRef]
  64. Emk, P. A Climatology of South Ecuador with Special Focus on the Major Andean Ridge as Atlantic-Pacific Climate Divide. Ph.D. Thesis, Friedrich-Alexander-Universität Erlangen-Nürnberg (FAU), Schouwen-Duiveland, Niederlande, 2007. [Google Scholar]
  65. Francou, B.; Rabatel, A.; Soruco, A.; Sicart, J.E.; Silvestre, J.E.; Ginot, P.; Cáceres, B.; Condom, T.; Villacis, M.; Ceballos, J.; et al. Glaciares de los Andes Tropicales Víctimas del Cambio Climático; CAN – PRAA - IRD: La Paz, Bolivia, 2014; p. 99. [Google Scholar]
  66. Vuille, M.; Bradley, R.S.; Francau, B.; Kaser, G.; Mark, B.G. Clliimate Change in the Tropical Andes, Impacts and Consequences for Glaciation and Water Resources. Part I: The Scientific Basis. Available online: http://www.care.org.pe/wp-content/uploads/2015/06/1-PRAA-Climate-change-in-the-Tropical-Andes-Impacts-and-consequences-for-glaciation-and-water.pdf (accessed on 18 August 2018).
  67. Brito, C. Análisis Espacial y Temporal de la Variación de la Cobertura Nivo-Glaciar en el Nevado Cayambe Mediante Imágenes Satelitales Landsat y Sistemas de Información Geográfica (SIG). Bachelor’s Thesis, Escuela Politécnica Nacional, Quito, Ecuador, 2014. [Google Scholar]
  68. Cáceres, B. Actualización del Inventario de tres Casquetes Glaciares del Ecuador. Available online: https://core.ac.uk/download/pdf/39836084.pdf (accessed on 9 October 2018).
  69. Van Noordwijk, M.; Bayala, J.; Hairiah, K.; Lusiana, B.; Muthuri, C.; Khasanah, N.M.; Mulia, R. Agroforestry Solutions for Buffering Climate Variability and Adapting to Change. In Climate Change Impact and Adaptation in Agricultural Systems; Fuhrer, J., Gregory, P.J., Eds.; CAB-International: Wallingford, CT, USA, 2014; pp. 216–232. [Google Scholar]
  70. Verchot, L.V.; Van Noordwijk, M.; Kandji, S.; Tomich, T.; Ong, C.; Albrecht, A.; Mackensen, J.; Bantilan, C.; Anupama, K.V.; Palm, C. Climate change: Linking adaptation and mitigation through agroforestry. Mitig. Adapt. Strateg. Glob. Chang. 2007, 12, 901–918. [Google Scholar] [CrossRef]
  71. Lasco, R.D.; Delfino, R.J.P.; Espaldon, M.L.O. Agroforestry systems: Helping smallholders adapt to climate risks while mitigating climate change. Wiley Interdiscip. Rev. 2014, 5, 825–833. [Google Scholar] [CrossRef]
  72. Selvarajh-Jaffery, R.; Obanyi, G.; Wagner, B.; Sulzberger, E. (Eds.) Tackling Global Challenges through Agroforestry. Annual Report 2006; World Agroforestry Centre (ICRAF): Nairobi, Kenya, 2007; p. 60. [Google Scholar]
  73. Wästerlund, S.D. Managing Heat in Agricultural Work: Increasing Worker Safety and Productivity by Controlling Heat Exposure; FAO: Roma, Italy, 2018; p. 53. [Google Scholar]
  74. Harari Arjona, R.; Piñeiros, J.; Ayabaca, M.; Harari Freire, F. Climate change and agricultural workers’ health in Ecuador: Occupational exposure to UV radiation and hot environments. Ann. Ist. Super Sanità 2016, 52, 368–373. [Google Scholar] [PubMed]
  75. Ecuadorian Civilian Space Agency Publishes the Hyperion Report: Ecuador, Peru and Colombia Receiving the Highest Uv Radiation Dose on the Planet. Available online: http://www.exa.ec/bp21/index-en.html (accessed on 22 October 2018).
  76. Vecchia, P.; Hietanen, M.; Stuck, B.E.; van Deventer, E.; Niu, S. (Eds.) Protecting Workers from Ultraviolet Radiation; International Commission on Non-Ionizing Radiation Protection: Ingolstradt, Germany, 2007; p. 109. [Google Scholar]
  77. Lucas, R.; McMichael, T.; Smith, W.; Armstrong, B. Solar Ultraviolet Radiation. In Global Burden of Disease from Solar Ultraviolet Radiation; Prüss-Üstün, A., Zeeb, H., Mathers, C., Repacholi, M., Eds.; World Health Organization: Geneva, Switzerland, 2006; p. 250. [Google Scholar]
  78. Global Solar UV Index: A Practical Guide. A Joint Recommendation of the World Health Organization, World Meteorological Organization, United Nations Environment Programme, and the International Commission on Non-Ionizing Radiation Protection. Available online: http://apps.who.int/iris/bitstream/handle/10665/42459/9241590076.pdf?sequence=1 (accessed on 22 October 2018).
  79. De Noni, G.; Trujillo, G. La erosión Actual y Potencial en Ecuador: Localización, Manifestaciones y Causas. In La Erosión en el Ecuador; Centro Ecuatoriano de Investigación Geográfica (CEDIG): Quito, Ecuador, 1986; pp. 6–14. [Google Scholar]
  80. De Noni, G.; Viennot, M.; Trujillo, G. Chapter 13. Agricultural erosion in the Ecuadorian Andes: A natural and historical phenomenon. In Land Husbandry—Components and Strategy; Roose, E., Ed.; Soil Resources Management and Conservation Service Land and Water Development Division, FAO: Roma, Italy, 1996. [Google Scholar]
  81. Liniger, H.; Critchley, W. (Eds.) Where the Land Is Greener-Case Studies and Analysis of Soil and Water Conservation Iniciatives Worldwide; World Overview of Conservation Approaches and Technologies (WOCAT): Bern, Swizerland, 2007; p. 364. [Google Scholar]
  82. St. Clair, S.B.; Lynch, J.P. The opening of Pandora’s Box: Climate change impacts on soil fertility and crop. nutrition in developing countries. Plant Soil 2010, 335, 101–115. [Google Scholar] [CrossRef]
  83. De Bièvre, B.; Bustamante, M.; Murtinho, F.; Armijos, M. Síntesis de los impactos de los efectos del cambio climático en los recursos hídricos en los Andes Tropicales y las estrategias de adaptación desarrolladas por los pobladores. In Panorama Andino de Cambio Climático: Vulnerabilidad y Adaptación en los Andes Tropicales; Cuesta, F., Bustamante, M., Becerra, M.T., Postigo, J., Peralvo, J., Eds.; CONDESAN, SGCAN: Lima, Perú, 2012; pp. 59–101. [Google Scholar]
  84. Buytaert, W.; Cuesta-Camacho, F.; Tobón, C. Potential impacts of climate change on the environmental services of humid tropical alpine regions. Glob. Ecol. Biogeogr. 2011, 20, 19–33. [Google Scholar] [CrossRef]
  85. Rossing, W.A.; Modernel, P.; Tittonel, P.A. Diversity in Organic and Agroecological Farming Systems for Mitigation of Climate Change Impact, with Examples from Latin America. In Climate Change Impact and Adaptation in Agricultural Systems; Fuhrer, J., Gregory, P.J., Eds.; CAB-International: Wallingford, CT, USA, 2014; pp. 69–87. [Google Scholar]
  86. Tuomisto, H.L.; Hodge, I.D.; Riordan, P.; Macdonald, D.W. Does organic farming reduce environmental impacts?—A meta-analysis of European research. J. Environ. Manag. 2012, 112, 309–320. [Google Scholar] [CrossRef] [PubMed]
  87. Horn, R.; Domżżał, H.; Słowińska-Jurkiewicz, A.; van Ouwerkerk, C. Soil compaction processes and their effects on the structure of arable soils and the environment. Soil Tillage Res. 1995, 35, 23–36. [Google Scholar] [CrossRef]
  88. WWF. Living Planet Report—2018: Aiming Higher; WWF: Gland, Switzerland, 2018; p. 144. [Google Scholar]
  89. De Boef, W.; Haga, M.; Sibanda, L.; Swaminathan, M.; Winters, P. (Eds.) Mainstreaming Agrobiodiversity in Sustainable Food Systems: Scientific Foundations for an Agrobiodiversity Index—Summary; Biodiversity International: Rome, Italy, 2016; p. 30. [Google Scholar]
  90. Ortiz, R. Agrodiversity Management for Climate Change. In Agrobiodiversity Management for Food Security: A Critical Review; Lenné, J.M., Wood, D., Eds.; CAB International: North Olmoss Croft, Fyvie, Turriff, Abendeershire, UK, 2011; pp. 189–210. [Google Scholar]
  91. Kotschi, J. Agricultural Biodiversity is Essential for Adapting to Climate Change. GAIA-Ecol. Perspect. Sci. Soc. 2007, 16, 98–101. [Google Scholar] [CrossRef]
  92. Gitay, H.; Brown, S.; Easterling, W.; Jallow, B. Ecosystems and their goods and services. In Climate Change 2001: Impacts, Adaptation, and Vulnerability. Contribution of Working Group. II to the Third Assessment Report of the Intergovernmental Panel on Climate Change; McCarthy, J.J., Canziani, O.F., Leary, N.A., Dokken, D.J., White, K.S., Eds.; Cambridge University Press: Cambridge, UK, 2001; pp. 237–342. [Google Scholar]
  93. Mata, L.J.; Campos, M. Latin America. In Climate Change 2001: Impacts, Adaptation, and Vulnerability. Contribution of Working Group. II to the Third Assessment Report of the Intergovernmental Panel on Climate Change; McCarthy, J.J., Canziani, O.F., Leary, N.A., Dokken, D.J., White, K.S., Eds.; Cambridge University Press: Cambridge, UK, 2001; pp. 693–734. [Google Scholar]
  94. Biodiversity and Agriculture: Safeguarding Biodiversity and Securing Food for the World. Available online: https://www.cbd.int/doc/bioday/2008/ibd-2008-booklet-en.pdf (accessed on 29 May 2017).
  95. Pascual, U.; Narloch, U.; Nordhagen, S.; Drucker, A. The economics of agrobiodiversity conservation for food security under climate change. Econ. Agrar. Recur. Nat. 2011, 11, 191–220. [Google Scholar]
  96. Thrupp, L.A. The Importance of Biodiversity in Agroecosystems. J. Crop. Improv. 2004, 12, 315–337. [Google Scholar] [CrossRef]
  97. Olesen, J.E. Reinfed Intensive Crop. Systems. In Climate Change Impact and Adaptation in Agricultural Systems; Fuhrer, J., Gregory, P.J., Eds.; CAB-International: Wallingford, CT, USA, 2014; pp. 17–30. [Google Scholar]
  98. IPCC. Climate Change 2007: Impacts, Adaptation and Vulnerability. Contribution of Working Group. II to the Fourth Assessment Report of the Intergovernmental Panel on Climate Change; IPCC: Cambridge, UK, 2007; p. 976. [Google Scholar]
  99. Webber, H.; Kahiluoto, H.; Rötter, R.; Ewert, F. Enhancing Climate Resilience of Cropping Systems. In Climate Change Impact and Adaptation in Agricultural Systems; Fuhrer, J., Gregory, P.J., Eds.; CAB-International: Wallingford, CT, USA, 2014; pp. 167–185. [Google Scholar]
  100. Buytaert, W.; De Bièvre, B. Water for cities: The impact of climate change and demographic growth in the tropical Andes. Water Resour. Res. 2012, 48. [Google Scholar] [CrossRef] [Green Version]
  101. Cabay, I.; Correa, N.; Endara, P.; Larrea, F.; Vieira, M. “Año por Año” Las Fiestas de San Pedro en Ayora-Cayambe; Abya-Yala: Quito, Ecuador, 1991; p. 132. [Google Scholar]
  102. Ecuador Festival Inti Raymi. The longest Day. Available online: https://www.ecuadorliving.com/2010/06/21/ecuador-festival-inti-raymi-the-longest-day.html (accessed on 20 December 2018).
  103. Yépez, P. Indigenous traditions in the modern world and its impact on intercultural education. Shopia 2015, 18, 231–251. [Google Scholar]
  104. Alexander, C.; Bynum, N.; Johnson, E.; King, U.; Mustonen, T.; Neofotis, P.; Oettlé, N.; Rosenzweig, C.; Sakakibara, C.; Shadrin, V.; et al. Linking Indigenous and Scientific Knowledge of Climate Change. BioScience 2011, 61, 477–484. [Google Scholar] [CrossRef] [Green Version]
  105. Naess, L.O. The role of local knowledge in adaptation to climate change. Wiley Interdiscip. Rev. 2013, 4, 99–106. [Google Scholar] [CrossRef]
  106. FAO; IFAD; UNICEF; WFP; WHO. The State of Food Security and Nutrition in the World 2018; Building Climate Resilience for Food Security and Nutrition: Rome, Italy, 2018; p. 181. [Google Scholar]
  107. Dooley, K.; Stabinsky, D.; Stone, K.; Sharma, S.; Anderson, T.; Gurian-Sherman, D.; Riggs, P. Missing Pathways to 1.5 °C: The Role of the Land Sector in Ambitious Climate Action. Available online: https://static1.squarespace.com/static/5b22a4b170e802e32273e68c/t/5bef947f4fa51adec11bfa69/1542427787745/MissingPathwaysCLARAreport_2018r2.pdf (accessed on 23 October 2018).
  108. Garrity, D. Agroforestry and the Future of Global Land Use. In Advances in Agroforestry Volume 9: Agroforestry—The Future of Global Land Use; Nair, R.P.K., Garrity, D., Eds.; Springer: New York, NY, USA; London, UK, 2012; Volume 9, pp. 21–27. [Google Scholar]
  109. Pachauri, R.K. Climate Change and Agroforestry. In Advances in Agroforestry Volume 9: Agroforestry—The Future of Global Land Use; Nair, R.P.K., Garrity, D., Eds.; Springer: New York, NY, USA; London, UK, 2012; Volume 9, pp. 13–15. [Google Scholar]
  110. Leakey, R. Environmental Resilience and Agroforestry. In Advances in Agroforestry Volume 9: Agroforestry—The Future of Global Land Use; Nair, R.P.K., Garrity, D., Eds.; Springer: New York, NY, USA; London, UK, 2012; Volume 9, pp. 21–27. [Google Scholar]
  111. Cuesta, F.; Muriel, P.; Beck, S.; Meneses, R.I.; Halloy, S.; Salgado, S.; Ortiz, E.; Becerra, M.T. (Eds.) Biodiversidad y Cambio Climático en los Andes Tropicales—Conformación de Una Red de Investigación para Monitorear sus Impactos y Delinear Acciones de Adaptación; Red Gloria-Andes: Lima, Peru; Quito, Ecuador, 2012; p. 180. [Google Scholar]
  112. Hatfield, J.L.; Prueger, J.H. Impacts of changing precipitation patterns on water quality. J. Soil Water Conserv. 2004, 59, 51–58. [Google Scholar]
  113. Phillips, D.L.; Lee, J.J.; Dodson, R.F. Sensitivity of the US corn belt to climate change and elevated CO2: I. Corn and soybean yields. Agric. Syst. 1996, 52, 481–502. [Google Scholar] [CrossRef]
  114. Lee, J.J.; Phillips, D.L.; Dodson, R.F. Sensitivity of the US corn belt to climate change and elevated CO2: II. Soil erosion and organic carbon. Agric. Syst. 1996, 52, 503–521. [Google Scholar] [CrossRef]
  115. Steiner, A. Agroforestry and the Transition to the Future. In Advances in Agroforestry Volume 9: Agroforestry—The Future of Global Land Use; Nair, R.P.K., Garrity, D., Eds.; Springer: New York, NY, USA; London, UK, 2012; Volume 9, pp. 17–20. [Google Scholar]
Figure 1. Study area and sample farms’ distribution [23].
Sustainability 11 02623 g001
Table 1. Differences in smallholder farmers’ general perceptions of climate change and variability between AFS and CAS (responses in % of households).
Gradual Climate ChangesObserved by Farmers Last DecadeExpected by Farmers Next Decade
AFS **CAS **AFS **CAS **
<=><=><=><=>
Temperature
Annual temperature00100001000010000100
Wet/rainy season17176720206073907390
Dry season309730970010000100
Precipitation
Annual rainfall937010000973010000
Wet/rainy season93709730973010000
Dry season93339703933310000
Extreme Events
Heavy * rainfall events731313831078371083710
Heavy hail events7317108713070201087130
Heavy windstorms1777713137313137371777
Droughts/dry periods173803097173808290
Heat waves/warm periods1308730971009000100
Cold periods/frost13305710177310276301783
Other Climate-Related Events
Glacier retreat09010067330901006733
Thunderstorms1080101060301087378310
PWD outbreaks77023083177702308317
Fog396001000790337720
Floods393301000393301000
Fires78013010007801301000
* Heavy intensity, ** N = 30.
Table 2. Farmers’ perceptions (in %) of main climate and climate-related stressors affecting AFS and CAS.
Main Climate and Climate-Related StressorsPerceptions (%)
AFSCAS
Climate and climate-related stressors categories
>Temperature < Rains170
>Temperature < Rains > Droughts177
>Temperature < Rains > Solar radiation107
>Temperature < Rains > Cold periods/Frost133
>Temperature < Rains >Droughts > PWD outbreaks137
>Temperature <Rains >Solar radiation >Droughts1310
>Temperature < Rains > Solar radiation > Droughts > Winds77
>Temperature < Rains > Solar radiation > Droughts > PWD outbreaks740
>Temperature < Rains > Solar radiation > Cold periods/Frost > PWD outbreaks03
>Temperature <Rains > Solar radiation > Droughts > Cold periods/Frost37
>Temperature < Rains > Solar radiation > Cold periods/Frost > Winds > PWD outbreaks07
>Temperature < Rains > Solar radiation > Droughts > Cold periods/Frost > PWD outbreaks03
Specific incidence of main climate and climate-related stressors *
>Temperature100100
<Rains100100
>Droughts6080
>Solar radiation4083
>PWD outbreaks2060
>Winds713
>Cold periods/Frost1723
* Sum of partial perceptions (%) where the climate stressor appears in the correspondent category.
Table 3. Differences of biophysical controlling factors levels to the impacts of main gradual climate changes, extremes and other climate-related events between AFS and CAS.
Biophysical Controlling FactorsControlling Level Perceptions (%)Pearson Chi-Square
AFS ᵠCAS ᵠAsymp. Sig.Significance
123123(2-sided)
Controlling soil erosion by water †21682682570.000****
Control of raindrop splash (splash erosion)01090534070.000****
Control of dispersed runoff (sheet or interrill erosion)01387534070.000****
Control of concentrated runoff (rill and gully erosion)01090534070.000****
Reduction of slope angle72073831070.000****
Reduction of slope length7276790370.000****
Sediment retention/trapping, sediment harvesting017837317100.000****
Controlling soil erosion by wind /reduction in wind speed017836023170.000****
Controlling chemical soil deterioration †1210785132170.000****
Increase in organic matter07931357300.000****
Increase in nutrient availability (supply, recycling…)013876027130.000****
Reduction of salinity371053801370.000****
Controlling physical soil deterioration †617774838130.000****
Increase of surface roughness31383306370.000****
Improvement of surface structure (crusting, sealing)313834337200.000****
Improvement of topsoil structure (compaction)323736327100.000****
Improvement of subsoil structure (hardpan)733605337100.000****
Stabilization of soil (e.g., by tree roots against landslides)101080672770.000****
Increase of infiltration710833340270.000****
Controlling biological degradation †48883936250.000****
Improvement of ground cover03972343330.000****
Increase of biomass (quantity)001002053270.000****
Promotion of suitable vegetation species and varieties (quality, e.g., palatable fodder)03973333330.000****
Promotion of suitable crop varieties001004030300.000****
Increase in crop diversification03973737270.000****
Increase in pest control317806030100.000****
Increase of beneficial species010906723100.000****
Reduction of invasive alien species101773474770.000****
Control of fires137803030400.000****
Reduction of dry material (fuel for wildfires)017831743400.000****
Promotion of suitable livestock varieties1313734330270.000****
Increase in livestock diversification1310773733300.000****
Spatial arrangement and diversification of land use33935730130.000****
Controlling water degradation †92071593290.000****
Increase/maintain water stored in soil313834047130.000****
Improvement of harvesting/collection of water (runoff, dew, snow, etc.)31383702370.000****
Reduction of evaporation02774672770.000****
Increase of groundwater level, recharge of groundwater372340772030.000****
Water spreading310874047130.000****
Improvement of water quality, buffering/filtering water733606327100.000****
ᵠ N = 30, † Mean among the corresponding controlling factors, 1 = Less important/little extent, 2 = Important/medium extent, 3 = Very important/large extent, **** ≤ 0.001.
Table 4. On-site impact level differences between AFS and CAS of gradual climate changes, extremes and other climate-related events to main farming systems’ components and attributes.
Farming Systems’ Components, Processes, and AttributesImpact Level Estimations (Mean %)Pearson Chi-Square
AFS ᵠCAS ᵠAsymp. Sig.Significance
<=><=>(2-sided)
Socioeconomic component
Crop yield47477831700.009***
Fodder production4350790730.001****
Fodder quality47431093330.000****
Animal production47503831700.010***
Wood production235323573770.020**
Risk of production failure1347403010600.006***
Drinking/household water availability/quality60337871300.049**
Irrigation water availability/quality40600633700.071*
Demand for irrigation water31780017830.600NS
Expenses on agricultural inputs1770131030600.001****
Farm income274330703000.000****
Diversification of income sources1353334347100.013***
Production area (new land under cultivation/use)783101073170.640NS
Labor constraints3753103340270.236NS
Workload106030327700.008***
Difficulty of farm operations38313037630.000****
Product diversification1363234743100,016**
Sociocultural component
Cultural opportunities (e.g., spiritual, aesthetic, others)473717772300.018**
Recreational opportunities207010504730.044**
Community institution strengthening1730531727570.956NS
Traditional/Indigenous knowledge conservation1767175733100.006***
Conflicts01387020800.488NS
Position of socially and economically disadvantaged groups (gender, age, status, ethnicity, etc.)305020376030.132NS
Food security/self-sufficiency (dependence on external support)236313603730.012**
Health67201390730.089*
Ecological component
Water quantity50401093700.001****
Water quality4747793700.000****
Harvesting/collection of water434710901000.001****
Soil moisture43401790730.001****
Evaporation233740107830.002***
Surface runoff3750134013470.003***
Excess water drainage474775027230.108*
Recharge of groundwater table/aquifer40537802000.005***
Wind velocity274033310870.000****
Soil cover175727534070.006***
Biomass/above ground C17777574300.003***
Nutrient cycling/recharge206713633330.003***
Soil organic matter/below ground C10837574300.000****
Emission of carbon and greenhouse gases433720733600.001****
Soil loss275717730630.001****
Soil crusting/sealing137017733600.003***
Soil compaction136323320770.000****
Salinity13807350470.002***
Fire risk136323067330.103*
Animal diversity40372387770.001****
Plant diversity374023831070.001****
Invasive alien species383131013770.000****
Beneficial species (predators, earthworms, pollinators)23473087770.000****
Biological pests/diseases105733010900.000****
Habitat diversity23473093330.000****
ᵠ N = 30, <: Decreased/deteriorated, =: No impact, >: Increased/Improved, NS >0.1, * ≤0.1, ** ≤0.05, *** ≤0.01, **** ≤0.001.
Table 5. Off-site impact level differences between AFS and CAS of gradual climate changes, extremes and other climate-related events to main farming systems’ components and attributes.
Farming Systems’ Components, Processes, and AttributesImpact Level Estimations (Mean %)Pearson Chi-Square
AFS ᵠCAS ᵠAsymp. Sig.Significance
<=><=>(2-sided)
Water availability (groundwater, springs)1000097300.313NS
Downstream flooding937097300.554NS
Stream flow in dry season/reliable and stable low flows9703100000.313NS
Sediment yield83107900100.194
Downstream siltation57430802000.052*
Groundwater/river pollution7138070930.116NS
Buffering/filtering capacity (by soil, vegetation, wetlands)8313393700.399NS
Wind transported sediments132760313830.118NS
Damage on neighbors’ field3831379030.331NS
Damage on public/private infrastructure10837387100.543NS
ᵠ N = 30, <: Decreased/deteriorated, =: No impact, >: Increased/Improved, NS > 0.1, * ≤ 0.1.

