Article

Warming and Dimming: Interactive Impacts on Potential Summer Maize Yield in North China Plain

1
College of Resources and Environmental Sciences, China Agricultural University, Beijing 100193, China
2
Inner Mongolia Ecological and Agricultural Meteorology Center, Inner Mongolia Meteorological Bureau, Hohhot, Inner Mongolia 010000, China
3
Department of Geography, University of North Texas, Denton, TX 76203, USA
*
Authors to whom correspondence should be addressed.
Sustainability 2019, 11(9), 2588; https://doi.org/10.3390/su11092588
Submission received: 7 March 2019 / Revised: 17 April 2019 / Accepted: 23 April 2019 / Published: 5 May 2019
(This article belongs to the Section Environmental Sustainability and Applications)

Abstract

:
Global warming and dimming/brightening have significant implications for crop systems and exhibit regional variations. It is important to clarify the changes in regional thermal and solar radiation resources and estimate the impacts on potential crop production spatially and temporally. Based on daily observation data during 1961–2015 in the North China Plain (NCP), the impacts of climate change associated with climate warming and global dimming/brightening on potential light–temperature productivity (PTP) of summer maize were assessed in this study. Results show that the NCP experienced a continuous warming and dimming trend in maize growing season during the past 55 years, and both ATT10 and solar radiation had an abrupt change in the mid-1990s. The period of 2000–2015 was warmer and dimmer than any other previous decade. Assuming the maize growing season remains unchanged, climate warming would increase PTP of summer maize by 4.6% over the period of 1961–2015, which mainly occurred in the start grain filling–maturity stage. On the other hand, as negative contribution value of solar radiation to the PTP was found in each stage, dimming would offset the increase of PTP due to warming climate, and lead to a 15.6% reduction in PTP in the past 55 years. This study reveals that the changes in thermal and solar radiation have reduced the PTP of summer maize in the NCP. However, the actual maize yield could benefit more from climate warming because solar radiation is not a limiting factor for the current low production level.

1. Introduction

Global warming and dimming/brightening are caused by the changes in thermal and solar radiation in the context of global climate change. The Earth’s surface air temperature has increased by approximately 0.6 ± 0.2 °C during the 20th century (Intergovernmental Panel on Climate Change [1], indicating that global warming has definitely occurred [2]. This warming trend is expected to continue in the coming decades [3]. Observations show that China has experienced a more pronounced climate warming [4], and north China especially showed a greater warming trend than south China [5]. The amount of solar radiation has exhibited more complicated changes, which undergoes significant decadal and regional variations [6,7]. Global dimming was observed from the late 1950s to the early 1990s at different locations throughout the world [8,9,10], and after the 1990s a worldwide brightening was observed in United States [11], South America [12] and Japan [13]. This phenomenon is partly resulted from the reduced levels of air pollution and decreased aerosol content in the atmosphere [14]. By contrast, a continuous solar dimming was found in most regions of China, and the brightening trend was weak and insignificant [15].
Previous studies have shown that global warming and dimming/brightening could have significant impacts on crops [16], and maize yield is vulnerable to climate variability and climate change [17]. However, climate change varies significantly in different regions, thus it is important to evaluate the changes in thermal and solar radiation resources and their interactive impacts on for specific regions. This study took the North China Plain (NCP) of China as a case study and the findings can be of global use. The NCP is one of the key grain-producing regions of China, and plays a vital role in guaranteeing the national food security [18]. The dominate agronomic cropping system in the NCP is a winter wheat (Triticum aestivum L.)–summer corn (Zea mays L.) rotation system, which produces over 30% of national total corn yield [19,20]. Previous studies on estimation of climate change and its impacts have shown that the NCP has been experiencing a warming and dimming trend [5,21], which has significantly affected crop phenology, grain yield, and cropping system [22,23]. However, most of these assessments focus on the variations of annual temperature or radiation, and few studies evaluate the combined effects of those climate changes in maize growing season, i.e., there is a lack of integrated assessment of warming and dimming/brightening impacts on potential maize yield in the NCP. Therefore, a systemic analysis of the spatial and temporal changes in thermal and solar radiation resources in the NCP and evaluation of the impacts of those climate changes on potential crop production are necessary, and the results drawn from this study could provide a scientific basis for making policy for adaptation to and mitigation of climate change.
This study focused on the impacts of temperature and solar radiation on potential light–temperature productivity (PTP) [24]. The PTP of summer maize represents the maximum yield under well-watered and stress-free conditions in a given region, which has been widely used to evaluate the spatiotemporal changes of crops under climate change [25,26]. As PTP was only determined by radiation and temperature, the contribution of the changes in ATT10 and solar radiation on PTP could be separated and calculated by using sensitivity analysis method.
The objectives of this study were to evaluate the spatiotemporal variations of climatic variables (thermal and solar radiation) and maize potential yield during maize growing season, and estimate the combining effect of climate warming and dimming/brightening on maize potential production in NCP during 1961–2015.

2. Materials and Methods

2.1. Study Area

The North China Plain (NCP) is also known as the Yellow-Huai-Hai Plain since three major rivers, i.e., Yellow River, Huaihe River, and Haihe River, drain the NCP, and covers three provinces, i.e., Hebei, Shandong, and Henan, and two municipalities, i.e., Beijing and Tianjin (see Figure 1). As the largest national alluvial plain, the NCP has low and flat terrain with a mean elevation of less than 50 m above the mean sea level. The climate in the NCP generally shows a temperate and monsoonal climate pattern characterized by hot and rainy summer. Nearly 70% of annual precipitation occurs from July to September, which is suitable for planting summer maize. The typical cropping system in the NCP is a rotation between winter wheat and summer maize (sowed around 10 June and harvested around 10 October).
Historical daily observations of meteorological parameters at 55 meteorological stations from 1961 to 2015 were obtained from China Meteorological Data Sharing Service Network (http://cdc.cma.gov.cn/home.do). The original dataset’s quality was strictly checked to ensure the missing values less than 0.1%. All missing data were filled using the linear interpolation method. The datasets include daily mean temperature, maximum temperature, minimum temperature, sunshine hours, wind speed, relative humidity, and precipitation, whose average and standard deviation values in summer maize growing season in the NCP are listed in Table 1.

2.2. Technique Description

2.2.1. Active Accumulated Temperature (ATT)

Active accumulated temperature (ATT, unit °C) is an effective parameter for describing the thermal condition for crop growth, which has been widely applied in studying crop physiological ecology, as well as analyzing cropping systems [27]. Bunting [28] found a strong relationship between ATT with a given threshold temperature of 10 °C (ATT10) and corn growth, and Bai et al. [29] confirmed similar results in China. In this study, ATT10 was calculated by summing up daily temperature during the growing season—when the daily temperature was above 10 °C—as the follows:
A A T 10 = i = p l a n t i n g   d a t e h a r v e s t   d a t e T i   ,   f o r   T i 10
where Ti (°C) is the daily mean air temperature on the ith day.

2.2.2. Solar Radiation

Since it is difficult to obtain the long-term solar radiation observational data at all 55 meteorological stations, we first estimated the extraterrestrial radiation (Ra, unit MJ m−2 day−1) according to the radiation formula given in FAO56-PM [30,31]:
R a = 24 ( 60 ) π G s c d r ( ω sin φ sin δ + cos φ cos δ sin ω )
where Gsc = 0.0820 MJ m−2 min−1 is the solar constant, dr is the inverse relative distance Earth–Sun (unit m), ω is the sunset hour angle (unit rad), φ is latitude (unit rad), and δ is solar declination (unit rad). dr, ω and φ are given by Equation (3):
d r = 1 + 0.033 cos ( 2 π 365 J ) ;   δ = 0.409 sin ( 2 π 365 J 1.39 ) ;   ω = arccos [ tan ( φ ) tan ( δ ) ]
where J is the number of the day in the year, between 1 (1 January) and 365 or 366 (31 December). Solar radiation (RS, unit MJ m−2) was then calculated by Angstrom model [32]:
R s = R a ( a + b n N )
where n is the actual sunshine hour duration (unit h), N is the maximum possible sunshine hour duration (unit h), n/N is the relative sunshine hour, and a and b are empirical coefficients. He et al. [33] calibrated Rs model with the actual solar radiation data, and recommended the coefficients of a = 0.143 and b = 0.585 in NCP.

2.2.3. Maize Potential Light–Temperature Productivity (PTP)

The potential light–temperature productivity of summer corn (PTP, unit kg ha−1), determined by radiation and temperature, represents the maximum potential crop yield under stress-free condition [23]. In this study, we first estimated the photosynthetic productivity (PP, unit kg ha−1) by using an empirical model, which has been widely used in calculating potential crop productivity in China [34,35]:
P P = R s k ( 1 A ) ( 1 B ) η C q 1 ( 1 g ) ( 1 h )
where K = 0.49 is the conversion coefficient of photosynthetically active radiation (PAR), A = 0.065 is the field crop reflectance, B = 0.06 is the radiation leakage rate, η = 0.1568 is the solar energy use efficiency, C = 0.35 is the crop harvest index, q is the heat content of plant organic matter with a value of 17.81KJ/g, g = 0.08 is the ash content of plant, and h is the yield water content. The water content of actual crop yield in the statistical data is around 15%, thus the PP is also expressed as the potential yield with 15% water content in this study.
The PTP was then determined by considering the impact of suboptimal temperatures in each growth stage of maize [34]:
P T P = j = 1 4 ( i = 1 d j P P f ( t ) )
where j represents each maize growth period (sowing–jointing, jointing–heading, heading–start grain filling, and start grain filling–maturity), dj is the length of each stage, and f(t) is the temperature stress coefficient and calculated by Equation (7) [35]:
f ( t ) = { 0 ( t t min ) / ( t 0 t ) ( t max t ) / ( t t 0 ) t < t min   o r   t > t max t min < t < t 0 t 0 < t < t max
where t is the daily average temperature (unit °C), and tmin, to, and tmax are the minimum, optimum, and maximum temperatures for each summer maize developmental stages (unit °C), respectively, which are listed in Table 2.

2.2.4. Climate Trend

Climate trend, widely used in analyzing climate change, is a common and effective method. Linear regression method was used in this study for analyzing the trend of ATT10, solar radiation and PTP, as given by Equation (10) [36]:
X = k1t + k0, t = 1, 2, 3, …, n
where X is climatic variable, k1 is the linear slope, k0 is the y-axis intercept value, t is the number of years, and n = 55 is the length of data record (1961–2015). The climate trend value (β, unit of value per decade) equals 10 times k1. A positive (or negative) β value indicates an increasing (or decreasing) trend. The F-test method was used to assess the significance of the trends at 0.05 level.

2.2.5. Mann–Kendall (MK) Test

The breakpoint of time series of temperature or solar radiation in this study was identified by using the rank-based nonparametric Mann–Kendall (MK) test [37,38]. The MK test is a non-parametric method and has been widely used in detecting monotonic trends for the non-normally distributed and censored data [39,40]. For the sequential time series x1, x2, … xn, which belong to a sample of n independent and identically distributed random variables, the MK rank statistic value (Sk) is calculated as [41]:
S k = i = 1 k r i , 2 k n r i = { 1 , w h e n x i > x j 0 , w h e n x i x j , 1 j i
The statistic of the Mann–Kendall test, UFk, was then computed by Equation (10) [42]:
U F k = S k E ( S k ) V a r i a n c e ( S k ) , 1 k n
where E(Sk) and Vaiance(Sk) are the expectation and variance of Sk and estimated by the following formulas:
{ E ( S k ) = k ( k 1 ) 4 V a r i a n c e ( S k ) = E ( S k ) ( 2 k + 5 ) 18 2 k n
Inversed time series xn, xn-1, … x1, and UBk were determined using the same method. The intersection point of UF and UB curves was considered as the breakpoint of the series. More details for the MK test can be found in Hamed [43] and Adamowski et al. [44].

2.2.6. The Contribution Rate

The contribution rate method was employed in this study to estimate the impacts of the changes in ATT10 and solar radiation on PTP in the past 55 years, given as follows [45,46]:
C o n v = C R v S e n v
where Conv is the contribution rate of a meteorological variable V, and CRV is the relative change rate of V, as given by the following formula:
C R v = n β 10 V ¯
where n is the length of time series, β is the decadal climate trend, and is the average value of the meteorological variable V during the study period. Senv is the sensitivity coefficient, which is computed as the ratio of the relative change of a dependent variable to the relative changes of independent variable as follows [47,48]:
S e n v = Δ P T P / P T P Δ V / V
where V and ΔV are the daily meteorological variable value and its variation. ΔPTP is the daily variation in PTP and depends on ΔV.
A positive/negative Conv indicates that the changes of the variable V over the study period have caused the increase/decrease in PTP. Since the temperature stress coefficient given in Equation (9) is not a continuous function, it is difficult to calculate the sensitivity coefficient value of temperature. Therefore, we first calculated the Consolar, and the contribution rate of temperature was then estimated as the changes of PTP minus Consolar.
For the decadal scale, three periods were first defined in this study, i.e., Period 1 (P1, 1961–1979), Period 2 (P2, 1980–1999), and Period 3 (P3, 2000–2015), and then the variation characteristics of ATT10, solar radiation and PTP were analyzed Matlab2014 software was used for the data processing and calculation. As it is hard to identify regional patterns purely based on the individual stations, spatial analysis was also used to explore the spatial changes. All spatial distribution maps (Figure 1, Figure 2, Figure 4, Figure 5 and Figure 6) were constructed using the Inverse Distance Weighting (IDW) interpolation method embedded in the ArcGIS 10.1 software package with a grid cell size of 0.02° (about 2 km).

3. Results

3.1. ATT10 and Solar Radiation at the Decadal Scale

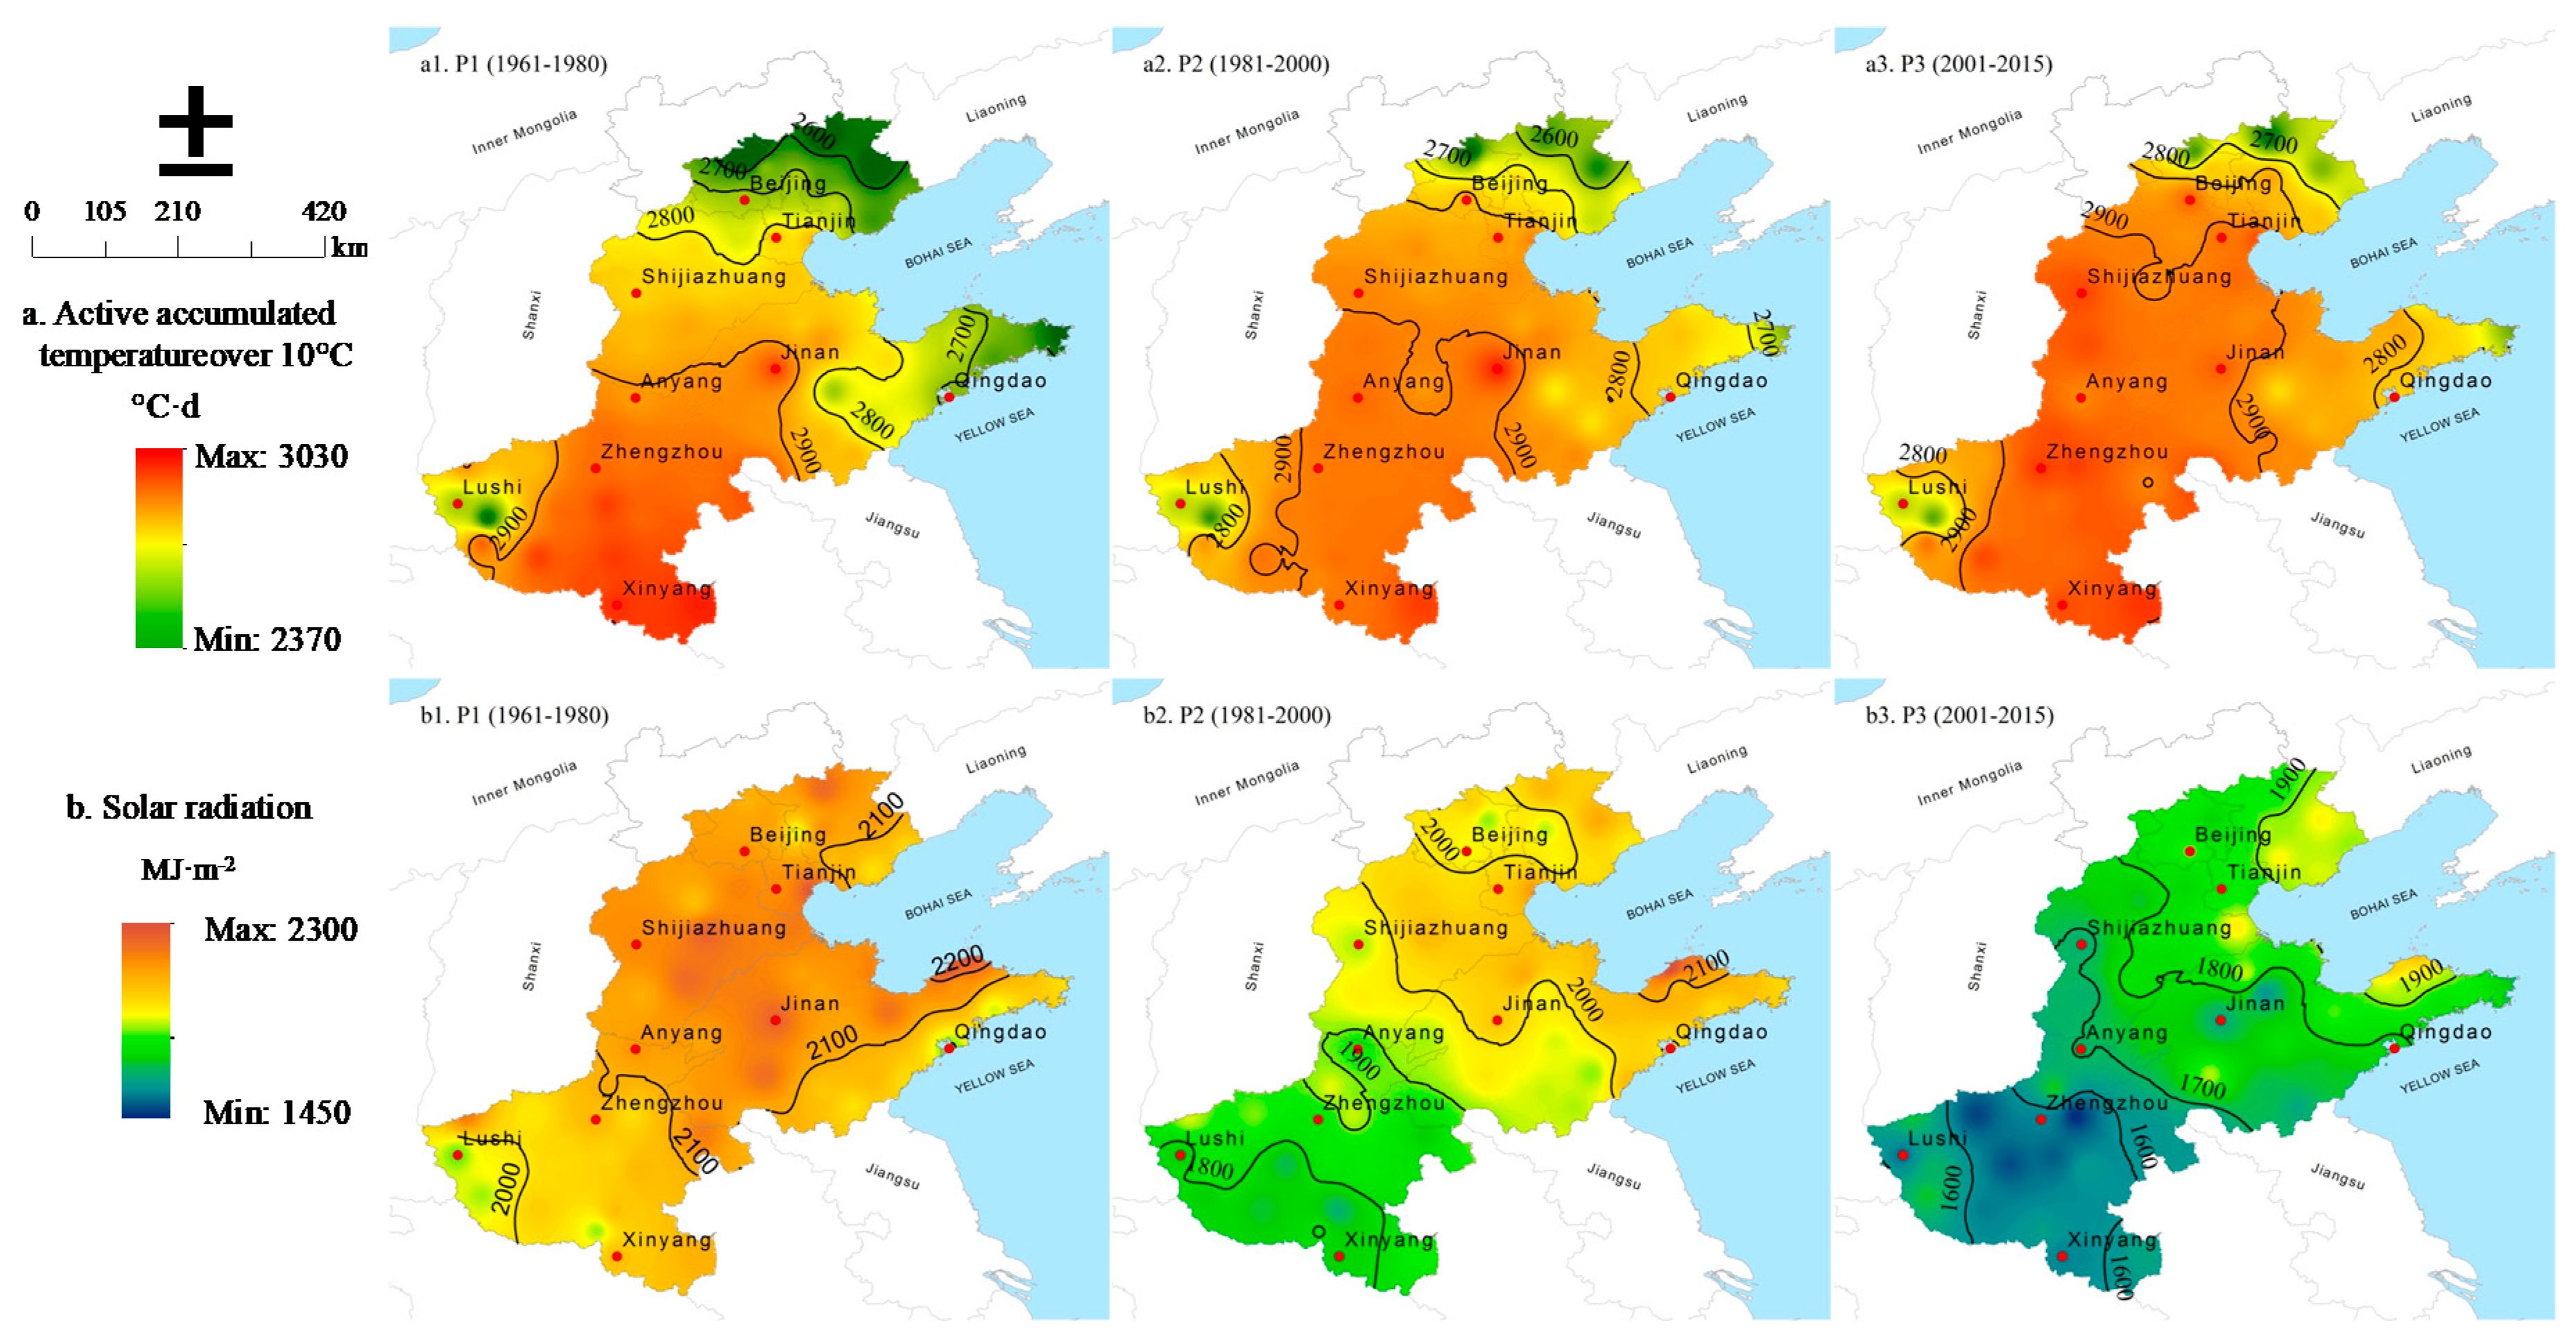
The spatial distribution of ATT10 and solar radiation in summer maize growing season in three time periods is shown in Figure 2. The NCP showed a warming trend at the decadal scale, and P3 showed the greatest increasing trend and the average ATT10 value in the three time periods was 2737.7, 2746.5, and 2787.0 °C·day, respectively. The ATT10 value was higher in P2 and P3 than that in P1 at the same place, leading to a northward shift of the contour lines for ATT10 (see Figure 2(a1–a3)). Compared with P1, 2800 °C·day and 2900 °C·day contour lines of ATT10 moved northward by approximately 1.2° and 3° latitudes in P3, and the area of ATT10 over 2800 °C·day and 2900 °C·day increased by 21.0% and 53.9%, respectively.
Unlike ATT10, a significant dimming trend was found in the NCP as the total solar radiation in summer maize growing season decreased in all the three time periods. Compared to P1, the total solar radiation in P2 and P3 decreased by 6.7% and 16.2%, respectively, and the corresponding contour lines all moved northward noticeably. The 2000MJ·m−2 contour line moved northward from the southwest NCP in P1 (around Lushi city, Figure 2(b1)) to the central NCP in P2 (Figure 2(b2)), and the 1900 MJ·m−2 contour line shifted northward from 36°N (around Zhengzhou city, Figure 2(b2)) to the northeast NCP (Figure 2(b3)). A decreasing trend of the area with solar radiation above 1900 MJ·m−2 was found, and the area in P2 and P3 were 32.6% and 91.3% lower than that in P1, respectively.
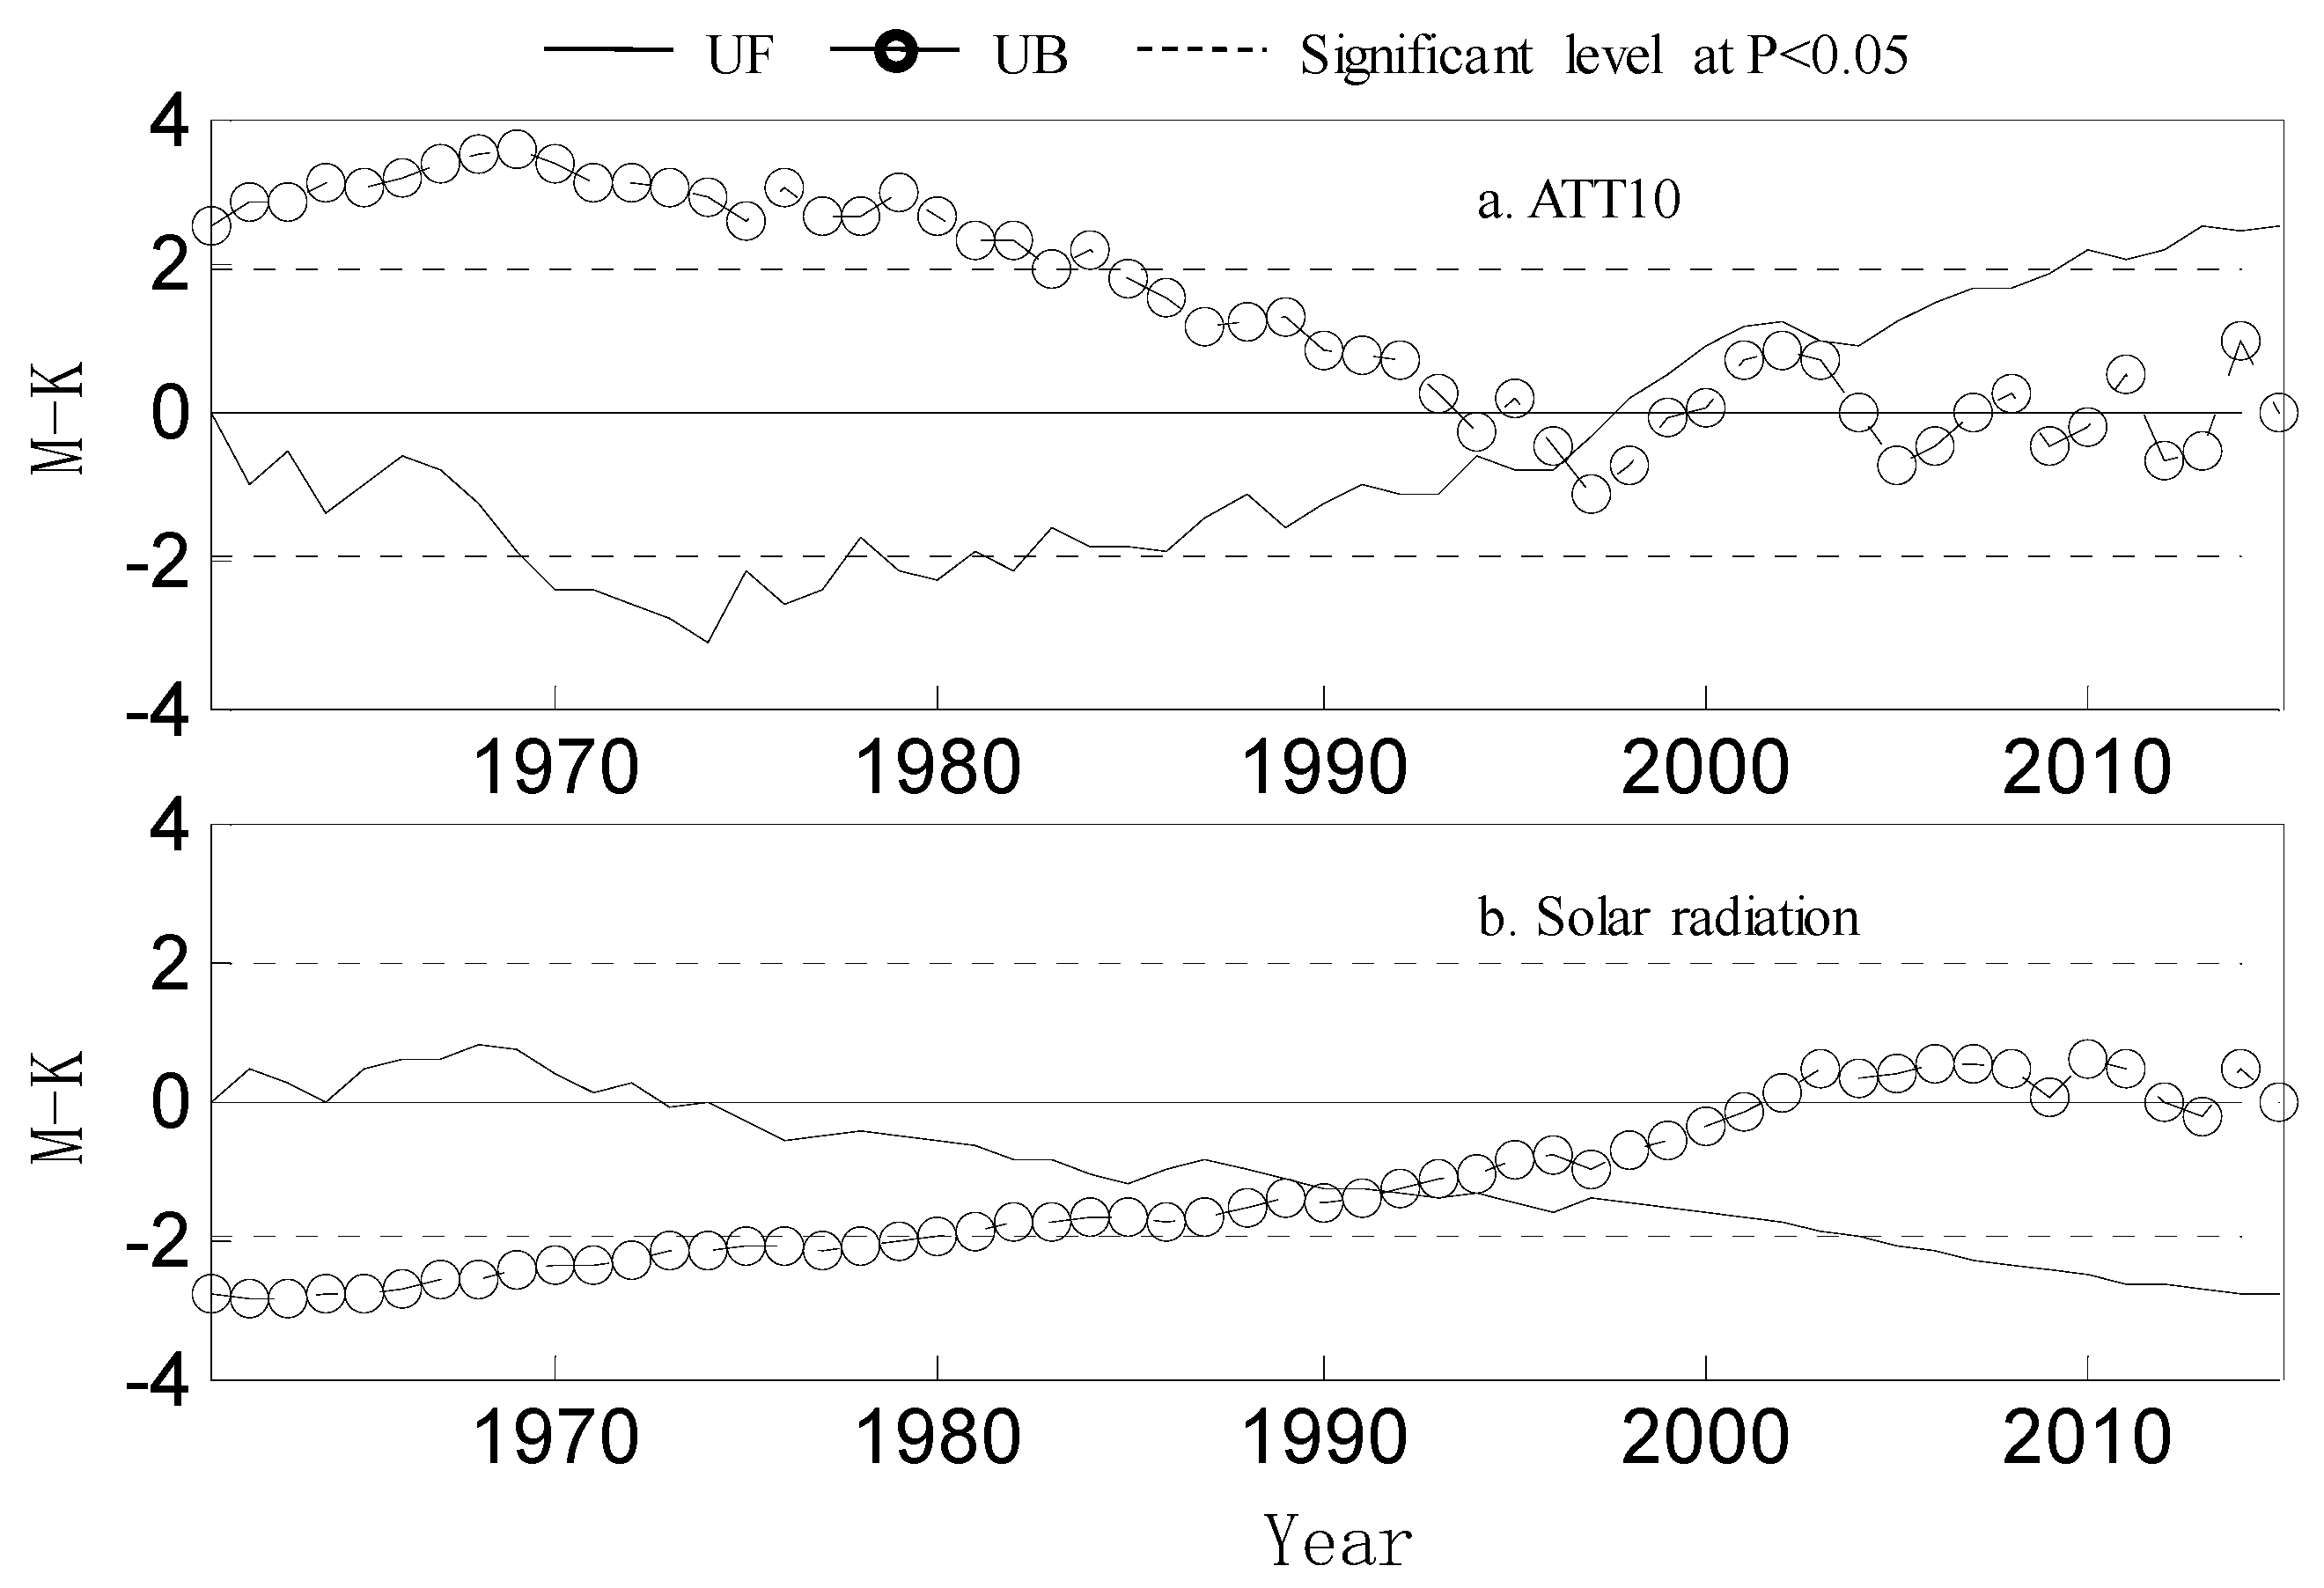
In summary, P3 exhibited the largest increasing trend for ATT10 and decreasing trend for solar radiation. We further explored the abrupt change point by using the MK method, as shown in Figure 3. Both ATT10 and solar radiation had an abrupt change in the mid-1990s (P < 0.05) with the intersection of UB and UF line within −2 to 2.

3.2. ATT10 and Solar Radiation at the Annual Scale

Climate trends for ATT10 and solar radiation in maize growing season and the number of stations with significant trend values in the NCP are listed in Table 3. According to Table 3, the ATT10 in maize growing season in the NCP increased by about 75.4 °C·day in the recent 55 years with the average trend value of 13.7 °C·day·decade−1, and 63.6% of stations (n = 35) showed a significant increasing trend at 0.05 level. All stations showed significant negative trend for solar radiation (P < 0.05) with the average trend value of −62.4MJ·m−2·decade−1, indicating that the solar radiation in the NCP significantly decreased over the period of 1961–2015.
Spatial distribution of the climatic trend rates of ATT10 and solar radiation are shown in Figure 4. ATT10 trend rates increased from south to north, and the largest temperature increasing rate occurred in the central and northern NCP with trend value larger than 10 °C·day·decade−1 (P < 0.05) (Figure 4a). In contrast, most areas in the southern NCP showed non-significant ATT10 trend. Solar radiation decreased more in the eastern Henan than that in other areas, with trend value more than 100 MJ·m−2·decade−1 (P < 0.05). The Northeast NCP (around Qingdao, Beijing and Tianjin) and the southwest NCP (around Lushi) showed the smallest solar radiation decreasing rate with trend value less than 80MJ·m−2·decade−1 (P < 0.05), as shown in Figure 4b.

3.3. Variation and Cause Analysis of PTP

Influenced by the changes of radiation resources and thermal resources, the PTP of summer maize in the NCP showed a significant decreasing trend at the decadal scale, as shown in Figure 5. Compared with P1, the average PTP in P2 and P3 decreased by 0.1% and 8.2%, respectively, and all contour lines had a noticeable shift. The area with high PTP (greater than 21 ton·ha−1) decreased continuously in the three time periods with the proportion of the total area reduced from 83.8% (P1, Figure 5a) to 20.3% (P3, Figure 5c).
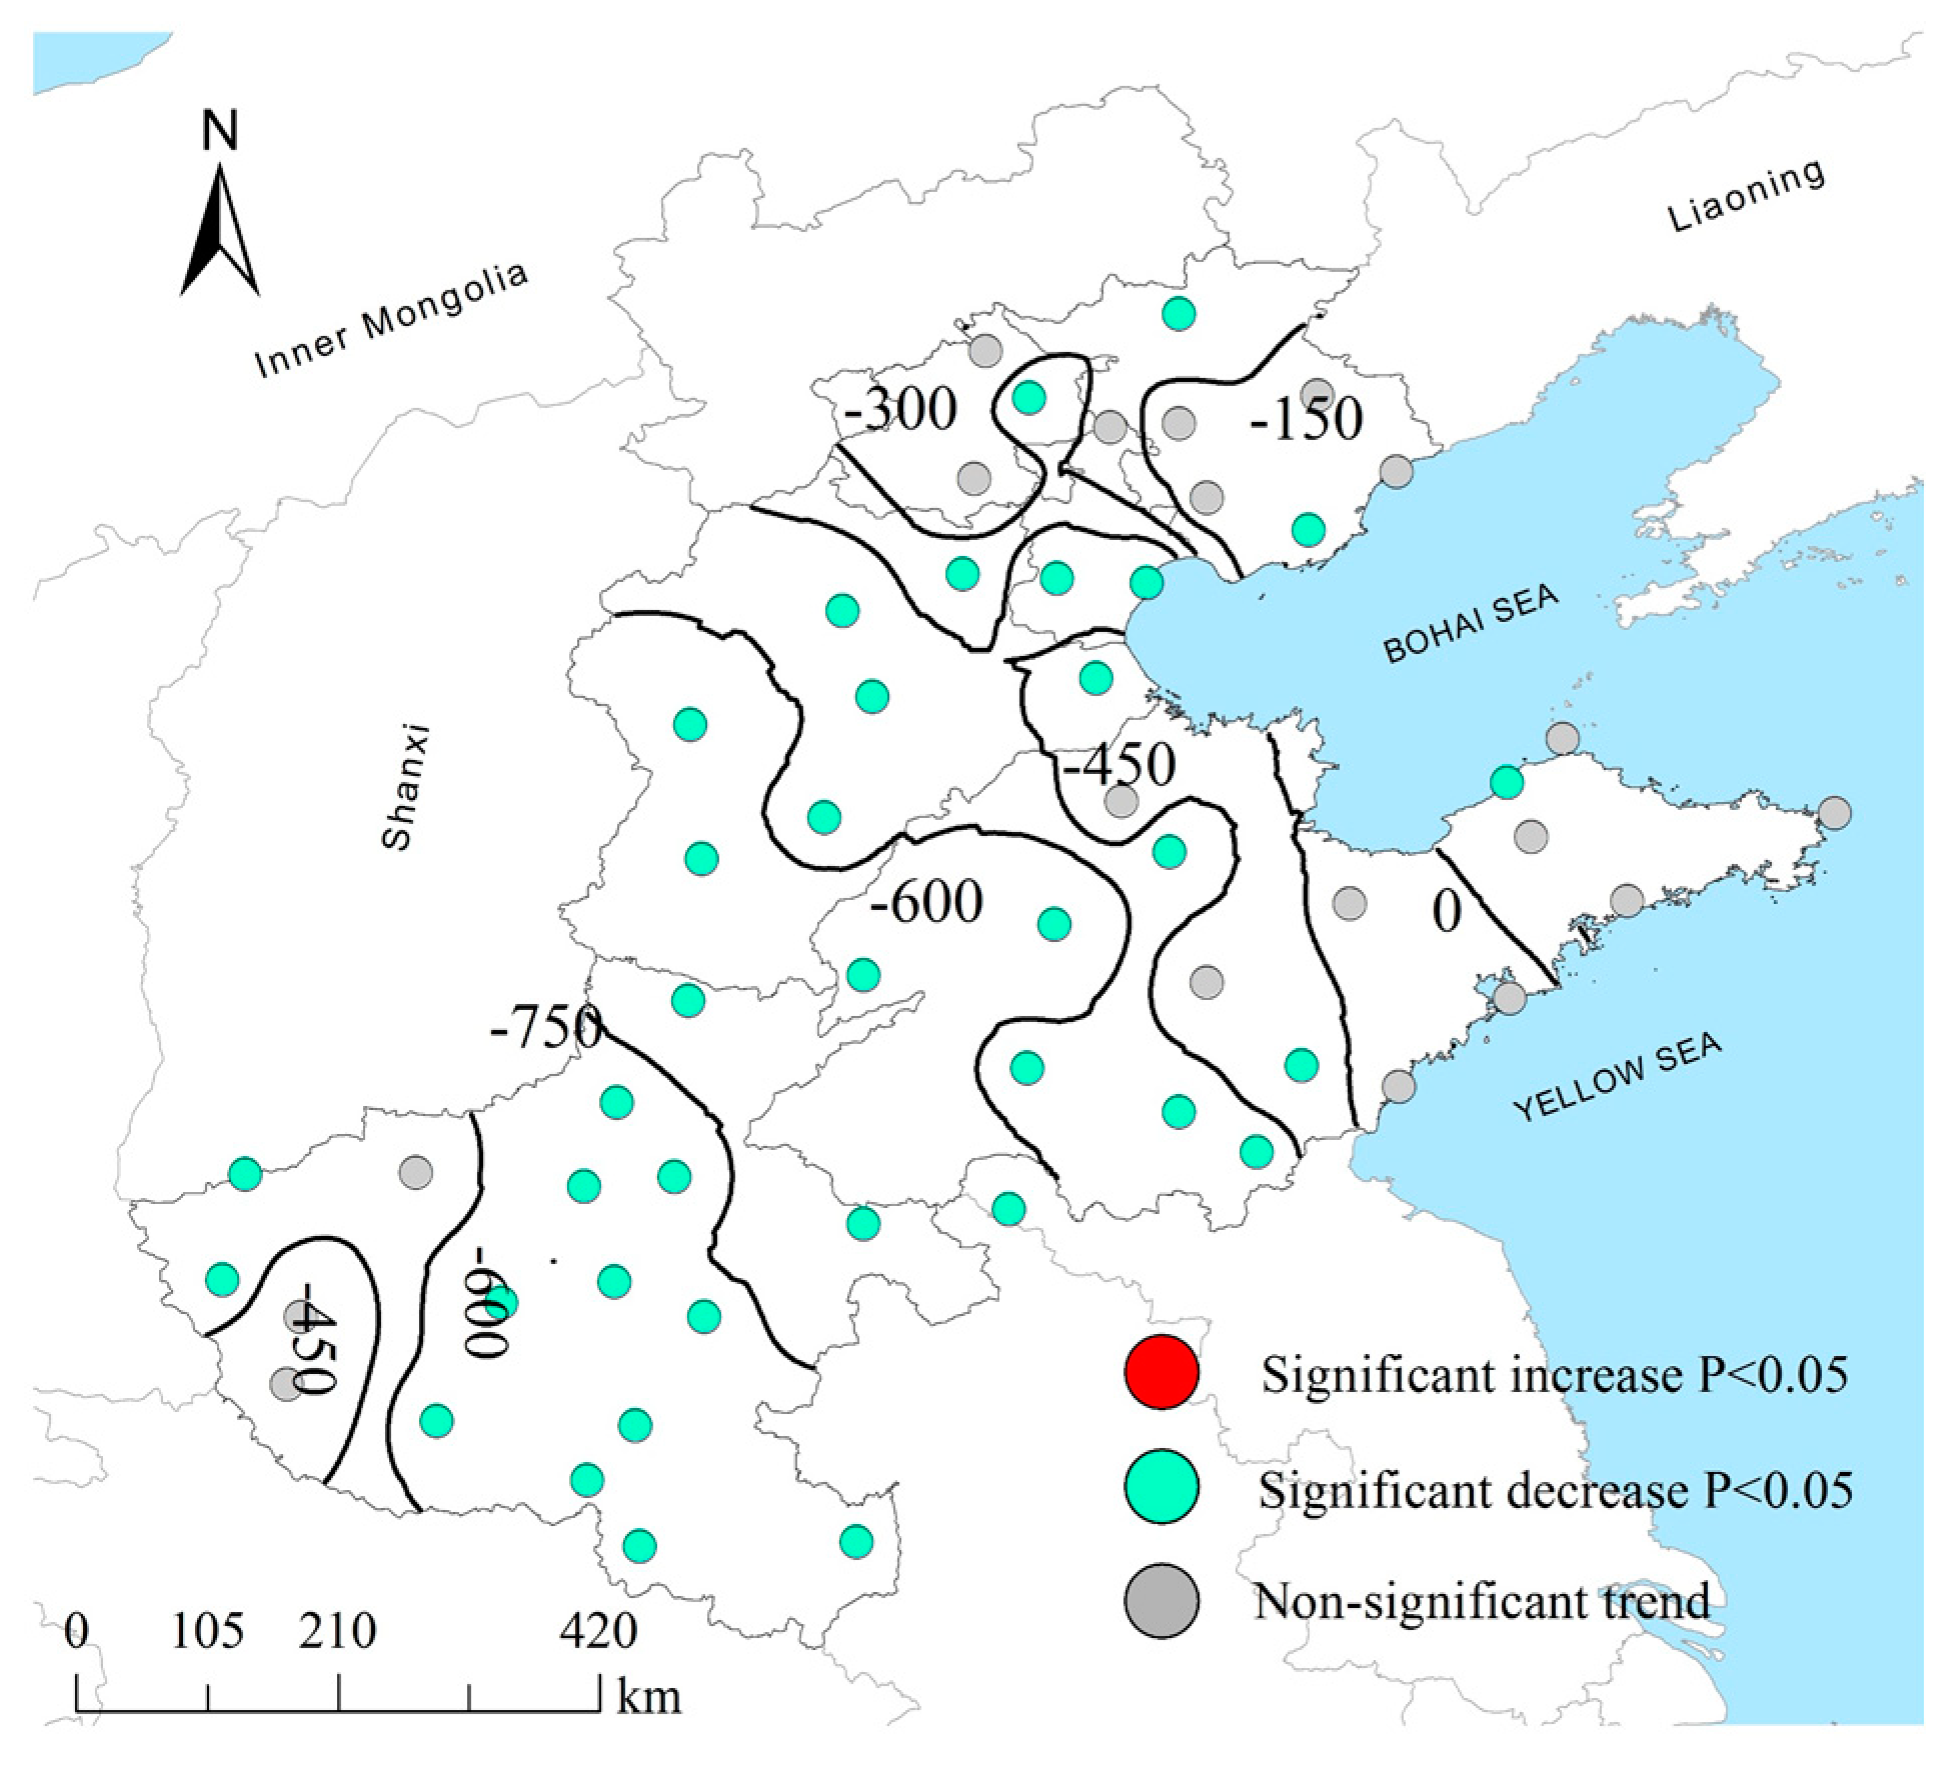
The PTP of summer maize in the NCP was significantly reduced in the recent 55 years with the average trend value of −424.5kg·ha−1·decade−1, and 65.5% of stations (n = 36) showed a significant decreasing trend at 0.05 level (see Figure 6). The greatest decreasing rate for PTP was found in the central NCP with trend value more than 600 kg·ha−1·decade−1 (P < 0.05). East Shandong and northeast Hebei showed slightly increasing trend, but the change was insignificant.
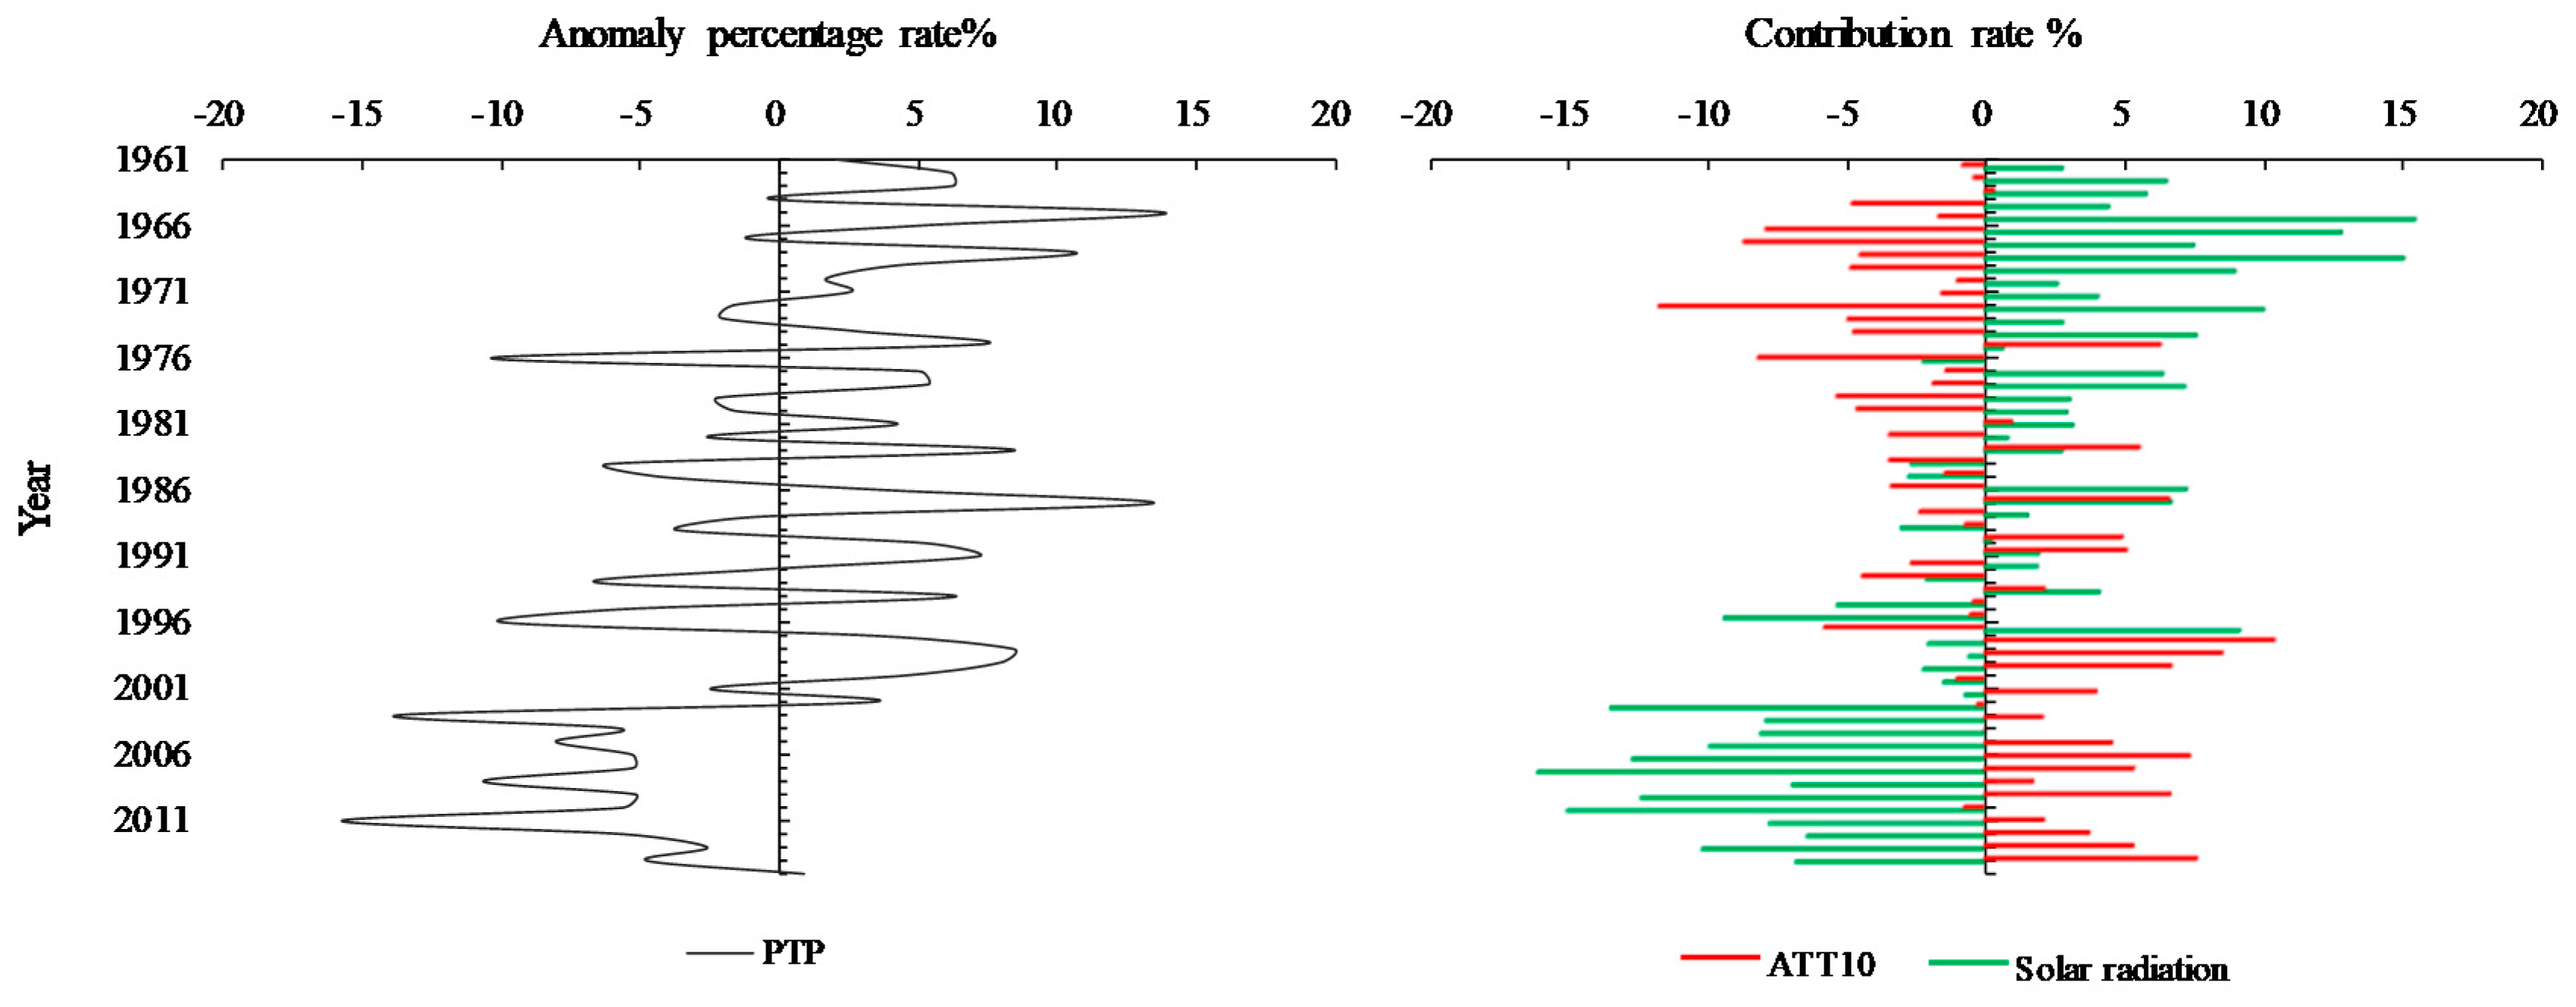
The PTP of summer maize in the NCP has reduced by 11.0% in the recent 55 years, which was caused by the changes in temperature and solar radiation. Climate warming had positive impacts on maize production with an average contribution value of 4.6% (see Figure 7). On the other hand, dimming offset the increase of PTP due to warming climate, which led to a 15.6% reduction in PTP in the recent 55 years.
We further explored the change rate of the PTP of summer maize and the contribution rate of temperature and solar radiation to the PTP in each stage. Negative contribution value of solar radiation to the PTP was found in each stage. The greatest contribution rate was found in the heading–start grain filling stage, leading to a 5.7% decrease in the PTP. The late stage (start grain filling–maturity) showed largest contribution of temperature, which caused the PTP of summer maize to increase by 1.9%.

4. Discussion

4.1. Climate Warming and Dimming in the NCP

The NCP has experienced noticeable climate warming trend in summer maize growing season, and the greatest ATT10 increasing trends occurred in the last 15 years. Ma et al. [49] also reported that climate change has enriched the thermal resources in the NCP, resulting in a northward shift for ATT10. As thermal resources are the important limiting factors for the winter wheat-summer corn annual cropping system in the NCP, climate warming would have positive effects on improving the grain yield by extending the geographical distribution and providing longer growing season [26,50,51]. Similar results were also reported in northeast China by Liu et al. [52]. It should be noted that this conclusion is based on the assumption of an invariant maize growing season. However, rising temperatures are expected to accelerate crop growth [53] and shorten the length of reproductive growth stage [54], and thus reduce the total dry biomass; similar results are also reported in the future climate projections [55,56,57,58]. Therefore, some effective management options, as well as shifting cultivars in longer growing season, must be used to offset the negative impact caused by climate warming. For example, Wang [19] reported that “Double-Delay” technology, i.e., delaying both the sowing time of wheat and the harvesting time of maize, was an effective option for wheat and maize cropping system in the NCP. Liu et al. [31] also found that a delayed harvest could increase the summer corn yield by 83.8–158.1 kg ha−1 day−1 in the NCP. Climate warming provides favorable thermal conditions for this technology, especially in the northern NCP, where the double cropping system is strictly limited by available thermal time.
Climate dimming/brightening has been wildly discussed in previous studies [7,59,60], but the published results show large discrepancies and inconsistencies in different regions. A decline in land surfaces’ solar radiation was found in many observational records up to the 1990s; a widespread brightening has been observed since the late 1980s in the Northern Hemisphere [11] and South America [12]. In Asia, India is one of the few regions that exhibited a continuous solar dimming from the 1970s to the 2000s [61]. Most regions in China showed a similar dimming trend, and the brightening trend mainly occurred in southeast China since 1990, which was weak and insignificant [18]. In this study, we found that all stations in the NCP showed a steady dimming trend during summer maize growing season at both decadal and annual scales. Yadav et al. [62] reported that dimming of global radiation could significantly affect grain yield and harvest index, and they found that dimming has led to a 15.6% decline in the PTP in the recent 55 years.

4.2. The Combining Impacts of Climate Warming and Dimming on the PTP

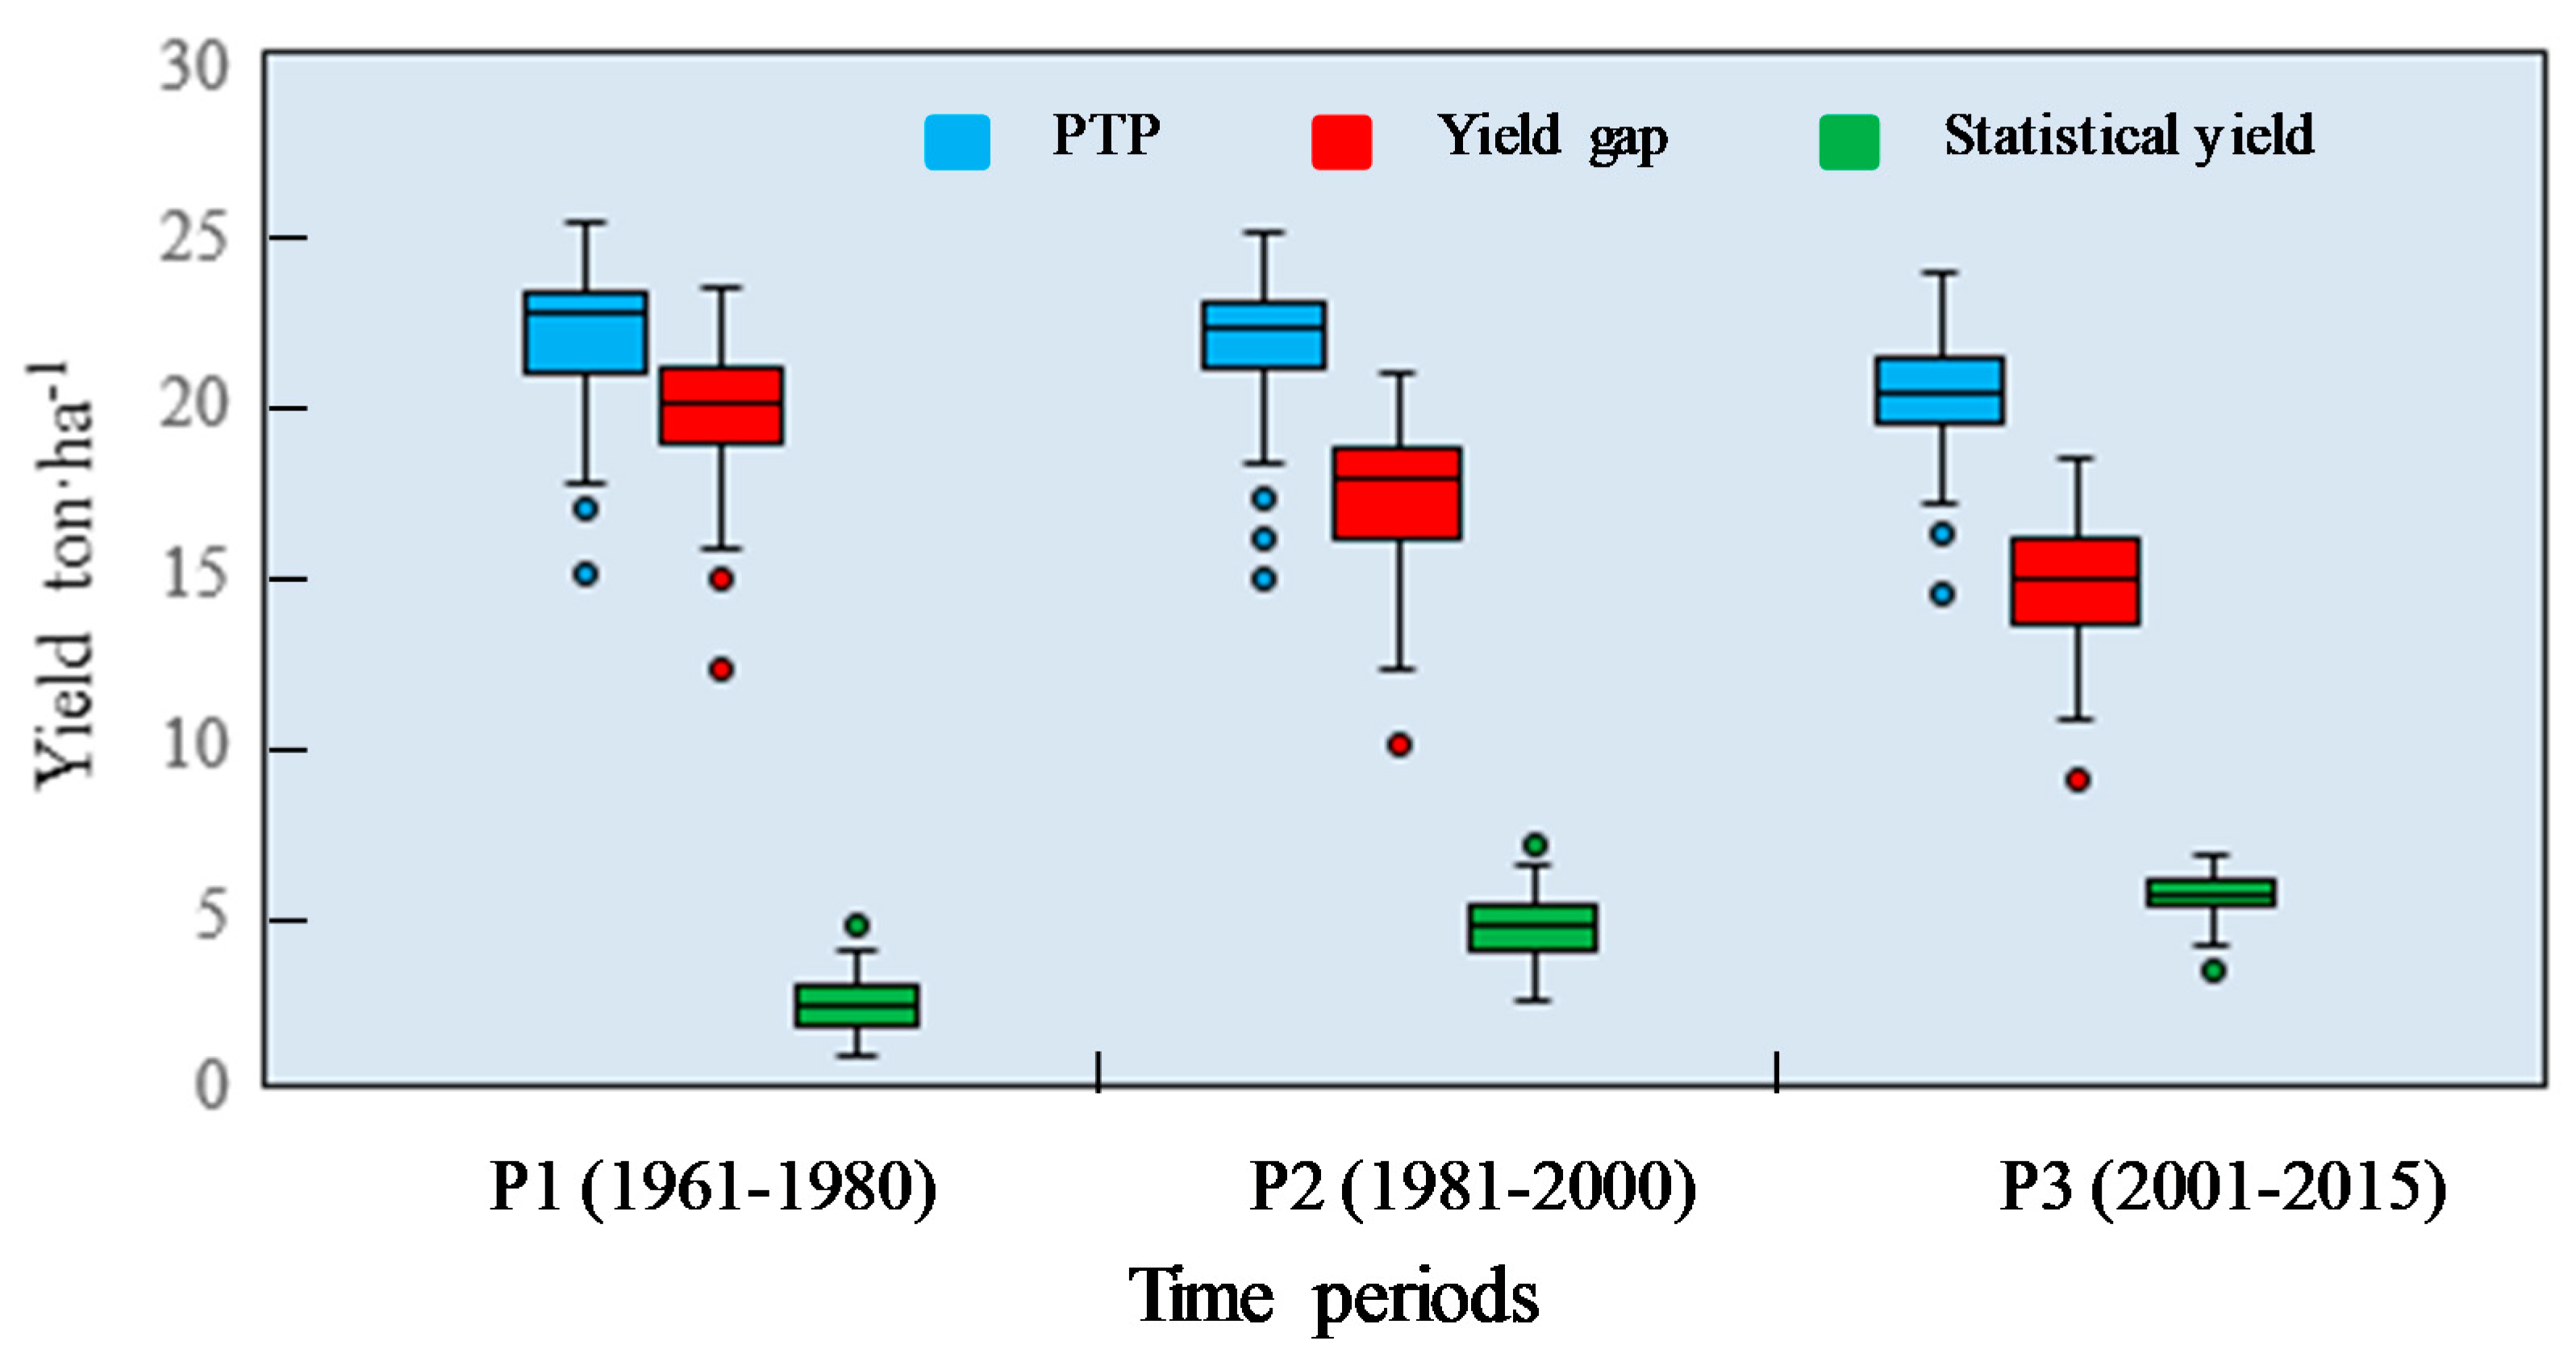
Influenced by climate warming and dimming, the PTP of summer maize in the NCP showed a significant decreasing trend, which indicates that the negative effect of dimming on the PTP is greater than the positive effect of climate warming. Tao et al. [25] analyzed the temporal and spatial changes of maize yield potentials in the southwestern China and obtained a similar result. It is worth mentioning that the actual summer maize yield per unit area showed an opposite changing trend compared with the PTP trend in the NCP. Here, we further analyzed the changes for the PTP of summer maize, statistical yield, and yield gap between the PTP and statistical yield in the NCP at the decadal scale, as shown in Figure 8. The actual summer maize yield has continuously increased since the 1960s, thus narrowing the yield gap. The growth rate for the statistical yield of summer maize reached 864 kg·ha−1·decade−1 (P < 0.05), which resulted from the improvement of agronomic measures and techniques, such as crop varieties, irrigation, and fertilization. However, the average productivity level was still relatively low in the study area, and the statistical yield in the past 15 years (P3, 2001–2015) only accounted for 26.1% of the PTP.
Moreover, we calculated the maize radiation use efficiency in the NCP and found that the efficiency value was only 1.06 ± 0.11% during 2001–2015, indicating that solar radiation was sufficient and not a limiting factor over maize growing period in the NCP. Under these circumstances, maize production could benefit more from climate warming. Li et al. [63] found that maize yield per unit area in the 2000s was almost double the yield in the 1970s, and 11.2% of the increase was resulted from climate change. This study confirmed that climate warming has positive impact on the PTP with an average contribution rate of 4.6% in the past 55 years. Meng et al. [64] also found a similar result in northeast China.
Theoretically, the PTP determines the maximum value that the actual summer maize yield can be reached when the water and soil conditions are fully satisfied. In recent years, many scholars have been studying how to narrow the yield gap [65,66,67], and the latest high yield record of summer maize in the NCP has reached 20.04 kg·ha−1 (2014, Laizhou City, Shandong Province). This study highlights that the decrease in the PTP of summer maize in the NCP may be a limit factor to obtain high yield when the agricultural technology achieves significant progress in the future.
Obviously, the impact of climate change on the actual summer maize production in the NCP is complicated. For example, the increase in the risk of freezing damage in the late stage of maize growth, as well as diseases and insect damage, need to be considered when early maturity varieties are replaced by middle and late maturing varieties. Meanwhile, limited precipitation during the summer-rainy season is one of the major production constraints in most areas of the NCP [68], where high level of production depends largely on irrigation [69]. Therefore, a comprehensive analysis of climatic factors (solar radiation, temperature and precipitation), as well as agronomic measures and pest control, is needed in further research, which could provide scientific basis for the distribution and adjustment of summer maize production to adapt to the climate change in the NCP.

5. Conclusions

The NCP showed a warming trend in maize growing season with the average ATT10 trend value of 13.7 °C·day·decade−1 during the period of 1961–2015. Climate dimming was found in the recent 55 years, and all stations showed significant decline in solar radiation with the average trend value of −62.4 MJ·m−2·decade−1. Continuous warming and diming trends were found at the decadal scale, leading to a shift of the contour lines of ATT10 and solar radiation. P3 (2001–2015) showed the greatest mean values for ATT10 and least mean values for solar radiation in the three periods, and both ATT10 and solar radiation had an abrupt change in the mid-1990s. Influenced by climate warming and dimming, the PTP of summer maize in the NCP was significantly reduced at the changing rate of −424.5 kg·ha−1·decade−1 in the recent 55 years. Compared with P1, the average PTP in P2 and P3 decreased by 0.1% and 8.2%, respectively. Assuming the maize growing season remains unchanged, climate warming could have positive impact on maize potential production and increase PTP by 4.6% over the period of 1961–2015. By contrast, dimming offset the increase of the PTP due to climate warming, leading to a 15.6% reduction in the PTP in the recent 55 years. Overall, climate warming and dimming in maize growing season has occurred in the NCP, which reduced the PTP of summer maize. However, actual maize yield could benefit more from climate warming because solar radiation is not a limiting factor for the current low production level. The government may promote some agronomic technical measures or new varieties to improve radiation use efficiency, which could greatly increase the farmers’ maize yield. A comprehensive analysis of impacts of climatic factors (solar radiation, temperature and precipitation), as well as agronomic measures and pest control on maize yield in the NCP is necessary in future.

Author Contributions

X.P. and B.H. provided funding and support; X.M. and Q.H. (Qi Hu). collected the data; Q.H. (Qijin He) analyzed the data and wrote the paper; F.P. reviewed and revised the paper; H.H. organized the article format and modified the paper. All authors read and approved the final manuscript.

Funding

This research was funded by National Key Research and Development Project (Grant Nos. 2017YFD0300304, 2017YFD0300404, 2016YFD0300106, and 2016YFD0300105), and National Natural Science Foundation of China (No. 41271053). The funding agencies had no involvement in the study design, analysis interpretation, writing, or publication.

Conflicts of Interest

The authors declare no conflict of interest.

References

  1. Intergovernmental Panel on Climate Change (IPCC). Climate Change 2014: Synthesis Report; IPCC: Geneva, Switzerland, 2015. [Google Scholar]
  2. Philander, S.G. Why global warming is a controversial issue. Science 2001, 294, 2105–2106. [Google Scholar] [CrossRef]
  3. Trolle, D.; Nielsen, A.; Rolighed, J.; Thodsen, H.; Andersen, H.E. Projecting the future ecological state of lakes in Denmark in a 6 degree warming scenario. Clim. Res. 2015, 64, 55–72. [Google Scholar] [CrossRef] [Green Version]
  4. Wang, L.; Liu, B.; Henderson, M.; Shen, X.; Yang, L. Warming across decades and deciles: Minimum and maximum daily temperatures in China, 1955–2014. Int. J. Climatol. 2017, 38, 2325–2332. [Google Scholar] [CrossRef]
  5. Hu, Q.; Pan, X.; Shao, C.; Zhang, D.; Wang, X.; Wei, X. Distribution and variation of china agricultural heat resources in 1961–2010. Chin. J. Agrometeorol. 2014, 35, 119–127. [Google Scholar]
  6. Wild, M. Global dimming and brightening: A review. J. Geophys. Res. Atmos. 2009, 114. [Google Scholar] [CrossRef] [Green Version]
  7. Stanhill, G.; Cohen, S. Global dimming: A review of the evidence for a widespread and significant reduction in global radiation with discussion of its probable causes and possible agricultural consequences. Agric. For. Meteorol. 2001, 107, 255–278. [Google Scholar] [CrossRef]
  8. Liepert, B. Observed reductions of surface solar radiation at sites in the United States and worldwide from 1961 to 1990. Geophys. Res. Lett. 2002, 29, 61. [Google Scholar] [CrossRef]
  9. Alpert, P.; Kishcha, P.; Kaufman, Y.J.; Schwarzbard, R. Global dimming or local dimming?: Effect of urbanization on sunlight availability. Geophys. Res. Lett. 2005, 321, 317–330. [Google Scholar] [CrossRef]
  10. Ohvril, H.; Teral, H.; Neiman, L.; Kannel, M.; Uustare, M. Global gimming and brightening versus atmospheric column transparency, Europe 1906–2007. J. Geophys. Res. Atmos. 2009, 114, 1588–1593. [Google Scholar] [CrossRef]
  11. Wild, M.; Gilgen, H.; Roesch, A.; Ohmura, A.; Long, C.N. From dimming to brightening: Decadal changes in solar radiation at Earth’s surface. Science 2005, 308, 847–850. [Google Scholar] [CrossRef]
  12. Raichijk, C. Observed trends in sunshine duration over South America. Int. J. Climatol. 2012, 32, 669–680. [Google Scholar] [CrossRef]
  13. Dwyer, J.G.; Norris, J.R.; Ruckstuhl, C. Do climate models reproduce observed solar dimming and brightening over China and Japan? J. Geophys. Res. Atmos. 2010, 115. [Google Scholar] [CrossRef] [Green Version]
  14. Pinker, R.T.; Zhang, B.; Dutton, E.G. Do satellites detect trends in surface solar radiation? Science 2005, 308, 850–854. [Google Scholar] [CrossRef] [PubMed]
  15. Wang, Y.; Yang, Y. China’s dimming and brightening: Evidence, causes and hydrological implications. Ann. Geophys. 2014, 32, 41–55. [Google Scholar] [CrossRef]
  16. Salinger, M.J. Increasing Climate Variability and Change: Reducing the Vulnerability. In Increasing Climate Variability and Change; Springer: Dordrecht, The Netherlands, 2005. [Google Scholar]
  17. Tao, F.; Yokozawa, M.; Xu, Y.; Hayashi, Y.; Zhang, Z. Climate changes and trends in phenology and yields of field crops in China, 1981–2000. Agric. For. Meteorol. 2006, 138, 82–92. [Google Scholar] [CrossRef]
  18. Wang, X.; Chen, Y.; Sui, P.; Gao, W.; Qin, F. Emergy analysis of grain production systems on large-scale farms in the North China Plain based on LCA. Agric. Syst. 2014, 128, 66–78. [Google Scholar] [CrossRef]
  19. Wang, J. Increased yield potential of wheat-maize cropping system in the North China Plain by climate change adaptation. Clim. Chang. 2012, 113, 825–840. [Google Scholar] [CrossRef]
  20. Parry, M.L.; Rosenzweig, C.; Iglesias, A.; Livermore, M.; Fischer, G. Effects of climate change on global food production under SRES emissions and socio-economic scenarios. Golb. Environ. Chang. 2004, 14, 53–67. [Google Scholar] [CrossRef]
  21. Yang, J.; Liu, Q.; Yan, C.; Mei, X. Spatial and temporal variation of solar radiation in recent 48 years in North China. Acta Ecol. Sin. 2011, 31, 2748–2756. [Google Scholar]
  22. Huang, S.; Lv, L.; Zhu, J.; Li, Y.; Tao, H. Extending growing period is limited to offsetting negative effects of climate changes on maize yield in the North China Plain. Field Crops Res. 2018, 215, 66–73. [Google Scholar] [CrossRef]
  23. Mo, X.; Liu, S.; Lin, Z.; Guo, R. Regional crop yield, water consumption and water use efficiency and their responses to climate change in the North China Plain. Agric. Ecosyst. Environ. 2009, 134, 67–78. [Google Scholar] [CrossRef] [Green Version]
  24. He, D.; Wang, J.; Pan, Z.; Dai, T.; Wang, E. Changes in wheat potential productivity and drought severity in Southwest China. Theor. Appl. Climatol. 2017, 130, 477–486. [Google Scholar] [CrossRef]
  25. Tao, F.; Zhang, S.; Zhang, Z.; Rötter, R.P. Temporal and spatial changes of maize yield potentials and yield gaps in the past three decades in China. Agric. Ecosyst. Environ. 2015, 208, 12–20. [Google Scholar] [CrossRef] [Green Version]
  26. Binder, J.; Graeff, S.; Link, J.; Claupein, W.; Liu, M. Model-Based approach to quantify production potentials of summer maize and spring maize in the North China Plain. Agron. J. 2008, 100, 862–873. [Google Scholar] [CrossRef]
  27. Liu, Z.; Wang, E.; Yang, X.; Jing, W. Contributions of climatic and crop varietal changes to crop production in the North China Plain, since 1980s. Golb. Chang. Biol. 2010, 16, 2287–2299. [Google Scholar] [CrossRef]
  28. Bunting, E.S. The relationship between mean temperature and accumulated temperature totals for maize in the central lowlands of England. J. Agric. Sci. 1979, 93, 157–169. [Google Scholar] [CrossRef]
  29. Bai, Q.; Huo, Z.; Li, S.; Du, H.; Nan, H.; Yan, J. Comparison of accumulated temperature above 10 °C before and after the year 1978 in China. Chin. J. Appl. Ecol. 2008, 19, 1810–1816. [Google Scholar]
  30. Allen, R.G.; Pereira, L.; Raes, D.; Smith, M. Crop Evapotranspiration: Guidelines for Computing Crop Water Requirements. FAO Irrigation and Drainage Paper 56; Food and Agriculture Organisation: Rome, Italy, 1998. [Google Scholar]
  31. Yadav, S.; Deb, P.; Kumar, S.; Pandey, V.; Pandey, P.K. Trends in major and minor meteorological variables and their influence on reference evapotranspiration for mid-Himalayan region at east Sikkim, India. J. Mt. Sci. 2016, 13, 302–315. [Google Scholar] [CrossRef]
  32. Angstrom, A. On the computation of global radiation from records of sunshine. Ark. Geophys. 1956, 3, 471–479. [Google Scholar]
  33. He, Q.; Xie, Y. Research on climatology calculation methods of total solar radiation in China. J. Nat. Resour. 2010, 25, 308–319. [Google Scholar]
  34. Yuan, B.; Guo, J.; Ye, M.; Zhao, J. Variety distribution pattern and climatic potential productivity of spring maize in Northeast China under climate change. Chin. Sci. Bull. 2012, 57, 3497–3508. [Google Scholar] [CrossRef] [Green Version]
  35. He, D.; Wang, J.; Dai, T.; Feng, L.; Zhang, J.; Pan, X.; Pan, Z. Impact of climate change on maize potential productivity and the potential productivity gap in Southwest China. J. Meteorol. Res. 2014, 28, 1155–1167. [Google Scholar] [CrossRef]
  36. Hu, Q.; Pan, F.; Pan, X.; Li, Q.; Shao, C.; Pan, Z.; Wei, Y. Trends in agricultural heat and solar radiation resources in Northeast China: A multistage spatio-temporal analysis. Int. J. Climatol. 2016, 36, 2461–2468. [Google Scholar] [CrossRef]
  37. Mann, H.B. Nonparametric tests against trend. Econometrica 1945, 13, 245–259. [Google Scholar] [CrossRef]
  38. Kendall, M.G. Rank Correlation Methods; Charle Griffin: London, UK, 1975. [Google Scholar]
  39. Ivits, E.; Cherlet, M.; Sommer, S.; Mehl, W. Addressing the complexity in non-linear evolution of vegetation phenological change with time-series of remote sensing images. Ecol. Indic. 2013, 26, 49–60. [Google Scholar] [CrossRef]
  40. Partal, T.; Küçük, M. Long-term trend analysis using discrete wavelet components of annual precipitations measurements in Marmara region (Turkey). Phys. Chem. Earth 2006, 31, 1189–1200. [Google Scholar] [CrossRef]
  41. Hirsch, R.M.; Slack, J.R. A nonparametric trend test for seasonal data with serial dependence. Water Resour. Res. 1984, 20, 727–732. [Google Scholar] [CrossRef]
  42. Peng, B.; Liu, W.; Guo, M. Impacts of climate variability and human activities on decrease in streamflow in the Qinhe River, China. Theor. Appl. Clim. 2014, 117, 293–301. [Google Scholar]
  43. Hamed, K.H. Trend detection in hydrologic data: The Mann Kendall trend test under the scaling hypothesis. J. Hydrol. 2008, 349, 350–363. [Google Scholar] [CrossRef]
  44. Adamowski, K.; Prokoph, A.; Adamowski, J.; Buttle, J.; Branfireum, B. Development of a new method of wavelet aided trend detection and estimation. Hydrol. Process. 2009, 23, 2686–2696. [Google Scholar] [CrossRef]
  45. Hu, Q.; Pan, F.; Pan, X.; Hu, L.; Wang, X.; Yang, P.; Wei, P.; Pan, Z. Dry-wet variations and cause analysis in Northeast China at multi-time scales. Theor. Appl. Climatol. 2018, 133, 775–786. [Google Scholar] [CrossRef]
  46. Liu, C.; Zhang, D. Temporal and spatial change analysis of the sensitivity of potential evapotranspiration to meteorological influencing factors in China. Acta Geogr. Sin. 2011, 66, 579–588. [Google Scholar]
  47. Reddy, S.J. Sensitivity of some potential evapotranspiration estimation methods to climate change. Agric. For. Meteorol. 1995, 77, 121–125. [Google Scholar]
  48. Goyal, R.K. Sensitivity of evapotranspiration to global warming: A case study of arid zone of Rajasthan (India). Agric. Water Manag. 2004, 69, 1–11. [Google Scholar] [CrossRef]
  49. Ma, S.; Wang, Q.; Luo, X. Effect of climate change on maize (Zea mays) growth and yield based on stage sowing. Acta Ecol. Sin. 2008, 28, 2131–2139. [Google Scholar]
  50. Olesen, J.E.; Trnka, M.; Kersebaum, K.C.; Skjelvag, A.O.; Seguin, B.; Peltonen-Sainio, P.; Rossi, F.; Kozyra, J.; Micale, F. Impacts and adaptation of European crop production systems to climate change. Eur. J. Agron. 2011, 34, 96–112. [Google Scholar] [CrossRef]
  51. Yang, X.; Liu, Z.; Chen, F. The possible effect of climate warming on northern limits of cropping system and crop yield in China. Agric. Sci. China 2011, 10, 585–594. [Google Scholar] [CrossRef]
  52. Liu, Z.; Hubbard, K.G.; Lin, X.; Yang, X. Negative effects of climate warming on maize yield are reserved by the changing of sowing date and cultivar selection in Northeast China. Golb. Chang. Biol. 2013, 19, 3481–3492. [Google Scholar]
  53. Bonfante, A.; Monaco, E.; Alfieri, S.M.; Lorenzi, F.D.; Manna, P.; Basile, A.; Bouma, A. Climate change effects on the suitability of an agricultural area to maize cultivation: Application of a new hybrid land evaluation system. Adv. Agron. 2015, 133, 33–69. [Google Scholar]
  54. Xiao, D.; Qi, Y.; Shen, Y.; Tao, F.; Moiwo, J.P.; Liu, J.; Wang, R.; Zhang, H.; Liu, F. Impact of warming climate and cultivar change on maize phenology in the last three decades in North China Plain. Theor. Appl. Clim. 2016, 124, 653–661. [Google Scholar] [CrossRef]
  55. Wang, M.; Li, Y.; Ye, W.; Bornman, J.; Yan, X. Effects of climate change on maize production and potential adaptation measures: A case study in Jilin province, China. Clim. Res. 2011, 46, 223–242. [Google Scholar] [CrossRef]
  56. Li, X.; Takahashi, T.; Suzuki, N.; Kaiser, H.M. Impact of climate change on maize production in northeast and southwest China and risk mitigation strategies. Procedia APCBEE 2014, 8, 11–20. [Google Scholar] [CrossRef]
  57. Deb, P.; Kiem, A.S.; Babel, M.S.; Chu, S.T.; Chakma, B. Evaluation of climate change impacts and adaptation strategies for maize cultivation in the Himalayan foothills of India. J. Water Clim. Chang. 2015, 6, 596–614. [Google Scholar] [CrossRef]
  58. Abera, K.; Crespo, O.; Seid, J.; Mequanent, F. Simulating the impact of climate change on maize production in Ethiopia, East Africa. Environ. Syst. Rese. 2018, 7, 4. [Google Scholar] [CrossRef] [Green Version]
  59. Stjern, C.W.; Kristjánsson, J.E.; Hansen, A.W. Global dimming and global brightening—an analysis of surface radiation and cloud cover data in northern europe. Int. J. Climatol. 2009, 29, 643–653. [Google Scholar] [CrossRef]
  60. Wang, K.; Dickinson, R.E.; Liang, S. Clear Sky Visibility Has Decreased over Land Globally from 1973 to 2007. Science 2009, 323, 1468–1470. [Google Scholar] [CrossRef]
  61. Soni, V.K.; Pandithurai, G.; Pai, D.S. Is there a transition of solar radiation from dimming to brightening over India? Atmos. Res. 2016, 169, 209–224. [Google Scholar] [CrossRef]
  62. Yadav, B.; Mukherjee, J.; Sehgal, V.K.; Das, D.K.; Krishnan, P. Effect of dimming of global radiation on morphology and yield of wheat crop in Delhi. J. Agrometeorol. 2017, 19, 323–327. [Google Scholar]
  63. Li, X.; Chen, L.; Jiang, L. Contribution of climate warming to maize yield for 1961–2008 in Heilongjiang province. Adv. Clim. Chang. Res. 2011, 7, 336–341. [Google Scholar]
  64. Meng, Q.; Hou, P.; Lobell, D.B.; Wang, H.; Cui, Z. The benefits of recent warming for maize production in high latitude China. Clim. Chang. 2014, 122, 341–349. [Google Scholar] [CrossRef]
  65. Cui, Z.; Yue, S.; Wang, G.; Meng, Q.; Wu, L. Closing the yield gap could reduce projected greenhouse gas emissions: A case study of maize production in China. Golb. Chang. Biol. 2013, 19, 2467–2477. [Google Scholar] [CrossRef] [PubMed]
  66. Mueller, N.D.; Gerber, J.S.; Johnston, M.; Ray, D.K.; Ramankutty, N. Closing yield gap through nutrient and water management. Nature 2012, 490, 254–257. [Google Scholar] [CrossRef]
  67. Solanki, R.L.; Rathore, R.S.; Dhakar, S.D.; Kanojia, Y. Yield gap analysis of integrated nutrient management in maize through front line demonstration. Int. J. Plant. Sci. Muzaffarnagar 2014, 9, 438–440. [Google Scholar]
  68. Liu, B.; Mei, X.; Lv, G.; Yang, Y.; Bai, M.; Wu, Y.; Song, J.; Bai, W. The maize evapotranspiration in the background of climate change: A case study in arid area. Hydrol. Process. 2012, 26, 633–639. [Google Scholar] [CrossRef]
  69. Sun, H.; Shen, Y.; Yu, Q.; Flerchinger, G.N.; Zhang, Y. Effect of precipitation change on water balance and WUE of the winter wheat–summer maize rotation in the North China Plain. Agric. Water Manag. 2010, 97, 1139–1145. [Google Scholar] [CrossRef]
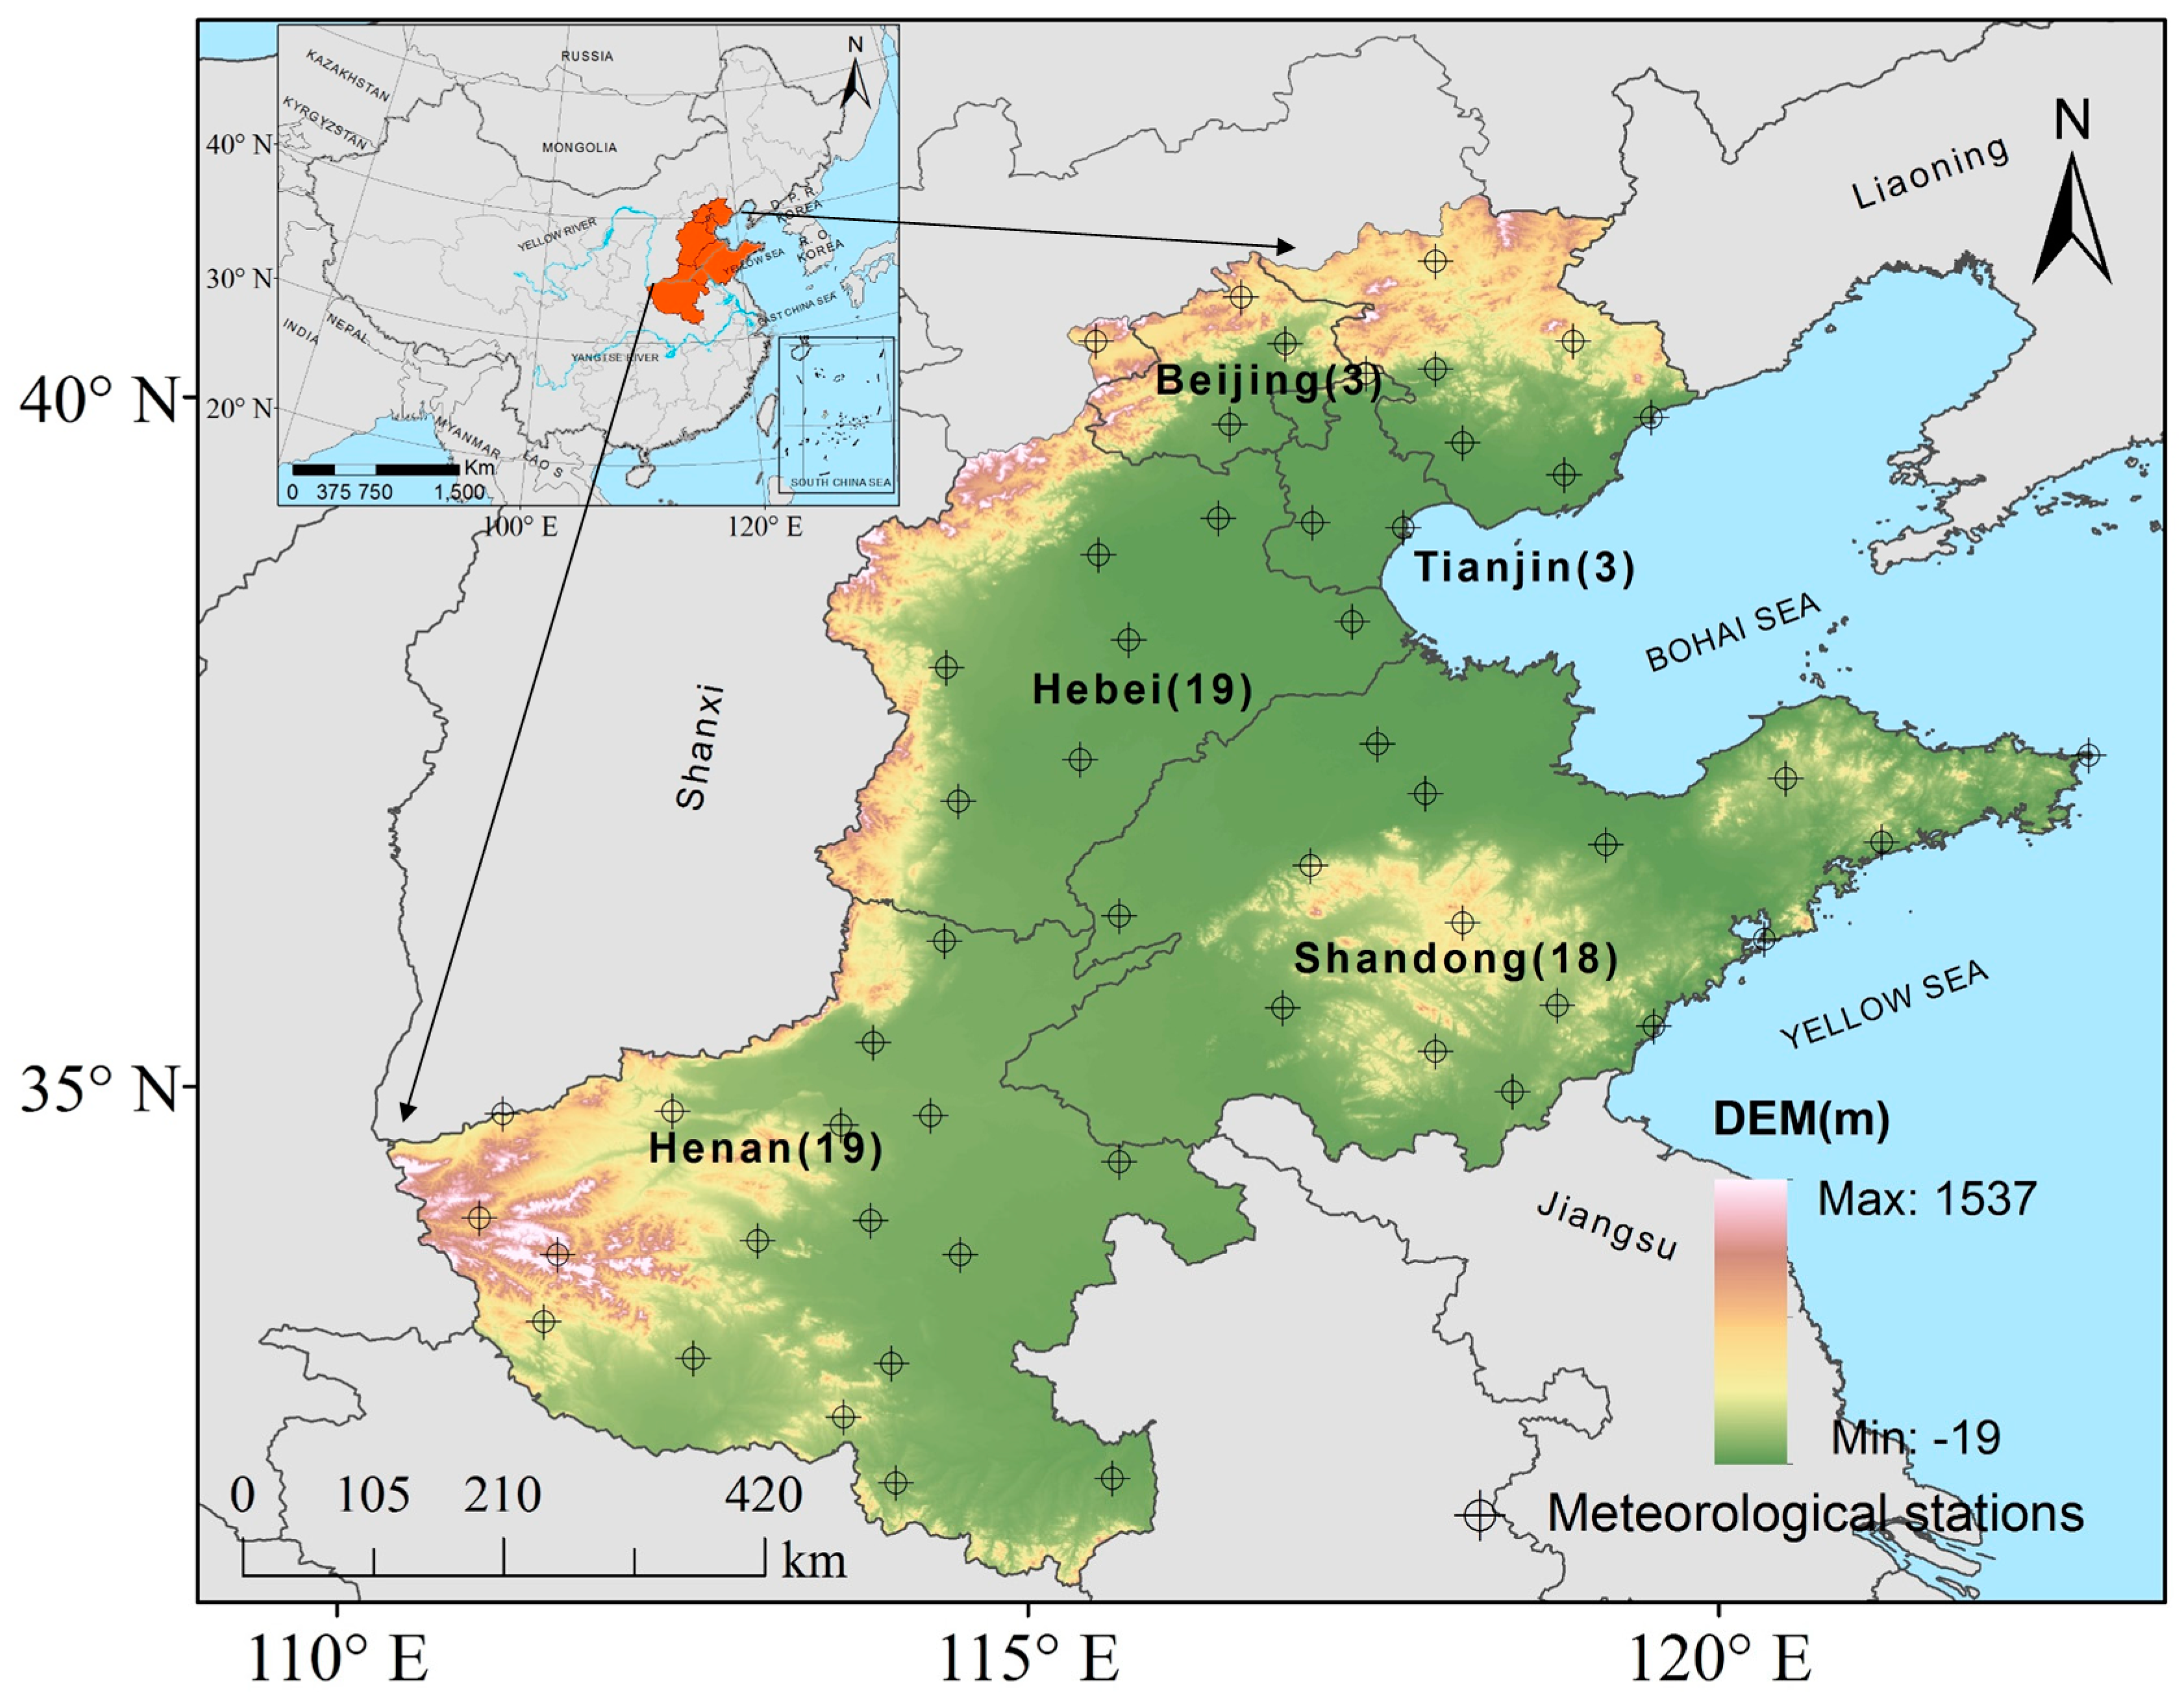
Figure 1. Boundary and meteorological stations in NCP. Digital Elevation Model (DEM) data were from Chinese Academy of Sciences and downloaded at http://www.resdc.cn/.
Sustainability 11 02588 g001
Figure 2. Changing characteristics of ATT10 (°C·day) (a) and solar radiation (MJ·m−2) (b) in maize growing season at decadal scale. Three time periods are divided, i.e., Period 1 (P1, 1961–1979), Period 2 (P2, 1980–1999), and Period 3 (P3, 2000–2015).
Sustainability 11 02588 g002
Figure 3. M-K test for ATT10 (a) and solar radiation (b) in maize growing season over the period of 1961–2015. The values for each year were calculated for the average of 55 meteorological stations in NCP.
Sustainability 11 02588 g003
Figure 4. Spatial distribution of climate trend rates for ATT10 (°C·day·decade−1) (a) and solar radiation (MJ·m−2·decade−1) (b) in maize growing season in NCP over the period of 1961–2015.
Sustainability 11 02588 g004
Figure 5. Changing characteristics of the PTP of summer maize (ton·ha−1) in NCP at decadal scale.
Sustainability 11 02588 g005
Figure 6. Spatial distribution of climate trend rate for the PTP of summer maize (kg·ha−1·decade−1) in NCP over the period of 1961–2015.
Sustainability 11 02588 g006
Figure 7. Annual anomaly percentage rate of the PTP of summer maize and the contribution rate of ATT10 and solar radiation to the PTP in NCP over the period of 1961–2015.
Sustainability 11 02588 g007
Figure 8. Changes for the PTP of summer maize, statistical yield, and yield gap in NCP at decadal scale. The statistical yield data were obtained from National Bureau of Statistics of China (http://www.stats.gov.cn/).
Sustainability 11 02588 g008
Table 1. The average and standard deviation values of the meteorological variables in summer maize growing season in the NCP.
Mean Temperature (°C)Maximum Temperature (°C)Minimum Temperature (°C)Relative Humidity (%)Precipitation (mm)Wind Speed (m/s)Sunshine Hours (h)
Average value23.628.719.275.0469.92.3831.3
Standard deviation1.11.31.43.778.30.779.8
Table 2. Minimum (tmin), optimum (t0), and maximum (tmax) temperatures for each summer maize developmental stages (°C).
Stagetmintotmax
Initial (sowing–jointing)62532
Development (jointing–heading)102735
Middle (heading–start grain filling)152734
Late (start grain filling–maturity)152332
Table 3. Climate trend for ATT10 and solar radiation in maize growing season and the number of stations with significant trend value in NCP.
ATT10
°C·Day·Decade−1
Solar Radiation
MJ·m−2·Decade−1
Climate trend13.7−28.3
Number of stations with significant increasing trend (P < 0.05)350
Number of stations with significant decreasing trend (P < 0.05)055