1. Introduction
Thanks to the evolution of manufacturing systems, manufacturing companies can efficiently plan, design, and produce their products. However, as the adoption of the internet of things (IoT) and manufacturing information systems increases, the complexity and interactivity of communications within information systems is expected to expand. Furthermore, there may be large volumes of data stored in a database, because IoT devices constantly transmit data of identified objects [
1]. Because of these circumstances, it is still challenging for manufacturing companies to manage a vast array of their manufacturing data and processes. Although information and communication technologies have been introduced to promote technical support for manufacturing operations management (MOM), a more comprehensive methodology should be adopted to fully support manufacturing-process-centric management activities.
The business process management (BPM) approach can be a solution to tackle this hurdle by continually improving processes through automation and optimization. Manufacturing companies could also benefit from the well-defined methodologies and process-centric engineering practices of the BPM approach for optimizing their manufacturing processes. In particular, various analysis techniques which come from the BPM research field may be fruitful for efficiently managing a large set of manufacturing processes [
2].
Based on the BPM approach, we propose a similarity-based hierarchical clustering method for manufacturing process models to facilitate managerial activities of manufacturing processes at a group level (e.g., the design and engineering tasks). To this end, modeling of manufacturing processes and enabling the measuring similarities must be performed beforehand. Therefore, this paper exploits the business process model and notation (BPMN) standard and its extension for modeling of manufacturing processes. The novel manufacturing process of modeling with the adaptation of the BPMN helps human understanding by a visual diagram and machine understanding is helped by a converted textual form that is executable in the BPM system. Measuring similarities, in this study, is performed by calculating the operation similarity and structural similarity between the models of manufacturing processes, respectively. The hierarchical clustering method this paper proposes operates based on the measured similarities between the models. We note that the contributions of this paper assume that a manufacturing company adopts the BPM approach and it operates a variety of manufacturing process models on a scale that is difficult to manage manually.
The remainder of this paper is organized as follows. In
Section 2, we briefly introduce previous works related to this work. Next, in
Section 3, we describe the adaptation of the BPM approach to the MOM area and its primary activities derived from this combined environment.
Section 4 includes details of BPMN-based manufacturing process modeling. As the main work of this paper,
Section 5 presents a similarity method for BPMN-based manufacturing process models, and
Section 6 describes a hierarchical clustering phase of manufacturing process models based on the similarities we propose. Finally, this work will be concluded with future research in
Section 7.
2. Related Works
The main elements of the method we propose in this paper are the similarity measures and clustering based on such similarity. We, therefore, organize the content of this section into two parts: process model similarity and clustering. Due to the lack of studies addressing similarity for manufacturing processes, a series of studies that propose similarity measures for business process models are mainly introduced and summarized in the similarity part. On the other hand, the clustering part includes related works applying clustering methods to the field of production research, and a comparison between them and this study.
Many similarity measures have been proposed in the field of BPM to handle a large collection of process models. Jung et al. [
3] presented a similarity measure which is based on the execution probability and structural features of business process models. Dijkman et al. [
4] investigated the similarity problem of process models centered on the structural aspect and proposed graph-matching algorithms for measuring similarities. They considered business process models as graphs and defined the structural feature between graphs, namely the graph-edit distance, as the criterion of similarity. Many different similarity concepts have been proposed from other studies, and a few comprehensive studies suggested that similarity measures between business process models can support the search and reuse of similar process models [
5,
6,
7]. Despite a rich set of previous studies contributing to the process similarity research, there is still a lack of proper methods for manufacturing processes since the BPM approach has not been actively discussed in manufacturing industry. As slightly different applications, in [
8], the similarity concept was applied to the problems of machine groupings for the design of manufacturing systems. Compared to our similarity, this study focused on relations between machines and components and therefore such measures are not process-centric.
On the other hand, clustering methods have been applied in manufacturing to address various manufacturing engineering problems including the machine grouping [
9,
10], CAD model grouping [
11], product variants management [
12], and product release planning [
13]. The machine grouping problem has traditionally been the subject of manufacturing systems, especially cellular manufacturing. Dimopoulos and Mort [
9] presented the machine-grouping technique based on the combination of genetic programming and hierarchical clustering. Likewise, Park and Suresh [
10] addressed the part-machine grouping to identify families of parts with similar routing sequences. The hierarchical clustering method, considered as a solution of the grouping problem, is supported by using the Fuzzy ART neural network. Their experiments showed the compelling performance of hierarchical clustering for large data sets. These two studies provided prerequisites for the implementation of cellular manufacturing. As a different kind of grouping problem, Li and Xie [
11] proposed a module partition approach with the hierarchical clustering of components to group CAD models into modules based on component dependencies. In addition, hierarchical clustering methods have also been applied to engineering applications, such as product variety management [
12] and the optimization problem of deciding the contents of product releases [
13].
As described above, hierarchical clustering methods have been applied for grouping elements that are part of a manufacturing process—such as machines, components, and CAD models—or to engineering applications that are irrelevant to the process grouping. This paper tries to combine the BPM approach to the field of MOM and proposes a hierarchical clustering method based on the similarity for grouping manufacturing process models, eventually enabling process group-level operations and engineering applications. Therefore, we believe that our work is distinguished from the previous works mentioned above.
3. Applying the BPM Approach to Manufacturing Operations Management
MOM is a methodology with the aim of optimizing the manufacturing operations in the stages including the creation, planning, production, and distribution of products. Because of the significance of each operation stage, there are well-established MOM systems (e.g., manufacturing execution systems) that have been developed to provide systematic support to the stage-level operations. In general, MOM systems are broadly classified into the following categories: production management system, performance analysis system, quality and compliance system, and human–machine interface system.
Despite the merits from such MOM methodology and systems, we believe that there is still a necessity to apply a process-centered approach to the manufacturing processes to concentrate the optimization efforts. Manufacturing companies have their own manufacturing processes as their core assets. Therefore, the management capability of such processes has a significant impact on the performance of manufacturing to a greater or lesser extent. It emphasizes that the collaboration capability supporting people-to-people, people-to-systems, and systems-to-systems interactions in performing manufacturing operations should be incorporated in order to meet technological requirements that emerge from trends in MOM systems.
The BPM approach [
14] covers management methodologies and systems for business processes. However, it can also be an effective way to integrate and align the capabilities of manufacturing operations with the manufacturing processes. While existing MOM systems are intended to increase the efficiency of operations associated with the product lifecycle, BPM systems can be a valuable addition to MOM since they offer comprehensive capabilities for manufacturing process management. Therefore, manufacturing companies can achieve advantages of the BPM approach through the modeling and efficient implementation of their manufacturing processes.
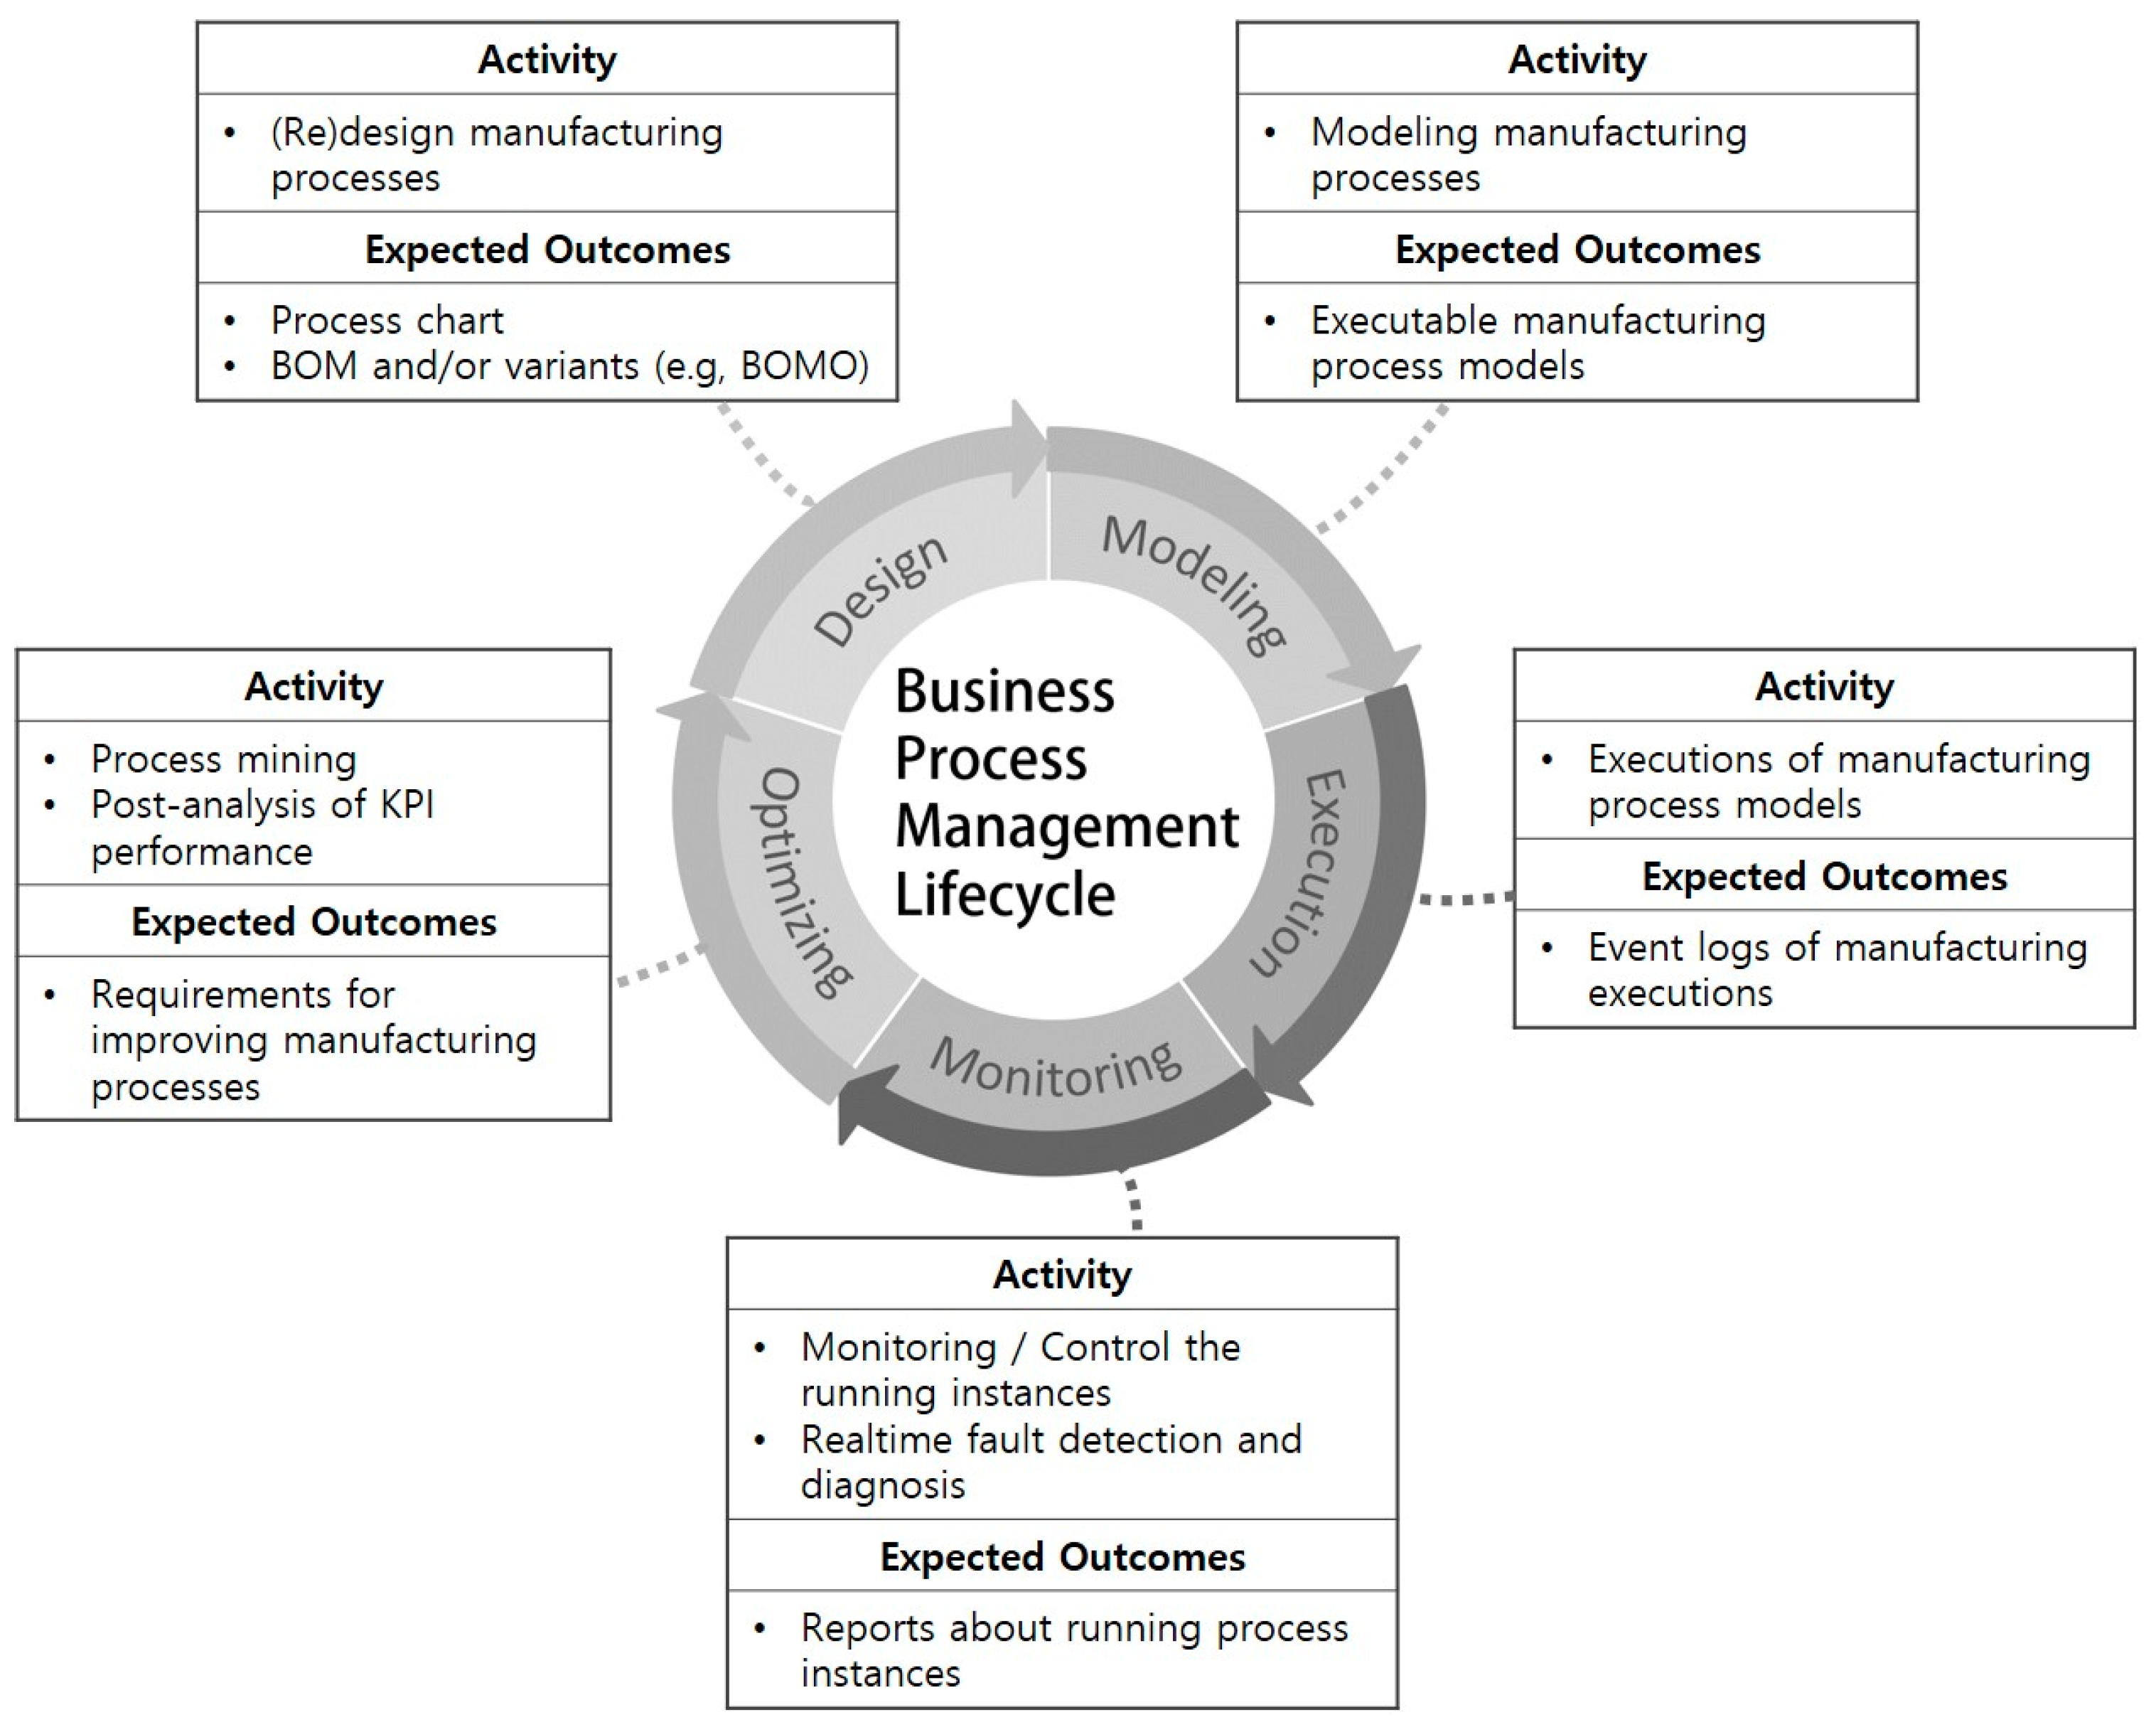
The process model is a central concept of BPM, formed from the contents created during the process design, and can be executed automatically by the process engine. Relating to the manufacturing processes,
Figure 1 represents details of the activities and expected outcomes based on manufacturing process models that correspond to each stage consisting in the BPM lifecycle.
Design Stage—This stage includes a series of steps from the establishment of initial development plan for the product to the redesign of existing manufacturing processes. From the view of process, this stage specifies which manufacturing operations should be taken to produce the desired product, and which components are required for each operation. Basic production-related data—such as bill-of-materials (BOM), operation process charts, and other specifications—are the expected outcomes of this stage and will serve the modeling stage of manufacturing processes.
Modeling Stage—Through the modeling of manufacturing processes, we can shift the manufacturing processes to the management area of BPM and ensure their automated execution. The outstanding standards for modeling processes, such as the BPMN and BPEL (Business Process Execution Language), can be applied in order to make manufacturing processes into the form of standard-compliant and executable models.
Execution Stage—Modeled manufacturing processes can be automatically executed by BPM systems under the assumption that manufacturing execution and control capabilities (e.g., manufacturing execution systems) are integrated or communicated with the BPM system. Each task of a manufacturing process model implements an individual manufacturing operation on the shop floor. During executions of manufacturing processes, event log data containing detailed records of manufacturing operations are generated and stored. Collected event log data are used in various analytics stages (e.g., process monitoring and optimization).
Monitoring Stage—As event logs are generated while manufacturing processes are being executed, it is possible to monitor the status of running manufacturing processes or process instances in real time [
15]. The well-established data formats for event logging can support the monitoring stage. For example, the XES (eXtensible Event Stream) standard, which has been widely adopted in the BPM field, has extensible data schema to incorporate specialized attributes of processes from various industry domains. As the result of this stage, manufacturing process reports help process administrators to take appropriate actions.
Optimization Stage—Based on event logs, process mining [
16,
17] and post-analysis techniques provide us with opportunities to investigate the quality and performance of completed manufacturing process executions and related operations and improve those inefficient parts. The derived requirements for manufacturing process improvement will be referenced in the process design or redesign stage of the next cycle.
Through continuous repetition of the BPM lifecycle applied into the MOM, manufacturing processes aligned with this management cycle can be expected to be constantly optimized to reflect the requirements that are derived by internal and external management factors. To take advantage of the convergence of these two management methodologies, modeling of the manufacturing process is a mandatory task. Therefore, the next section describes how to model the manufacturing process so that it complies with BPM-related standards from document-based manufacturing process data.
4. BPMN-Based Manufacturing Process Modeling
BPMN is one of the most widely used standards for modeling business processes. It provides a rich set of element types that can fully represent the context of a business process. Moreover, this standard can be easily extended, and it has been applied to modeling problems in various domains, such as wireless sensor network [
18], healthcare processes [
19], and manufacturing processes [
20,
21]. This section describes a construction procedure for manufacturing process models from the fundamental data of manufacturing processes.
Manufacturing companies conventionally possess operation process charts and BOM specifications to define and manage their manufacturing processes. In the Republic of Korea, the KS-A-3002 standard [
22], which is for manufacturing process charts, has been used in manufacturing industries. However, it provides only a set of graphical notations, and there is no technical support for the modeling and automatic executions for manufacturing processes.
Figure 2 shows an example of a manufacturing process chart for a thermocouple probe product.
A BOM specification is an essence of defining a manufacturing process that contains detailed data about the components (e.g., raw materials, parts, subassemblies, and end products) of each needed to manufacture a certain product. However, it is not sufficient to express the production flow of the manufacturing process. A manufacturing process consists of a set of manufacturing operations, which require a collection of components to manufacture and have prior relationships with other preceding and/or successive operations. In this regard, we additionally exploit the BOMO (Bill of Material Operations) concept, which is presented in [
23] to define production-flow-oriented information of manufacturing process examples.
As shown in
Table 1, each operation, such as wire welding, consumes a set of components and produces an intermediate component or end product. The preceding operation information provides an execution ordering of the operations within a manufacturing process. For example, the wire welding (OP1) and quartz tube winding (OP2) operations can be performed in parallel, but they must precede the wire injection operation (OP3) according to their ordering relationships. Through these basic ingredients of manufacturing process data (manufacturing process chart, BOM, and BOMO), we can organize structures for manufacturing processes.
To create manufacturing process models, we apply the BPMN standard, with an extension of notations. The BPMN standard has a variety of its extensions, but it lacks modeling notations for the manufacturing domain. Although a few studies presented extensions for manufacturing processes [
20,
21], their extensions do not cover the full context of the manufacturing domain due to the absence of uniformity. Accordingly, we define a BPMN extension that has a minimal set of element types but suffices to model the examples we present in this paper.
Every manufacturing process model essentially contains a start event and end event indicating their starting/terminating points. An operation refers to a primitive work within a manufacturing process. This type has precedence and/or successive relationships with other operations through connecting objects of sequence flows. Also, it is related to particular components through connecting objects of component associations, and production-related information such as operating cost. A component refers to an input of a particular operation and it can be a raw material, part, and subassembly.
Regarding the control-flow aspect, the notations of
Table 2 are limited to focus on the examples including only sequential and parallel control-flow patterns. However, it is necessary to add extra notations for other patterns, such as selective, repetitive, and other complex patterns to facilitate modeling of advanced types of manufacturing processes and systems (e.g., flexible manufacturing systems and reconfigurable manufacturing systems).
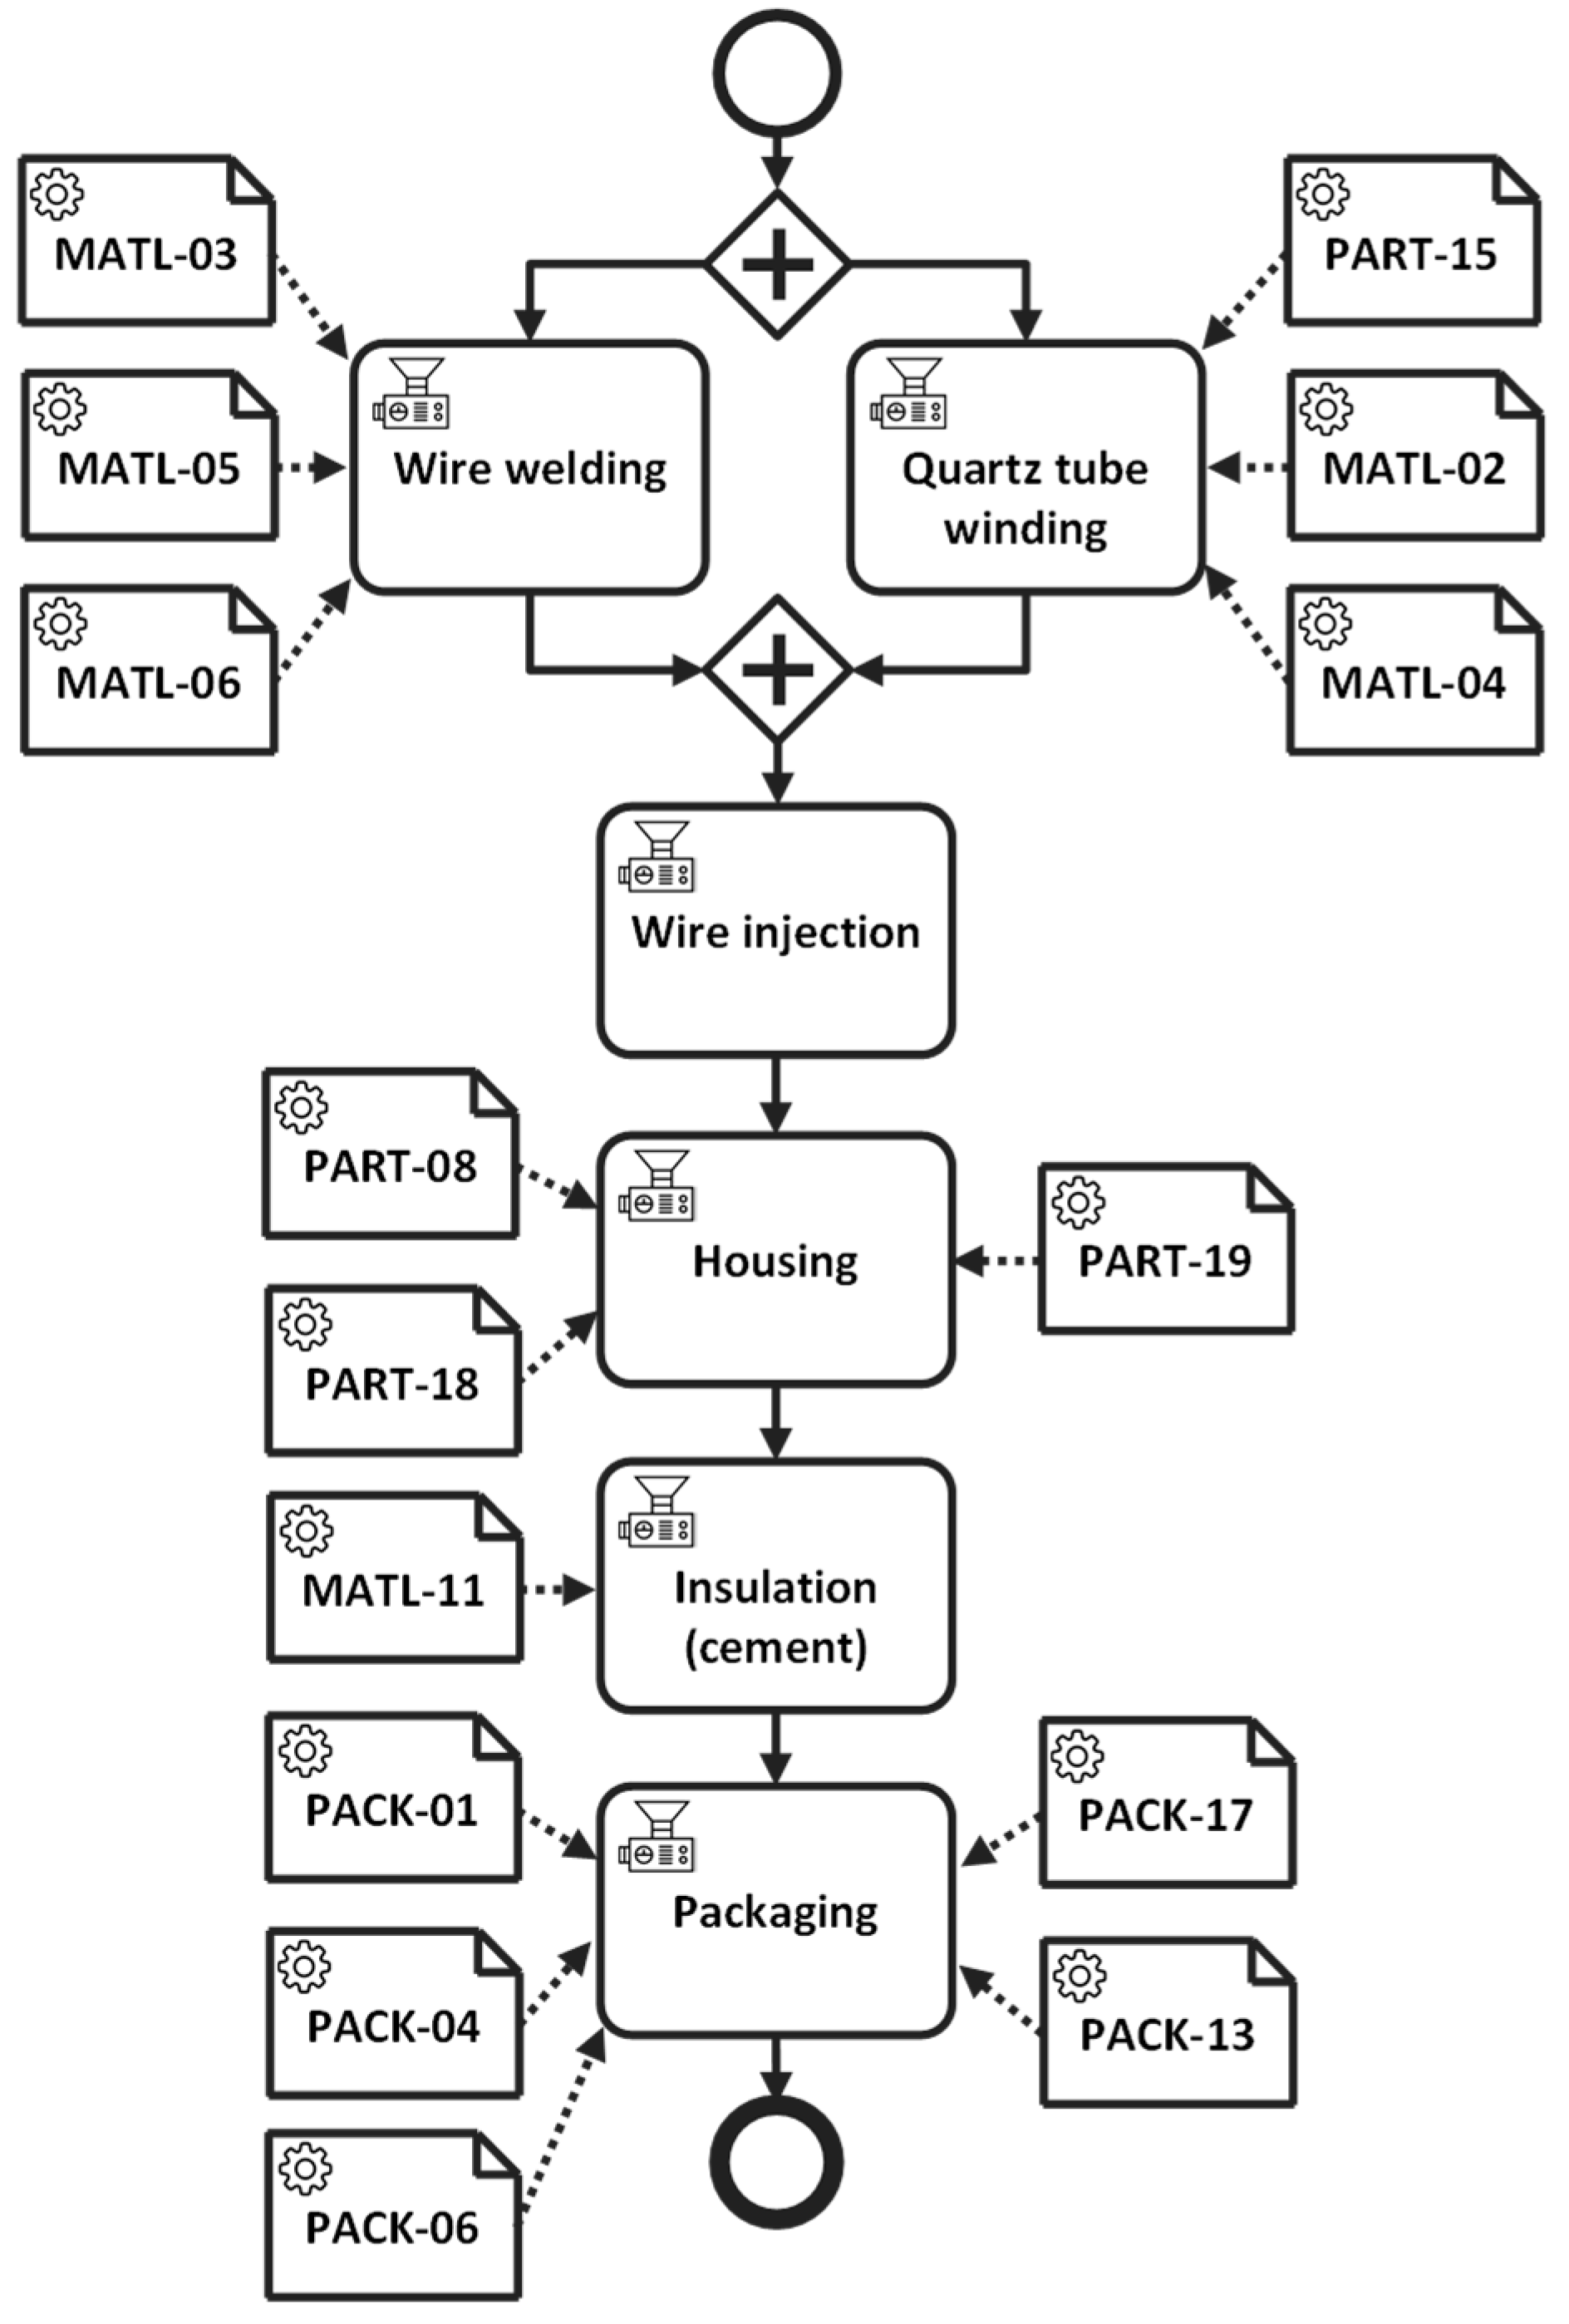
Figure 3 shows a result of the BPMN manufacturing process modeling for the thermocouple product specified as
Table 1.
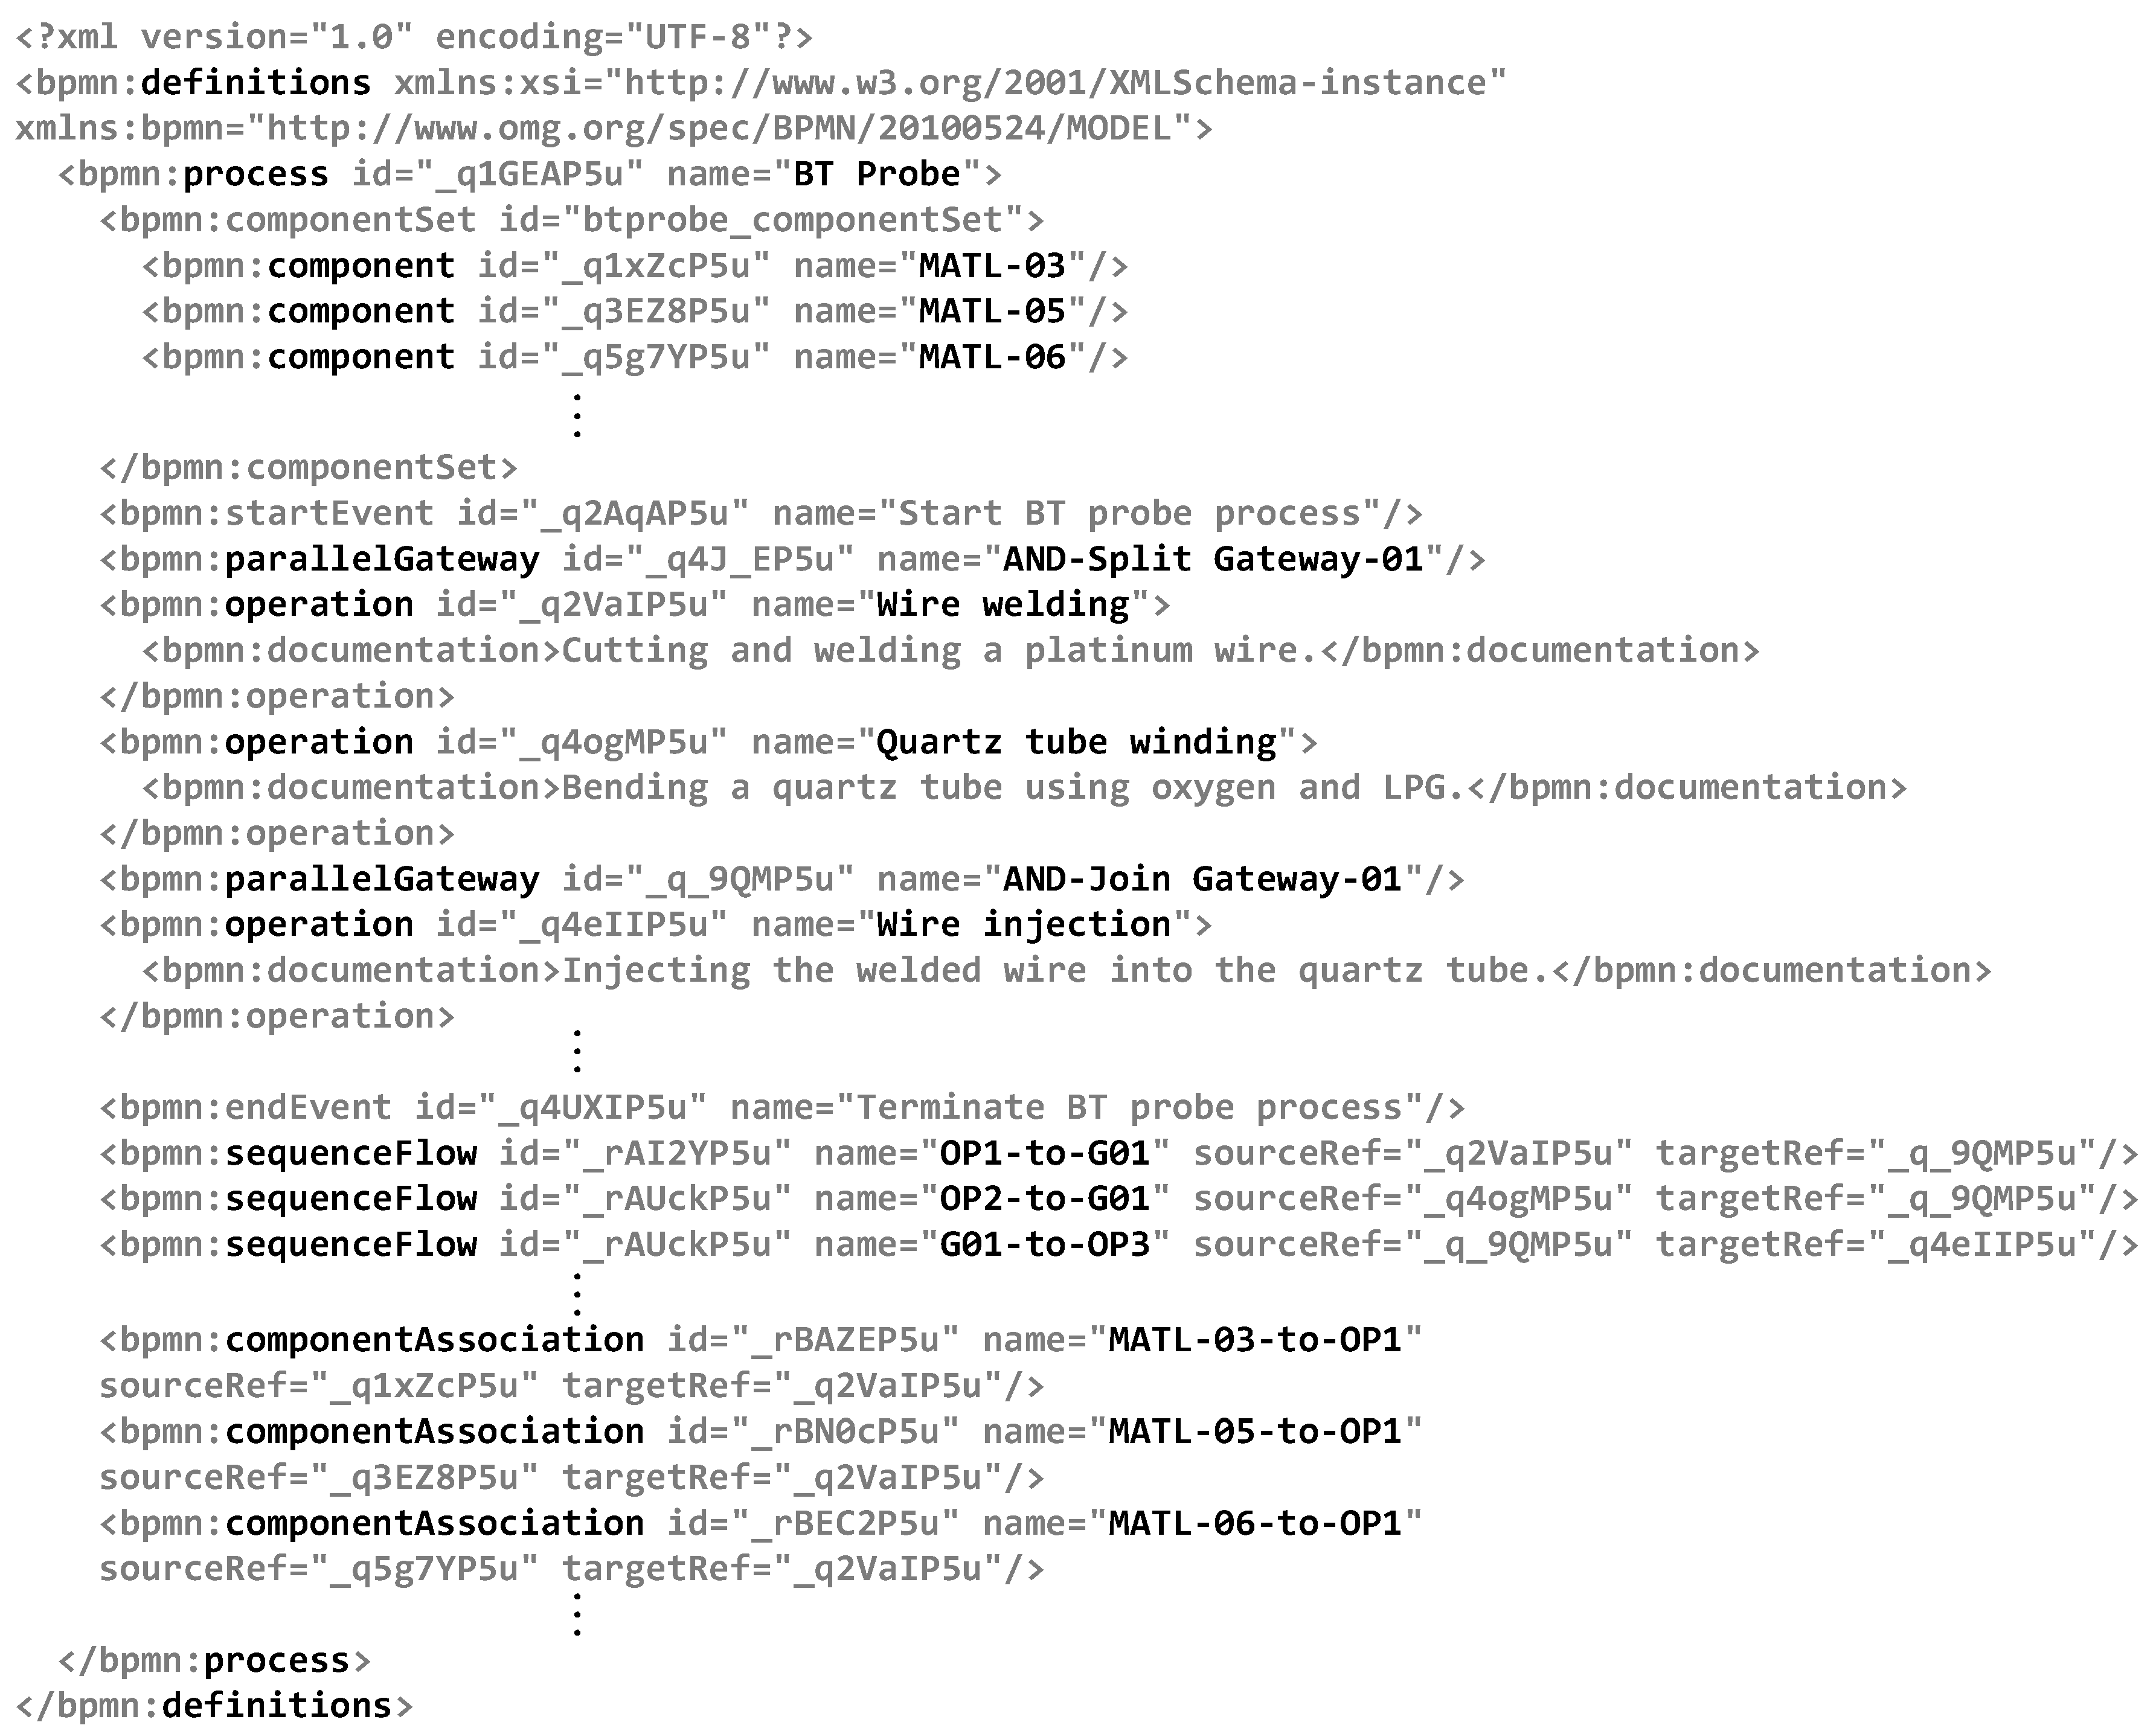
The BPMN model is represented by a visual diagram (see
Figure 3), while at the same time it is converted to a textual form (see
Figure 4) that is executable by BPM systems.
Figure 4 represents fragments of the textual content of the manufacturing process model example. This content represents detailed information, including definitions of operations, components, and connecting objects (e.g., gateway, sequence flow, and component association). When the manufacturing process model is instantiated, the execution engine of the BPM system interprets the information and creates a process instance to execute the manufacturing process with full control.
5. Similarity Measure
Modeled manufacturing processes can be efficiently executed, tracked, and analyzed by the abundant toolsets in the BPM field. In this section, we describe similarity measures for manufacturing process models that serve as a basis of hierarchical clustering. Specifically, in order to capture the characteristics of manufacturing process, we define and explain two sub-types of similarity: operation similarity and structural similarity.
5.1. Preliminaries
We denote a set of manufacturing process models as with indicating the number of manufacturing process models, a set of operations as with indicating the number of operations, and a set of components as with indicating the number of components. We also introduce a mapping function that maps from an operation to input components of which are a subset of total components, where is the operation in the process model .
5.2. Operation Similarity
Although many similarity measures have been proposed for business processes, the manufacturing process has distinguishing features from business processes. In particular, production-related factors—which determine the characteristics of a manufacturing process—must be taken into account in measuring similarities.
The operation similarity we introduce in this paper is a similarity concept based on associations between operations and components that is one of these influential factors. Mostly, a manufacturing operation consumes a group of certain components to produce end products or intermediate components. Based on this feature, operation similarities between operations of the same type in different processes can be quantified. If two operations are the same type but have associations with different set of component types, these two operations are considered to have different characteristics. Mathematically, this similarity is based on the Jaccard coefficient, which is calculated by the division of the number of elements in the intersection set by the number of elements in the union set. Accordingly, the operation similarity between each operation in the process models and is calculated by Equation (1).
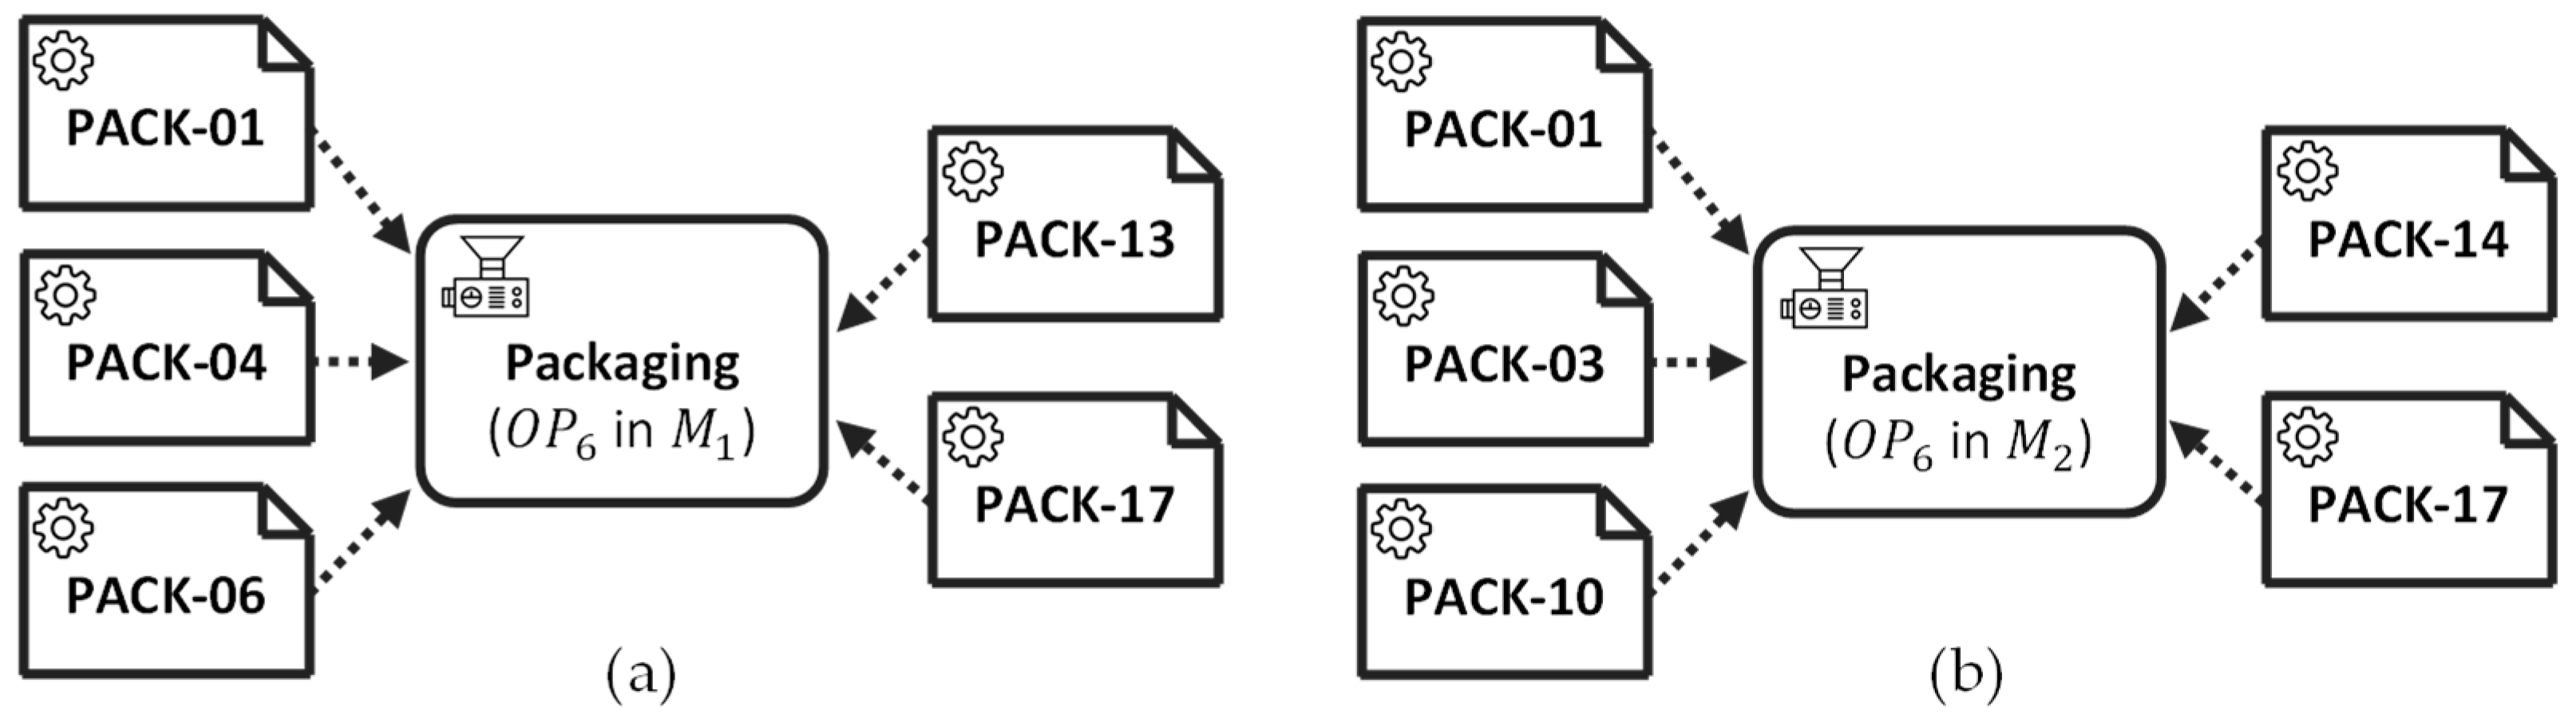
For example, there are two ‘Packaging’ operations (
) of the same type that is included in two different process models
and
as shown in
Figure 5. The ‘Packaging’ operation in
(
Figure 5a) is associated with the set of input components
PACK-01, PACK-04, PACK-06, PACK-13, PACK-17
, that is different from the set of input components of the ‘Packaging’ operation in
(
Figure 5b),
PACK-01, PACK-03, PACK-10, PACK-14, PACK-17
. Accordingly, the operation similarity between these two operations is
.
We can measure operation similarities of the example models by calculating Jaccard coefficients based on the component association relationships of common operations ( and ). In this regard, an operation similarity matrix including operation similarity measurements for all pairs of process models is defined as , where an element represents an operation similarity measure between two operations of for the rth process model pair of the process models and . The index of the process model pair r is calculated by , where .
Based on the above, let
and
be two process models as specified in
Table 3. The operation similarity matrix of the example equals to the row vector represented by
since the example contains only two process models. Measured operation similarities affect the total similarity between two process models.
5.3. Structural Similarity
In this paper, we employ the similarity concepts of the activity vector and transition vector similarities, both are presented in [
3]. We redefine these similarity concepts to fit manufacturing process models and call them structural similarity. As compared to the operation similarity based on the associations between operations and components, the structural similarity focuses on the existence of operations and the control dependency between operations. The structural similarity has two parts: operation vector similarity and transition vector similarity, and these concepts are slightly different from the similarity concepts for business process models in [
3]. The total similarity is measured by putting these two similarities together.
5.3.1. Operation Vector Similarity
A manufacturing process comprises multiple operations that consume certain components and produce intermediate components or end products. Therefore, information indicating whether a specific operation is included in the process is the salient feature that characterizes manufacturing processes in terms of structural aspect. An operation vector is an -dimensional vector, where each element is a binary value (0 or 1) indicating whether the operation is included in the process model .
For example,
Figure 6 represents two operation vectors
and
corresponding process models
and
.
The operation vector similarity is measured based on the Cosine coefficient and operation similarity. Given two operation vectors corresponding to two different manufacturing process models respectively ( and ), the following equation quantifies the similarity between these two operation vectors.
is the measured operation similarity of
between
and
and it is a part of the numerator in the above equation. It implies that even if these vectors equal to each other, according to the operation similarities, the operation vector similarity varies from 1 to 0. For the example of
Figure 6, the measured operation vector similarity is
.
In [
3], activity vectors contain not only the inclusion of activity but also the execution probability that is varied based on the routing patterns in business process models. Fundamentally, there are four basic routing patterns: sequential, parallel, selective, and iterative routings. Among them, the selective routing patterns such as OR-split and XOR-split decide execution probabilities of activities.
On the other hand, in cases of manufacturing processes, we empirically found that the manufacturing processes we investigate are composed of only sequential routings and parallel routings (less frequently), and they intrinsically have no selective and iterative routing patterns. Conventionally, manufacturing processes proceed only according to the predefined operations and their stationary execution orderings without any decision points that cause splitting control-flows patterns. However, in state-of-the-art manufacturing systems (e.g., flexible manufacturing systems), where process routing and machine assignments are flexible to react in case of changes, it is necessary to support the concept of the routing patterns not considered in this paper and supplement the definition of operation vector.
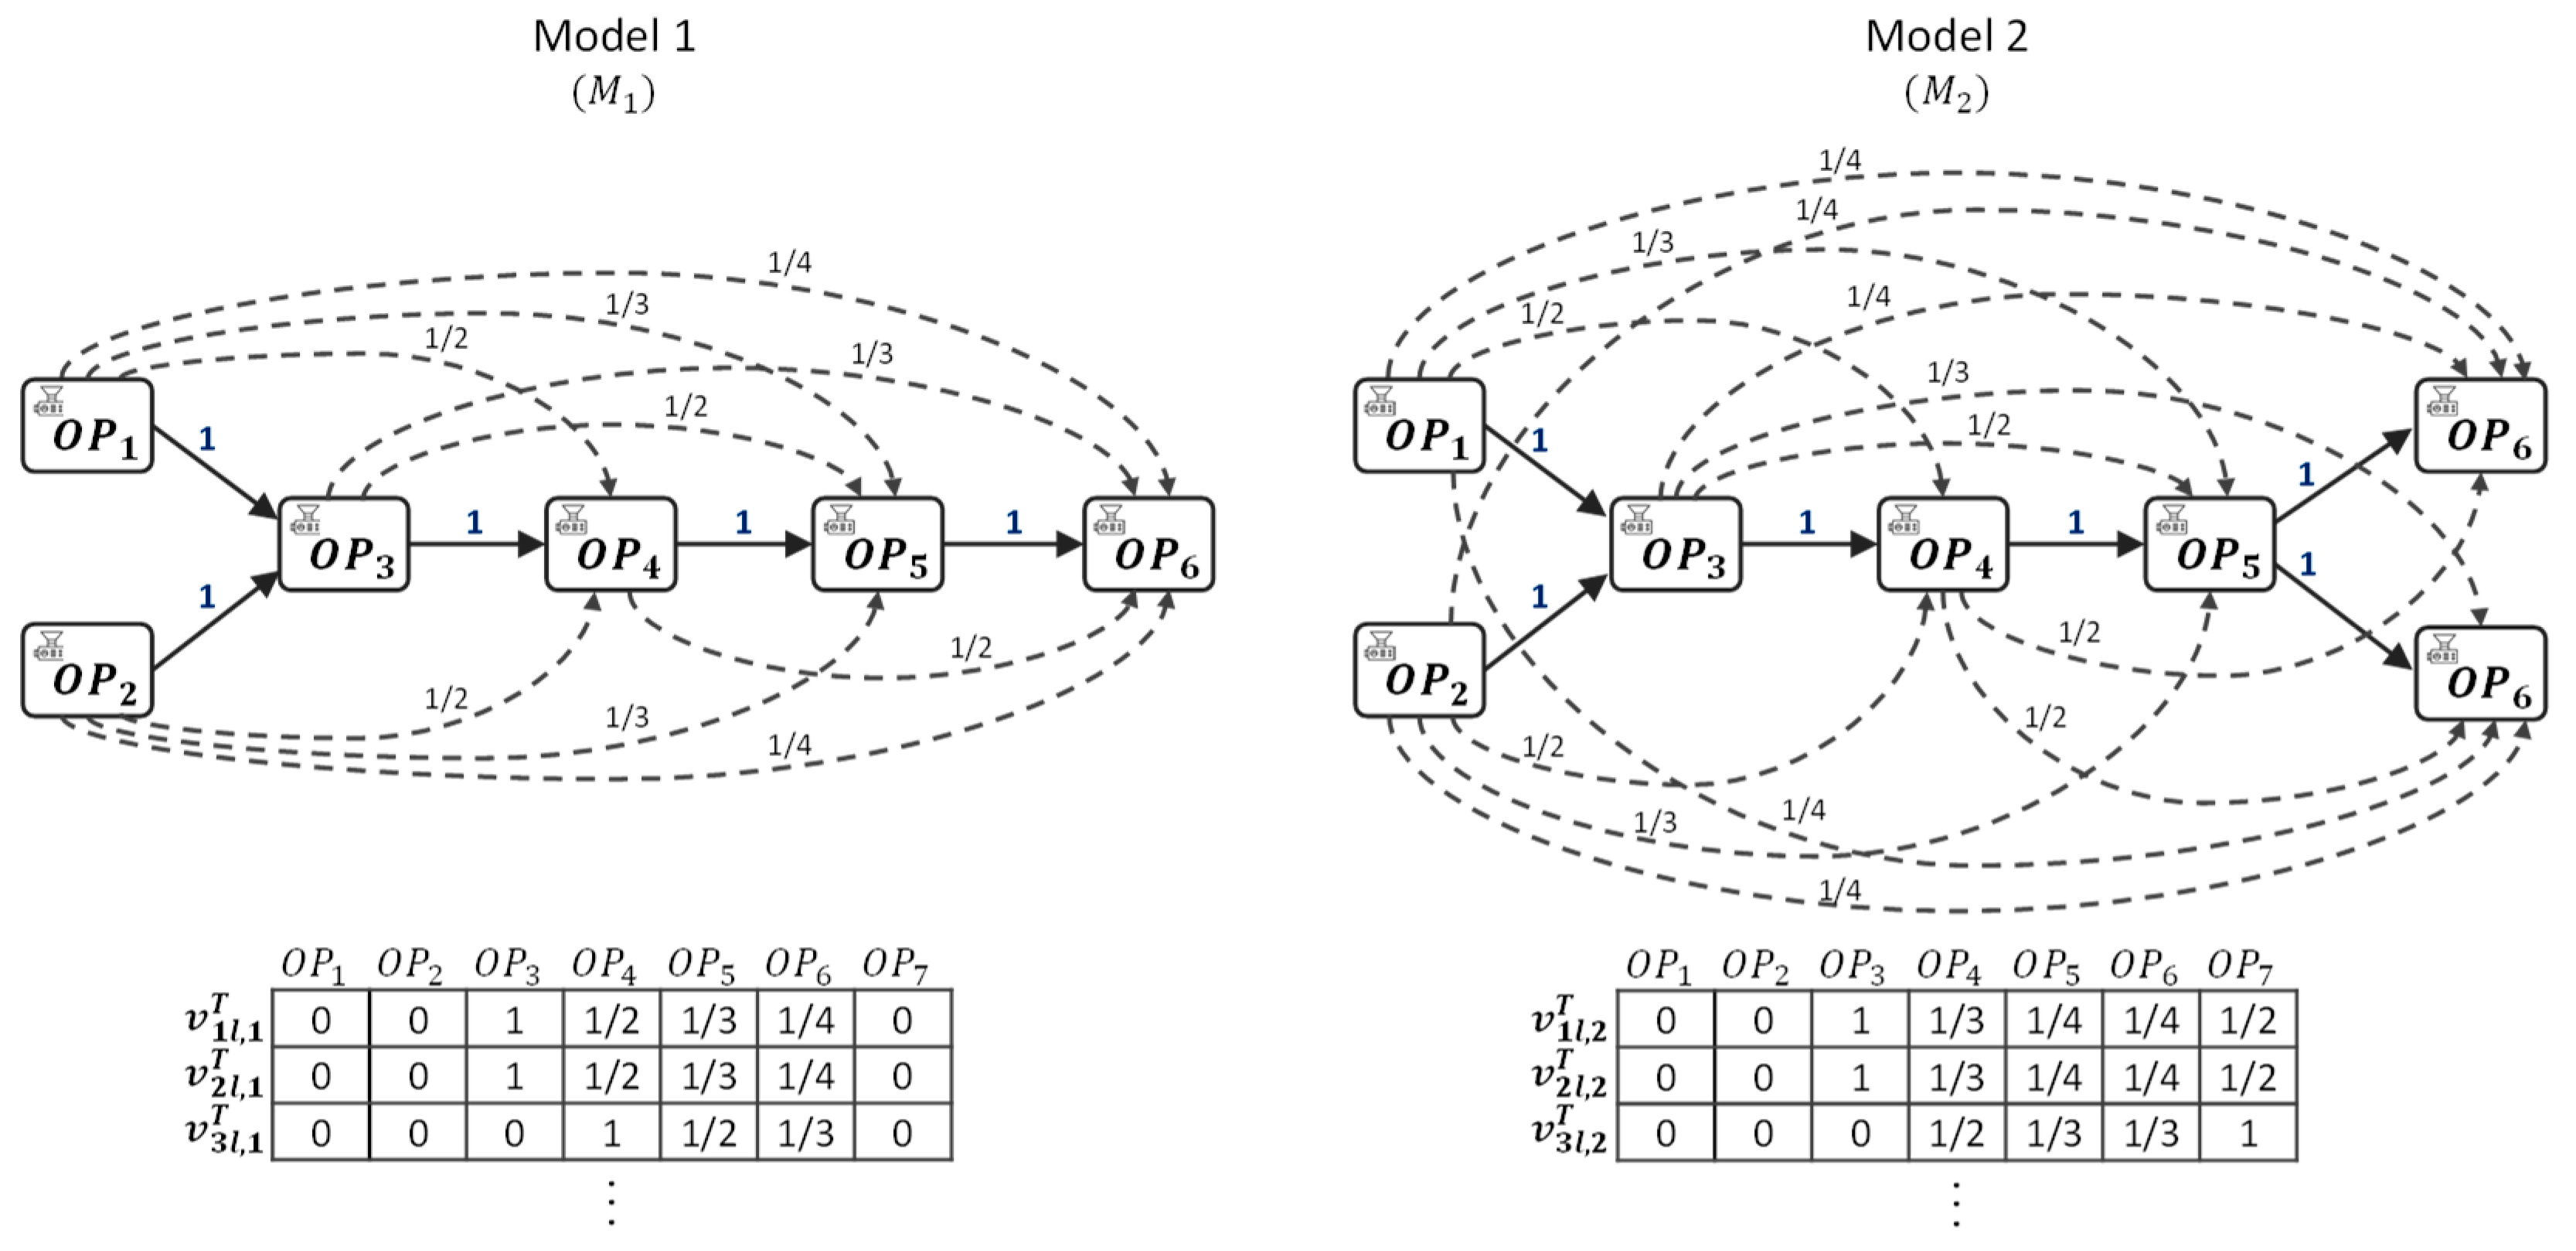
5.3.2. Transition Vector Similarity
The transition is the fundamental property of all classes of process models which is formally represented as a directed acyclic graph. The causality of tasks (including operations) in a process model is established based on transitions between the tasks, and it is a main structural property of process models including manufacturing processes. For example, the starting task in a process model precedes all other tasks including a succeeding task directly following it. Therefore, for manufacturing processes, causal relationships between operations are quantified and weighted through calculations of distance weights, and these are represented as a transition vector.
Let be a transition vector of manufacturing process model . is a row vector containing elements for all pairs of operations, where each element represents a causal relationship between and , measured by the reverse of distance weight between and .
The Cosine coefficient-based transition vector similarity is measured by the following equation.
Based on the above equation, the result of measuring transition vector similarity between
and
represented in
Figure 7 is
.
The total similarity between process models
and
is measured by putting these two vector similarities
and
together and adding a balancing parameter
to blend them.
6. Similarity-Based Hierarchical Clustering
Based on the similarity measures, this section describes a hierarchical clustering algorithm of manufacturing process models. The hierarchical clustering is a useful technique that allows us to build a hierarchy of data clusters from similarities (or dissimilarities) between data. Hierarchical clustering methods generally fall into two types: the agglomerative (bottom-up) approach [
24] and divisive (top-down) approach [
25]. In this paper, we exploit an agglomerative approach, which is more common to the hierarchical clustering than the divisive approach, and we devise a clustering algorithm based on this approach.
6.1. Hierarchical Clustering Algorithm
The agglomerative clustering method builds a hierarchy from the process models being clustered (see the algorithm below). Initially, each model is assigned to its own cluster (line 4–7) and then the clustering algorithm proceeds iteratively, at each step merging the two most similar clusters, continuing until all the models are merged into a single cluster (line 10–25).
| Algorithm: Agglomerative Clustering using Process Similarity |
Input:, Set of manufacturing process models . |
Output:, Hierarchy of clusters . |
1: begin |
2: ; //level of hierarchy |
3: ; |
4: for //initialize a cluster set in level 1 |
5: ; |
6: ; //assign each model to its own cluster |
7: end for |
8: ; |
9: ; //add the cluster set in level 1 to the hierarchy |
10: while //continue until all clusters are merged |
11: ; //a cluster for two clusters to be merged |
12: ; //a variable for the global maximum similarity |
13: for //find a maximum similarity between all pairs of clusters |
14: for where ; |
15: if then //compare the global and local maximum similarities |
16: ; |
17: ; //a set for the merged clusters |
18: ; //update the global maximal similarity |
19: end if |
20: end for |
21: end for |
22: ; //a cluster set in the next level |
23: , where ; //subtract and , and add their merged cluster |
24: ; //add the cluster set in level to the hierarchy |
25: ; //increase the level of hierarchy |
26: return ; |
There are linkage-criteria, each of which determines a way to compute similarities between clusters. The complete-linkage method [
26] takes the lowest similarity value (or farthest distance) between data included in the pair of clusters as a cluster similarity. Conversely, the single-linkage method [
26] merges two clusters based on the highest similarity value (or closest distance) between pairs of clusters. These two representative linkage methods have slight differences in terms of time and space complexities. We accordingly use the single-linkage method that can easily be adapted to agglomerative clustering problems. Therefore, the manufacturing clustering algorithm calculates local maximum similarities, each of which indicates the maximum similarity observed from a pair of model clusters (line 13–18).
In the next step, the two model clusters having the global maximum similarity are selected to be merged. For example, let us three of model clusters , , and at the level . The algorithm calculates local maximum similarities of all pairs of clusters, , , and . In case of the cluster pair of , , a local maximum similarity of this pair can be obtained by finding a maximal value of similarity among all possible pairs of process models, , included in and . If the cluster pair of and has the global maximum similarity, these two clusters are joined into a new cluster for the next level of the hierarchy. In this way, the algorithm merges the two closest clusters at each level and eventually completes the entire hierarchy of clusters.
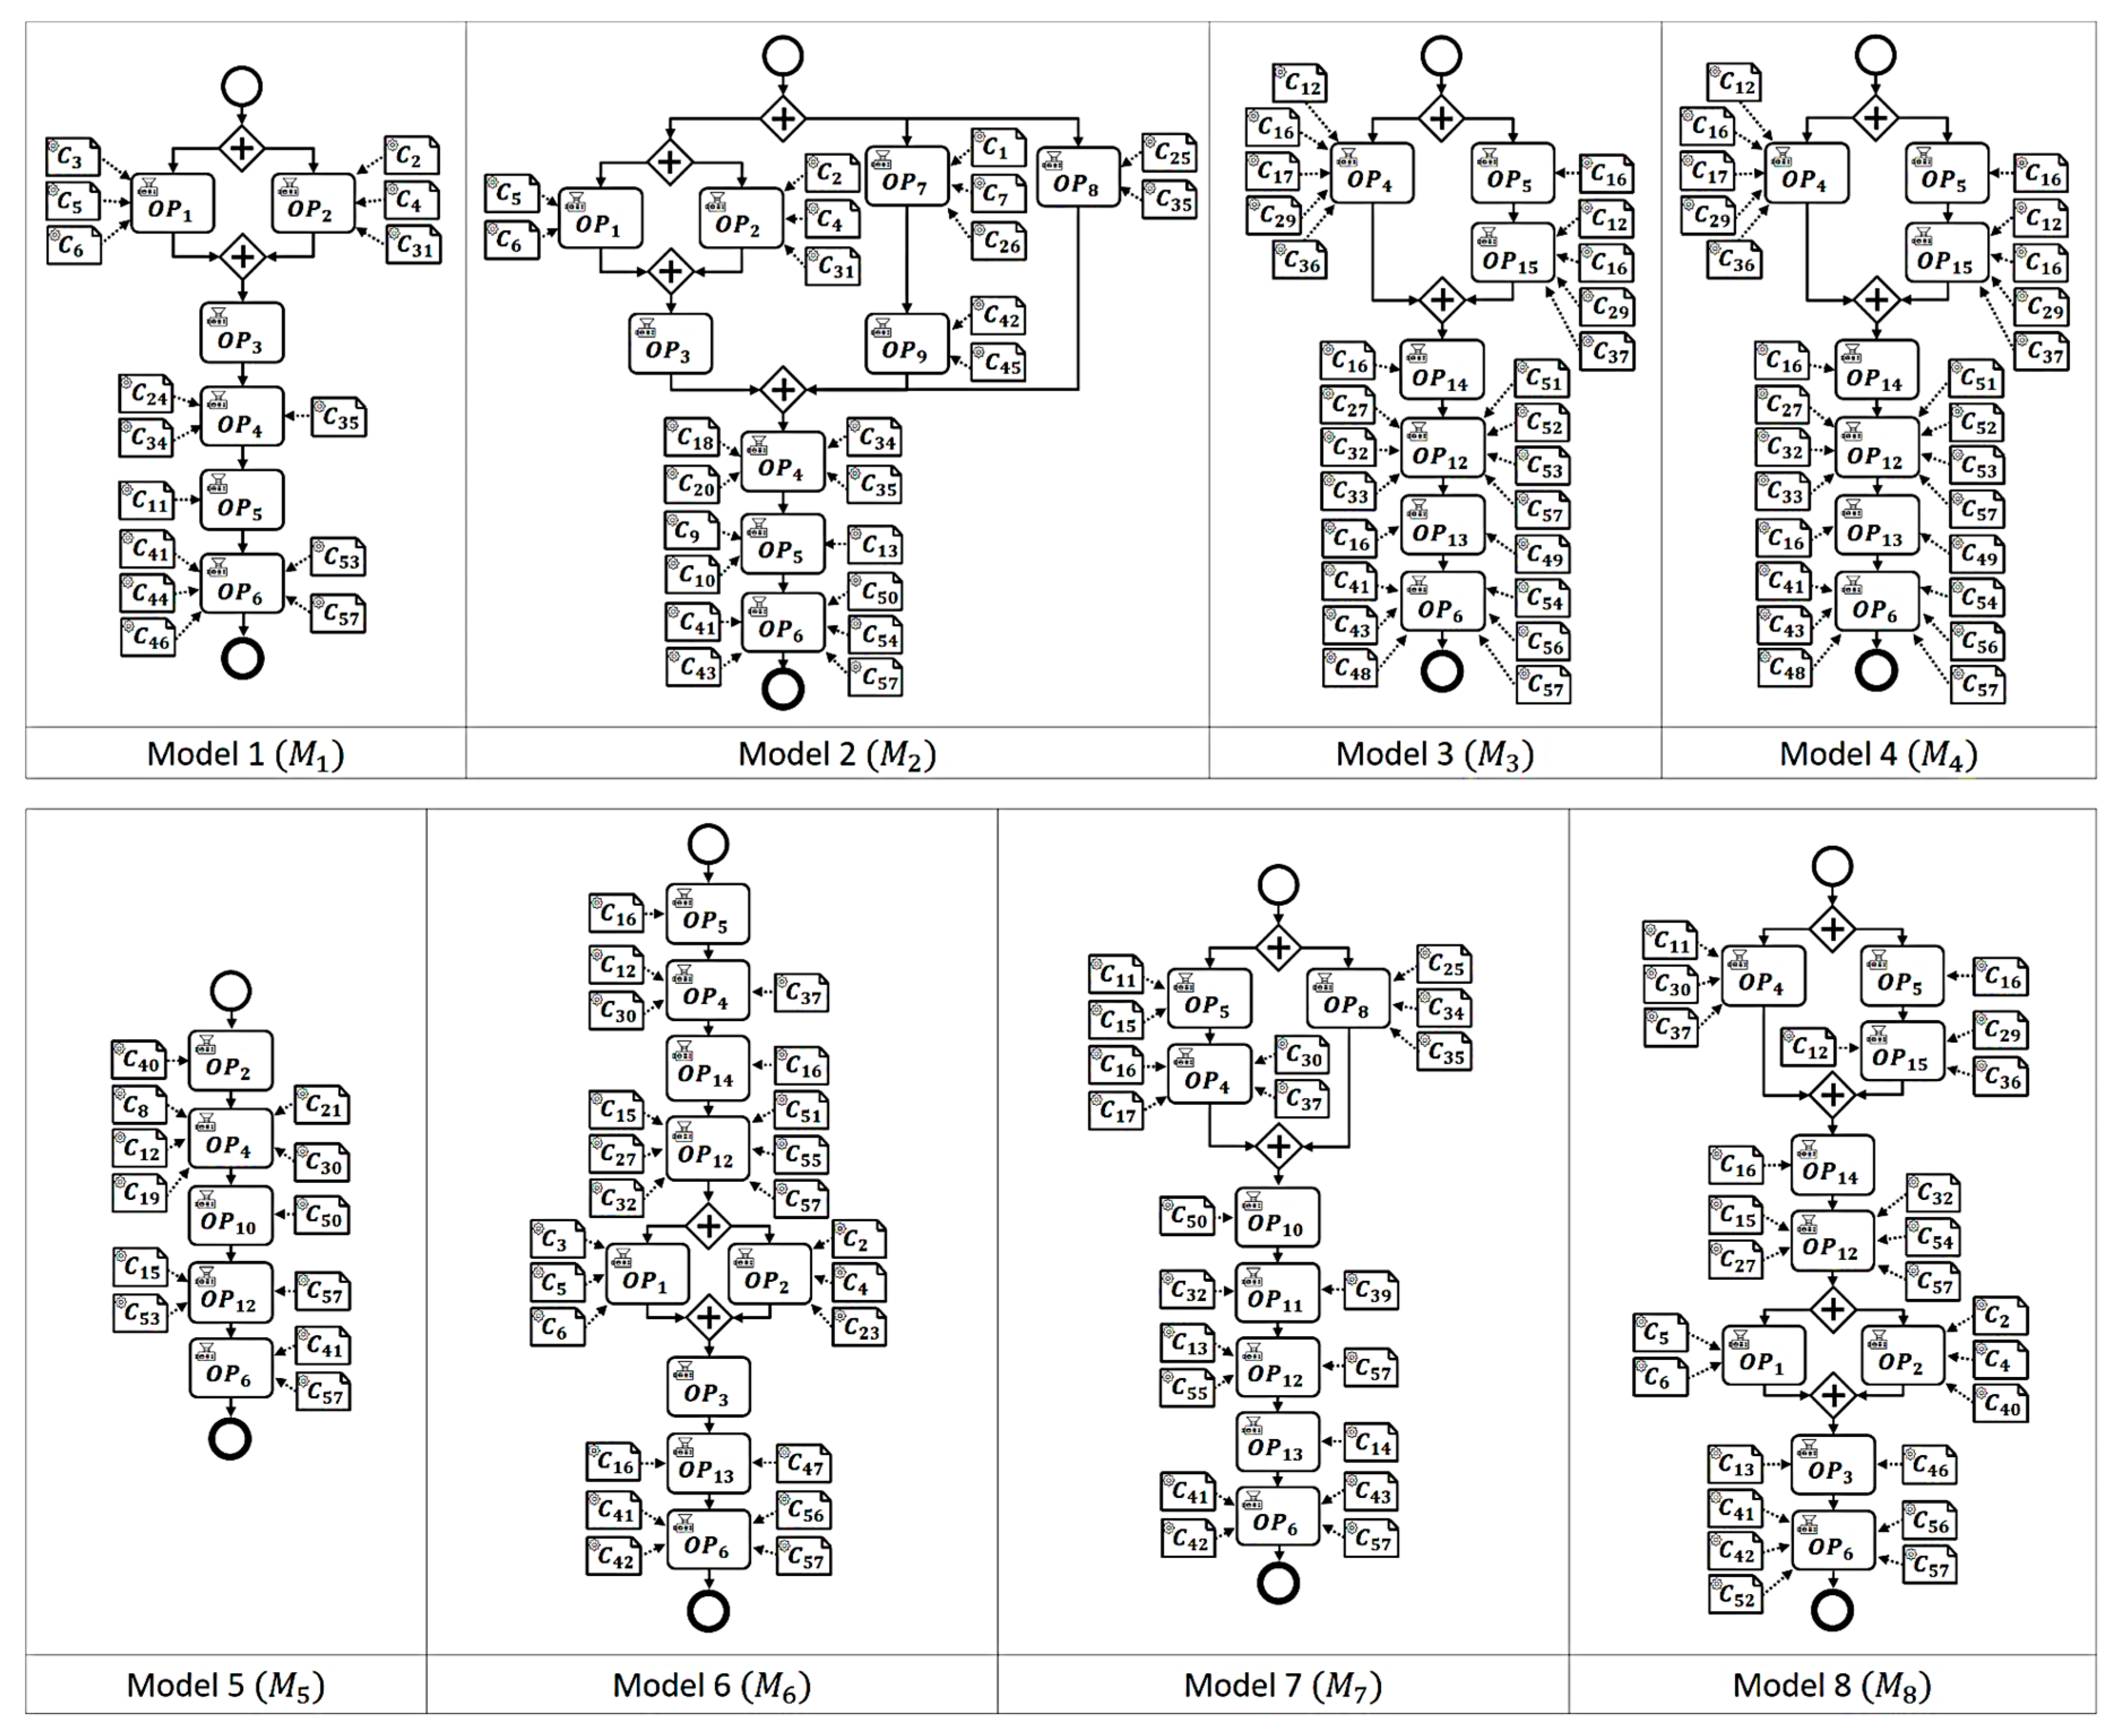
6.2. Running Example
To confirm the applicability of the hierarchical clustering method for manufacturing process models, we present a running example with manufacturing process models. These models are selected models from real-life manufacturing processes for thermocouple probe products (see
Figure 8) and obtained by the BPMN modeling phase from process charts, BOM and BOMO data. The details of the model examples are partially omitted or simplified for the security reasons. Specifically, the running example contains 8 process models (
, 15 operations (
, and 57 components (
. According to the characteristics of the routing patterns of manufacturing processes, all the models have only sequential and parallel routing patterns in terms of control-flow.
At the first step, an operation similarity matrix, , between operations of the same type are calculated based on Equation (1). For example, the operation is the operation of the same manufacturing task that is commonly included in all the process models. For the case of in the model , this operation is associated with the input components, , , , , and . Due to the different operation–component associations from other process models, the measured operation similarities for are
Operation similarities affect the similarities between operation vectors, and
Table 4 and
Table 5 represent the measured operation/transition vector similarities, respectively. The model pair
has the highest operation vector similarity,
, while the two most similar models on the transition vector similarity are
and
with the topmost value of
. Ultimately, the measured total similarities with the balancing parameter
are shown in
Table 6. This result shows that the two most similar models are
and
with the similarity value of
.
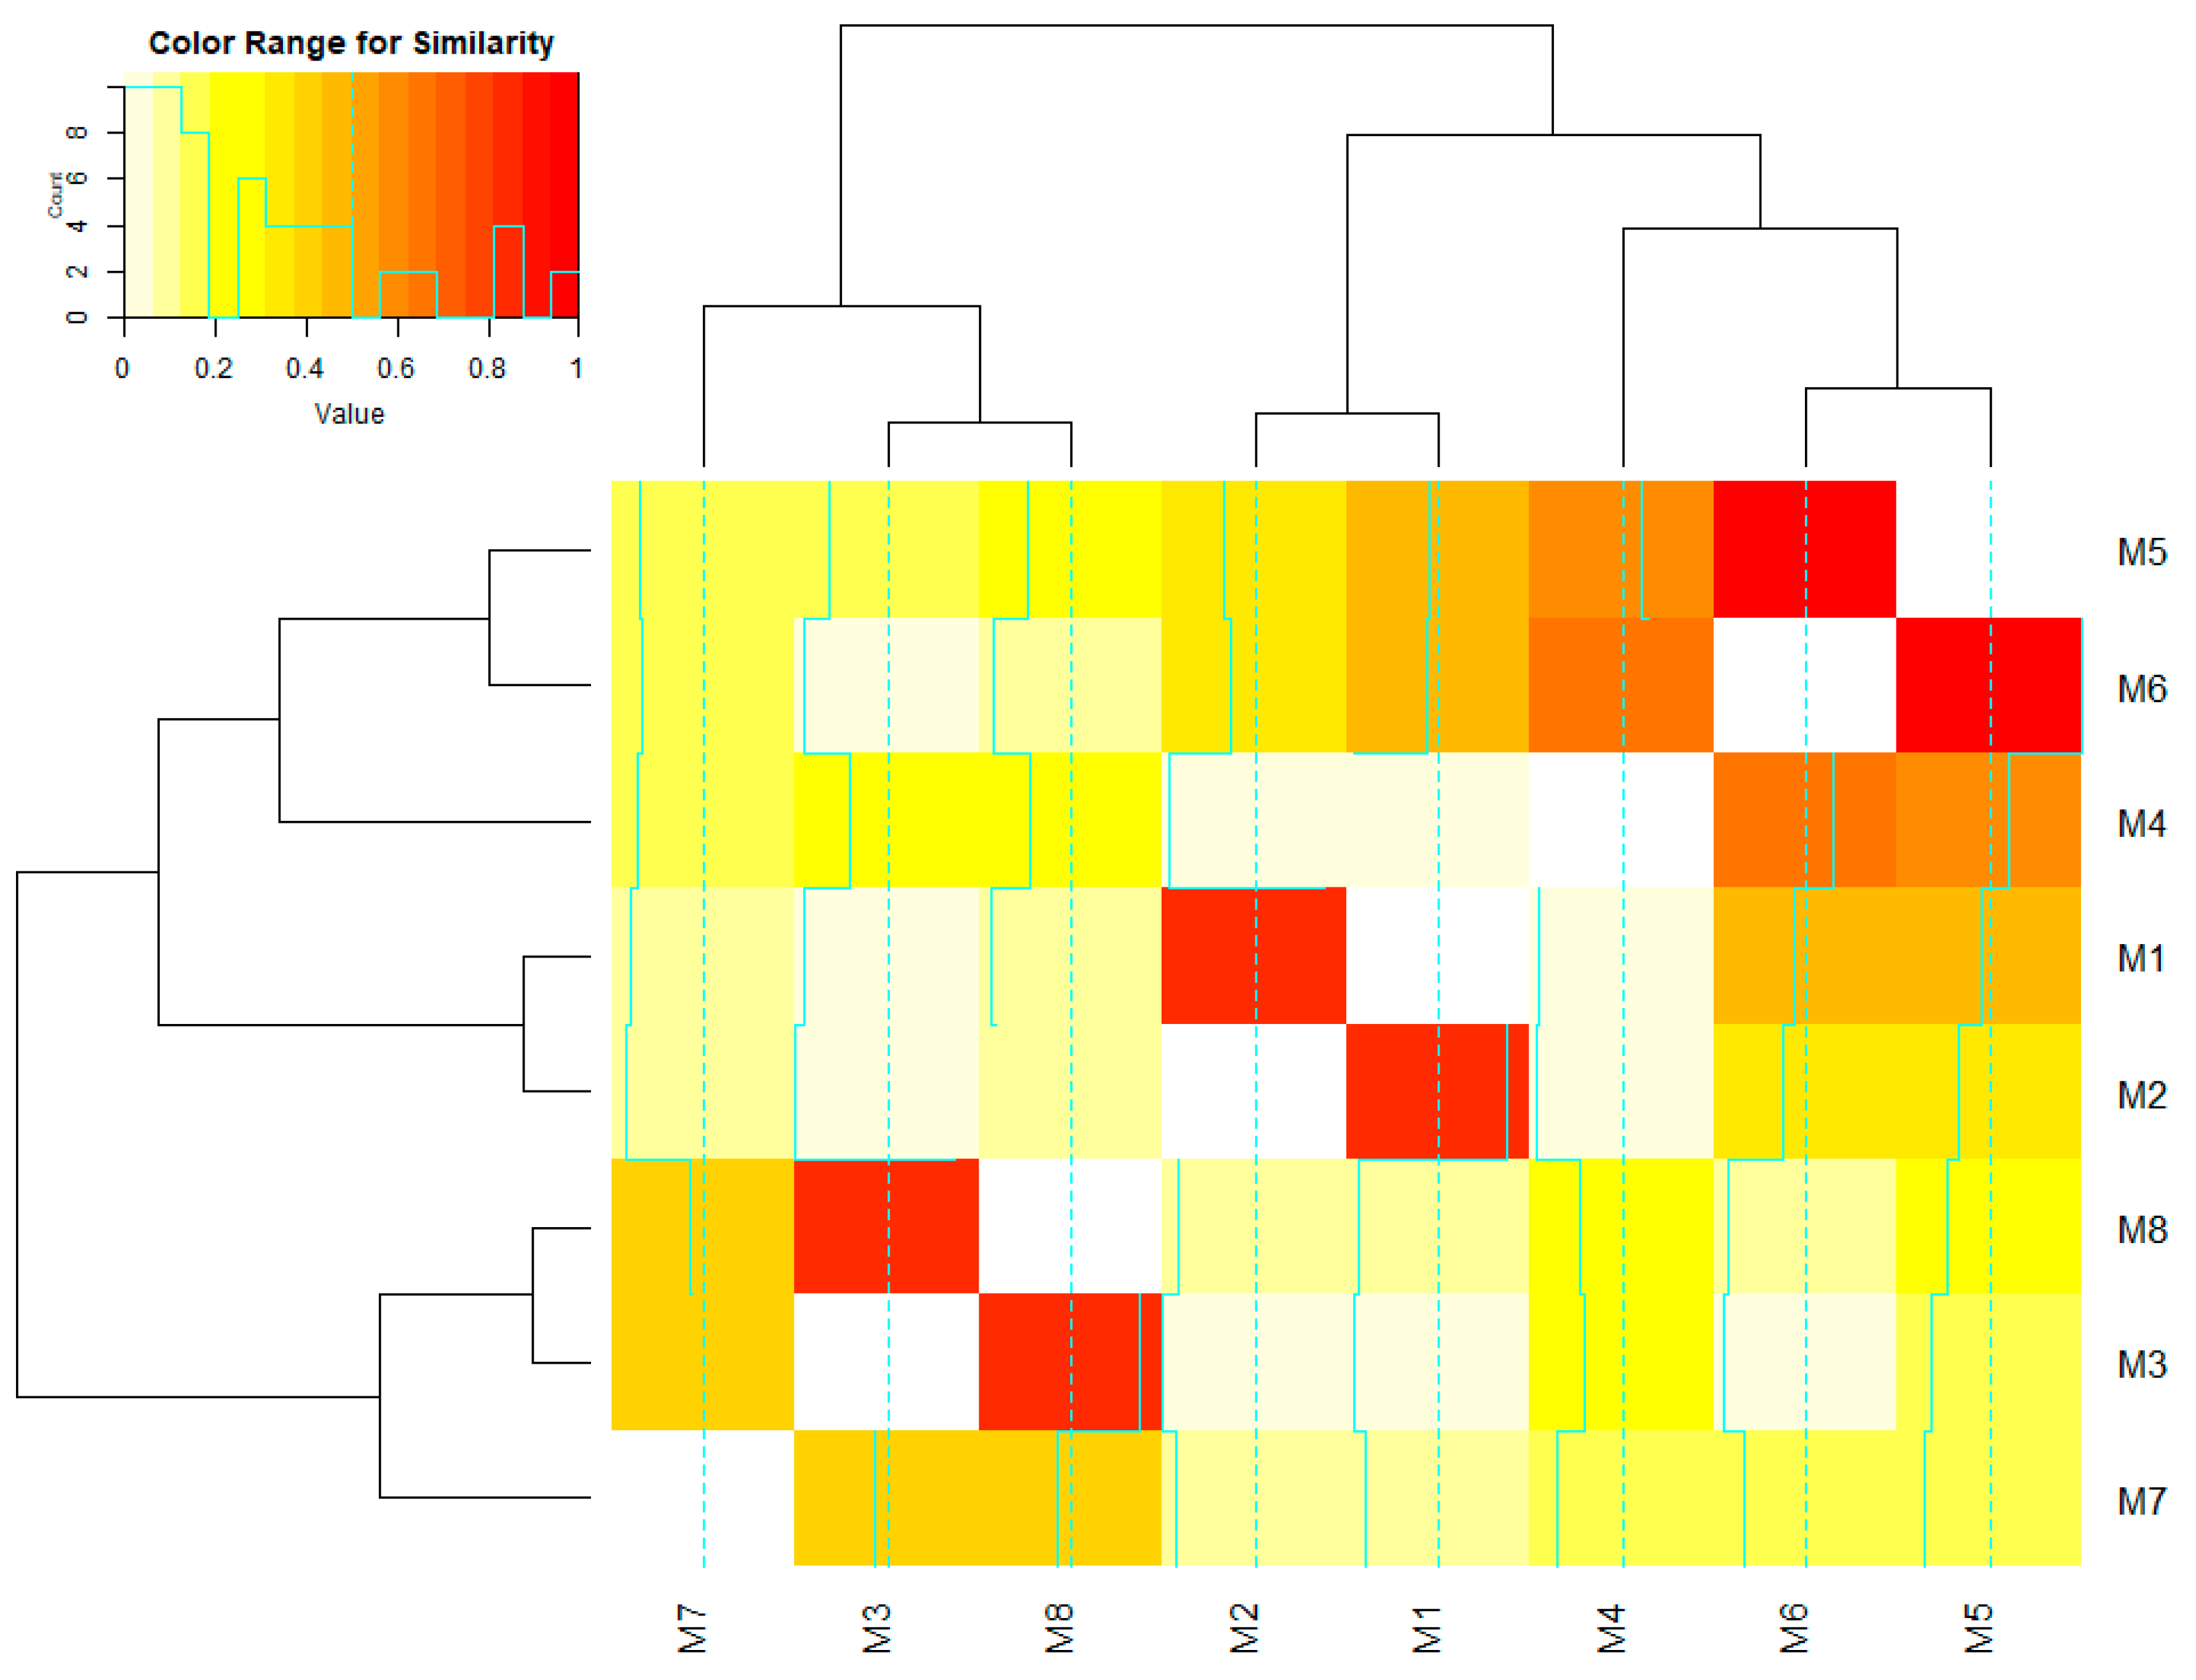
Through the hierarchical clustering, we can expect to build a hierarchy of clusters of manufacturing process models using the measured similarities.
Figure 9 shows the hierarchical clustering result for the running example, visualized as a heat map with dendrograms. As mentioned above, the hierarchical clustering method operates in the bottom-up agglomerative way and finds and merges a pair with the highest similarity (as Equation (9)) among all model pairs at each stage. In addition, by cutting the hierarchy at a certain level, an intended number of clusters can be obtained. This means that it is possible to determine the desired scale in managing manufacturing processes. For example, at the level 5 of the hierarchy, there are four clusters
,
,
, and
. As clusters
and
have the global maximum similarity
resulted from the model pair (
), these two closest clusters are merged, resulting in a total of three clusters
,
, and
at the next level.
7. Conclusions
In the era of Industry 4.0, lots of manufacturing companies tend to have a vast array of manufacturing processes. With the attention of a need of manufacturing process management, this paper proposes a similarity-based hierarchical clustering method for manufacturing processes operated by manufacturing companies where the BPM methodology applied in. Specifically, the contributions of this paper are summarized as two-fold: (1) The manufacturing process modeling with the adaptation of the BPM approach. (2) The similarity measures for such manufacturing process models, and the hierarchical clustering based on the similarity. As the validation result of this work, the applicability of our clustering method was confirmed through the running example including real-life manufacturing processes for thermocouple products. In terms of manufacturing operation management, implications and possible applications are defined as follows:
BPM-compliant manufacturing process modeling—The process modeling standards generally provide visual notations and schema for storing textual information (e.g., BPMN). Thus, manufacturing process models that are visually standardized can help communications among related persons (e.g., process designers and stakeholders), at the same time, the textual information are interpreted by the BPM system to automatically execute manufacturing processes. Therefore, BPM-compliant manufacturing process models can be fully controlled in accordance with the BPM lifecycle. For example, process mining is an enabling technology to monitor status of entire manufacturing processes by analyzing event logs generated from the executions of process models.
Similarity-based hierarchical clustering of manufacturing process models—Clustering techniques aggregate similar objects into the same cluster. Thus, these facilitate group-level operations. For the manufacturing domain, operations in relevance with the production scheduling [
27], resource planning and distribution can be performed effectively, centering on clustered manufacturing process groups. If there exist deficiencies such as bottleneck and low yield, which must be improved in the manufacturing process, the company may consider extending its reengineering task to the whole manufacturing processes of the same cluster from the corresponding single process. For unexpected situations, especially, the alternation operation of a manufacturing process or related resources (e.g., machines, components, and human resources) is also one viable application which is activated by manufacturing process clustering. Assuming a certain company operating a large-scale set of manufacturing processes that is the target environment of this paper, our clustering method can support in designing manufacturing processes for new products. By searching based on the similarity measures, process designers can find a matched process or partial information, valuable to be referred or reused.
In conclusion, we believe that our method will support manufacturing companies so as to design and manage a vast amount of manufacturing processes at a coarser level. However, in order for our method to be more realistic, the following points should be supplemented in a follow-up study. First, the BPMN modeling is insufficient to capture the other important characteristics of the manufacturing process. Machines and human resources are also important entities that steer the manufacturing process, therefore the modeling functionality supporting them should also be added. In addition, we need to review other similarity techniques (e.g., graph similarity) and apply it to make our method more reasonable and effective. Second, this work does not address the evaluation of how the proposed clustering method can contribute to quantitative and qualitative positive effects on manufacturing operation management and engineering problems. Therefore, our future works will cover the following subjects:
Studying process modeling and similarity techniques for better capturing the characteristics of manufacturing processes.
Conducting a case study applying the proposed clustering methods to a large set of real-life manufacturing processes and investigating its effects.
Design and implementation of a system supporting decision-making in various engineering problems based on clustering results.
We are looking into implanting the BPM approach and systems into the manufacturing company of thermocouple products. In a broad sense, the ultimate objective of our future works is to establish realistic applications that provide an effective means supporting BPM-based manufacturing operation management.


