Article

Evaluating the Environmental Performance of Solar Energy Systems Through a Combined Life Cycle Assessment and Cost Analysis

by
Maria Milousi
1,
Manolis Souliotis
2,
George Arampatzis
1 and
Spiros Papaefthimiou
1,*
1
Industrial, Energy and Environmental Systems Laboratory, School of Production Engineering and Management, Technical University of Crete, 73100 Chania, Greece
2
Department of Environmental Engineering, University of Western Macedonia, 50132 Kozani, Greece
*
Author to whom correspondence should be addressed.
Sustainability 2019, 11(9), 2539; https://doi.org/10.3390/su11092539
Submission received: 25 March 2019 / Revised: 20 April 2019 / Accepted: 23 April 2019 / Published: 1 May 2019
(This article belongs to the Special Issue Circular Economy, Ethical Funds, and Engineering Projects)

Abstract

:
The paper presents a holistic evaluation of the energy and environmental profile of two renewable energy technologies: Photovoltaics (thin-film and crystalline) and solar thermal collectors (flat plate and vacuum tube). The selected renewable systems exhibit size scalability (i.e., photovoltaics can vary from small to large scale applications) and can easily fit to residential applications (i.e., solar thermal systems). Various technical variations were considered for each of the studied technologies. The environmental implications were assessed through detailed life cycle assessment (LCA), implemented from raw material extraction through manufacture, use, and end of life of the selected energy systems. The methodological order followed comprises two steps: i. LCA and uncertainty analysis (conducted via SimaPro), and ii. techno-economic assessment (conducted via RETScreen). All studied technologies exhibit environmental impacts during their production phase and through their operation they manage to mitigate significant amounts of emitted greenhouse gases due to the avoided use of fossil fuels. The life cycle carbon footprint was calculated for the studied solar systems and was compared to other energy production technologies (either renewables or fossil-fuel based) and the results fall within the range defined by the global literature. The study showed that the implementation of photovoltaics and solar thermal projects in areas with high average insolation (i.e., Crete, Southern Greece) can be financially viable even in the case of low feed-in-tariffs. The results of the combined evaluation provide insight on choosing the most appropriate technologies from multiple perspectives, including financial and environmental.

1. Introduction

Between 1973 and 2016, world electricity generation increased from 6131 to 24,973 TWh, i.e., 4.07 times, while today almost 81.1% of the world total primary energy supply originates from fossil fuels (i.e., coal, natural gas, and oil). Emissions of greenhouse gases (GHG), such as CO2 and CH4, from energy generation have been assessed in numerous studies, which often play a key role in developing GHG mitigation strategies for the energy sector [1,2].
The renewable power generating capacity exhibited the largest annual increase ever in 2017, with an estimated 178 GW installed world-wide, thus increasing the global total by almost 9% over 2016. Photovoltaics (PV) led the way, accounting for nearly 55% of the newly installed renewable power capacity and practically more PV capacity was added in 2017 than the net additions of fossil fuels and nuclear power combined. The total renewable power capacity more than doubled in the decade of 2007 to 2017, while non-hydropower renewables increased more than six-fold. In addition, investments in the new renewable power capacity (including all hydropower) was three times the investments in the fossil fuel generating capacity, and more than double the investments in fossil fuel and nuclear power generation combined [2,3,4].
Cost for electricity from solar PV and wind is rapidly falling. Record-breaking tenders for solar PV occurred in Argentina, Chile, India, Jordan, Saudi Arabia, and the United Arab Emirates, with bids in some markets below 0.03 $/kWh. Parallel developments in the wind power sector saw record low bids in several countries, including Chile, India, Mexico, and Morocco. Record low bids in offshore wind power tenders in Denmark and the Netherlands brought Europe′s industry closer to its goal to produce offshore wind power cheaper than coal by 2025 [1,2,5,6].
Global voices for the decarbonization of the energy sector continuously increase, and thus renewables are expected to become the backbone of future power systems [3,4,6]. Typically, in such analyses, the GHG emissions are estimated without accounting for the impacts of the complete life cycle of the studied energy production systems. Life cycle assessment (LCA), carbon footprinting, and other GHG accounting approaches are commonly used for decision support. In LCA, potential environmental impacts associated with the life cycle of a product and/or service are assessed based on a life cycle inventory (LCI), which includes relevant input/output data and emissions compiled for the system associated with the product/service in question. The comprehensive scope of LCA is useful in avoiding problem shifting from one life cycle phase to another, from one region to another, or from one environmental problem to another [7,8]. Although the carbon footprint may have more appeal than LCA due to the simplicity of the approach, carbon footprints involve only a single indicator and thus this may result in oversimplification. By optimizing the system performance based only on GHG emissions, new environmental burdens may be introduced from other environmental emissions (e.g., NOx and SO2). A holistic or system-level perspective is therefore essential in the assessment, and the range of emission types included in a study may critically affect the outcome [9,10,11].
LCA is the methodology to be used when comparing the environmental performance (strengths and weaknesses) of different energy technologies, among them renewable systems. The idea behind a life cycle perspective in the context of power generation is that the environmental impacts of electricity are not only due to the power production process itself, but also originate from the production chains of installed components, materials used, energy carriers, and necessary services. Through an LCA analysis, a product is investigated throughout the entire life cycle (“Cradle-to-Grave”) [12,13,14].
The main scope and motivation of the paper is to utilize detailed LCA and techno-economic results and present a holistic evaluation of the energy, environmental, and economic profile of two renewable energy technologies, photovoltaics and solar thermal collectors, both installed in a non-interconnected island with high average insolation. The former technology has been chosen as it can be employed from small scale applications to large power plants, while solar thermal systems are mainly focused to residential applications, but can play an important role in energy saving schemes as they practically deal with domestic hot water production and can cover significant thermal needs. Various technical variations will be presented for each of the studied technologies. For the evaluation of each of the renewable energy systems studied in the paper, the methodological approach followed comprises two steps: i. LCA and uncertainty analysis (conducted via SimaPro [15]) and ii. techno-economic assessment (conducted via RETScreen [16]). The paper employs the most recent LCA data and techno-economic parameters, thus presenting a complete, credible, and updated evaluation of the studied solar energy based technologies.

2. Materials and Methods

Renewable energy sources (i.e., biomass, hydropower, shallow and deep geothermal, solar, wind, and marine energies) are considered to be those that are primary, clean, low risk, and inexhaustible [5,6]. Sustainable development requires methods and tools to measure and compare the environmental impacts of human activities for various products. In order to understand where net savings in GHG emissions can be accomplished and the magnitude of the relevant opportunities, renewable energy systems should be analyzed and compared with the energy systems they would replace. The LCA methodology has been widely used to study the environmental burdens of energy produced from various renewable and non-renewable sources [17,18]. An LCA study is generally carried out by iterating four distinct phases [13]:
Step 1. Goal and scope definition. During the first step, the goal and scope of the study are defined as well as the selection of the functional unit (FU) and the system′s boundaries. The meaningful selection and definition of system boundaries and the system′s analysis are important tasks within every LCA. The functional unit relates to the product function rather than a particular physical quantity and is typically time-bound.
Step 2. Inventory analysis (LCI). In the second step, a life cycle inventory analysis, of relevant energy and material inputs and environmental releases, is made up identifying and quantifying inputs and outputs at every stage of the life cycle. In addition, the characteristics of data collection and calculation procedures are defined.
Step 3. Life Cycle Impact assessment (LCIA). This is the phase of LCA, with particular respect to sustainability assessment. During the impact assessment step, the elaboration of which has deliberately been left open by ISO (International Organization for Standardization) guidelines, the potential environmental impacts associated with identified inputs and releases are categorized in different midpoint and endpoint impact categories. LCIA translates emissions and resource extractions into a limited number of environmental impact scores by means of so-called characterization factors. There are two mainstream ways to derive these factors, i.e., at the midpoint level and at the endpoint level. Midpoint indicators focus on single environmental problems, for example, climate change or acidification. Endpoint indicators show the environmental impact on three higher aggregation levels, being the (1) effect on human health, (2) biodiversity, and (3) resource scarcity.
Step 4. Interpretation of results. In the last step, the results of the inventory analysis and the impact assessment should be interpreted and combined, to help decision makers make a more informative and sound decision. Furthermore, a sensitivity analysis is performed to validate the consistency of the results.
Depending on the scope of the LCA study, the life stages of energy production systems may include all or part of: i. Fuel consumption (i.e., to also account for the non-consumable portion of the produced fuel) and transportation to the plant, ii. facility construction, iii. facility operation and maintenance, and iv. dismantling. In this section, we present the technical details for the two studied renewable energy systems: i. Photovoltaics and ii. solar thermal collectors.

2.1. Photovoltaics

Photovoltaics based power generation employs solar panels to produce power on both a standalone basis using batteries or on a grid-connected basis using an inverter and electrical utility lines. Currently, commercially available PV modules are considered as not highly efficient (with typical efficiencies of ~16%), and thus there are intense research and development efforts for the development of new technological solutions to the challenge of producing commercial PV with increased efficiencies [10,19]. The rapid decline in installed costs (prices per installed MW have fallen by about 60% since 2008) has significantly improved the economic viability of PV around the world, with the global installed capacity escalated at 402 GW in 2017 compared to 8 GW back in 2007 [2,20]. Most of this growth has come from grid connected systems, though the off-grid market has also continued to expand [21]. Governmental subsidies and other supporting schemes were the initial driving force that allowed the market penetration of PV systems, but nowadays PV grid parity is a fast approaching reality in many countries [20,22].
For this research paper, four PV technologies will be evaluated: i. Single crystalline silicon (sc-Si), ii. multi-crystalline silicon (mc-Si), iii. Copper-Indium-diSelenide (CIS), and iv. amorphous silicon (a-Si). A limited number of comprehensive life cycle analyses based on industrial data for PV systems are available in the literature [23,24,25,26] and refer primarily to sc-Si and a-Si cells. Detailed technical information on PV module efficiencies are provided in Table 1.
Thin-film technologies are less expensive overall in the production stages versus crystalline silicon because the materials and processes to manufacture the wafer-based silicon are far more expensive than producing thin-film based technologies. The main advantages of thin films are not their conversion efficiency, but their capital cost and their relatively low consumption of raw materials, high automation, and production efficiency. Thin films are also easier from integration on residential and commercial infrastructure. The current drawbacks are that the lower conversion efficiencies require more modules, which require more roof top space, which is limited on residential and commercial properties.

2.2. Solar Thermal Collectors

There have been a limited number of life cycle analyses looking specifically at solar thermal technologies. Emissions of GHGs (g CO2-eq/kWh) have been estimated for central receiver systems between 36.2 and 43, while emissions from parabolic trough technologies have been estimated to 196 g CO2-eq/kWh [27,28,29].
The most commonly used types of solar thermal collectors are the flat plate and the evacuated (or vacuum) tubes systems. Flat plate collectors consist of airtight boxes fitted with a glass (or other transparent material) cover, all installed on a suitable frame. They typically operate via the thermosyphonic effect and thus they need no electricity for circulation of the heat transfer fluid. The typical absorber area for residential applications ranges between 3 and 4 m2, while a storage tank with a capacity between 150 and 180 L is capable of meeting the hot water demands for a family. An auxiliary electric immersion heater and/or a heat exchanger, for central heating assisted hot water production, are used in winter during periods of low solar insolation. Vacuum tube collectors are more advanced systems employing evacuated sealed glass tubes containing the solar radiation absorbers in order to minimize heat losses. These collectors exhibit a significantly higher performance compared to their flat plate counterparts, but at higher cost and they typically fit in more demanding applications (i.e., northern climates and lower ambient temperatures).

3. Results and Discussion

In order to validate the environmental impacts a Cradle-to-Grave LCA was implemented for each of the studied renewable technology. For this purpose, SimaPro 8.5 with ecoinvent version 3.4 was employed, while ReCiPe 2016 Midpoint Hierarchist (H) was chosen as the LCIA method in this study, as it provides the most extensive set of midpoint impact categories [15,30].
ReCiPe 2016 is the successor of the Eco-indicator and CML-IA. The purpose at the beginning of its development was to integrate the “problem oriented approach” of CML-IA and the “damage oriented approach” of Eco-indicator. The “problem oriented approach” defines the impact categories at a midpoint level. The uncertainty of the results at this point is relatively low. The drawback of this solution is that it leads to many different impact categories which makes the drawing of conclusions with the obtained results complex. On the other hand, the damage oriented approach of Eco-indicator results in only three impact categories, which makes the interpretation of the results easier. However, the uncertainty in the results is higher. ReCiPe implements both strategies and has both midpoint (problem oriented) and endpoint (damage oriented) impact categories.
Midpoint level indicators are direct measurements of the impacts arising from the considered phenomena. A total of 18 physical quantities were computed from the LCI results, providing a quantitative description of the single drivers of the environmental impact associated with the study. These include soil acidification (measured in kg SO2-eq), the emission of GHGs (measured in kg CO2-eq), ozone depletion (measured in kg CFC11-eq), and so forth.
The hierarchist perspective was chosen as it is the most balanced model based on common policy principles over a common time frame, compared to the individualistic and egalitarian perspectives, which consider a short and a long time frame, respectively [31].
Uncertainty analysis focuses on the extent of uncertainties produced in model outputs due to the existed uncertainties in input values. One of the several methods that propagate uncertainties is Monte Carlo simulation. This method makes use of an algorithm capable of producing a series of random numbers, within the uncertainty value of every input and output taken into account in the scenarios created, for which it assumes a lognormal distribution, with a certain confidence interval. For the studied systems in this paper, a Monte Carlo analysis was performed using SimaPro 8.5 software for each scenario and impact category.

3.1. Photovoltaics

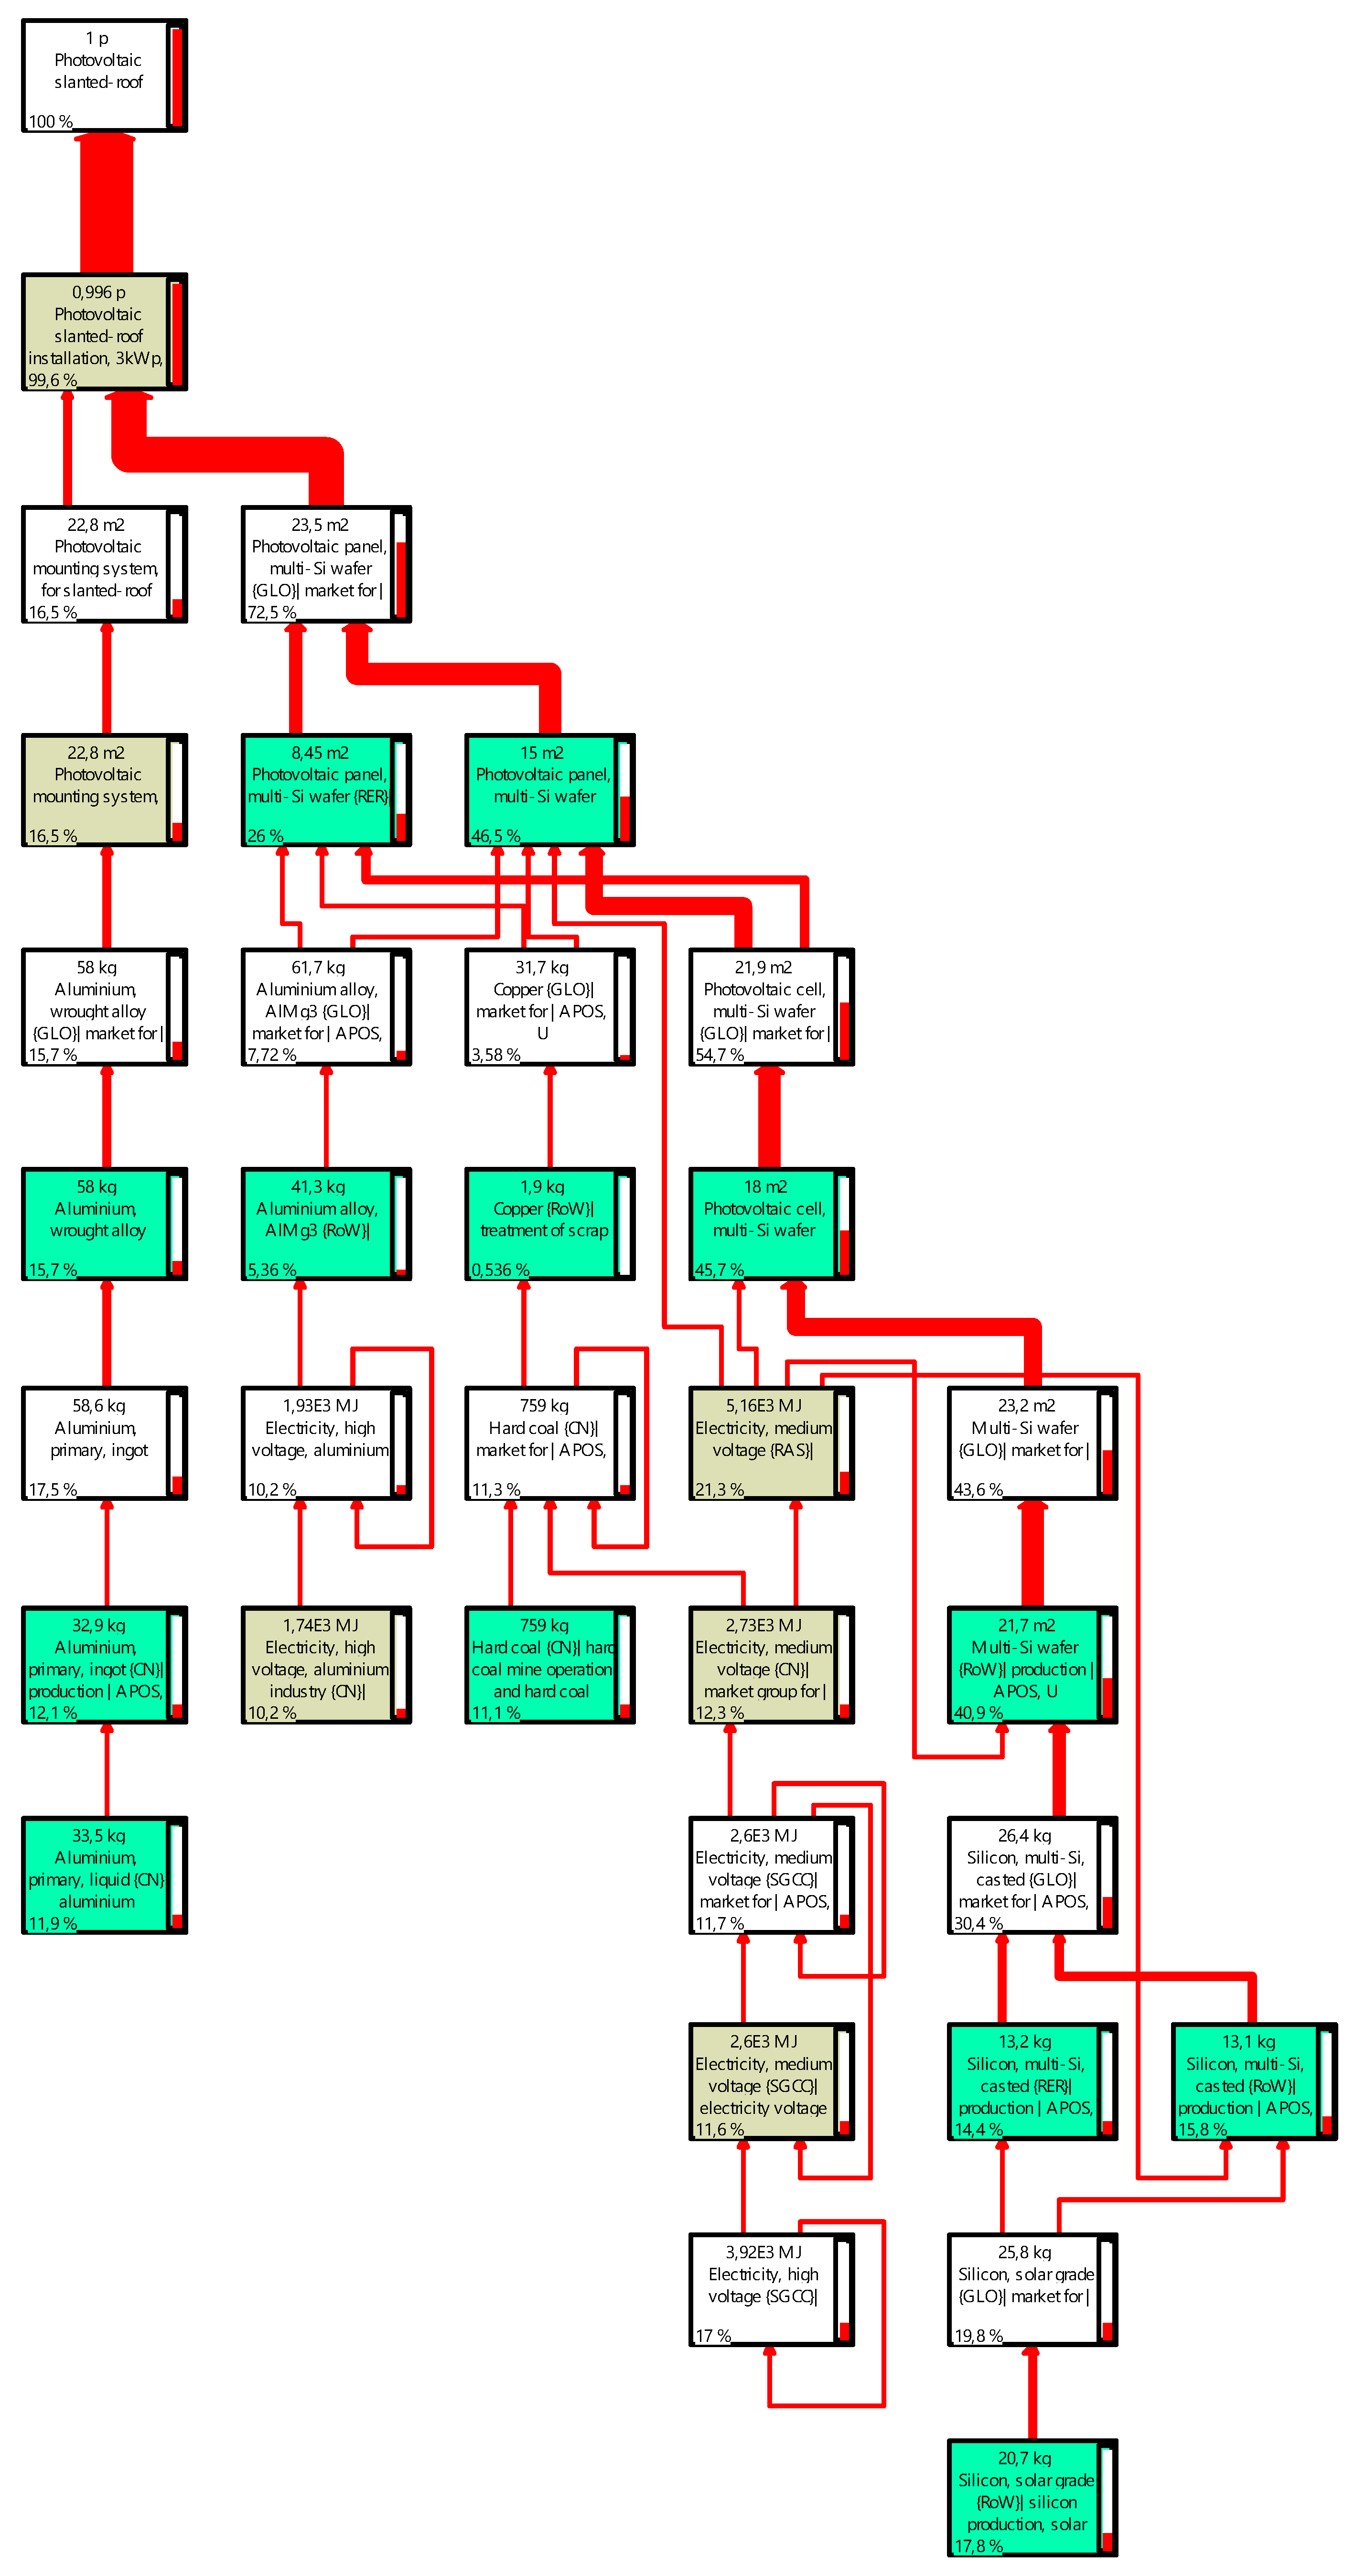
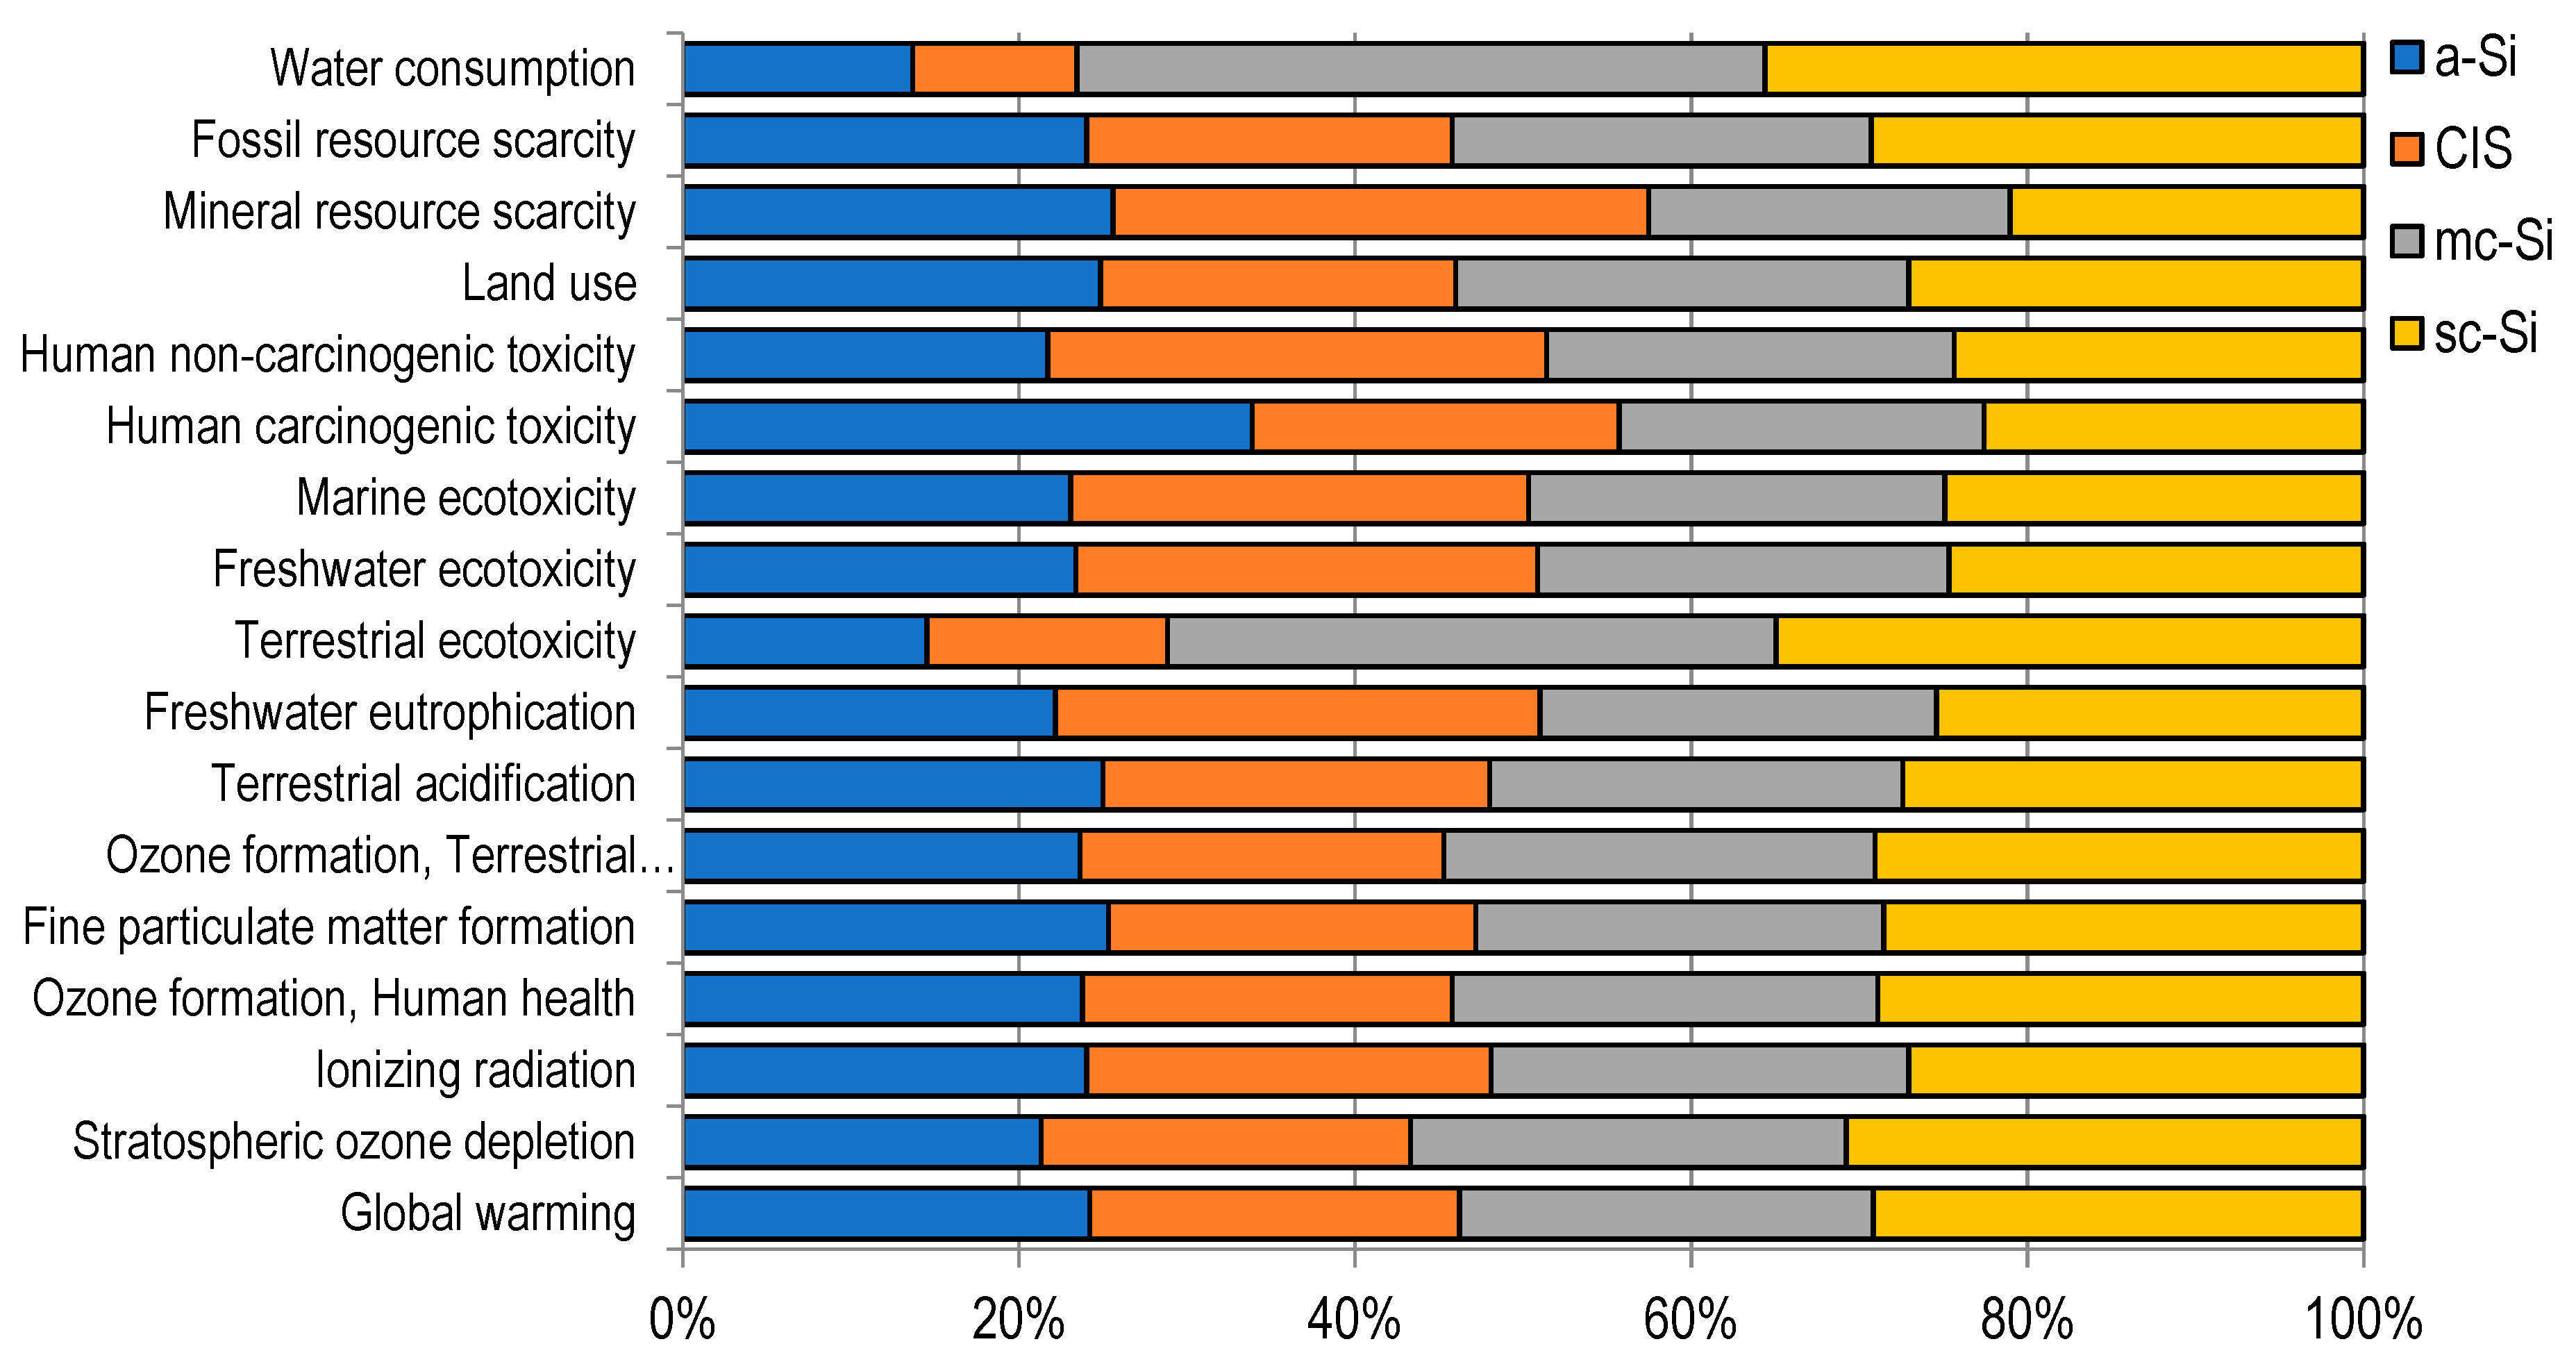
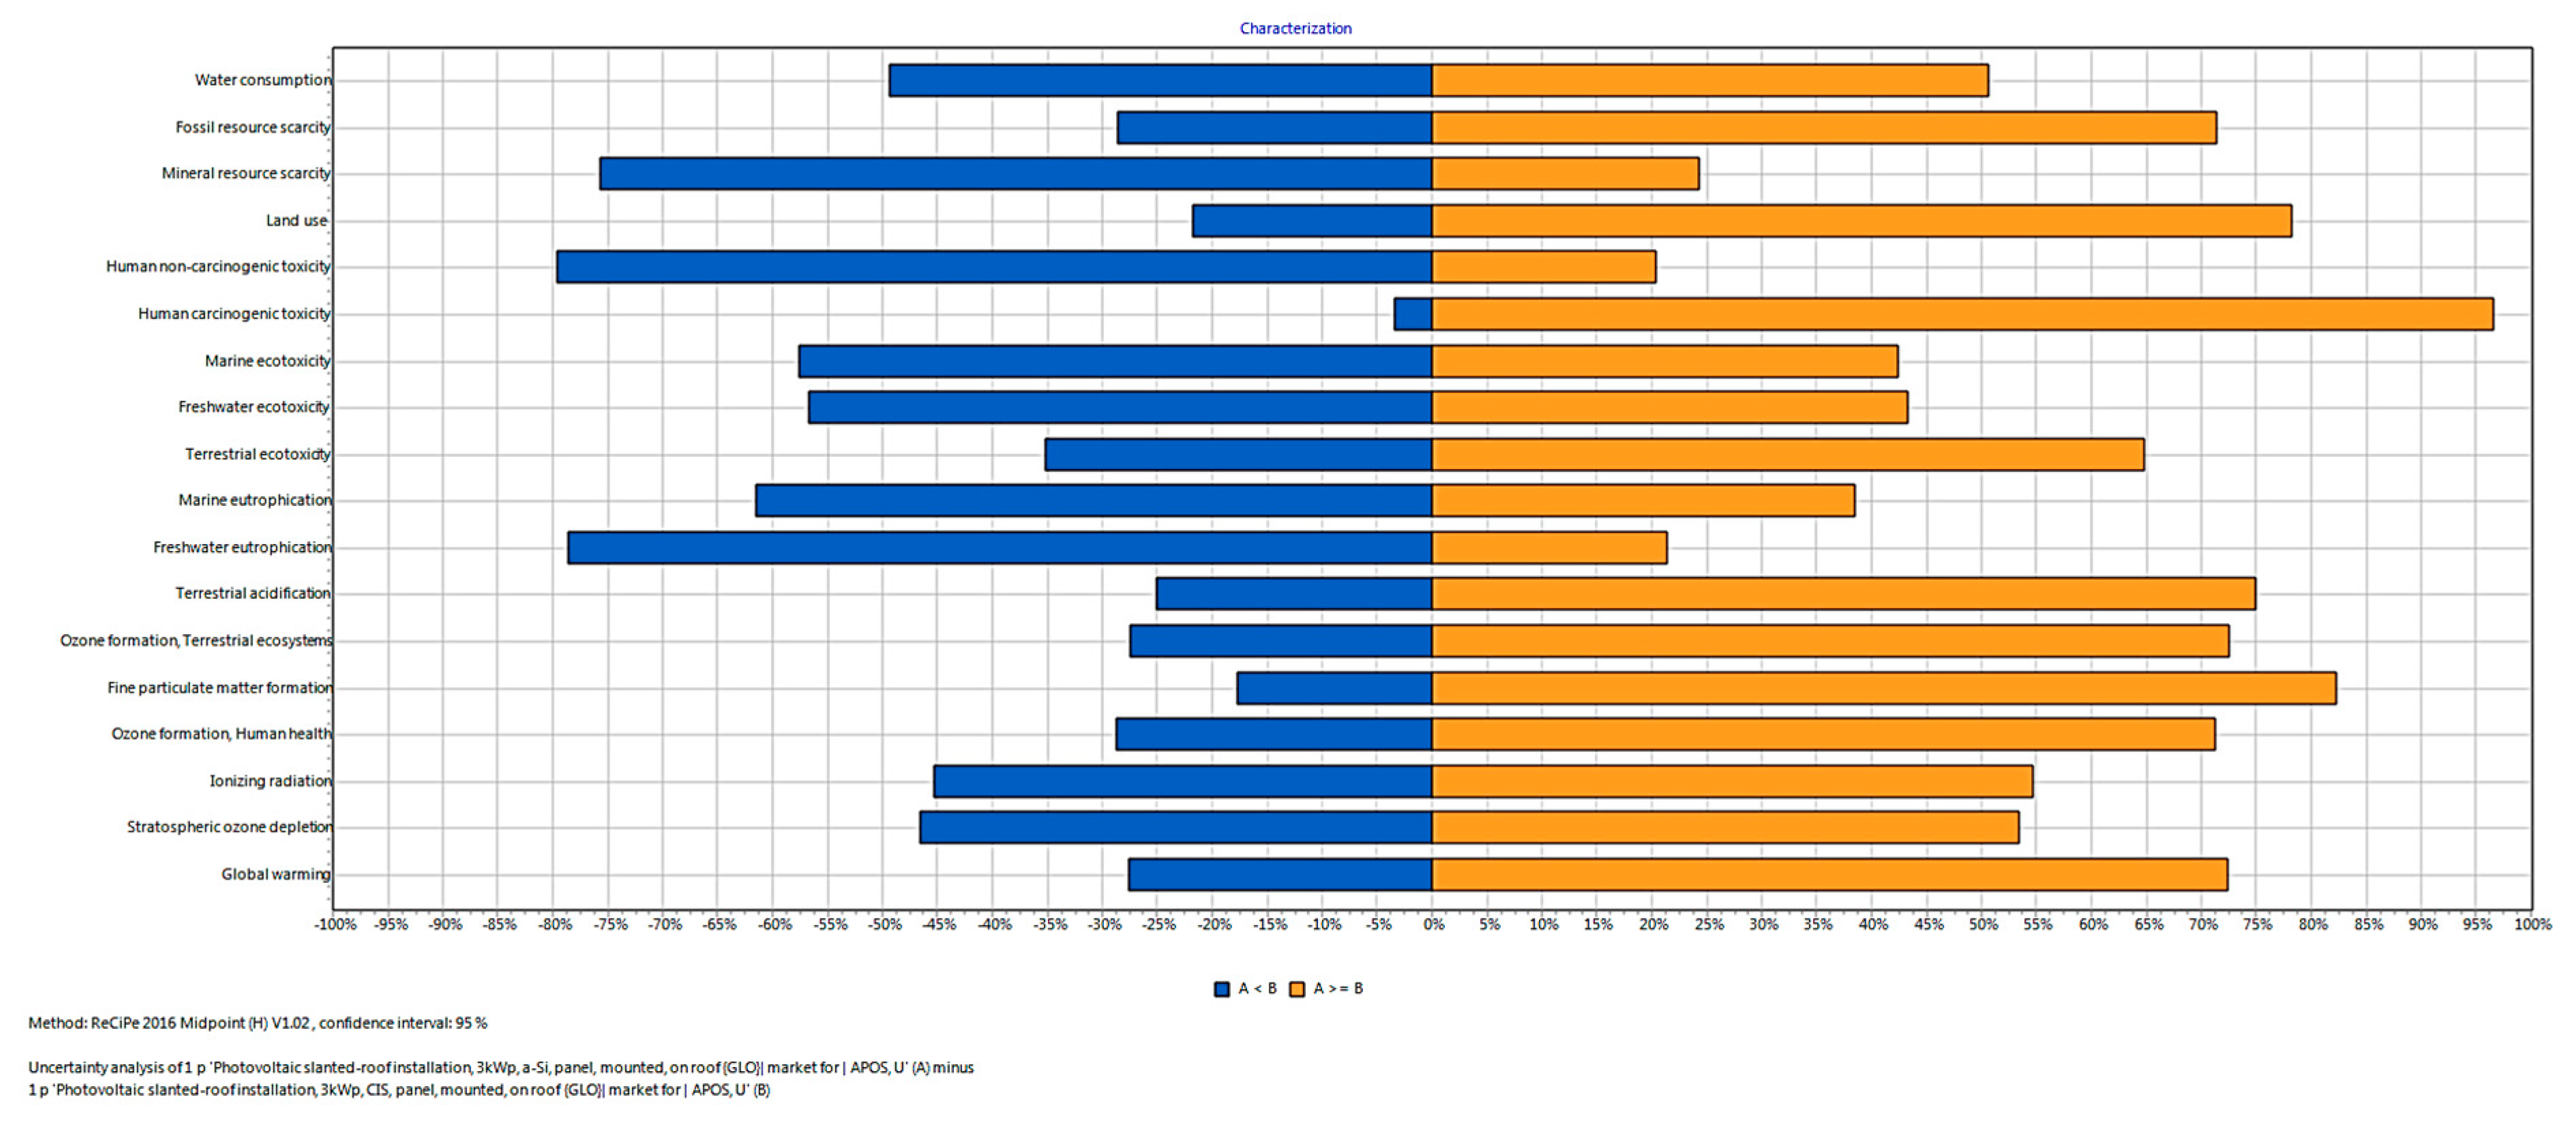
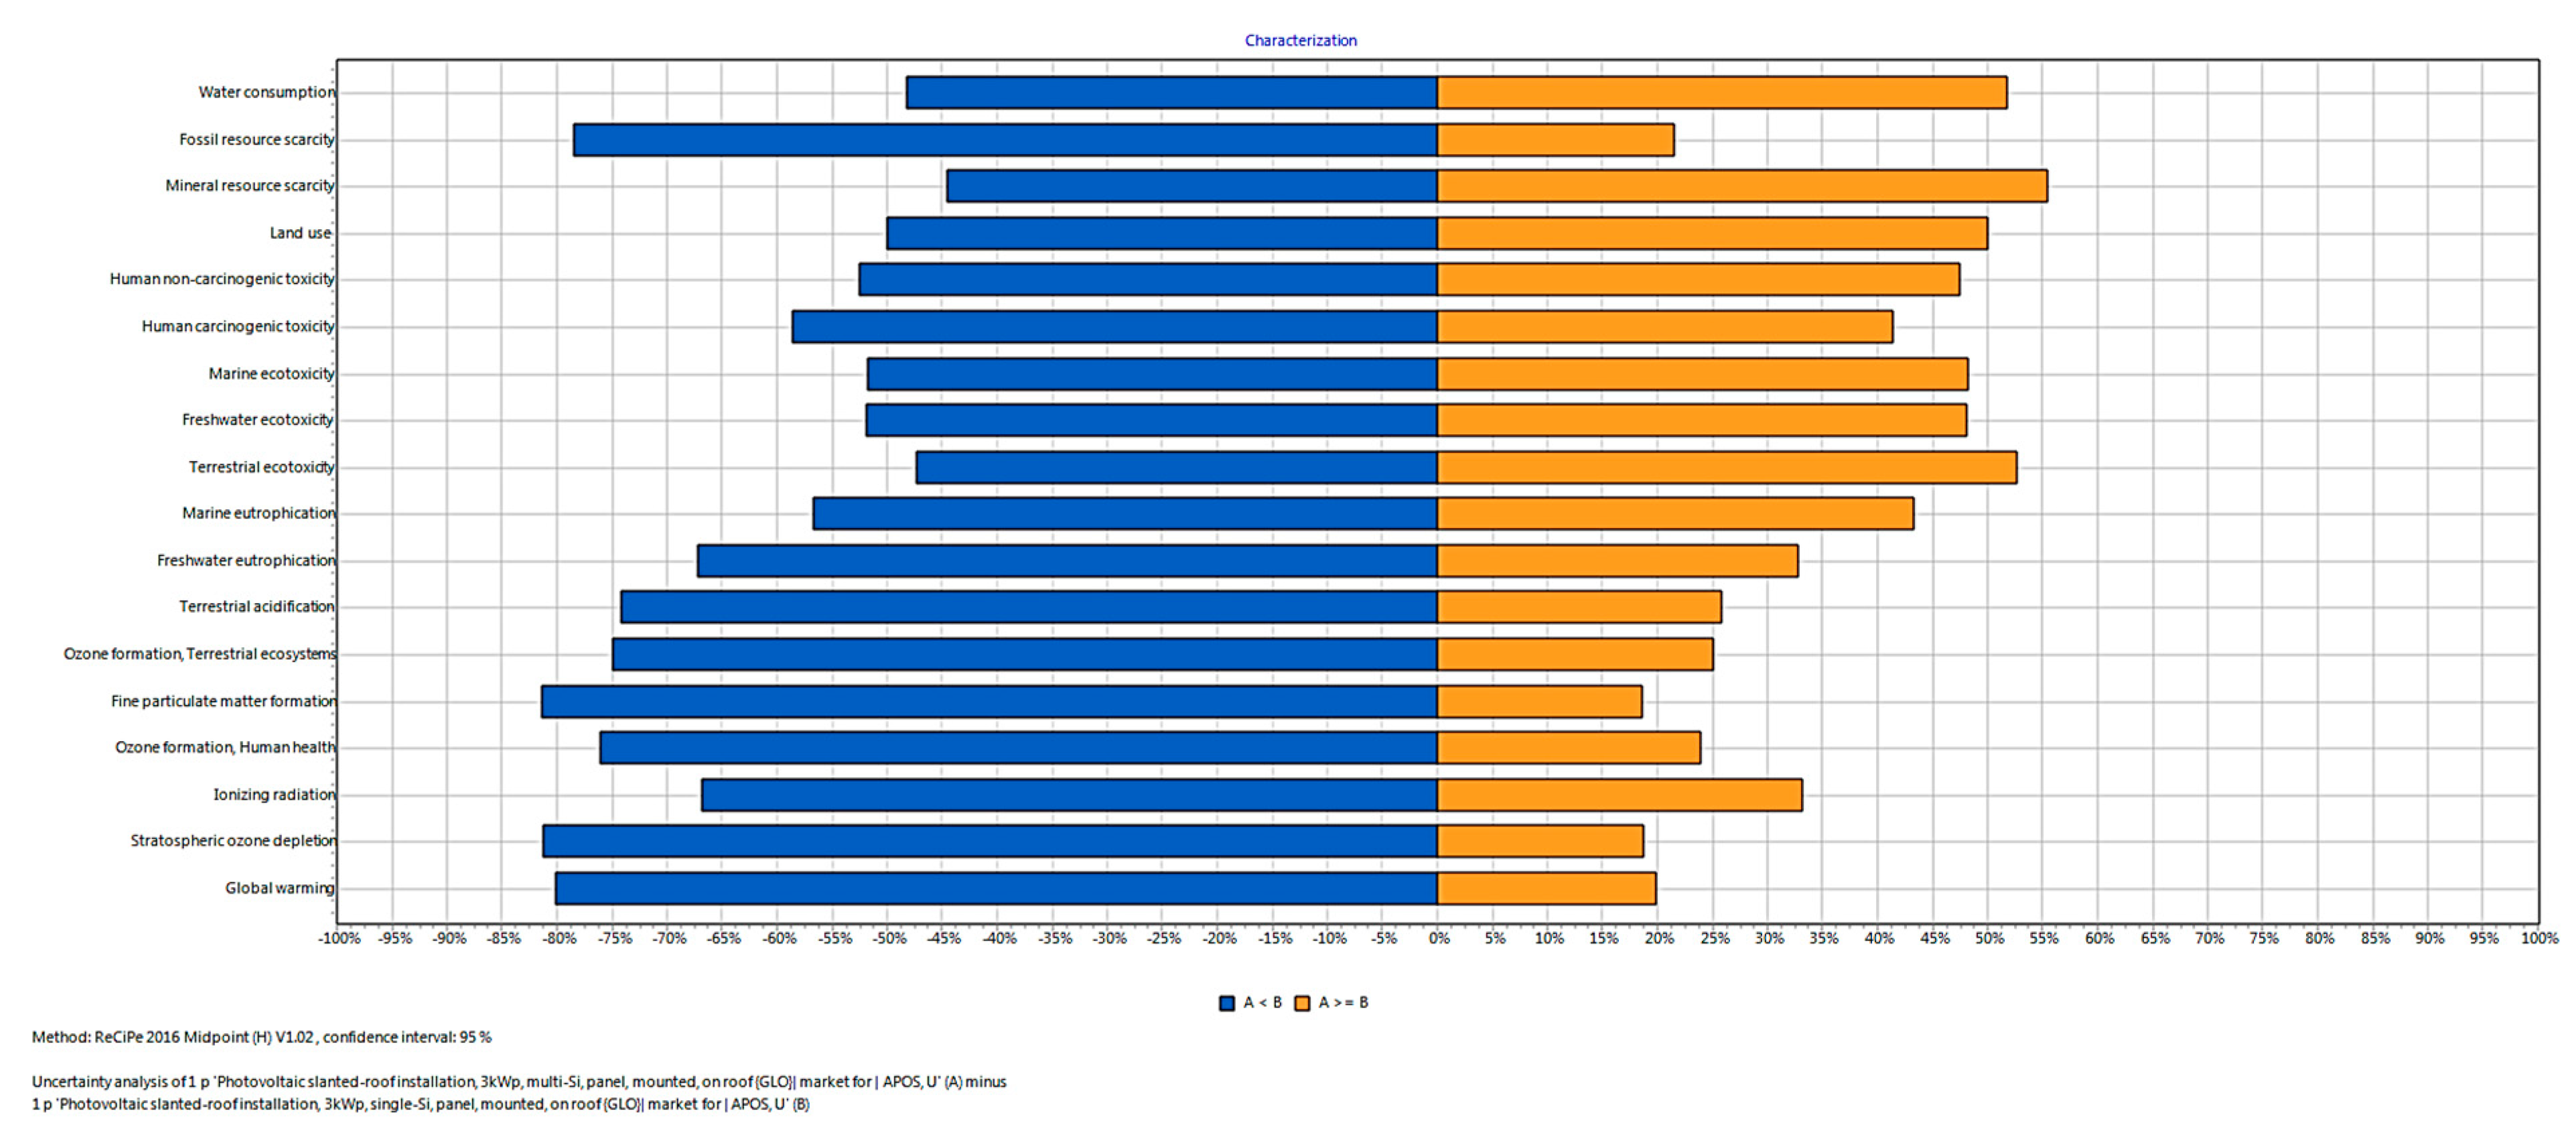
3.1.1. LCA Analysis of PV Systems

The LCA results were used for the evaluation of the environmental impacts of various types of PV technologies. Four different PV systems using crystalline and thin-film technologies (as described in Table 1) were evaluated in this paper, all having the same nominal capacity of 3 kW. In this section, the detailed results from the LCA of the studied PV systems are presented in order to determine which technologies are more hazardous to human health and ecosystem quality in a comparative assessment, distinguish which lifecycle stage of the PV energy production represents the majority of these impacts, and finally evaluate their overall energy performance.
The LCA of a PV system starts with the extraction of raw materials and follows along the product to the end of its life and the disposal of the PV components. The first stage of the process entails the mining of raw materials, for example, quartz sand for silicon based PVs, followed by further processing and purification stages, to achieve the required high purities, which typically entails a large amount of energy consumption and related emissions. Other raw materials included are those for balance of system (BoS) components, for example, silica for glass, copper ore for cables, and iron and zinc ores for mounting structures. At the end of their lifetime, PV systems are decommissioned and the valuable parts and materials are disposed.
Although PV power systems do not require finite energy sources (fossil, nuclear) during their operation, a considerable amount of energy and emissions are released for their production. The environmental issues associated with this energy use for PV manufacturing will also affect the environmental profile of PV power systems. The environmental themes that are strongly related to the PV energy system are: Exhaustion of finite resources, human health implications, and climate change [25,32,33].
The goal and scope of this LCA study was to evaluate over the lifecycle the impacts of the electricity produced by four different grid-tied 3 kW PV installations and the functional unit was the production of 1 kWh of produced electricity. The LCIA method used for the characterization of PV technologies was ReCiPe Midpoint, aiming to highlight the global warming potential and GHG emissions, fossil fuels, and climate change impacts related to each technology. The results were ranked from worst to best environmental performance and used to validate the environmental impacts of each PV system. The objective of conducting the LCA study was to make a comparative environmental analysis of different PV systems with a focus on comparing crystalline with thin film technologies.
The system boundaries account for all the impacts related to production, transportation, and system disposal of PV systems. The main parts of the studied systems are: i. The PV-panels, ii. the inverter, iii. the electric installation, and iv. the roof mounting structure. The process data for a 3 kW PV installation includes quartz reduction, silicon purification, wafer, panel and laminate production, and manufacturing of inverter, mounting, cabling, and infrastructure, assuming a 30 years operational lifetime. The following items were studied for each production stage as far as data were available:
  • Energy consumption;
  • Air and waterborne process-specific pollutants at all production stages (materials, chemicals, etc.);
  • Transport of materials, energy carriers, semi-finished products, and the complete power plant;
  • Waste treatment processes for production wastes;
  • Dismantling of all components;
  • Infrastructure for all production facilities with its land use.
The PV systems have the same nominal installed capacity (i.e., 3 kW) and differ according to the cell type (single- and multi-crystalline silicon, thin film cells with amorphous silicon, and CIS). All systems were assumed to be installed on existing buildings (slanted roof installation).
Life cycle inventory analysis involves creating an inventory of flows from and to nature for a product system. The Ecoinvent v3.4 database was employed for the inventories of PV systems, which can be assumed to be representative for typical PV installations. The Ecoinvent database provides detailed and transparent background data for a range of materials and services used in the production chain of photovoltaics. The delivery of the different PV parts to the final construction place was assumed as 100 km by a delivery van. This includes the transport of the construction workers. It was assumed that 20% of the panels are produced overseas and thus must be imported to Europe by ship. The lifetime of the inverter was assumed to be 15 years.
In Figure 1, the process network for the studied mc-Si PV system is depicted for the cut-off threshold of 10% (similar figures represent the data for the other three PV types). The thick red line in the network trees is known as the elementary flow and indicates the environmental bottleneck or burden in each process.
For the CIS system, 64.2% of all total inflows and outflows are due to the production of the photovoltaic panel. The installation phase and the inverter require 23.3% and 9.5%, respectively, of the energy and materials inflow. The main environmental impacts include the panel and cell production, inverter, and installation/construction phases. There are also impacts associated with the electricity, transportation, and system disposal, which are taken into consideration. Similar values stand for the case of a-Si panel: 56.9% for the production phase, and 32.5% and 8% for the installation phase and the inverter, respectively. For the sc-Si and mc-Si panels, 77.6% and 72.5%, respectively, of all total inflows and outflows are due to the production of the photovoltaic panel, installation is 13.1% and 16.5%, respectively, while the inverter accounts for 7% and 8.3%, respectively.
From the process networks, it is evident that the production stage contributes the most important part of the environmental impacts in the life cycle of all studied PV technologies. The elementary flows indicate that most inflows of materials and energy for both thin-film and crystalline technologies occur during the cell and panel production phase. Subsequently, large emissions and impacts to the environment and human health follow this stage of the PV systems′ lifecycle. Based on the above, we can conclude that the cell and panel production phase are the most important inputs to the development of a 3 kW PV system, followed by the inverter and construction of the mounting systems.
The environmental impacts of PV systems were calculated through the conducted LCA. The typical operation of PV systems was taken under consideration. In Table 2 and Figure 2, the aggregated LCA inventory results for the studied PV systems are presented. These are harmonized data representing the LCA results (for each impact category) per total electricity exported to the grid (in kWh) by each 3 kW PV system, thus providing a holistic evaluation indicator (i.e., environmental burden per total energy produced).
In Figure 2 the relative contributions to the impact categories (based on the ReCiPe 2016 midpoint evaluation) for the studied PV systems are shown. The cumulative CO2-eq emissions per kWh over the whole life cycle of the PV systems vary between approximately by 3.9 × 10⁻² and 5.2 × 10⁻² kg CO2-eq/kWh.
During the lifecycle of a PV system, initially, the extraction of resources leads to emissions that affect human health, including carcinogens and respiratory inorganics, while at a second level, the use of fossil fuel during the production and manufacturing processes releases large amounts of greenhouse gases in the atmosphere, causing climate change. Processes occurring during the panel production phase can significantly affect air quality as hazardous substances are emitted into the atmosphere and biosphere.
According to this analysis, the most severe burdens seem to be gathered to the following categories: Global warming, fossil fuel resource scarcity, carcinogens, ecotoxicity, and land use. The crystalline technologies (mc-Si and sc-Si) have increased values in almost all impact categories. Thin-film CIS exhibits lower impacts in most categories and seems to be an optimum selection from an environmental perspective compared to its other counterparts. Results indicate that there are impacts in all indicators, especially those affecting human health from the substances released into the air and water. The manufacturing of a-Si PV cells and panels requires silicon and typically the energy intensive “Siemens process” [34]. On the other hand, thin film PV systems have lower efficiencies and thus a 3 kW installation will require a larger number of cells and panels and more materials for the mounting systems. According to this analysis, thin-film technologies require less materials′ inflows for their construction and installation phases compared to crystalline systems and this coincides with reduced airborne pollutants, emissions, and energy (also connected with transportation, distribution, and mounting of the systems).
For the purposes of this study, two Monte Carlo analyses of the LCA results (repeated for 5000 iterations) were implemented for a comparison between the PV systems in each studied technology (i.e., crystalline and thin film). The aim of these analyses was to provide an additional validation (based on a statistical evaluation) for the credibility of the presented results. The first analysis was conducted between A: a-Si and B: CIS PV systems. During the Monte Carlo analysis, a stochastic variation of the parameters in the initial inventory database for each of the studied two cases (i.e., A and B) was performed, altering the LCA results and thus affecting the A−B outcome. A random variable was selected for each parameter within the specified uncertainty range and the impact assessment results were recalculated. The same process was repeated by taking different samples (within the uncertainty range) and all results were stored. After repeating the procedure for a set number of times (e.g., 5000), 5000 different results were obtained, thus forming the uncertainty distribution of the impacts (LCIA), with a confidence interval of 95%.
The results in a bar chart form are depicted in Figure 3 showing the percentage of times when system A has a greater impact than system B (A−B ≥ 0, in orange) and vice versa (A−B < 0, in blue). This is a balanced graph and, in general, we can conclude that A has increased impacts compared to B in most of the studied midpoint categories. This is quite evident for the human carcinogenic toxicity category, in which A has distinctively increased impacts compared to B for 96.6% of the completed iterations. Respectively, human non-carcinogenic toxicity and freshwater eutrophication are the two cases that A has a lower impact than B, for almost 80% of the completed iterations.
The second Monte Carlo analysis was conducted between A: mc-Si and B: sc-Si PV systems. Figure 4 presents the results in a bar chart form, showing the percentage of times when system A has a greater impact than system B (A−B ≥ 0, in orange) and vice versa (A−B < 0, in blue). In this case, it is evident that case A has lower impacts compared to B in most of the studied midpoint categories. The impact categories that a balanced result is observed are water consumption, land use, human non-carcinogenic toxicity, marine, freshwater, and terrestrial ecotoxicity.
It is very important to stress the fact that the results depicted in Figure 3 and Figure 4 refer to the comparison of the raw LCA data and not the harmonized results as mentioned in Table 2 and Figure 2 (i.e., LCA results for each impact category per total electricity exported to the grid for each PV system). Thus, these data do not include the provision for varying energy production for each of the studied systems.
Various additional technical components, the so-called balance of system (BoS) elements, can also play an increasingly important role for the comparison of different types of PV technologies with different efficiencies and thus different sizes of mounting systems for the same electric output. These BoS elements can have a significant share of 30% to 50%. On the one hand, this is due to the improvements, which could be observed for the production chain until the output of the final photovoltaic cell. On the other hand, now a more detailed investigation of these additional elements is available, which, for example, also includes the electronic components of the inverter. The low efficiency systems need larger amounts of the mounting structure and cabling, which partly outweighs the better performance per kWp of the module alone [26]. Overall, in the entire life cycle of both types of PV technologies, it was observed that the magnitude of environmental impacts of crystalline was greater than that of the thin film.

3.1.2. Energy and Economic Assessment of PV Systems

The first step in a pre-feasibility study of a solar (i.e., PV) project is to define the solar energy potential of the region in which the PV systems will be installed. This serves as a planning tool to quantify the anticipated electricity production and plant costs. The evaluation of these PV technology costs require in-depth analysis of site-specific solar energy potential; costs of solar technologies; customer types; meter types; utility types; physiographic conditions; local, regional, and national laws and regulations; feed-in-tariffs and financial mechanisms; etc. The techno-economic analysis carried out in this part of the paper quantifies the energy output and the economic income associated with each of the studied 3 kW PV power plants. The proposed area for installation of the PV systems is the island of Crete located in the southern part of Greece, which was selected as a typical representation of regions with a mild climate and high average insolation that lasts almost throughout the year (with greater intensity from April to October). These climatic conditions render Crete as one of the best available locations in Greece for installation of solar systems. The island is not interconnected to the mainland distribution grid and the necessary electricity is produced via diesel burning conventional thermal stations, thus increasing the cost (environmental and economic) per produced energy unit. In addition, Crete presents extreme variations in energy demand throughout the year, with significant peaks during the summer due to the tremendous increase of the population due to visiting tourists and increased air-conditioning needs. Thus, the need for decentralized production of electricity is more than obligatory as the solar grid parity in non-interconnected islands can already be considered as a fact [22]. On the other hand, the deficiencies in the existing electricity grid and local supporting schemes/governmental rules for renewables have created a vague scenery for potential investors. The economic and energy assessment of PV systems was carried out using the RETScreen software. The completed study involves quantifiable results for energy—economic impacts and savings for the chosen PV system. The site location for the installation of the PV systems was chosen to be the Acrotiri area in Chania, while all meteorological data (in the form of the annual time series of average climate conditions) were extracted from RETScreen referring to a weather station of Souda Bay, Chania.
The results of the RETScreen economic analysis provide a reliable and comprehensive evaluation of the anticipated technology, the energy production, potential emissions reduction, necessary investment cost, financial viability, and risks associated with the specific project. The accuracy of RETScreen is considered to be more than sufficient for preliminary feasibility studies and a small reduction in accuracy due to the use of monthly rather than hourly solar radiation data is more than compensated for due to the ease-of-use of the software.
After selecting the location area, the complete RETScreen analysis for each one of the studied PV systems was conducted. This analysis comprised four discrete steps: i. Selection of the technology (i.e., sc-Si, mc-Si, CIS, a-Si) and specification of the technical parameters, ii. energy analysis (see results in Table 3), iii. emissions analysis), and iv. financial analysis.
For all financial calculations, the electricity price was set to 0.10 €/kWh and we considered that the installation was funded by own means (no bank loan). For Greece, the employed feed-in-tariff for roof top PV will decline to 0.8 €/kWh by the end of 2019, but residential installations up to 10 kWp can benefit from a net-metering scheme, which can allow for compensation at prices up to 0.15 €/kWh [35,36,37]. In Table 3, the main results of the RETScreen analysis for all studied PV systems are presented. The cell efficiencies of the PV systems vary (from 6.1% to 17%), but this parameter does not play an important role as the nominal capacity of all systems is set to 3 kW. On the other hand, the larger the efficiency of the panel, the less the area needed for the installation (from 17.7 m2 to 49.2 m2). The simple payback period is 8.8 to 10 years (for regions with same insolation, i.e., Andalucía in Spain, the corresponding values for residential PV are 7.6 to 12.1 [38]) and IRR values vary from 11.5 to 13.1. The a-Si system seems to have a higher annual energy yield, and this is practically due to the ability of these systems to produce more electricity under hazy or cloudy conditions and thus their capacity factor is increased (21.8%) compared to their counterparts. The electricity produced allows for the mitigation of ~4 tons of CO2-eq annually for all PV systems.
According to the comparison of the different PV technologies, the anticipated energy production, emissions reduction, investment cost, financial viability, and risks associated with the four technologies are approximately the same. All technologies portray relatively equal cost benefit ratios and financial parameters. This is mainly due to the fact that our selection of comparing 3 kW systems harmonizes the influence of all technical advantages amongst technologies. On the other hand, the sc-Si system is the most efficient per cell, thus needing less area per installation compared to the other cases.

3.2. Solar Thermal Systems

3.2.1. LCA Analysis of Solar Thermal Systems

In this section, the detailed results from the LCA of solar thermal collectors will be presented. The two studied systems are: i. Flat plate collector with copper absorber and ii. vacuum (or evacuated) tube collector. In order to validate the environmental impacts, a detailed LCA was implemented for both studied systems.
The goal and scope of this LCA study is to evaluate over the lifecycle, the impacts of the thermal energy converted to hot water needs and consequently to the equivalent avoided electricity (thus the functional unit was the saving of 1 kWh electricity for hot water production), for the two types of solar collectors for use in a typical single house family. For this purpose, SimaPro 8.5 was employed, while ReCiPe 2016 Midpoint Hierarchist (H) was chosen as the LCIA method as it provides the most extensive set of midpoint impact categories, aiming to highlight the global warming potential and GHG emissions, fossil fuels, and climate change impacts related to each technology. The results are ranked from worst to best environmental performance. These results will be used to distinguish the impacts of each solar system and can be used during the combined environmental and technical assessment of installing such solar energy harvesting technologies.
The system boundaries account for all the impacts related to production, transportation, and disposal for both complete solar systems (excluding auxiliary heating), including various technical components, heat exchange fluid, installation of copper pipes, transportation of parts, delivery with a van, and montage on the roof. The main parts of the studied systems are: i. The solar collectors and absorbers (with an aperture area of 12.3 m2 and 10.5 m2 for the flat plate and the vacuum tube collectors, respectively), ii. the 200 L heat storage tank, and iii. the roof mounting structure. Both systems are aimed for installation on existing buildings (slanted roof installation) and their operational lifetime was assumed to be 20 years. Life cycle inventory analysis involves creating an inventory of flows from and to nature for a product system. The database, Ecoinvent 3.4, was employed for the inventories of solar collectors, as it provides detailed and transparent background data for a range of materials and services used in the production chain of solar collectors.
In Figure 5, the process network for the studied vacuum tube solar collector is depicted for a cut-off threshold of 10%. For the flat plate system, 57% and 27.1% of all total inflows and outflows are due to the production of the collector and the tank, respectively, while for the vacuum tube system, the corresponding values are 45.3% and 34.8%. Thus, as the networks clearly show, the production stage of the collector component contributes the most important part of the environmental impacts in the life cycle for both studied systems.
In Table 4 and Figure 6, the aggregated LCA inventory results for the studied solar thermal systems are depicted. These are harmonized data representing the LCA results (for each impact category) per total energy produced per aperture area (in kWh/m2) by each solar collector, thus providing a holistic evaluation indicator (i.e., environmental burden per total energy produced). It is important to stress the fact that the electricity mentioned above in kWh corresponds to the necessary energy for heating water, which is substituted by the operation of the solar collectors, which convert solar radiation to heat transferred to a stored hot water in their tank. As depicted in Table 4, the cumulative CO2-eq emissions over the whole life cycle of the solar systems are quite close, varying between 2.22 × 10⁻² and 2.38 × 10⁻² kg CO2-eq/kWh·m2, and the lowest value corresponds to the vacuum tube collector.
In Figure 6, the relative contributions to the impact categories (based on the ReCiPe 2016 midpoint evaluation) for the solar systems are depicted. The results are mixed, with the two systems exhibiting similar environmental impacts in most categories, but the vacuum tube collector has the highest values in most cases.
For the purposes of this study, a Monte Carlo analysis of the LCA results was implemented through a comparison between the two studied solar collectors (A: Flat plate and B: Vacuum tube collector), which was repeated for 5000 iterations. In Figure 7, the results of the uncertainty analysis are depicted in a bar chart form, showing the percentage of times when collector A has a greater impact than collector B (A−B ≥ 0, in orange) and vice versa (A−B < 0, in blue). It is clear that for the studied solar collectors, A has increased impacts compared to B in most of the studied midpoint categories. Land use is the only case that A has a lower impact than B, for 53.4% of the completed iterations. It is important to keep in mind that these outcomes refer to the direct LCA results, which are non-harmonized (i.e., they do not take into account the environmental impacts per energy production and per aperture area for each system).

3.2.2. Energy and Economic Assessment of Solar Thermal Systems

The comparative techno-economic assessment of the installation of the two solar thermal collectors was carried out through RETScreen. The installation location site was chosen to be the Acrotiri area in Chania, while all meteorological data (in the form of annual time series of average climate conditions) were extracted from RETScreen referring to a weather station of Souda Bay, Chania. After selecting the location area, the complete RETScreen analysis for each solar collector was conducted. This analysis comprised the following discrete steps: i. Determination of the annual hot water needs for the studied single family house, ii. selection of the auxiliary hot water heating system (i.e., diesel based heating equipment), iii. selection of the solar collector technology (i.e., flat plate and vacuum tube) and specification of the technical parameters, iv. energy analysis (see aggregated results in Table 5), and v. financial analysis.
For all financial calculations, the electricity price was set to 0.15 €/kWh and we considered that the installation was funded by own means (no bank loan). The hot water needs for a typical family house with four occupants (taking as granted a 100% occupancy rate and 24 operating hours per day) were estimated to be 2817 kWh per year. A typical auxiliary hot water heating system burning diesel was considered for backup. In Table 5, the main results of the RETScreen analysis for the studied solar thermal collectors are presented. Both selected systems are typical flat plate and vacuum solar collectors installed in Greek houses and they can be considered as top-class products, while the purchase cost of the vacuum tube collector is significantly higher, i.e., 1300 € vs. 900 € [39].
The thermal losses coefficient, FrUL, is increased for the flat plate collector compared to the vacuum tube system, i.e., 4.6 vs. 1.7 (W/m2)/°C, respectively. This is due to the completely different thermal losses suppression design followed in each system, which practically makes the vacuum tube collector unaffected by variations in the ambient temperature. In addition, the solar fraction value (practically denoting the percentage of hot water needs covered by the system annually) for the vacuum tube system is higher that the flat plate collector (i.e., 62.7% vs. 55.3%, respectively). On the other hand, it is evident that overall, this parameter does not play an important role in the energy outcome of the systems, as finally the flat plate collector provides slightly more energy per aperture area throughout the year. This is mainly due to two reasons: i. The weather conditions in Crete (high intensity solar radiation for extended time periods and with increased ambient temperatures throughout the year) are favorable for solar systems and thus the advantageous thermal insulation and the ability to reach high temperatures of the vacuum system is not necessary, ii. the pump in the vacuum system requires more electricity due to increased friction in the collector (more complex circulation system).
The comparison of the annual energy-fuel consumption and the economic savings between the base case (auxiliary hot water heating system) and the solar collectors was performed for both the studied systems. Annual savings of 352 € (flat plate system) and 341 € (vacuum tube system) are anticipated, and their economic viability is obvious. The simple payback period is 2.6 and 3.8 years and IRR values of 41.8 and 28.5 for the flat plate and the vacuum tube system, respectively. The above mentioned results prove that the selection of a flat plate system is rather mandatory for typical installations in Crete (southern part of Greece) while vacuum tube systems could be selected for energy demanding applications or northern climates.

3.3. Life Cycle Carbon Footprint

As indicated in the previous analysis, the studied renewable energy systems have environmental impacts during their production phase, but through their operation (i.e., production of clean energy) they manage to mitigate significant amounts of emitted greenhouse gases due to the avoided use of fossil fuels. In the following section, we will comment on the overall environmental profile of various energy production technologies through the concept of a carbon footprint (thus focusing on global warming impacts). The measurement of life-cycle greenhouse gas emissions involves calculating the global-warming potential of electricity production through life-cycle assessment of each energy source. The findings are presented in units of global warming potential per unit of electrical energy generated by that source, i.e., gCO2-eq/kWh. The goal of such evaluations is to analyze the complete life cycle of the energy generating technology, from material and fuel mining through construction to operation and waste management [40,41].
In Table 6, the values of the emitted, avoided, and the lifetime balance for the greenhouse gases and the total energy produced from photovoltaics and solar thermal systems are presented. Both technologies avoid the emission of significant amounts of GHG through their operation and energy production. It is evident that the magnitude of the total avoided emissions is higher for photovoltaics compared to solar thermal systems and this has to do with the difference in the concept and the installed capacity of the two technologies.
The carbon footprint for the studied renewable systems was calculated, and in addition, typical values for other energy production technologies (either renewables or fossil-fuel based) are also depicted in Table 6 [40,41,42,43,44,45]. The carbon footprint for solar thermal collectors is lower compared to photovoltaics, while both technologies alongside with wind, hydroelectric, and nuclear are quite far from fossil fuel based power plants (which exhibit carbon footprint values ranging from 400 to 1050). This is an expected result as the environmental advantage of renewable over conventional energy sources is unambiguous.

4. Concluding Remarks

The energy and environmental profile for photovoltaics and solar thermal collectors were presented in the previous sections of the paper. For each technology, various technical variations were presented, i.e., thin film-crystalline silicon photovoltaics and flat plate-vacuum tube solar collectors. In the following paragraphs, a synopsis of the results for each renewable technology is presented alongside the detailed discussion and conclusions.
Regarding the photovoltaics, all studied systems were selected to have the same nominal installed capacity of 3 kW, representing a typical choice for residential applications. The production stage contributes the most important part of the environmental impacts in the life cycle of all studied PV technologies (followed by the inverter and construction of the mounting systems), as 60% to 70% (depending on the system) of inflows of materials and energy for both thin-film and crystalline PV systems occur during the cell and panel production phase.
The crystalline technologies (mc-Si and sc-Si) have increased values in almost all environmental impact categories. Thin-film CIS exhibits lower impacts in most categories and seems to be an optimum selection from an environmental perspective compared to its other counterparts. On the other hand, a-Si PV cells require an energy intensive manufacturing process, which affects their environmental profile. The cumulative CO2-eq emissions per kWh over the whole life cycle of the studied PV systems vary between approximately 3.9 × 10⁻² and 5.2 × 10⁻² kg CO2-eq/kWh.
The efficiencies vary from 6.1% to 17%, with thin-films based PV systems exhibiting the lowest values, but this parameter does not play an important role as the nominal capacity of all systems is identical (i.e., 3 kW). On the other hand, the larger the efficiency of the panel, the less the area needed for the installation (from 17.7 m2 to 49.2 m2) and less materials will be required for the mounting systems. The simple payback period of the systems is 8.8 to 10.0 years and IRR values vary from 11.5 to 13.1. The a-Si based systems seems to have higher annual energy yields due to their ability to produce more electricity under hazy or cloudy conditions and thus their capacity factor is increased (21.8%) compared to their counterparts (values ~20.5). The electricity produced allows for the mitigation of ~4 tons of CO2-eq annually for all PV systems. In general, the anticipated values for energy production, emissions reduction, investment cost, financial viability, and risks associated with the four 3 kW PV technologies are quite similar. For real case installations, parameters, like total cost and necessary area for installation, might play a decisive role for the final selection amongst the proposed technologies.
In terms of the studied solar thermal collectors, the comparison of flat plate and vacuum tube systems aimed at stressing the advantages and disadvantages of both technologies. The production stage of the collector component contributes the most important part of the environmental impacts in the life cycle for both studied systems. Thus, for the flat plate system, 57% and 27.1% of all total inflows and outflows are due to the production of the collector and the tank, respectively, while for the vacuum tube system, the corresponding values are 45.3% and 34.8%. The two systems exhibited similar environmental impacts in most categories, but the vacuum tube collector has the highest values in most cases. The cumulative CO2-eq emissions over the whole life cycle of the solar systems are quite close, varying between 2.22 × 10⁻² and 2.38 × 10⁻² kg CO2-eq/kWh·m2, and the lowest value corresponds to the vacuum tube collector.
Both collectors can cover more than half of the annual hot water needs (equal to spending 2817 kWh in a typical auxiliary hot water heating system) for a family house with four occupants, as the solar fraction values are 62.7% and 55.3% for the vacuum tube and the flat plate collector, respectively. The vacuum tube collector is practically unaffected by variations in the ambient temperature due to its significantly lower thermal losses coefficient, but this technical advantage is not reflected in its final energy outcome mainly due to the favorable weather conditions (i.e., extended time periods with high intensity solar radiation and increased ambient temperatures) in the selected installation location, which make the flat plate collector equally efficient, and to the increased electricity consumption of its pump. In addition, the purchase cost of the vacuum collector is almost 45% higher, thus stressing the fact that for typical installations in southern climates (i.e., Greece), the flat plate system should be the principal option. The economic viability of both systems is proven as the simple payback period is 2.6 and 3.8 years for the flat plate and the vacuum tube system, respectively.

Author Contributions

Conceptualization, M.M., M.S., and S.P.; methodology, M.M., M.S., G.A., and S.P.; software, M.M.; validation, M.M. and S.P.; data curation, M.M. and G.A.; writing—original draft preparation, M.M. and S.P.; writing-review and editing, M.S. and S.P.; supervision, S.P.; funding acquisition, M.S. and S.P.

Funding

The research has been co-financed by the European Union and Greek national funds through the Operational Program Competitiveness, Entrepreneurship and Innovation, under the call RESEARCH—CREATE - INNOVATE (project code: Τ1EDK-01740).

Conflicts of Interest

The authors declare no conflict of interest

References

  1. IEA. Key World Energy Statistics 2018. International Energy Agency 2018. Available online: www.iea.org/statistics (accessed on 22 March 2019).
  2. REN21. Renewables 2018, Global Status Report. 2018. Available online: www.ren21.net (accessed on 22 March 2019).
  3. IRENA 2018. Renewable Energy Prospects for the European Union; International Renewable Energy Agency: Abu Dhabi, United Arab Emirates, 2018. [Google Scholar]
  4. IRENA 2017. Planning for the Renewable Future: Long-Term Modelling and Tools to Expand Variable Renewable Power in Emerging Economies; International Renewable Energy Agency: Abu Dhabi, United Arab Emirates, 2017. [Google Scholar]
  5. IEA. Market Report Series: Renewables 2017, Analysis and Forecasts to 2022. International Energy Agency 2017. Available online: www.iea.org/publications/renewables2017 (accessed on 22 March 2019).
  6. REN21. Advancing the Global Renewable Energy Transition: Highlights of the REN21 Renewables 2017 Global Status Report in Perspective; REN21 Secretariat: Paris, France, 2018. [Google Scholar]
  7. Finnveden, G.; Hauschild, M.; Ekvall, T.; Guinee, J.; Heijungs, R.; Hellweg, S.; Koehler, A.; Pennington, D.; Suh, S. Recent developments in Life Cycle Assessment. J. Environ. Manag. 2009, 91, 1–21. [Google Scholar] [CrossRef] [PubMed] [Green Version]
  8. Turconi, R.; Boldrin, A.; Astrup, T. Life cycle assessment (LCA) of electricity generation technologies: Overview, comparability and limitations. Renew. Sustain. Energy Rev. 2013, 28, 555–565. [Google Scholar] [CrossRef] [Green Version]
  9. Weidema, B.P.; Thrane, M.; Christensen, P.; Schmidt, J.; Løkke, S. Carbon Footprint. J. Ind. Ecol. 2008, 12, 3–6. [Google Scholar] [CrossRef] [Green Version]
  10. Mahmud, M.A.; Huda, N.; Farjana, S.H.; Lang, C. Environmental impacts of solar-photovoltaic and solar-thermal systems with life-cycle assessment. Energies 2018, 11, 2346. [Google Scholar] [CrossRef]
  11. Constantino, G.; Freitas, M.; Fidelis, N.; Pereira, M.G. Adoption of photovoltaic systems along a sure path: A life-cycle assessment (LCA) study applied to the analysis of GHG emission impacts. Energies 2018, 11, 2806. [Google Scholar] [CrossRef]
  12. Weisser, D. A guide to life-cycle greenhouse gas (GHG) emissions from electric supply technologies. Energy 2007, 32, 1543–1559. [Google Scholar] [CrossRef]
  13. ISO. EN ISO 14040, Environmental Management—Life Cycle Assessment—Principles and Framework. 2006. Available online: https://www.iso.org/standard/37456.html (accessed on 22 March 2019).
  14. EC-JRC. International Reference Life Cycle Data System (ILCD), Handbook—General Guide for Life Cycle Assessment—Detailed Guidance; Publications Office of the European Union: Luxembourg, 2010. [Google Scholar]
  15. Sima Pro. 2018. Available online: simapro.com (accessed on 22 March 2019).
  16. RETScreen Expert. 2018. Available online: www.nrcan.gc.ca/energy/software-tools/7465 (accessed on 22 March 2019).
  17. Ghafghazi, S.; Sowlati, T.; Sokhansanj, S.; Bi, X.; Melin, S. Life cycle assessment of base-load heat sources for district heating system options. Int. J. Life Cycle Assess. 2011, 16, 212–223. [Google Scholar] [CrossRef]
  18. Amponsah, N.Y.; Troldborg, M.; Kington, B.; Aalders, I.; Hough, R.L. Greenhouse gas emissions from renewable energy sources: A review of lifecycle considerations. Renew. Sustain. Energy Rev. 2014, 39, 461–475. [Google Scholar] [CrossRef]
  19. Itten, R.; Stucki, M. Highly efficient 3rd generation multi-junction solar cells using silicon heterojunction and perovskite tandem: Prospective life cycle environmental impacts. Energies 2017, 10, 841. [Google Scholar] [CrossRef]
  20. IRENA. Renewable Power Generation Costs in 2017; International Renewable Energy Agency: Abu Dhabi, United Arab Emirates, 2018. [Google Scholar]
  21. Varun, R.P.; Bhat, I.K. Energy, economics and environmental impacts of renewable energy systems. Renew. Sustain. Energy Rev. 2009, 13, 2716–2721. [Google Scholar] [CrossRef]
  22. Papaefthimiou, S.; Souliotis, M.; Andriosopoulos, K. Grid parity of solar energy: Imminent fact or future′s fiction? Energy J. 2016, 37, 263–276. [Google Scholar] [CrossRef]
  23. Jungbluth, N.; Stucki, M. Life Cycle Inventories of Photovoltaics; ESU-Services Ltd.: Uster, Switzerland, 2012; p. 250. [Google Scholar]
  24. Frischknecht, R.; Itten, R.; Sinha, P.; de Wild-Scholten, M.; Zhang, J.; Fthenakis, V.; Kim, H.C.; Raugei, M.; Stucki, M. Life Cycle Inventories and Life Cycle Assessment of Photovoltaic Systems; PVPS 12, Report T12-04; International Energy Agency (IEA): Paris, France, 2015. [Google Scholar]
  25. Fthenakis, V.M.; Kim, H.C. Photovoltaics: Life-cycle analyses. Sol. Energy 2011, 85, 1609–1628. [Google Scholar] [CrossRef]
  26. Jungbluth, N.; Tuchschmid, M.; de Wild-Scholten, M. Life Cycle Assessment of Photovoltaics: Update of Ecoinvent Data v2.0; ESU-Services Ltd.: Uster, Switzerland, 2008. [Google Scholar]
  27. Lenzen, M. Greenhouse gas analysis of solar-thermal electricity generation. Sol. Energy 1999, 65, 353–368. [Google Scholar] [CrossRef]
  28. Kreith, F.; Norton, P.; Brown, D. A comparison of CO2 emissions from fossil and solar power plants in the United States. Energy 1990, 15, 1181–1198. [Google Scholar] [CrossRef]
  29. Lechón, Y.; de la Rúa, C.; Sáez, R. Life Cycle Environmental Impacts of Electricity Production by Solarthermal Power Plants in Spain. J. Sol. Energy Eng. 2008, 130, 021012. [Google Scholar] [CrossRef]
  30. Weidema, B.P.; Bauer, C.; Hischier, R.; Mutel, C.; Nemecek, T.; Reinhard, J.; Vadenbo, C.O.; Wernet, G. Overview and Methodology. Data Quality Guideline for the Ecoinvent Database Version 3; The ecoinvent Centre: St. Gallen, Switzerland, 2013. [Google Scholar]
  31. Goedkoop, M.; Heijungs, R.; de Schryver, A.; Struijs, J.; Van Zelm, R.; ReCiPe 2008. A life Cycle Impact Assessment Method Which Comprises Harmonised Category Indicators at the Midpoint and the Endpoint Level. Report I: Characterisation. 2013. Available online: https://www.pre-sustainability.com/download/ReCiPe_main_report_MAY_2013.pdf (accessed on 22 March 2019).
  32. Fthenakis, V.M. End-of-life management and recycling of PV modules. Energy Policy 2000, 28, 1051–1058. [Google Scholar] [CrossRef] [Green Version]
  33. Fthenakis, V.; Wang, W.; Kim, H.C. Life cycle inventory analysis of the production of metals used in photovoltaics. Renew. Sustain. Energy Rev. 2009, 13, 493–517. [Google Scholar] [CrossRef] [Green Version]
  34. Pauls, K.; Mitchell, K.W.; Chesarak, W.; King, R.R. Silicon Concentrator Solar Cells Using Mass-Produced, Flat-Plate Cell Fabrication Technology. In Proceedings of the Conference Record of the Twenty-Third IEEE Photovoltaic Specialists Conference, Louisville, KY, USA, 10–14 May 1993; Volume 2, pp. 824–827. [Google Scholar]
  35. RAE. Regulatory Authority for Energy (RAE). Available online: http://www.rae.gr/site/en_US/portal.csp (accessed on 11 April 2019).
  36. Maroulis, G. Legal Sources on Renewable Energy, Feed-in Tariff (Rooftop PV). 2019. Available online: http://www.res-legal.eu/search-by-country/greece/single/s/res-e/t/promotion/aid/feed-in-tariff-ii-pv-on-rooftops/lastp/139/ (accessed on 11 April 2019).
  37. HELAPCO. Hellenic Association of Photovoltaic Companies. 2014. Available online: http://helapco.gr/en/ (accessed on 11 April 2019).
  38. Van der Vlies, D.; van Breevoort, P.; Winkel, T. The Value of Distributed Solar PV in Spain; GreenPeace: Amsterdam, The Netherlands, 2018. [Google Scholar]
  39. Calpak. 2018. Available online: www.calpak.gr (accessed on 22 March 2019).
  40. Schlömer, S.; Bruckner, T.; Fulton, L.; Hertwich, E.; McKinnon, A.; Perczyk, D.; Roy, J.; Schaeffer, R.; Sims, R.; Smith, P.; et al. ANNEX III: Technology-specific Cost and Performance Parameters. In Climate Change 2014: Mitigation of Climate Change. Contribution of Working Group III to the Fifth Assessment Report of the Intergovernmental Panel on Climate Change; Cambridge University Press: Cambridge, UK; New York, NY, USA, 2014. [Google Scholar]
  41. Edenhofer, O.; Pichs-Madruga, R.; Sokona, Y.; Seyboth, K.; Matschoss, P.; Kadner, S.; Zwickel, T.; Eickemeier, P.; Hansen, G.; Schlömer, S.; von Stechow, C. Special Report on Renewable Energy Sources and Climate Change Mitigation. In Summary for Policymakers and Technical Summary. A Report of Working Group III of the Intergovernmental Panel on Climate Change; Cambridge University Press: Cambridge, UK; New York, NY, USA, 2011. [Google Scholar]
  42. Moomaw, W.; Yamba, F.; Kamimoto, M.; Maurice, L.; Nyboer, J.; Urama, K.; Weir, T.; Bruckner, T.; Jäger-Waldau, A.; Krey, V.; et al. Renewable Energy and Climate Change. In Renewable Energy Sources and Climate Change Mitigation; Edenhofer, O., Pichs-Madruga, R., Sokona, Y., Seyboth, K., Matschoss, P., Kadner, S., Zwickel, T., Eickemeier, P., Hansen, G., Schlomer, S., et al., Eds.; Cambridge University Press: Cambridge, UK, 2011; pp. 161–208. [Google Scholar]
  43. Sullivan, J.L.; Clark, C.E.; Han, J.; Wang, M. Life-Cycle Analysis Results of Geothermal Systems in Comparison to Other Power Systems. 2010. Available online: https://www.energy.gov/eere/geothermal/downloads/life-cycle-analysis-results-geothermal-systems-comparison-other-power (accessed on 22 March 2019).
  44. Krey, V.; Masera, O.; Blanford, G.; Bruckner, T.; Cooke, R.; Fisher-Vanden, K.; Haberl, H.; Hertwich, E.; Kriegler, E.; Mueller, D.; et al. Annex II: Metrics & Methodology. In Climate Change 2014: Mitigation of Climate Change. Contribution of Working Group III to the Fifth Assessment Report of the Intergovernmental Panel on Climate Change; Edenhofer, Cambridge University Press: Cambridge, UK; New York, NY, USA, 2014. [Google Scholar]
  45. Sovacool, B.K. Valuing the greenhouse gas emissions from nuclear power: A critical survey. Energy Policy 2008, 36, 2950–2963. [Google Scholar] [CrossRef]
Figure 1. Process network for mc-Si PV system. Cut-off threshold: 10%, total nodes: 11,607.
Sustainability 11 02539 g001
Figure 2. LCA results for the studied PV systems: relative contributions to the impact categories.
Sustainability 11 02539 g002
Figure 3. Monte-Carlo simulation results of LCIA uncertainties between a-Si (A) and CIS (B) PV systems.
Sustainability 11 02539 g003
Figure 4. Monte-Carlo simulation results of LCIA uncertainties between mc-Si (A) and sc-Si (B) PV systems.
Sustainability 11 02539 g004
Figure 5. Process network for the vacuum tube solar collector. Cut-off threshold: 10%, total nodes: 11,607.
Sustainability 11 02539 g005
Figure 6. LCA results for the studied solar thermal systems: relative contributions to the impact categories.
Sustainability 11 02539 g006
Figure 7. Monte-Carlo simulation results of LCIA uncertainties between flat plate (A) and vacuum tube (B) collectors.
Sustainability 11 02539 g007
Table 1. Technical characteristics of PV cell technologies used in this paper.
Photovoltaic TechnologyTechnical Characteristics
Crystalline technologiesSingle crystalline silicon cells (sc-Si)The active material is made from a single crystal without grain boundaries. The sc-Si cells have the highest efficiencies (for commercial cells: 13%–18%).
Multi-crystalline silicon cells (mc-Si)The cell material consists of different crystals. The cells have a lower efficiency, but it is cheaper in production. Commercial mc-Si cells have efficiencies in the range of 11% to 16%.
Thin-Film TechnologiesCopper-Indium-diSelenide (CIS) CIS modules are constructed by depositing extremely thin layers of photovoltaic materials on a low cost layer (such as glass, stainless steel, or plastic). Material costs are lower because less semi-conductor material is required; secondly, labor costs are reduced because the thin films are produced as large, complete modules and not as individual cells that have to be mounted in frames and wired together. The efficiency is about 8% to 11%.
Amorphous cells (a-Si)The efficiency of amorphous cells is about 6% to 9% and decreases during the first 100 operation hours. A recently developed thin-film technology is hydrogenated amorphous silicon.
Table 2. Aggregated LCA inventory results for the studied PV systems.
Impact CategoryUnita-SiCISmc-Sisc-Si
Global warmingkg CO2-eq /kWh4.35 × 10−23.95 × 10−24.43 × 10−25.24 × 10⁻²
Stratospheric ozone depletionkg CFC11-eq/kWh1.70 × 10−81.75 × 10−82.06 × 10−82.45 × 10⁻⁸
Ionizing radiationkBq Co-60-eq/kWh3.95 × 10−33.96 × 10−34.08 × 10−34.45 × 10⁻³
Ozone formation, human healthkg NOx-eq/kWh9.83 × 10−59.09 × 10−51.05 × 10−41.20 × 10⁻⁴
Fine particulate matter formationkg PM2.5-eq/kWh1.09 × 10−49.39 × 10−51.04 × 10−41.23 × 10⁻⁴
Ozone formation, terrestrial ecosystemskg NOx-eq/kWh1.01 × 10−49.26 × 10−51.10 × 10−41.25 × 10⁻⁴
Terrestrial acidificationkg SO2-eq/kWh2.25 × 10−42.07 × 10−42.21 × 10−42.47 × 10⁻⁴
Freshwater eutrophicationkg P-eq/kWh3.55 × 10−54.62 × 10−53.78 × 10−54.07 × 10⁻⁵
Terrestrial ecotoxicitykg1,4-DCB-eq/kWh4.69 × 10−14.62 × 10−11.171.13
Freshwater ecotoxicitykg1,4-DCB-eq/kWh1.11 × 10−21.30 × 10−21.16 × 10−21.17 × 10⁻²
Marine ecotoxicitykg1,4-DBC-eq/kWh1.43 × 10−21.69 × 10−21.53 × 10−21.54 × 10⁻²
Human carcinogenic toxicitykg1,4-DBC-eq/kWh6.50 × 10−34.19 × 10−34.17 × 10−34.33 × 10⁻³
Human non-carcinogenic toxicitykg1,4-DBC-eq/kWh1.46 × 10−12.00 × 10−11.63 × 10−11.64 × 10⁻¹
Land usem2a crop-eq/kWh1.13 × 10−39.60 × 10−41.23 × 10−31.23 × 10⁻³
Mineral resource scarcitykg Cu-eq/kWh6.60 × 10−48.21 × 10−45.54 × 10−45.42 × 10⁻⁴
Fossil resource scarcitykg oil-eq/kWh1.04 × 10−29.40 × 10−31.08 × 10−21.27 × 10⁻²
Water consumptionm3/kWh4.51 × 10−43.22 × 10−41.35 × 10−31.17 × 10⁻³
Table 3. Results of the techno-economic assessment for the studied PV systems.
PV TechnologyCell Efficiency [%]Frame Area [m2]Capacity Per Unit [W]Total Area [m2]Cost [€/kW]Capacity Factor [%]Total Electricity Exported to Grid [MWh]Annual Revenue [€/yr]IRR [%]Payback Time [years]
Crystallinesc-Si171.1820017.7160020.6162.654211.510
mc-Si12.31.0212524.5150020.6162.654212.39.3
Thin-filmCIS10.60.9410028.2160020.2159.3531129.6
a-Si6.10.825049.2150021.8171.657213.18.8
Table 4. Aggregated LCA inventory results for the studied solar thermal systems.
Impact CategoryUnit (per m2)Flat Plate CollectorVacuum Tube Collector
Global warmingkg CO2-eq/kWh2.38 × 10−22.22 × 10⁻²
Stratospheric ozone depletionkg CFC11-eq/kWh1.29 × 10−81.36 × 10⁻⁸
Ionizing radiationkBq Co-60-eq/kWh1.61 × 10−31.88 × 10⁻³
Ozone formation, human healthkg NOx-eq/kWh6.50 × 10−56.89 × 10⁻⁵
Fine particulate matter formationkg PM2.5-eq/kWh8.78 × 10−58.61 × 10⁻⁵
Ozone formation, terrestrial ecosystemskg NOx-eq/kWh6.66 × 10−57.07 × 10⁻⁵
Terrestrial acidificationkg SO2 eq/kWh2.07 × 10−42.01 × 10⁻⁴
Freshwater eutrophicationkg P-eq/kWh3.89 × 10−54.16 × 10⁻⁵
Terrestrial ecotoxicitykg1,4-DCB-eq/kWh8.55 × 10−19.31 × 10⁻¹
Freshwater ecotoxicitykg1,4-DCB-eq/kWh6.42 × 10−36.94 × 10⁻³
Marine ecotoxicitykg1,4-DBC-eq/kWh9.27 × 10−31.00 × 10⁻²
Human carcinogenic toxicitykg1,4-DBC-eq/kWh6.56 × 10−36.53 × 10⁻³
Human non-carcinogenic toxicitykg1,4-DBC-eq/kWh2.24 × 10−12.44 × 10⁻¹
Land usem2a crop-eq/kWh1.25 × 10−31.52 × 10⁻³
Mineral resource scarcitykg Cu-eq/kWh1.02 × 10−31.03 × 10⁻³
Fossil resource scarcitykg oil-eq/kWh5.45 × 10−35.38 × 10⁻³
Water consumptionm3/kWh2.39 × 10−42.33 × 10⁻⁴
Table 5. Results of the techno-economic assessment for the studied solar thermal collectors.
Solar Collector TypeAperture Area [m2]FrUL [(W/m2)/°C]Cost [€]Total Energy Saved [kWh]Total Energy Saved Per Aperture Area [kWh/m2]Solar Fraction [%]Annual Savings [€/yr]IRR [%]Payback Time [years]
Flat plate2.324.690027,26011,75055.335241.82.6
Vacuum tube2.611.7130029,98011,48762.734128.53.8
Table 6. Comparative life cycle carbon footprint results for the studied renewable energy systems.
Carbon Footprint [g CO2-eq/kWh] *ReferencesCarbon Footprint [g CO2-eq/kWh] **Total Emitted GHG [g CO2-eq]Total Avoided GHG [g CO2-eq]Lifetime GHG Balance [g CO2-eq]Total Energy Produced [kWh]
a-Si PV26–60 [40,42,43,44]43.57.47 × 1061.24 × 1081.17 × 1081.72 × 105
CIS PV39.56.29 × 1061.15 × 1081.09 × 1081.59 × 105
mc-Si PV44.37.20 × 1061.17 × 1081.10 × 1081.63 × 105
sc-Si PV52.48.52 × 1061.17 × 1081.08 × 1081.63 × 105
Flat plate collector20–45[42,44]23.83.44 × 1062.60 × 1072.26 × 1073.12 × 104
Vacuum tube collector22.22.68 × 1062.50 × 1072.23 × 1073.54 × 104
Wind9–35[40,42,43,44]
Geothermal plant6–79[40,43,44]
Hydroelectric1–24[42,43,44]
Nuclear4–110[40,44,45]
Natural gas410–650[40,41,44]
Oil778[40,41,44]
Coal740–1050[40,41,44]
* Results based on bibliographic references, ** Results from this study.

