Review

Systematic Review of Integrated Sustainable Transportation Models for Electric Passenger Vehicle Diffusion

by
Esteban Lopez-Arboleda
1,
Alfonso T. Sarmiento
1,* and
Laura M. Cardenas
2
1
Grupo de investigación en Sistemas Logísticos, Facultad de Ingeniería, Universidad de La Sabana, Campus del Puente del Común, Km. 7, Autopista Norte de Bogotá, 250001 Chía, Colombia
2
Departamento de Ingeniería Industrial, Universidad de Antioquia, Calle 70 No. 52-21, 050010 Medellín, Colombia
*
Author to whom correspondence should be addressed.
Sustainability 2019, 11(9), 2513; https://doi.org/10.3390/su11092513
Submission received: 25 February 2019 / Revised: 26 March 2019 / Accepted: 16 April 2019 / Published: 30 April 2019

Abstract

:
Ensuring energy security, stopping climate change, and improving urban air quality are the three main challenges of this century that are being addressed by governments globally. The transportation sector contributes significantly to these issues. Sustainable transport involves the consideration of three dimensions—economic development, environmental preservation, and social development—and one of its aspects is the focus on the transition towards electric vehicles. The sustainable transportation is a complex system with multiple relationships and feedback between their elements. Understanding this complexity in an integrated and holistic manner is a challenge that must be addressed. To obtain insight into this complexity, we perform a systematic review of studies in which the demand and supply components of the passenger transportation sector were modelled in an integrated manner along with the dimensions of sustainability. All the reviewed previous studies had taken into consideration both the economic and environmental dimensions; however, only a few had also considered social development. The holistic and systematic integration of the dimensions of sustainability along with their relationships and feedback would facilitate a better understanding of the transportation sector and promote the development of better policies for improving the diffusion of passenger electric vehicles.

1. Introduction

Ensuring energy security, stopping climate change, improving urban air quality, and alleviating human health issues related to air quality are the main challenges that governments should address in this century. The transportation sector contributes greatly to these problems [1,2,3,4]. According to the Intergovernmental Panel on Climate Change [5], the transportation sector contributes to 14% of global greenhouse gas emissions. The World Health Organization [6] estimates that 3 million deaths and 85 millions of disability-adjusted life years can be associated with urban air quality. Governments have identified the diffusion of hybrid and electric vehicles (EVs) as a possible solution to these problems [7,8,9,10].
To understand these problems, it is necessary to consider that transportation systems are multidimensional and that their issues are related to their inner structure. This multidimensionality is related with the different stakeholders and their interests and objectives in the transportation system and the various sectors involved. Moreover, decisions made by one stakeholder may create difficulties in another part of the system because of the feedback interactions and relationships between the stakeholder and system [11,12].
These stakeholders can be classified according to their function in the transportation sector and the process of diffusion of EVs. On the demand side, we find the consumer who requires vehicles, fuels, technical services, and infrastructure from the market. On the supply side, we find fuel producers, fuel distributors, vehicle producers, and vehicle dealers who offer vehicles, fuels, and technical services to the market. We can also find governmental actors, who formulate policies and regulations to regulate the interactions between supply and demand as well as promote a specific type of technology or behaviour according to the political agenda of each country [7,13].
As the transportation sector is a complex system, owing to the multiple interactions within the system, the environment in which it is immersed is also complex. In this sense, the study of sustainability should also be considered a system owing to its complexity and the interrelations between its three dimensions (economic, environmental, and social) [14,15,16,17]. The relationships and feedback of these dimensions are indivisible and must be analysed in an integrated manner [18,19].
Various methodologies have been developed to evaluate the dimensions of sustainability. The objective of the sustainability assessment is to understand the impacts of a product, company, sector, or system in terms of three aspects: economic, environmental, and social [20,21,22]. However, the majority of these methodologies do not take into account the relationship between these aspects, which may affect the performance indicators of the assessment [20,21]. One of the methods that takes into consideration some of the interactions between the three aspects is the life cycle sustainability assessment (LCSA), which is an integrated framework of different techniques, such as life cycle assessment (LCA), life cycle costing (LCC), and social LCA [22,23,24]. Onat et al. [24] proposed a novel approach of the LCSA using system dynamics (SD) to understand the various interactions between the economic, environmental, and social performance of the system.
As previously mentioned, the transportation sector is a complex system and achieving sustainability is a complex problem, both of which have multiple relationships between their elements, and the decisions taken to solve a problem in one part of the system may generate difficulties elsewhere. Therefore, it is necessary to determine the possible consequences of the solutions in both the transportation system and in the sustainable performance indicators.
This systematic literature review analyses the existing models and frameworks that integrate the vehicle and energy supply, consumer and market behaviour, and the dimensions of sustainability for improving the diffusion of passenger EVs. The analysis is performed from the point of view of modelling, the variables considered, and the relationships between the actors of the system, and its objective is to understand the level of integration that the existing models and frameworks comprised and to determine the relationships and feedbacks that have not been previously studied.
This review is organised as follows. Section 2 presents the methodology used for this systematic literature review. Section 3 describes the results of the systematic review. These results are presented in five subsections, each of which, respectively, describes the bibliometric results, discusses the demand side of the system, presents the results associated with the fuel and vehicles supply system, describes how sustainability has been modelled, and presents how the elements of the system have been integrated. In the final section, we present the main findings of this systematic review and suggest directions for future research work.

2. Methodology

The methodology used in this article follows the sequence prescribed by Tranfield and Denyer [25] for a systematic review based on an evidence-informed approach and the specific guidelines for systematic reviews in supply chain management proposed by Durach et al. [26]. After the aim of the systematic literature review was defined, we selected research papers—while excluding conference papers and proceedings—published in peer-reviewed journals indexed in the following databases for review: Scopus and Web of Science.
The search was conducted using the search strings listed in Table 1. and while limiting the search from January 2013 till June 2018. As the research aim is to analyse articles that have integrated elements of both sustainability and the diffusion process of passenger EVs with the related supply chains in the transportation sector, we only include articles that had considered at least two aspects of sustainability, at least two stakeholders from the supply side, and the consumer or market share. The term “passenger vehicles” was considered by excluding the terms “public transport”, “freight”, and “commercial” from the search of all types of EVs in the search strings.
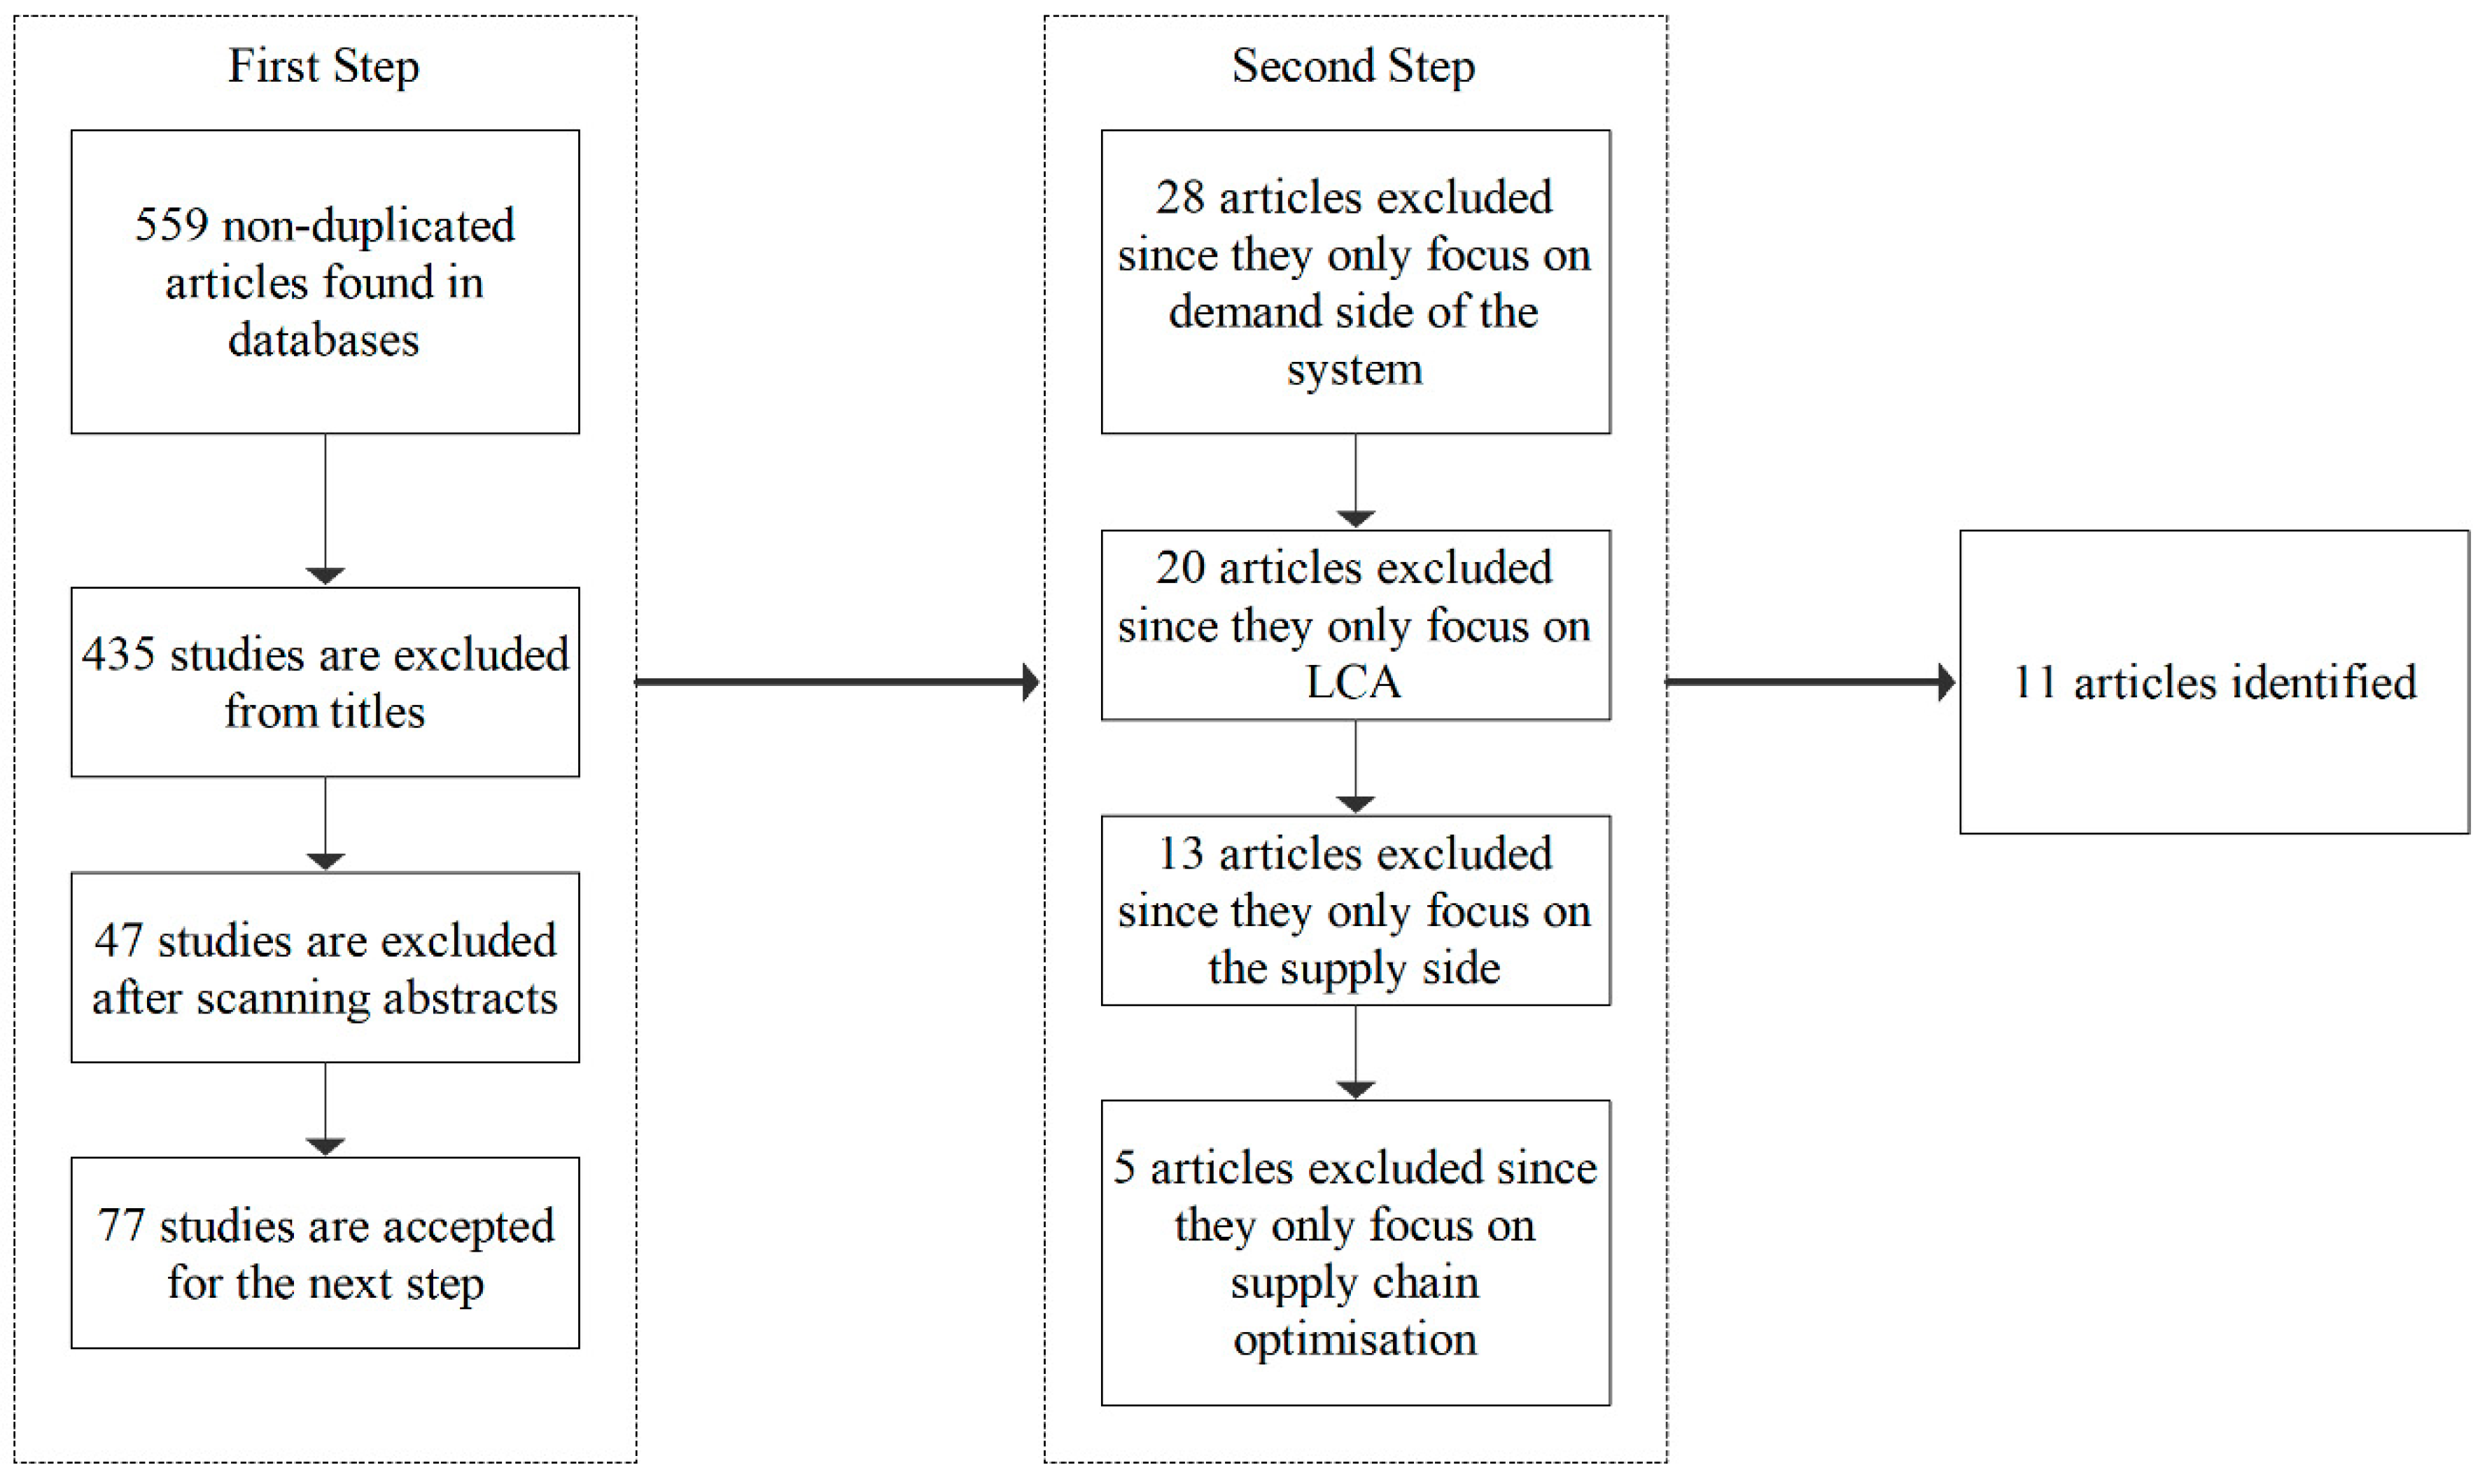
A two-step process was used to select the studies for this review. In the first step, a total of 559 non-duplicated articles were identified. From these studies, 435 articles were eliminated owing to their irrelevant titles and 47 were eliminated after verifying that the abstract was not in the scope of this review. The remaining 77 articles are considered in the second step.
We perform a full-text review of these articles. From this full review and using the inclusion criteria, 28 articles were excluded as they only focus on the demand side of the system and did not analyse the system in an integrated manner, 20 only perform an LCA of the system without considering the various stakeholders of the supply side or the demand side, 13 only considered the supply side of the system without considering the demand or the dimension of sustainability, and 5 focused exclusively on supply chain optimisation using only economic indicators. A total of 11 articles were identified to be included in this study. The identification process described is shown in Figure 1.

3. Results and Discussion

This section is divided into five subsections. In the first subsection, we present the selected studies and the stakeholders and sustainability dimensions included in each one of the studies that were identified. In the second subsection, we present how the demand side of the system has been modelled in these studies; in the third, we analyse how the supply side of the system has been modelled; and in the fourth, we present how the dimensions of the sustainable development have been included and specify which performance indicators were used. Finally, we analyse how the integration of the demand, supply, and sustainability has been considered.

3.1. Selected Studies and General Results

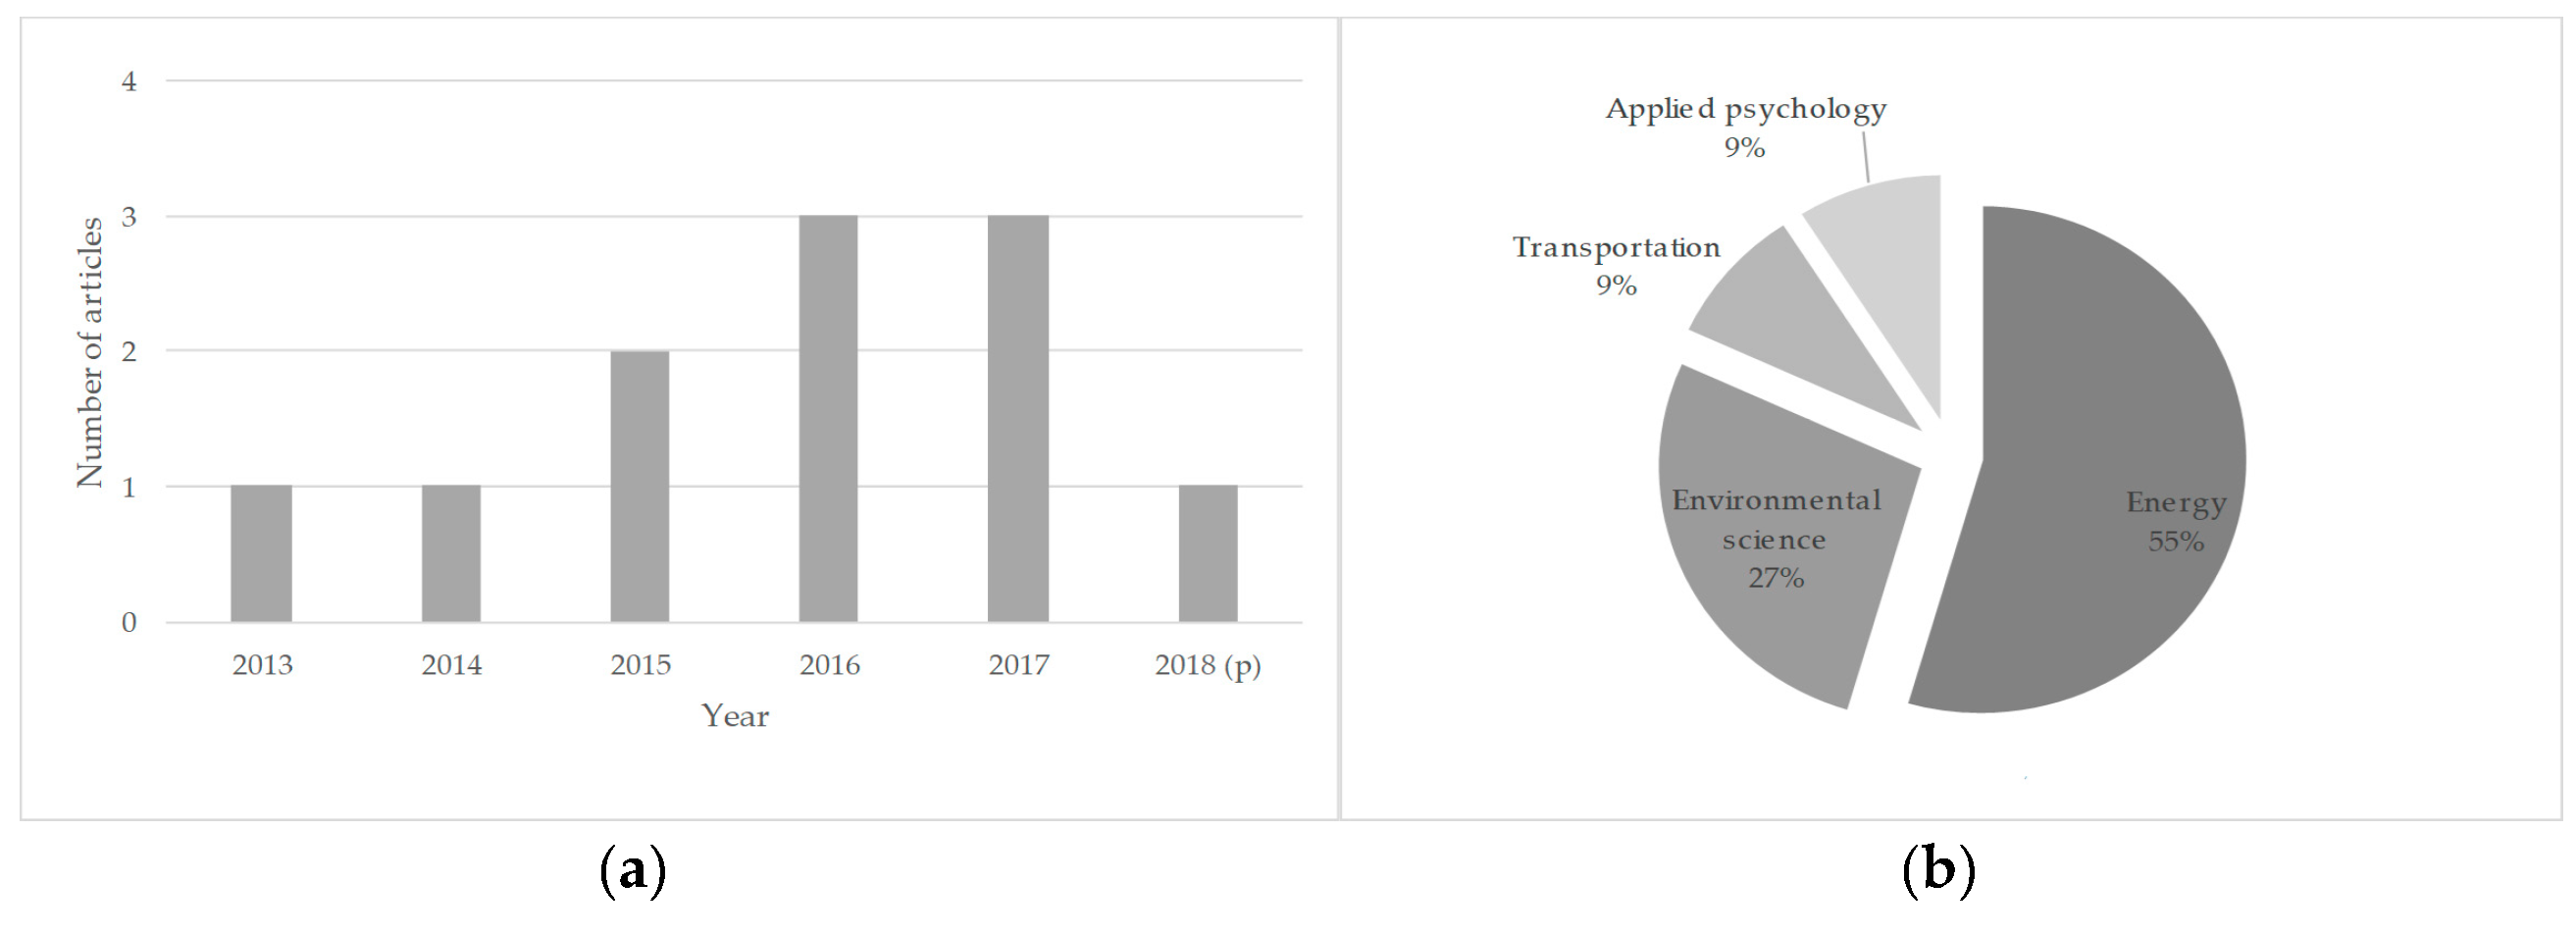
The studies, year of publication, journal, and journal main subject area are presented in Table 2. The studies selected using the methodology described above were primarily published in the journals Energy, Energy Policy, and Journal of Cleaner Production.
Including the sustainable performance index in the integrated modelling of the transportation system for the diffusion of EVs is a novel and increasingly popular research topic in the last five years, as can be observed in Figure 2a. We can also observe, from Figure 2b, that the studies were primarily published in energy-related journals.
In the previous section, we defined the inclusion criteria considered to select the articles. Table 3 lists the stakeholders and aspects of sustainability included in each of the studies selected.
In the above table, we observed that all the studies have taken into consideration the market share and the economic and environmental indicators. Similarly, only three articles [30,31,32] took into consideration the social dimension of sustainability of their models; however, these do not include the consumer purchase decision model.
In terms of the supply side, only one article [27] has taken into consideration all the actors. Fuel producers and fuel distributor are found in eight articles each, and six articles [27,28,29,34,35,37] considered both. Vehicle manufacturers can be found in seven of the selected articles, car dealers are found in six, and four articles [27,30,33,36] have considered both.

3.2. Demand-Side Modelling

The demand side of the transportation system has two components: the consumer and the market. The first one corresponds to understanding and modelling the behaviour of the consumer and how the consumer makes decisions regarding the selection of vehicles from among different alternatives. The second is used to understand the market share evolution.
Several reviews have already been performed on the topics of modelling the demand, modelling the market share, and forecasting the demand for EVs and the consumer preferences towards vehicles attributes [7,8,9,38,39]. These reviews can be classified into two groups. The first group corresponds to reviews of the methods and modelling techniques for consumer and EVs market share forecasting [7,39], and the second one is focused on consumer behaviours and preferences towards vehicle attributes that have been considered for modelling the consumer EVs adoption process [8,9,38].
The EVs’ market share forecasting and consumer modelling can be classified into three approaches: bottom-up models, top-down models, and hybrid models [39]. Bottom-up models represent the system by aggregating heterogeneous characteristics of individuals; top-down models represent the system while applying macroeconomic theory and econometric and optimisations techniques with aggregated economic variables; and hybrid models combine both the former approaches [39,40].
Bottom-up models represent the demand using a micro-perspective approach, and they have two characteristics [7,39]. The first characteristic is that the consumer is modelled as an individual, and the individual decision can be identified. The EVs market share is the aggregation of the individuals’ decisions and is used to determine the sales figures for each technology and, therefore, the vehicle market share. The second characteristic is that the consumer selects from a set of vehicles, the vehicle that best suits its needs and preferences [7,39]. The set of vehicles is different for each individual, and it is dynamically established according to word-of-mouth and feedback received in the individual social network [41]. Agent-based model (ABM) and discrete choice model (DCM) are considered bottom-up models as they represent the consumer in a disaggregated manner [7,39].
In the ABM, the behaviour of the system is based on the aggregation of individual decisions [7,39]. Different types of agents are included in these studies, from among which we can observe the consumer, which represents the demand for vehicles; the vehicle manufacturing companies, which represent the supply of the vehicles; the agents of the energy system representing the supply of fuels; and the government that establishes policies for regulating how the other agents act in the system [7]. This approach has two advantages. The first one states that the consumer can be characterised individually with their preferences, needs, and constraints. The second advantage is that social interactions and the effect of word-of-mouth can be modelled in detail [7,39].
In the DCM, the consumer purchase decision is modelled based on random utility theory, wherein each individual will choose an alternative from a set of choices that maximise the personal utility of the individuals [7,8,39,42]. The choice of a specific alternative is based on the preferences of the consumers, which are driven by the attributes of the vehicles and individual-related variables [8]. Several attributes of the vehicles can be found in the literature, and they have been classified into four groups: financial, technical, infrastructure, and policy attributes [8]. Likewise, several individual related variables are found in the literature, and they account for the heterogeneity of the consumers such as socioeconomic and demographic characteristics; factors from psychological theories; interpersonal influence; and mobility, residence, and car-related conditions [8]. Psychological theories comprise the use of a different set of factors to explain consumer behaviour including social norms, constructs, attitudes, perceptions, drivers, and barriers [8,9,38].
In top-down models, consumer behaviour and EVs market share forecast are modelled in an aggregated manner including the diffusion process as an important characteristic of these models. SD and general equilibrium models (CGE) are classified as top-down models [39].
In SD models, the sales figures are usually calculated as a growth rate of the vehicle stock and the market share is estimated by embedding discrete choice models to reflect the technology choice. As the interactions of the individuals are not explicitly modelled, a diffusion model is often included to capture the interactions between the individuals on an aggregated level [39].
CGE models are input–output models that optimise at the macroeconomic level and assume the existence of utility-maximising and representative individuals, a complete market without external factors, and complete information. These models use aggregated economic data and are mainly focused on the impact analysis of policies, technology change, and other external factors [39].
Based on the different modelling approaches, the selected studies were classified considering three elements: the modelling technique, diffusion process, and individual-related variables. The results are presented in Table 4.
Three studies did not consider the consumer component of the demand side [30,31,32]. In these studies, we can find other approaches to forecast the EVs market share. Günther et al. [30] proposed an optimisation model wherein the sales of each type of vehicle were decision variables, and Onat et al. [31,32] used external data from official forecasts to analyse the demand side.
As observed from the results, all the models that had taken into consideration the consumer purchase decision process use the discrete choice model (MNL and NMNL) as the main component. These models can be implemented in an agent-based simulation [27,34,35,36], an SD model [29,33,37], or CGE with a Monte–Carlo simulation [28].
The studies in which the consumer has been modelled using an ABM estimate the market share by aggregating the individual purchase decisions while following a bottom-up approach [27,34,35,36]. The studies that use SD estimate the market share by computing the growth of the vehicle stock and multiplying it by the aggregated behaviour of the consumer while following a top-down approach [29,33,37]. The CGE model calculates the vehicle demand using macroeconomic data and by applying the aggregated behaviour of the consumer [28]. Although the studies that used a top-down approach for forecasting the demand comprised the use of a discrete choice model for the consumer, this was not used at an individual level, and they are, thus, not classified as hybrid models.
All the models took into consideration the diffusion and interpersonal influence. Depending on the modelling approach, the diffusion process can be on an individual level or in an aggregated manner. When using the ABM, the interpersonal influence is an essential factor, and it is included in the individual level, and the vehicle diffusion process emerges from the aggregated behaviour of the individual [27,34,35,36]. In SD and CGE, the diffusion process is considered in an aggregated manner, and it is mainly represented using the Bass diffusion model [28,29,37]. It can also be found that the diffusion process has been modelled while only considering the market share exposure without the interpersonal influence and word-of-mouth aspect [33].
All the ABMs [27,34,35,36] took into consideration heterogeneity explicitly. These studies considered four characteristics to categorise the population and its heterogeneity, sociodemographic attributes, economic attributes, geographical attributes, and the personal attitude towards innovation. The majority of the studies use sociodemographic attributes as the main characteristic, followed by the income and geographical attributes. Only one study [28] considered the attitude of the person towards innovation as an attribute for determining the heterogeneity of the population.
To account for the preferences of the consumer, we identify the attributes that have been evaluated in the selected studies. These attributes are presented in Table 5 and are classified according to the groups proposed by Liao et al. [8].
All the studies that modelled the consumer purchase decision process have taken into consideration the financial, technological, and infrastructure attributes. It can be observed that the financial and infrastructure attributes are the main attributes used to evaluate the consumer preference and purchase decision. From the technological attributes, it can be observed that driving range and environmental performance are mainly used, and only two studies [27,36] took into consideration both these attributes.

3.3. Fuel Supply System

Two actors are considered in the fuel supply system: fuel production and fuel distribution. Different types of fuels have been considered in the studies: petrol, diesel, electricity, ethanol (E85), biodiesel (B20), compressed natural gas (CNG), biogas, and hydrogen. All the reviewed studies take into consideration petrol and electricity. Diesel was considered in five studies [27,29,33,36,37]; hydrogen in five studies [27,28,29,33,37]; both ethanol and biodiesel in four studies [27,29,33,37]; and biogas was considered in three studies [27,29,37]. Only one study [33] took into consideration CNG. Four studies [27,29,33,37] took into consideration seven of eight types of fuels, while CNG or biogas was not considered in their research scope.
Several approaches were used to model the actors of the fuel supply system. SD [27,29,31,32,37] and LCC [34,35] were used to model the producer. Using an LCC approach, the production flow, production cost, and emissions are calculated using the aggregation of the different components and resources used to produce each type of fuel. The SD approach allows for the computation of the cost of the fuels and production flows subject to resource limitations and the learning rate.
The SD, ABM, and CGE models were used to model the fuel distribution actor. The fuel distribution is mainly represented as the infrastructure associated with the distribution of each type of fuel to the consumer, such as service stations and charging stations. In an SD approach, the number of stations is represented as a level and the decision over this variable is subject to the expected demand for fuel, quantity of fuel available, and economic constraints. In an ABM approach, other types of constraints are also used, such as location and how this location can affect the diffusion process of EVs, as one of the main barriers for the diffusion process of EVs is the lack of charging stations and the visibility of these in cities and on roads [43,44]. Greene et al. [28] use a CGE model for the fuel distribution, while focusing on infrastructure deployment and investment for hydrogen fuel stations.
Five studies [27,29,34,35,37] comprised the modelling of both actors of the fuel supply system. Three of them [27,29,37] uses SD for both actors. The other two [34,35] comprised a combination of LCC and ABM. Using SD to represent both actors facilitates the integration of the production flow and distribution flow, and the costs perceived by the consumer can be explicitly determined and analysed. Using LCC and ABM facilitates the analysis of the regional effect that the location of the fuel station can have over the fuel cost. One study [30] did not take into consideration the fuel supply system as an actor in their model as the scope of their optimisation problem was the automotive supply chain.
Table 6 presents the approaches adopted to model each actor of the fuel supply system and the fuels considered.
Several variables are used to model the fuel supply system. All the studies that had considered this system comprised the use of the fuel cost as the primary variable. The fuel availability was considered as the number of stations for each type of fuel available in the system and is the second most used variable. Only two studies [31,32] did not take into consideration the fuel availability as a variable as they did not consider the fuel distribution actor in their models. Only three studies [27,29,37] included all the variables considered in this review in their models. The relationships of these variables with the other components are reviewed in an integrated manner in Section 3.6.
Table 7 presents the variables that had been used to model the fuel supply system and which articles had taken them into consideration. We only list the studies that had taken into consideration the fuel supply system in their models.

3.4. Vehicle Supply System

The vehicle supply system can be grouped into two main actors: the original equipment manufacturers (OEMs) and the car dealer. OEMs make decisions regarding the number of vehicles produced and the vehicle attributes for maximising their profit [13,27,45,46,47,48]. Car dealers seek to maximise their profit by offering various vehicle types. They order vehicles from local and international OEMs according to the expected demand for each type of vehicle [27]. They also advertise new vehicles to maximise the expected sales [33].
Different powertrains have been considered in the studies: internal combustion engine (ICE), hybrid electric vehicle (HEV), plug-in hybrid electric vehicle (PHEV), battery electric vehicle (BEV), and fuel cell vehicles (FCV). All the studies took into consideration the ICE and electric engine (P/H/EV). Only five studies [27,28,29,33,37] considered fuel cell vehicles in their models.
Several approaches have been found for modelling the OEM. We can use SD models, CGE models, optimisation models, and LCC models. In the LCC model [34,35], the retail price of a vehicle is calculated by aggregating the price of each component of the vehicle toward the life cycle of the product. Greene et al. [28] used a CGE approach to model the vehicle supply system. In this approach, the price of the vehicles is calculated using learning curves and the number of vehicles sold. Günther et al. [30] considered these actors as echelons in the sustainable supply-chain network optimisation problem.
Three studies [27,33,36] used SD to model the OEM; these studies also considered the car dealer actor, and they modelled both actors in an integrated manner. This approach allows for the constant exchange of production flow and information between the OEM and the car dealer actors, using the stock of the vehicle on the car dealer agent as a linking component.
To model the car dealers, we can use the SD and optimisation models, as SD is the most used approach. Five articles [27,31,32,33,36] comprise the use of SD for modelling the car dealers. This approach allows the integration flow of vehicles and information from the dealer to the demand and forms the demand for the dealer, while using the sales flow and demand as linking variables between the actors.
Table 8 presents the approaches used to model each actor of the vehicle supply system and the powertrains considered.
Several variables have been used to model the vehicle supply system. Sales flows and retail price are the two main variables used in the studies. Another important variable is research and development and its relationship with the production cost and technical attributes of the vehicles. This relationship is important as the consumers evaluate these attributes (cost and technical attributes) according to their preference for selecting one type of vehicle [27,28,33,36]. Other variables used in the studies are the number of vehicles produced by the OEM, the expected demand for vehicles, and the distribution cost [27,30,33]. Only Shafiei et al. [27] considered all the variables analysed in this review. The relationships and interactions of these variables in the transportation system and the dimension of the sustainability are analysed in an integrated manner in Section 3.6. Table 9 presents the variables used to model the vehicle supply system and which articles had considered them.

3.5. Sustainability Assessment

In this section, we present the key performance indicators used in the studies, grouped by the dimension of the sustainability to which they are associated. All the studies comprised the use of economic and environmental indicators, while only three studies [30,31,32] comprised the use of social indicators.
In terms of the economic dimension, we found that the market share composition is the most used key performance indicator in nine of eleven studies, followed by fuel consumption and total cost, both in six of eleven studies. The other two indicators, the gross domestic product (GDP) and government revenue and the environmental damage cost are only used in three [31,32,37] and two studies [34,35], respectively.
The market share indicator is related to the evolution of each vehicle over time, which is the key objective of the diffusion process. The fuel consumption represents the quantity of energy used in the case of each type of technology, and it is associated with the energy security of the region in which the study is focused. The variables of GDP and government revenue are linked together and represent the macroeconomic growth of the region of study. The environmental damage cost is related to the cost associated with climate change and air pollution and affects the macroeconomic equilibrium of the system.
Table 10 presents the indicators considered by the selected studies. In this table, it can be observed that none of the studies took into consideration all the indicators, while the maximum number of economic indicators used is three, and only six studies [31,32,33,34,35,37] had considered this number of indicators. The other five studies [27,28,29,30,36] considered two indicators.
In terms of the environmental dimension, the emission of greenhouse gases (GHG) in the operation phase of the vehicles is the primary environmental indicator. Only the study of Kieckhäfer et al. [36] lacked an explicit evaluation of the GHG emission in the operation phase. They estimated the energy use and fuel consumption and inferred that a reduction in GHG emissions was caused by the energy use; however, they did not estimate the value of this reduction. Along with the GHG emissions in the operation phase, the estimation of energy use is the second most-used variable in the studies.
We can see from Table 10 that the studies that analysed the fuel consumption as an economic indicator also analysed the energy use due to the direct relationship between them. We considered these two indicators independently as the fuel consumption is related to the energy security, which is a macroeconomic indicator, and the energy use is related to the energy efficiency of the vehicles, which is an environmental indicator.
The GHG emissions in the production phase for both vehicles and fuel production was studied in four articles [31,32,33]. Günther et al. [30] in their optimisation problem only considered the GHG emissions for the production of the vehicle. All these studies comprise an estimation of the carbon footprint of the supply chains and the operation of vehicles using a life cycle perspective.
Other environmental impacts were assessed in the selected studies. We found that the impact of the operation of vehicles on urban air quality was estimated using the emissions of volatile organic carbon, particulate matter, and nitrous oxide [28,31,32]. Onat et al. [31,32] also considered the effect of these indicators in the production phase and evaluated the effect on the air quality using a life cycle perspective.
Lastly, we found that the water footprint of the fuel supply chain was considered in two studies [34,35]. They evaluated the water consumption and water withdrawal in the production phase of the fuels.
Table 11 lists the articles that included the aforementioned indicators. None of the selected articles took into consideration all the indicators, and only two studies [31,32] considered the majority of the indicators by using a life cycle perspective, while analysing both the production and operation phases and the GHG and air pollutants.
In terms of the social dimension, only three studies [30,31,32] considered indicators from this dimension in their models. Günther et al. [30] analysed employment as part of the objective function in the optimisation problem. They sought to minimise this indicator, which is calculated as the sum of dismissals and jobs created in each production process of the supply chain over all the locations and periods of time.
Onat et al. [31,32] also considered employment as an indicator of the system. This indicator depends on the economic performance of the system. They also considered two additional social indicators: human health and public welfare. To evaluate human health, they adjusted the life expectancy due to mortality and morbidity caused by climate change and air pollutants. In the case of public welfare, they considered the human development index (HDI), which is the geometric average of the income, education, and life expectancy indexes. The relationships of these indicators and the system are analysed in Section 3.6.2.
3.6. Integrated Modelling

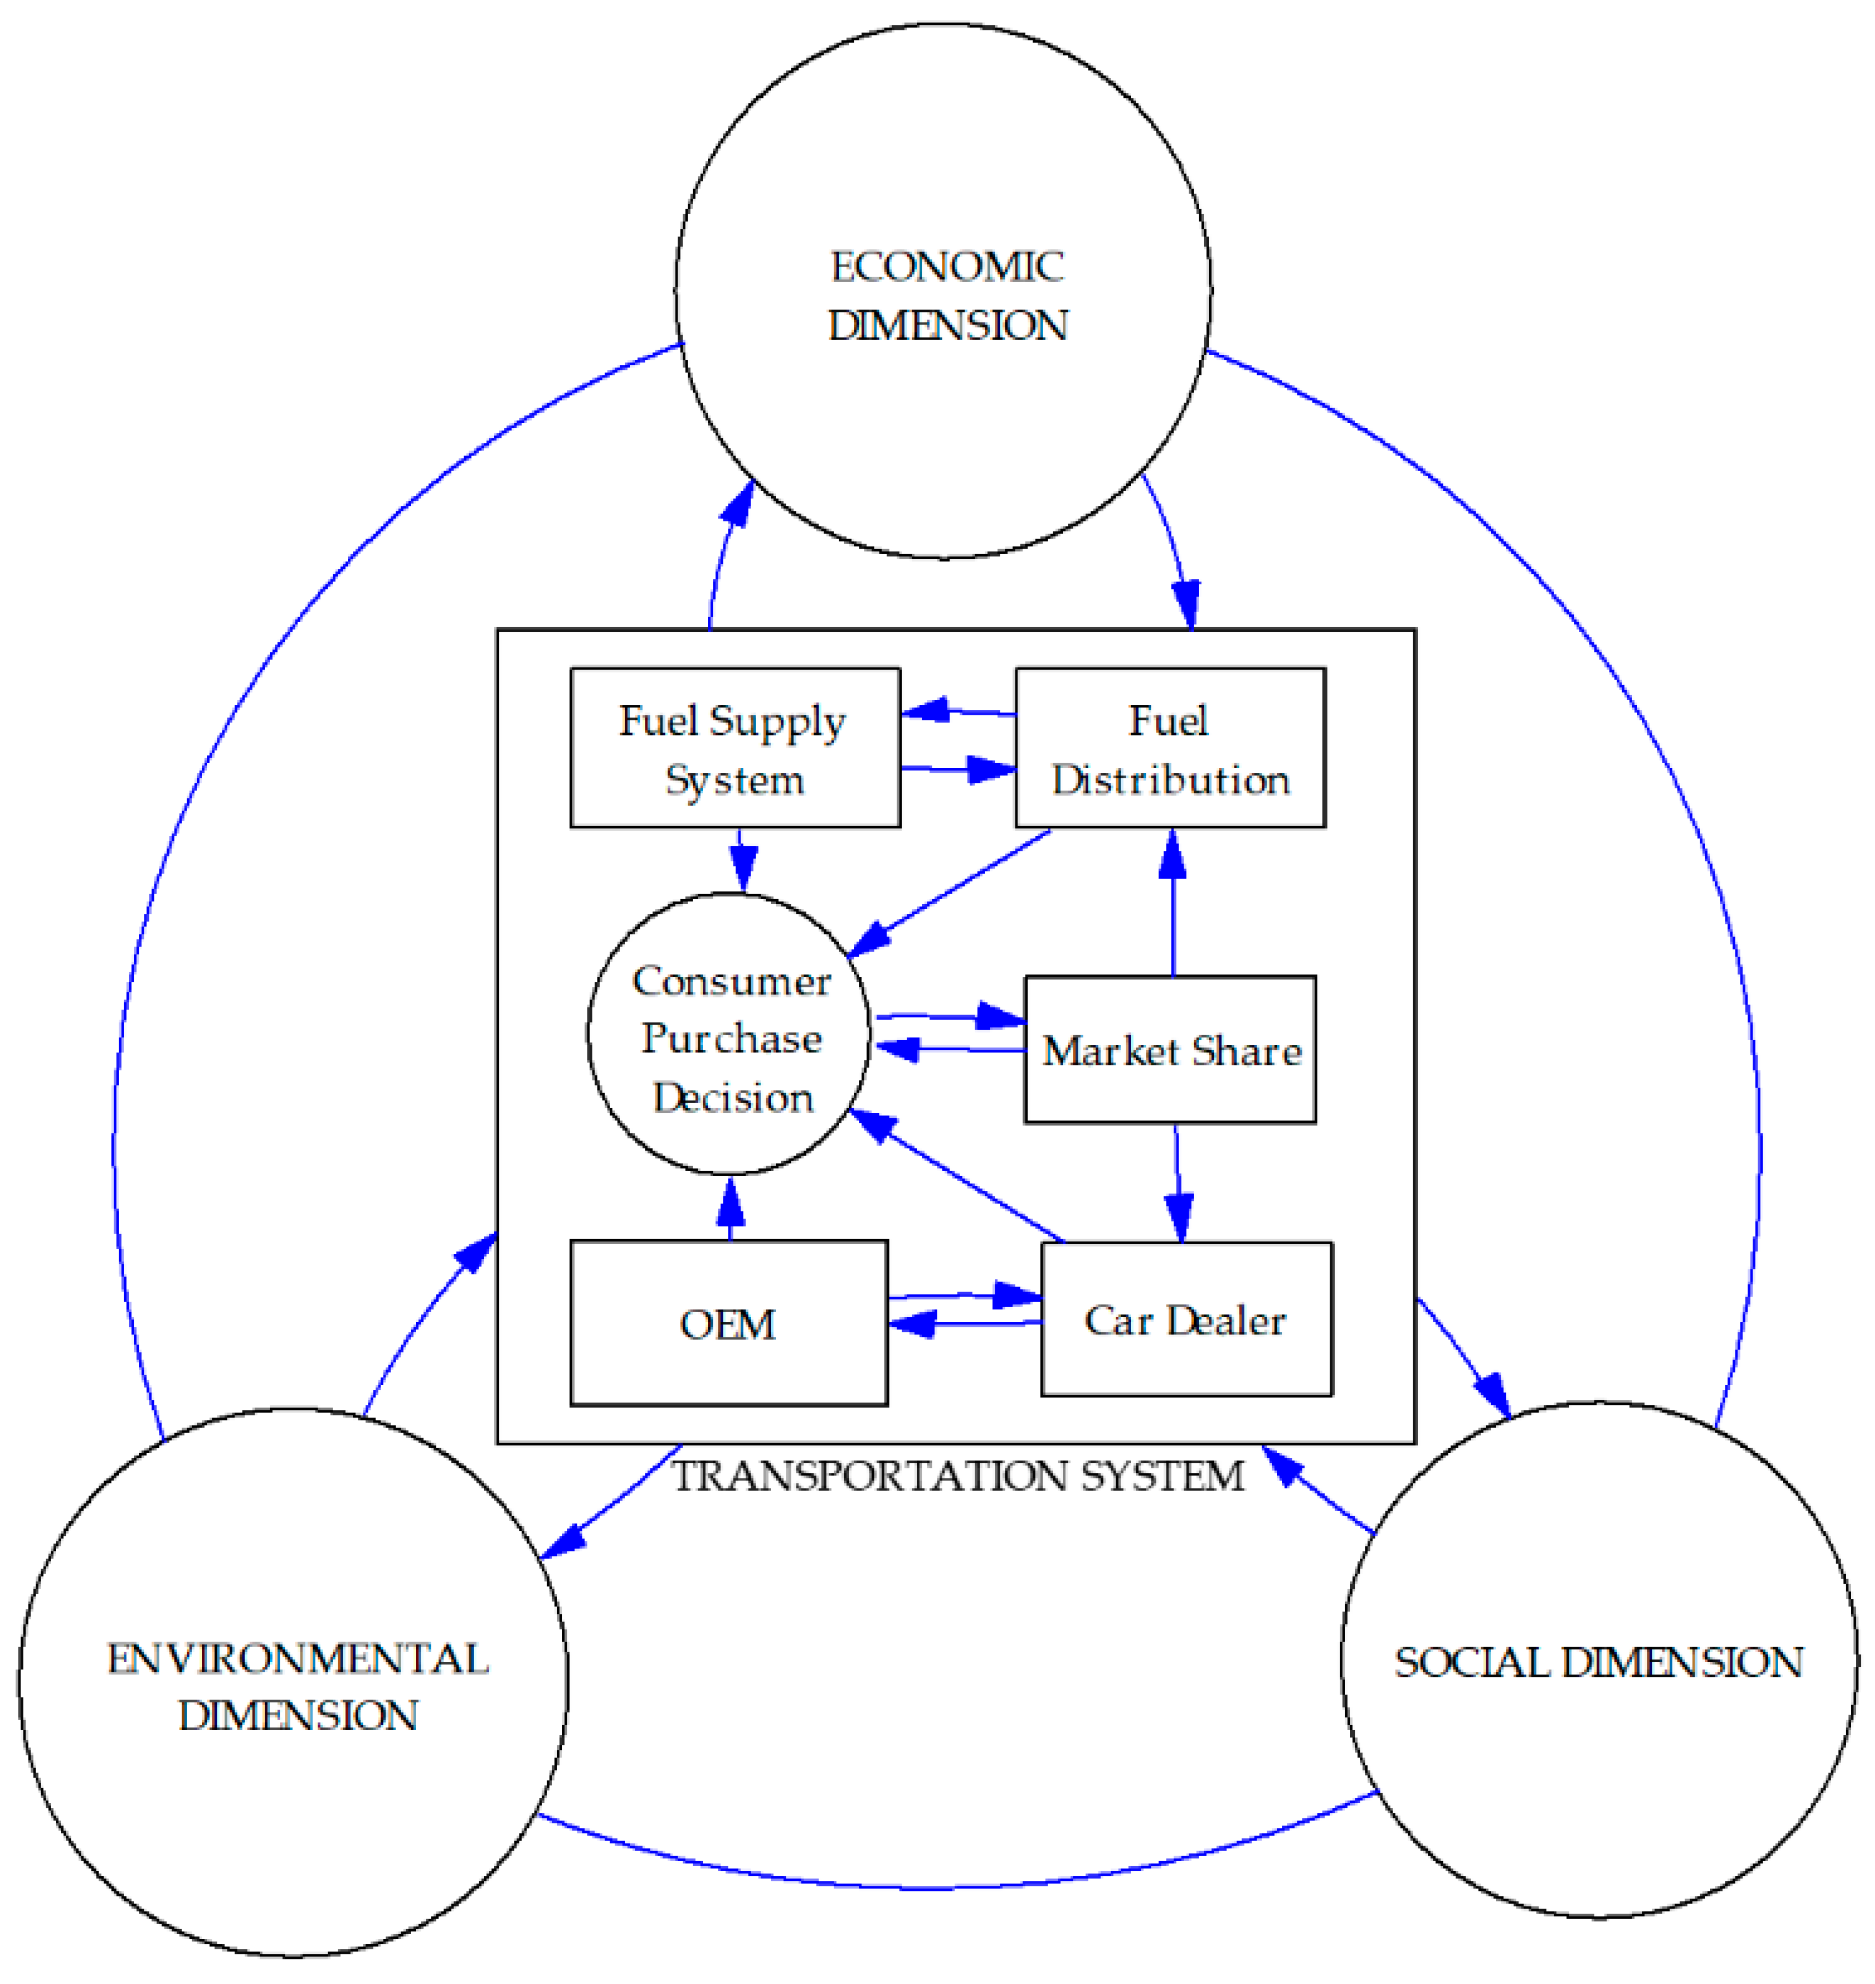
In this subsection, we analyse the main linking variables and relationships between the supply, demand, and sustainability components of the system. The integrated system is represented in Figure 3. This subsection is divided into two parts. In the first part, we analyse the relationships between the supply and demand components of the passenger transportation sector, and in the second part, we analyse the interaction of the passenger transportation sector and the dimension of sustainability.

3.6.1. Supply and Demand Interactions

As stated in the previous sections, there exist several variables for modelling each component of the system. These variables are also linked to each other and across the different actors of the system. These relationships determine the behaviour of the passenger vehicle system. We can identify two general types of interactions. The first one is from the demand to the supply system, and the second one is from the supply side to the demand. Similarly, integrating the supply and demand in the passenger vehicle system implies the integration of the modelling approaches.
The first interaction is found in all the studies. The demands for fuel and vehicles are the main linking variables for this system. The demand for vehicles is considered in all the studies, and the demand for fuel is only considered if the fuel supply system is modelled.
The second type of interaction is only found if the consumer is explicitly modelled. The actors of the vehicle supply system send the information of the retail price and technical attributes of the vehicles to the demand, and the fuel supply system sends the information related to the fuel availability and fuel price [27,28,29,33,34,35,36,37].
This interaction affects the behaviour of each component of the system. From a consumer perspective, the technical attributes and retail price of the vehicles that are given by the vehicle supply system and the fuel price and fuel availability given by the fuel supply system determine the type of technology that the consumer purchases [27,28,29,33,34,35,36,37].
From a supply perspective, the demand of vehicles determines the retail price [27,28,29,33,34,35,36,37], the inventory of the vehicles [27], and the learning process of the OEMs for improving the technical attributes and production cost of the vehicles [27,28,33,36]. The demand of fuel determines the deployment of charging stations and fuel stations [27,28,29,33,34,35,36,37], the growth and learning process of the fuel producers [27,29,37], and the fuel price [27,28,29,33,36,37].
We can identify another type of relationship from the demand to the supply systems in the studies that did not model the consumer [30,31,32]. In the study by Günther et al. [30], the demand of each technology is a set of dynamic constraints in the optimisation problem and they determine the quantity and location where the technologies are produced. In the study by Onat et al. [31,32], the demand for fuel and vehicles determines the effect on the dimension of the sustainability and the feedback between them (see Section 3.6.2 for details).
From a modelling perspective, we identified three integrated approaches: optimisation models, top-down models, and hybrid models. Günther et al. [30] proposed an optimisation problem for the automotive supply chain, using the quantity produced of each technology in each location as a decision variable in their model, while using the demand of vehicles as an exogenous variable.
In terms of top-down integrated modelling, we can identify three cases. The first one integrates CGE models with a discrete choice model for the consumer [28]. The second type integrates the exogenous market share forecast in an SD environment [31,32]. Moreover, the third approach corresponds to the integration of the discrete choice model for the consumer in an SD environment [29,33,37]. As stated in Section 3.6.2, we considered this approach as top-down as the consumers are not modelled as individuals but in an aggregated manner.
Lastly, we observed that some studies comprised the use of hybrid modelling when the transportation sector was analysed in an integrated manner. We identified two types of hybrid models. The first type integrates the ABM with SD [27,36], and the second integrates the ABM with the LCC and LCA methodologies [34,35]. Table 12 presents the various modelling approaches used for each actor of the transportation system and the classification of the integrated models.

3.6.2. Transportation Sector and Sustainability Interactions

Different relationships between the transportation system and the dimensions of sustainability can be found in the studies. In this subsection, we analyse how the selected studies integrate the dimensions of sustainability in their model and the integration level of the system and determine which of the relationships and feedback loops are found in the studies.
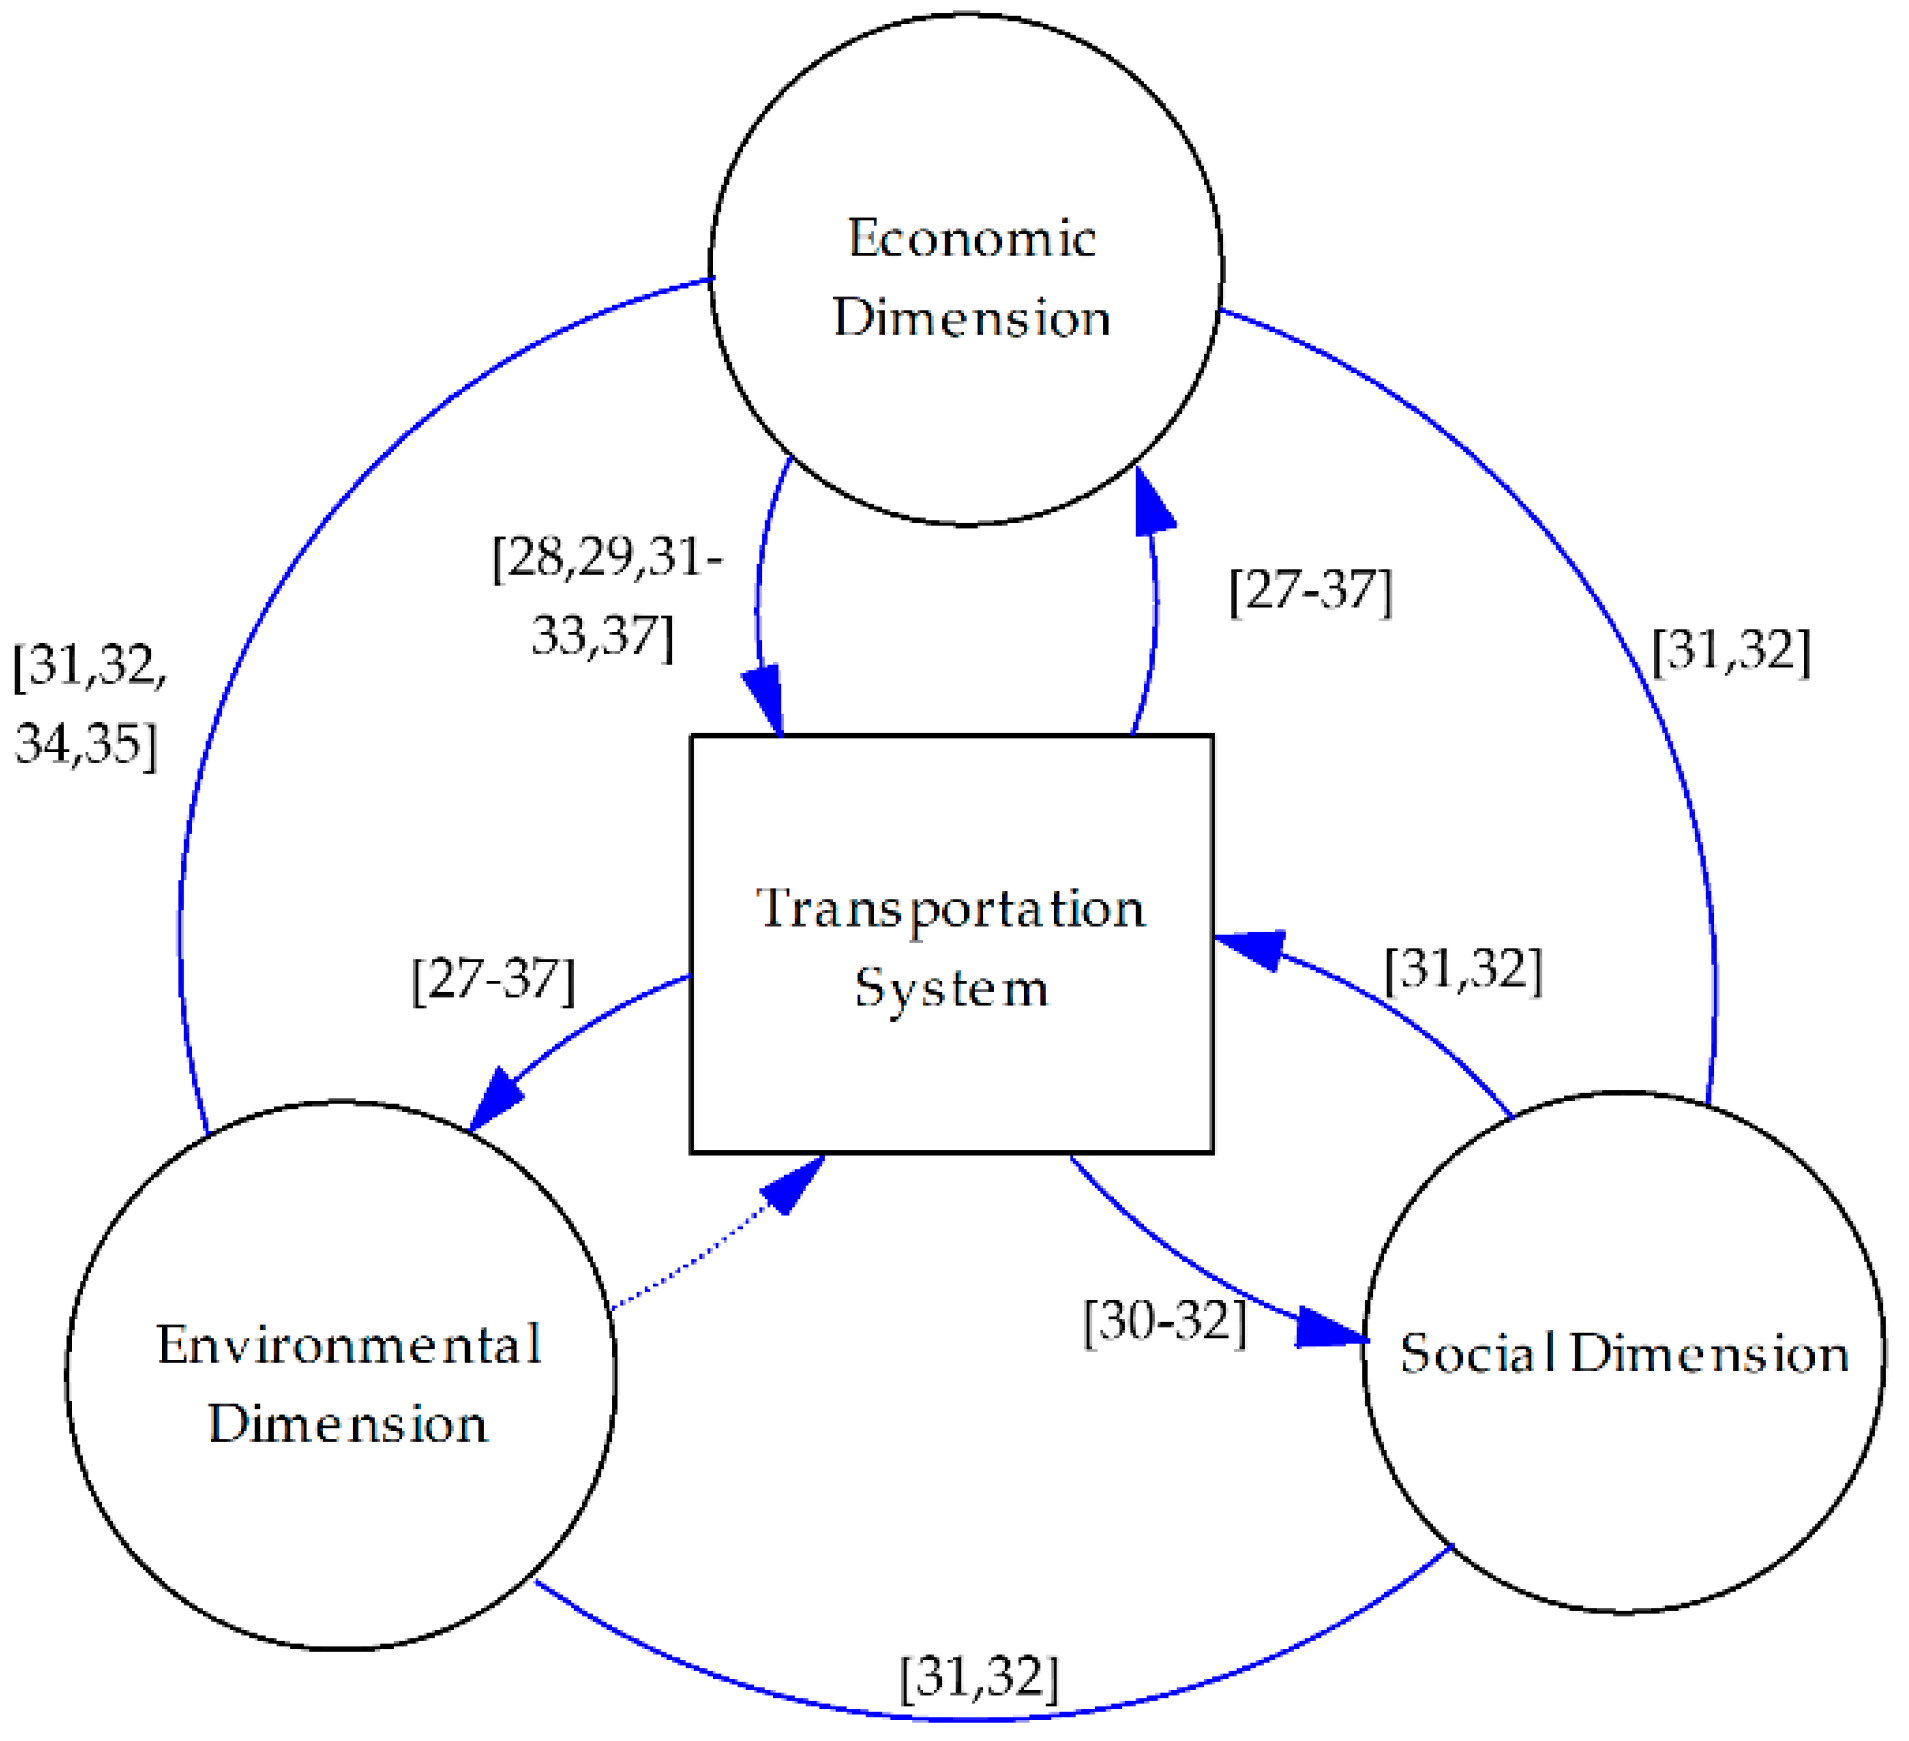
The majority of the studies include the sustainability assessment indicators as endpoint variables of the system, without any relationship between them no any feedback from these variables and the system. Only Onat et al. [31,32] took into consideration the sustainability in an integrated manner. In Figure 4, we present the relationships identified in the selected studies between the transportation system and dimensions of sustainability and between the dimensions. None of the selected studies considered the relationship between the environmental dimension and the transportation system.
The interactions with the economic dimension are mainly related to the sales figures and fuel consumption. In the first case, the market share is estimated from the sales figures [27,28,29,33,34,35,36,37], and the sales figures are related to the economic growth [28,29,31,32,33,37], which can be calculated endogenously [31,32] or be an exogenous parameter [28,29,33,37]. The fuel consumption is associated with the on-road fuel efficiency of the vehicles and the yearly annual distance travelled [27,29,31,32,37].
The GHG emissions and energy use are the two main environmental indicators. These indicators are related to fuel consumption. GHG emissions are estimated using emissions factors and fuel consumption. For the energy use, it is calculated using the fuel efficiency and the annual distance travelled. As mentioned previously, the fuel consumption is related to energy security, and energy use is associated with energy efficiency. Another environmental indicator that has been identified in some studies is the environmental damage cost, which is the economic impact of climate change. The effect of GHG on the economic dimension can be considered as a cost [34,35] or an economic impact [31,32]. In both cases, it shows the relationship between the environmental and economic dimensions.
In terms of the social dimension, two main interactions are identified: public welfare and employment. The public welfare was estimated using the HDI, which relates the life expectancy, income, and social education level. The life expectancy index, which is also related to human health, is affected by environmental impacts due to climate change and air pollution. The income index and the education index are estimated using the GDP and economic performance of the system. The public welfare impacts the population and determines the driving behaviour and need for transportation, which in turn affects the market [31,32]. The employment was estimated using the economic growth and is used to determine the annual vehicle distance travelled, which affects the transportation system behaviour [31,32].

4. Conclusions

In this paper, we analysed different models and frameworks that integrate the behaviour of the transportation sector and sustainability assessment for the diffusion of passenger EVs. Different approaches for modelling the system in an integrated manner were identified in the literature. We analysed them according to the level of integration. The integration was studied in terms of two aspects: demand–supply interactions and sustainability integration.
We observed that the interaction between the demand and supply is relevant only when the consumer is explicitly modelled. To model the consumer, a discrete choice approach is considered in all the studies. Heterogeneity is explicitly analysed in ABMs. The main relationships found in the demand–supply interactions are based on the attributes considered by the consumer for selecting a technology for purchase, and the diffusion process determines the choice set of the different consumers.
For the sustainability integration, we concluded that the majority of the studies considered sustainability as an endpoint indicator without analysing the interactions of this indicator with the transportation system or the interaction between the dimensions of sustainability. We also found that the social dimension is a less-studied dimension of sustainability. Only two articles took into consideration the integration of sustainability. The effect in the social dimension was considered an indirect impact of the economic and environmental performance of the system, and the impact on the system due to the social dimension was associated with the change in the employment, the population, and the sales figures of the vehicles.
From a modelling perspective, we identified two main modelling approaches: top-down and hybrid models. For the former, an SD approach was mainly used. This approach allowed the consideration of the behaviour of the system in an aggregated manner, and it is focused on the relationships and feedback between the components of the system. In this approach, we also determined that the consumer can be explicitly modelled by using discrete choice models and considering the choice of technologies in an aggregated manner. The hybrid model took into consideration an agent-based approach for the consumer embedded in top-down models, such as SD or LCA. This allows for the explicit consideration of the heterogeneity of the consumer and the effect of the interpersonal influence on each consumer. The market share composition and demand behaviour are estimated by the aggregation of the individual decision in the agent-based environment. Integrating the consumer with a top-down perspective allows for the analysis of the aggregated behaviour of the individuals with the dynamics of the supply and the sustainability performance of the system. We found that there exists a growing trend in the use of hybrid models, while considering micro- and macro-aspects of the system and the requirement of representing the consumer as an individual with its own decisions in order to evaluate the transportation system and sustainability.
We believe that integrating the relationships between sustainability and the system in a hybrid approach will facilitate a better understanding of the synergies between the consumer, supply, and sustainability. This integration will also facilitate a better formulation of public policies for improving the diffusion process of EVs in a sustainable framework, as it can represent the complexity of sustainable transportation and the effect of the proposed solution in all the elements of the system.

Author Contributions

Conceptualisation, E.L.-A., A.T.S., and L.M.C.; methodology, E.L.-A., A.T.S., and L.M.C.; writing—original draft preparation, E.L.-A.; writing—review and editing, A.T.S. and L.M.C.

Funding

This research was funded by the Colombian Department of Science, Technology, and Innovation (Colciencias) under call number 757–2016 and by Universidad de La Sabana, Colombia, under Research Project No. ING-215–2018.

Conflicts of Interest

The authors declare no conflict of interest.

References

  1. Bollen, J.; Hers, S.; van der Zwaan, B. An integrated assessment of climate change, air pollution, and energy security policy. Energy Policy 2010, 38, 4021–4030. [Google Scholar] [CrossRef] [Green Version]
  2. Melamed, M.L.; Schmale, J.; von Schneidemesser, E. Sustainable policy—Key considerations for air quality and climate change. Curr. Opin. Environ. Sustain. 2016, 23, 85–91. [Google Scholar] [CrossRef]
  3. Brown, S.P.A.; Huntington, H.G. Energy security and climate change protection: Complementarity or tradeoff? Energy Policy 2008, 36, 3510–3513. [Google Scholar] [CrossRef]
  4. McCollum, D.L.; Krey, V.; Riahi, K.; Kolp, P.; Grubler, A.; Makowski, M.; Nakicenovic, N. Climate policies can help resolve energy security and air pollution challenges. Clim. Chang. 2013, 119, 479–494. [Google Scholar] [CrossRef] [Green Version]
  5. IPCC. Climate Change 2014: Mitigation of Climate Change; IPCC: Paris, France, 2014; ISBN 9781107654815. [Google Scholar]
  6. World Health Organization. Ambient Air Pollution: A Global Assessment of Exposure and Burden of Disease; World Health Organization: Geneva, Switzerland, 2016; ISBN 978-92-4-151135-3. [Google Scholar]
  7. Al-Alawi, B.M.; Bradley, T.H. Review of hybrid, plug-in hybrid, and electric vehicle market modeling Studies. Renew. Sustain. Energy Rev. 2013, 21, 190–203. [Google Scholar] [CrossRef]
  8. Liao, F.; Molin, E.; van Wee, B. Consumer preferences for electric vehicles: A literature review. Transp. Rev. 2017, 37, 252–275. [Google Scholar] [CrossRef]
  9. Rezvani, Z.; Jansson, J.; Bodin, J. Advances in consumer electric vehicle adoption research: A review and research agenda. Transp. Res. Part D Transp. Environ. 2015, 34, 122–136. [Google Scholar] [CrossRef] [Green Version]
  10. Zhou, Y.; Wang, M.; Hao, H.; Johnson, L.; Wang, H.; Hao, H. Plug-in electric vehicle market penetration and incentives: A global review. Mitig. Adapt. Strateg. Glob. Chang. 2015, 20, 777–795. [Google Scholar] [CrossRef]
  11. Abbas, K.A.; Bell, M.G.H. System dynamics applicability to transportation modeling. Transp. Res. Part A 1994, 28, 373–390. [Google Scholar] [CrossRef]
  12. Shepherd, S.P. A review of system dynamics models applied in transportation. Transp. B 2014, 2, 83–105. [Google Scholar] [CrossRef] [Green Version]
  13. Zhang, T.; Gensler, S.; Garcia, R. A study of the diffusion of alternative fuel vehicles: An agent-based modeling approach. J. Prod. Innov. Manag. 2011, 28, 152–168. [Google Scholar] [CrossRef]
  14. Fiksel, J. Sustainability and Resilience: Toward a Systems Approach. Sustain. Sci. Pract. Policy 2006, 2, 2006. [Google Scholar] [CrossRef]
  15. Moffatt, I.; Hanley, N. Modelling sustainable development: Systems dynamic and input–ouput approaches. Environ. Model. Softw. 2001, 16, 545–557. [Google Scholar] [CrossRef]
  16. Yuan, C.; Wu, D.; Liu, H. Using grey relational analysis to evaluate energy consumption, CO2 emissions and growth patterns in China’s provincial transportation sectors. Int. J. Environ. Res. Public Health 2017, 14, 1536. [Google Scholar] [CrossRef] [PubMed]
  17. Wu, D.; Yuan, C.; Liu, H. The decoupling states of CO2 emissions in the Chinese transport sector from 1994 to 2012: A perspective on fuel types. Energy Environ. 2018, 29, 591–612. [Google Scholar] [CrossRef]
  18. United Nations. Transforming our world: The 2030 Agenda for Sustainable Development. In General Assembly at Its 70th Session; United Nations: New York, NY, USA, 2015; Volume 16301, pp. 1–35. [Google Scholar] [CrossRef]
  19. Adetunji, I.; Price, A.; Fleming, P.; Kemp, P. The Application of Systems Thinking To the Concept of Sustainability. In Proceedings of the 19th annual ARCOM conference, Brighton, UK, 3–5 September 2003; Greenwood, D., Ed.; ARCOM: Brighton, UK, 2003; Volume 1, pp. 161–170. [Google Scholar]
  20. Singh, R.K.; Murty, H.R.; Gupta, S.K.; Dikshit, A.K. An overview of sustainability assessment methodologies. Ecol. Indic. 2012, 15, 281–299. [Google Scholar] [CrossRef]
  21. Ness, B.; Urbel-Piirsalu, E.; Anderberg, S.; Olsson, L. Categorising tools for sustainability assessment. Ecol. Econ. 2007, 60, 498–508. [Google Scholar] [CrossRef]
  22. Santoyo-Castelazo, E.; Azapagic, A. Sustainability assessment of energy systems: Integrating environmental, economic and social aspects. J. Clean. Prod. 2014, 80, 119–138. [Google Scholar] [CrossRef]
  23. Finkbeiner, M.; Schau, E.M.; Lehmann, A.; Traverso, M. Towards life cycle sustainability assessment. Sustainability 2010, 2, 3309–3322. [Google Scholar] [CrossRef]
  24. Onat, N.C.; Kucukvar, M.; Halog, A.; Cloutier, S. Systems Thinking for Life Cycle Sustainability Assessment: A Review of Recent Developments, Applications, and Future Perspectives. Sustainability 2017, 9, 706. [Google Scholar] [CrossRef]
  25. Tranfield, D.; Denyer, D.; Smart, P. Towards a Methodology for Developing Evidence-Informed Management Knowledge by Means of Systematic Review. Br. J. Manag. 2003, 14, 207–222. [Google Scholar] [CrossRef] [Green Version]
  26. Durach, C.F.; Kembro, J.; Wieland, A. A New Paradigm for Systematic Literature Reviews in Supply Chain Management. J. Supply Chain Manag. 2017, 53, 67–85. [Google Scholar] [CrossRef]
  27. Shafiei, E.; Stefansson, H.; Asgeirsson, E.I.; Davidsdottir, B.; Raberto, M. Integrated Agent-based and System Dynamics Modelling for Simulation of Sustainable Mobility. Transp. Rev. 2013, 33, 44–70. [Google Scholar] [CrossRef]
  28. Greene, D.L.; Park, S.; Liu, C. Public policy and the transition to electric drive vehicles in the U.S.: The role of the zero emission vehicles mandates. Energy Strateg. Rev. 2014, 5, 66–77. [Google Scholar] [CrossRef]
  29. Shafiei, E.; Davidsdottir, B.; Leaver, J.; Stefansson, H.; Asgeirsson, E.I. Comparative analysis of hydrogen, biofuels and electricity transitional pathways to sustainable transport in a renewable-based energy system. Energy 2015, 83, 614–627. [Google Scholar] [CrossRef]
  30. Günther, H.O.; Kannegiesser, M.; Autenrieb, N. The role of electric vehicles for supply chain sustainability in the automotive industry. J. Clean. Prod. 2015, 90, 220–233. [Google Scholar] [CrossRef]
  31. Onat, N.C.; Kucukvar, M.; Tatari, O. Uncertainty-embedded dynamic life cycle sustainability assessment framework: An ex-ante perspective on the impacts of alternative vehicle options. Energy 2016, 112, 715–728. [Google Scholar] [CrossRef]
  32. Onat, N.C.; Kucukvar, M.; Tatari, O.; Egilmez, G. Integration of system dynamics approach toward deepening and broadening the life cycle sustainability assessment framework: A case for electric vehicles. Int. J. Life Cycle Assess. 2016, 21, 1009–1034. [Google Scholar] [CrossRef]
  33. Pasaoglu, G.; Harrison, G.; Jones, L.; Hill, A.; Beaudet, A.; Thiel, C. A system dynamics based market agent model simulating future powertrain technology transition: Scenarios in the EU light duty vehicle road transport sector. Technol. Forecast. Soc. Chang. 2016, 104, 133–146. [Google Scholar] [CrossRef]
  34. Onat, N.C.; Noori, M.; Kucukvar, M.; Zhao, Y.; Tatari, O.; Chester, M. Exploring the suitability of electric vehicles in the United States. Energy 2017, 121, 631–642. [Google Scholar] [CrossRef]
  35. Sen, B.; Noori, M.; Tatari, O. Will Corporate Average Fuel Economy (CAFE) Standard help? Modeling CAFE’s impact on market share of electric vehicles. Energy Policy 2017, 109, 279–287. [Google Scholar] [CrossRef]
  36. Kieckhäfer, K.; Wachter, K.; Spengler, T.S. Analyzing manufacturers’ impact on green products’ market diffusion—The case of electric vehicles. J. Clean. Prod. 2017, 162, S11–S25. [Google Scholar] [CrossRef]
  37. Shafiei, E.; Davidsdottir, B.; Fazeli, R.; Leaver, J.; Stefansson, H.; Asgeirsson, E.I. Macroeconomic effects of fiscal incentives to promote electric vehicles in Iceland: Implications for government and consumer costs. Energy Policy 2018, 114, 431–443. [Google Scholar] [CrossRef]
  38. Coffman, M.; Bernstein, P.; Wee, S. Electric vehicles revisited: A review of factors that affect adoption. Transp. Rev. 2017, 37, 79–93. [Google Scholar] [CrossRef]
  39. Jochem, P.; Gómez Vilchez, J.J.; Ensslen, A.; Schäuble, J.; Fichtner, W. Methods for forecasting the market penetration of electric drivetrains in the passenger car market. Transp. Rev. 2018, 38, 322–348. [Google Scholar] [CrossRef]
  40. Hourcade, J.-C.; Jaccard, M.; Bataille, C.; Ghersi, F. Hybrid Modeling: New Answers to Old Challenges Introduction to the Special Issue of “The Energy Journal”. Energy J. 2006, 27, 1–11. [Google Scholar] [CrossRef]
  41. Struben, J.; Sterman, J.D. Transition challenges for alternative fuel vehicle and transportation systems. Environ. Plan. B Plan. Des. 2008, 35, 1070–1097. [Google Scholar] [CrossRef]
  42. Train, K.E. Discrete Choice Methods with Simulation; Cambridge University Press: Cambridge, UK, 2003; pp. 1–388. [Google Scholar] [CrossRef]
  43. Morton, C.; Anable, J.; Nelson, J.D. Exploring consumer preferences towards electric vehicles: The influence of consumer innovativeness. Res. Transp. Bus. Manag. 2016, 18, 18–28. [Google Scholar] [CrossRef] [Green Version]
  44. Browne, D.; O’Mahony, M.; Caulfield, B. How should barriers to alternative fuels and vehicles be classified and potential policies to promote innovative technologies be evaluated? J. Clean. Prod. 2012, 35, 140–151. [Google Scholar] [CrossRef] [Green Version]
  45. Schwoon, M. Simulating the adoption of fuel cell vehicles. J. Evol. Econ. 2006, 16, 435–472. [Google Scholar] [CrossRef] [Green Version]
  46. Kannegiesser, M.; Günther, H.O.; Gylfason, Ó. Sustainable development of global supply chains—Part 2: Investigation of the European automotive industry. Flex. Serv. Manuf. J. 2014, 26, 48–68. [Google Scholar] [CrossRef]
  47. Michalek, J.J.; Papalambros, P.Y.; Skerlos, S.J. A Study of Fuel Efficiency and Emission Policy Impact on Optimal Vehicle Design Decisions. J. Mech. Des. 2004, 126, 1062. [Google Scholar] [CrossRef]
  48. Kieckhäfer, K.; Walther, G.; Axmann, J.; Spengler, T. Integrating Agent-based Simulation and System Dynamics to support product strategy decisions in the automotive industry. In Proceedings of the 2009 IEEE Winter Simulation Conference (WSC), Austin, TX, USA, 13–16 December 2009; pp. 1433–1443. [Google Scholar]
Figure 1. The identification process of relevant articles.
Sustainability 11 02513 g001
Figure 2. (a) The number of articles per year. (b) The journals’ main subject areas.
Sustainability 11 02513 g002
Figure 3. The components of the system in an integrated framework.
Sustainability 11 02513 g003
Figure 4. The interactions found in the selected studies. Solid line: the relationships considered. Dashed line: the relationships not considered.
Sustainability 11 02513 g004
Table 1. The keywords and search strings considered used in the literature review.
Search Strings
Termssimulation, model*, framework, Sustainab*, adoption, diffusion, Freight, commercial, BEV, AFV, HEV, ZEV, PHEV, EV, SLCA, LCA
Combining Terms“Alternative fuel vehicle”, “Zero emission vehicle”, “Electric vehicle”, “Triple bottom line”, “life cycle assessment”, “Market share”, “Public transport*”
Search strings 1(“Alternative fuel vehicle” OR “Zero emission vehicle” OR “Electric vehicle” OR “BEV” OR “AFV” OR “HEV” OR “ZEV” OR “EV” OR “PHEV” ) AND ( simulation OR model* OR framework ) AND (“Sustainab*” OR “Triple bottom line” OR “life cycle assessment” OR LCA OR SLCA) AND ( adoption OR diffusion OR “Market share” ) AND NOT (“Public transport*” OR “Freight” OR “commercial”)
Search strings 2(“Alternative fuel vehicle” OR “Zero emission vehicle” OR “Electric vehicle” OR “BEV” OR “AFV” OR “HEV” OR “ZEV” OR “EV” OR “PHEV”) AND (simulation OR model* OR framework) AND (“Sustainab*” OR “Triple bottom line” OR “life cycle assessment” OR LCA OR SLCA) AND NOT ( “Public transport*” OR “Freight” OR “commercial” )
Search strings 3(“Alternative fuel vehicle” OR “Zero emission vehicle” OR “Electric vehicle” OR “BEV” OR “AFV” OR “HEV” OR “ZEV” OR “EV” OR “PHEV”) AND (“Agent Based”) AND (simulation OR model* OR framework) AND (adoption OR diffusion OR “Market share”) AND NOT (“Public transport*” OR “Freight” OR “commercial”)
Search strategiesThe strings were entered in each database. Variation in spelling was also accounted for.
BEV: Battery electric vehicle. AFV: Alternative fuel vehicle. HEV: Hybrid electric vehicle. ZEV: zero-emission vehicle. PHEV: Plug-in hybrid electric vehicle. EV: electric vehicle. SLCA: Social or Sustainable life cycle assessment. LCA: life cycle assessment
Table 2. The selected studies.
RefYearJournalSubject Area
[27]2013Transport ReviewsTransportation
[28]2014Energy Strategy ReviewsEnergy
[29]2015EnergyEnergy
[30]2015Journal of Cleaner ProductionEnvironmental science
[31]2016EnergyEnergy
[32]2016International Journal of Life Cycle AssessmentEnvironmental science
[33]2016Technological Forecasting and Social ChangeApplied psychology
[34]2017EnergyEnergy
[35]2017Energy PolicyEnergy
[36]2017Journal of Cleaner ProductionEnvironmental science
[37]2018Energy PolicyEnergy
Table 3. The stakeholder and sustainability dimensions considered in each study.
RefSupply SideDemand SideSustainability
FSFDVSVDCMMSECOENVSOC
[27]XXXXXXXX
[28] XX XXXX
[29]XX XXXX
[30] XX XXXX
[31]X X XXXX
[32]X X XXXX
[33] XXXXXXX
[34]XXX XXXX
[35]XXX XXXX
[36] XXXXXXX
[37]XX XXXX
FS: Fuel Producers, FD: Fuel distributors, VS: Vehicle manufacturer, VD: Vehicle dealer, CM: Consumer modelling, MS: Market Share, ECO: Economic, ENV: Environmental, SOC: Social.
Table 4. Main elements for modelling the consumer.
RefModelling TechniqueDiffusion ProcessIndividual-Related Variables
[27]ABM-MNLAgents interactionIncome Sociodemographics
[28]CGE-NMNLBass diffusion modelAdopter category
[29]SD-MNLBass diffusion model1
[30]N/A 2N/AN/A
[31]N/AN/AN/A
[32]N/AN/AN/A
[33]SD-MNLMarket Share Exposure
[34]ABM-MNLAgents interactionIncome
Sociodemographics
Geography
[35]ABM-MNLAgents interactionIncome
Sociodemographics
Geography
[36]ABM-NMNLAgents interactionSociodemographics
[37]SD-MNLBass diffusion model
1 Variables not found in the study. 2 The study does not include the consumer purchase decision model.
Table 5. Attributes evaluated in the consumer purchase decision model.
RefFinancial AttributesTechnological AttributesInfrastructure Attributes
PriceFuel CostMaintenance CostBattery CostRangeEnvironmental PerformanceVehicle PerformanceFuel Availability
[27]XXXXXX X
[28]XXX X XX
[29]XXXXX X
[33]XXX X
[34]XXX X X
[35]XXX X X
[36]XX XXXX
[37]XXXXX X
Table 6. The fuel supply system modelling approach and fuels considered.
RefActor Modelling ApproachFuels Considered
Fuel ProducerFuel DistributionPetrolDieselElectricityE85B20CNGBiogasHydrogen
[27]SDSDXXXXX XX
[28]N/A 1CGEX X X
[29]SDSDXXXXX XX
[30]N/AN/AX X
[31]SDN/AX X
[32]SDN/AX X
[33]N/ASDXXXXXX X
[34]LCCABMX X
[35]LCCABMX X
[36]N/ASDXXX
[37]SDSDXXXXX XX
1 The study does not include this actor in the model.
Table 7. The fuel supply system modelling variables.
RefR&DFProdFpCostFDemandFCostFAvailability
[27]XXXXXX
[28] XXX
[29]XXXXXX
[31] X X
[32] X X
[33] XXX
[34] XX
[35] XX
[36] XX
[37]XXXXXX
R&D: Research and development. FProd: Fuel produced. FpCost: Fuel production cost. FDemand: Fuel demand. FCost: Fuel price. FAvailability: Fuel availability (stations).
Table 8. The vehicle supply system modelling approach and powertrains considered.
RefActor Modelling ApproachPowertrain Considered
OEMDealerICEHEVPHEVBEVFCV
[27]SDSDXXXXX
[28]CGEN/A 1XXXXX
[29]N/AN/AXXXXX
[30]OptimisationOptimisationXXXX
[31]N/ASDXXXX
[32]N/ASDXXXX
[33]SDSDXXXXX
[34]LCCN/AXXXX
[35]LCCN/AXXXX
[36]SDSDXXXX
[37]N/AN/AXXXXX
1 The study does not include this actor in the model.
Table 9. The vehicle supply system modelling variables.
RefR&DQProdVpCostTecAttDCostEDemandSalesRPrice
[27]XXXXXXXX
[28]X X XX
[29] XX
[30] XX XXXX
[31] X XX
[32] X XX
[33]XXXX XXX
[34] XX
[35] XX
[36]X X XX
[37] XX
R&D: Research and development. QProd: quantity produced. VpCost: Vehicle production cost. TecAtt: vehicle technical attributes. DCost: distribution or dealer cost. EDemand: expected demand. RPrice: retail price.
Table 10. The economic indicators.
RefMSFCTCGDPEDC
[27]XX
[28]XX
[29]XX
[30]X X
[31] XXX
[32] XXX
[33]XXX
[34]X X X
[35]X X X
[36]XX
[37]XX X
MS: Market Share composition, FC: Fuel Consumption, TC: Total Cost, GDP: GDP/Government revenue, EDC: Environmental Damage Cost.
Table 11. The environmental indicators.
RefEuseGHG UseVOC UsePM UseNOX UseGHG ProdVOC ProdPM ProdNOX ProdWF
[27]XX
[28]XXXXX
[29]XX
[30] X X
[31] XXXXXXXX
[32] XXXXXXXX
[33]XX X
[34] X X
[35] X X
[36]X
[37]XX
Euse: Energy use, GHG use: In Use GHG Emission, VOC use: In Use VOC Emission, PM use: In Use PM Emission, NOX use: In Use NOx Emission, GHG Prod: Production GHG Emission, VOC Prod: Production VOC Emission, PM Prod: Production PM Emission, NOX Prod: Production NOx Emission, WF: Water footprint.
Table 12. The integrated modelling approaches.
RefFuel Supply SystemVehicle Supply SystemDemand SideIntegrated Modelling Approach
FSFDVSVDCMMS
[27]SDSDSDSDMNLABMHybrid modelling
[28]-CGECGE-NMNLCGETop-down
[29]SDSD--MNLSDTop-down
[30]--OptOpt-OptOptimisation
[31]SD--SD-ScenarioTop-down
[32]SD--SD-ScenarioTop-down
[33]-SDSDSDMNLSDTop-down
[34]LCCABMLCC-MNLABMHybrid modelling
[35]LCCABMLCC-MNLABMHybrid modelling
[36]-SDSDSDNMNLABMHybrid modelling
[37]SDSD--MNLSDTop-down
FS: Fuel Producers, FD: Fuel distributors, VS: Vehicle manufacturer, VD: Vehicle dealer, CM: Consumer modelling, MS: Market Share, SD: System dynamics, ABM: Agent-based modelling, CGE: computable general equilibrium, LCC: life cycle cost, Opt: optimisation problem, MNL: multinomial logit model, NMNL: nested multinomial logit model.