Experimental Study on the Shear Performance of Reinforced Concrete Beams Strengthened with Bolted Side-Plating


Abstract
1. Introduction
2. Experimental Program
2.1. Specimen Details
2.2. Material Properties
2.3. Strengthening and Fire-Protection
2.3.1. BSP Strengthening
- Bolt holes with a diameter of 14 mm were drilled in the steel plates.
- Bolt holes with a diameter of 14 mm and a depth of 92 mm were drilled in to the side faces of the RC beams.
- Washers were attached onto the concrete surface around the holes by silicone glass adhesive to prevent the adhesive mortar from leaking.
- Adhesive mortar was injected into the holes and anchor bolts were inserted.
- The steel plates were fixed on the RC beam side faces by using hex nuts after 24-h curing of adhesive mortar.
2.3.2. Fire Protection
- The surface of anchor bolts and steel plates were cleaned and prepared;
- The epoxy primers were brushed on the steel surface;
- The fireproof coating was brushed over the primers evenly three times a day up to 3 mm thickness.
2.4. Test Procedure
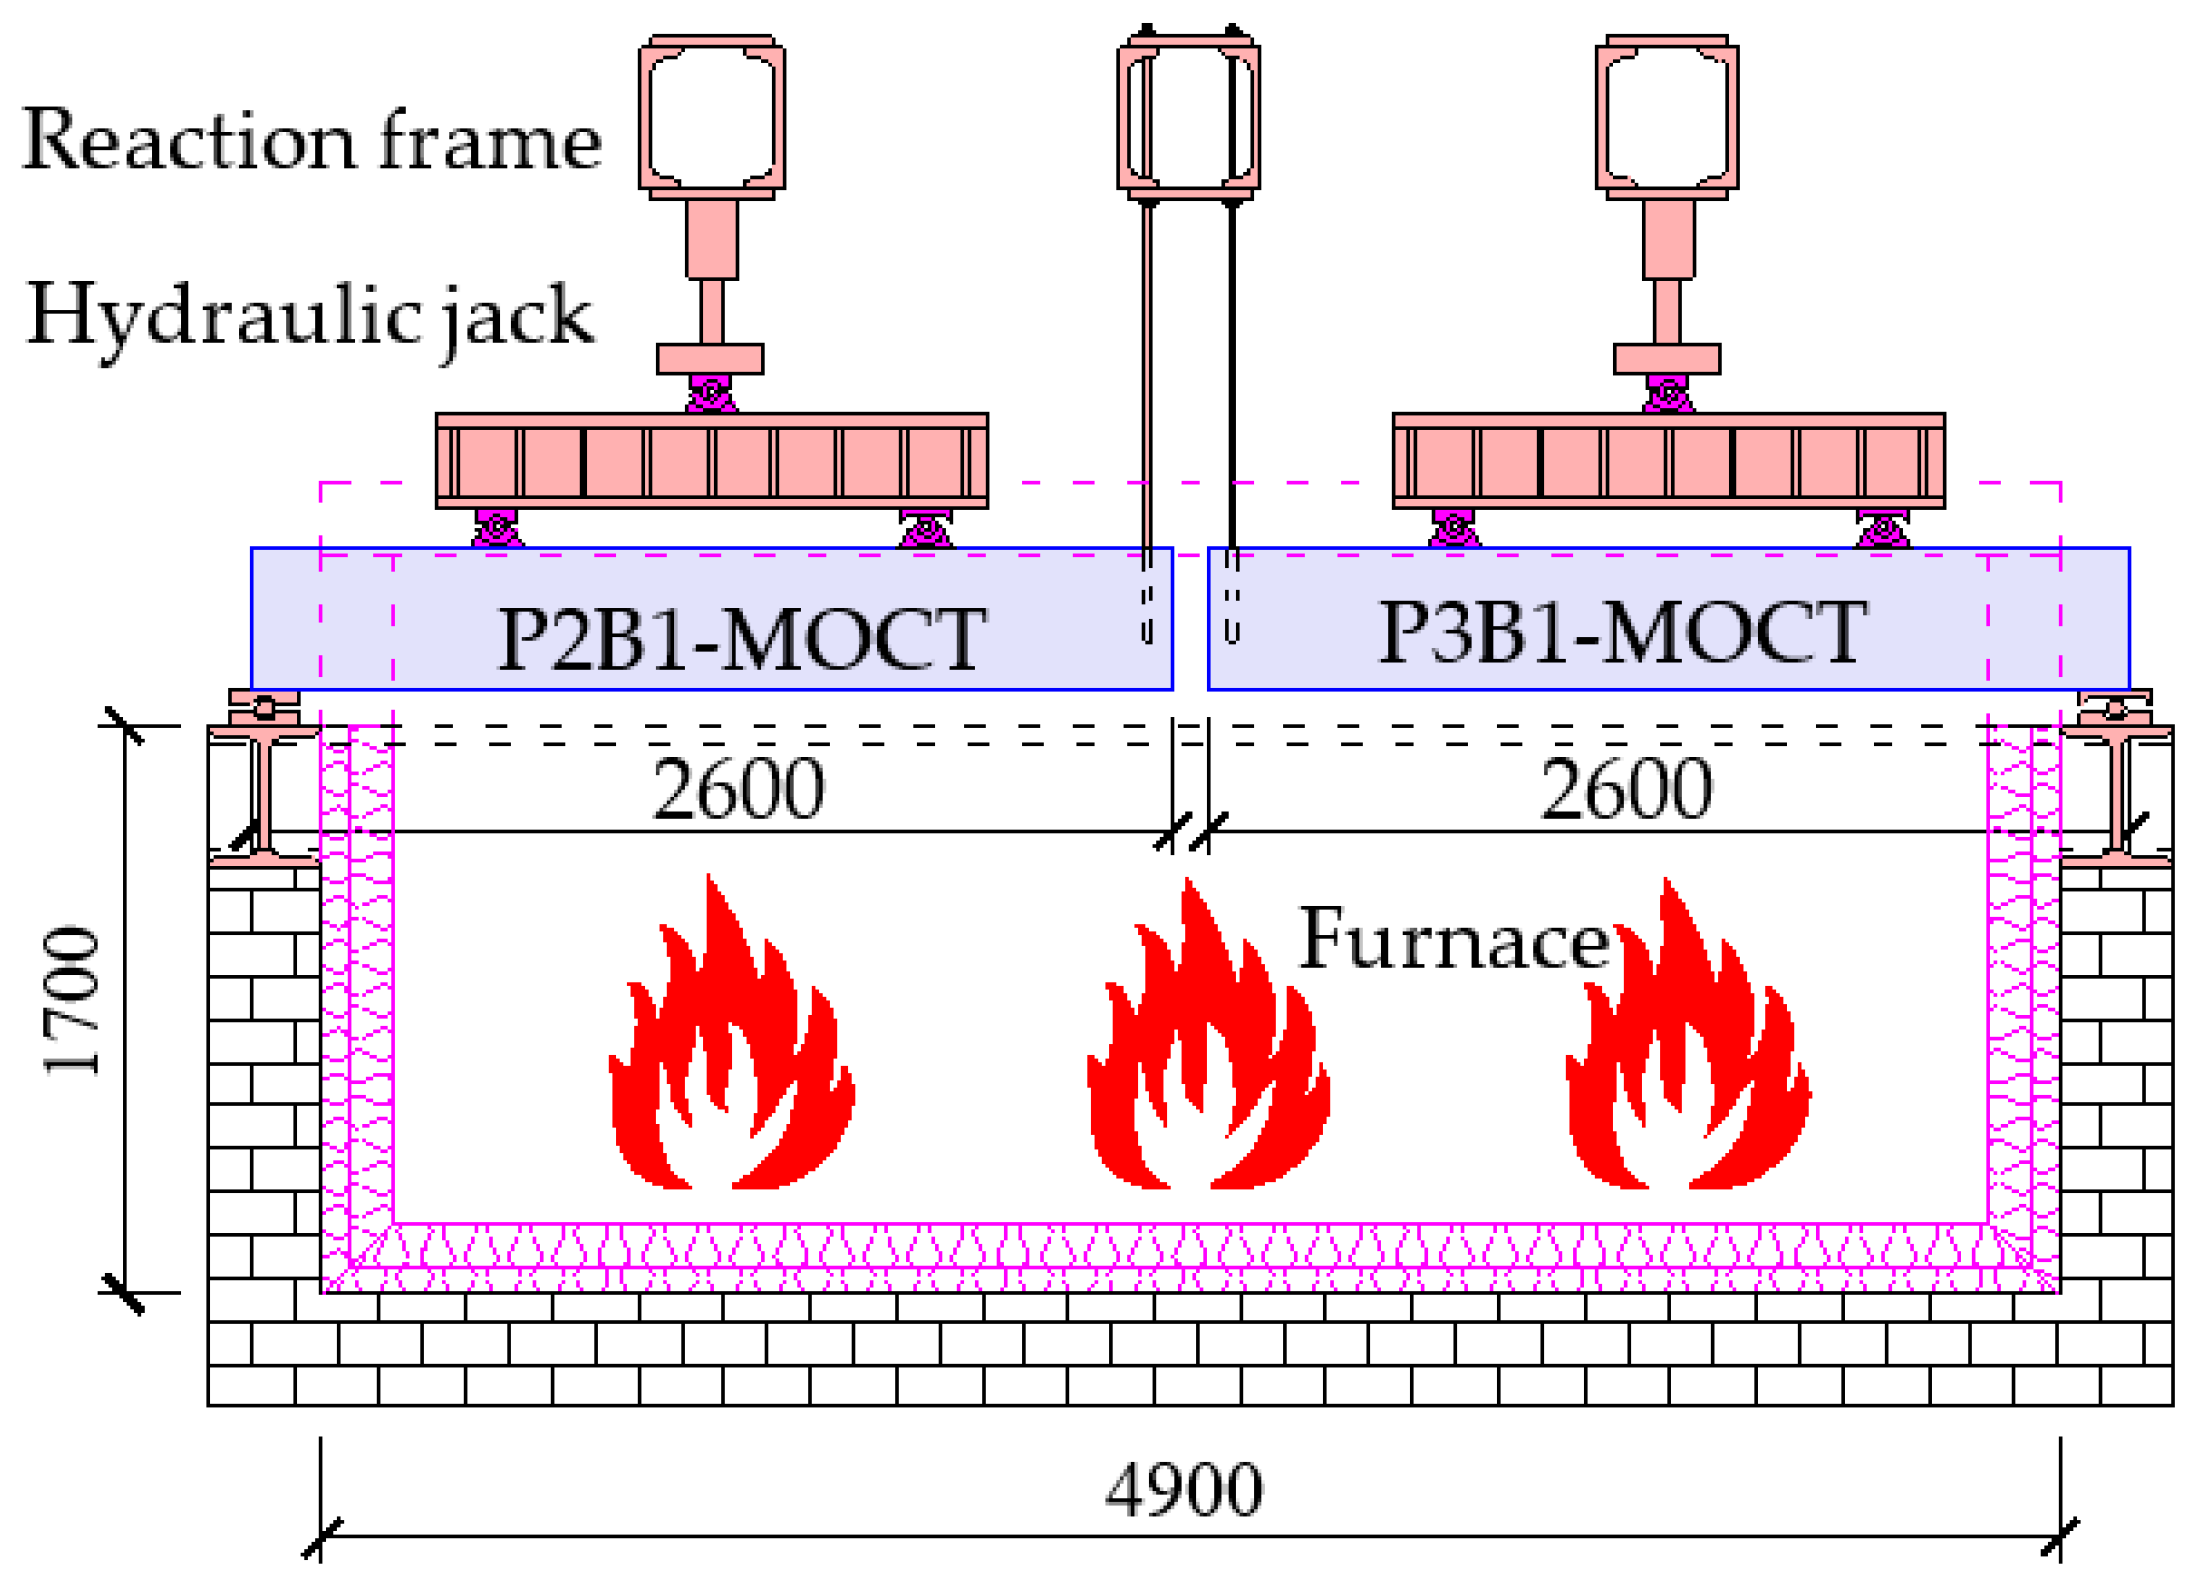
2.4.1. Fire Test
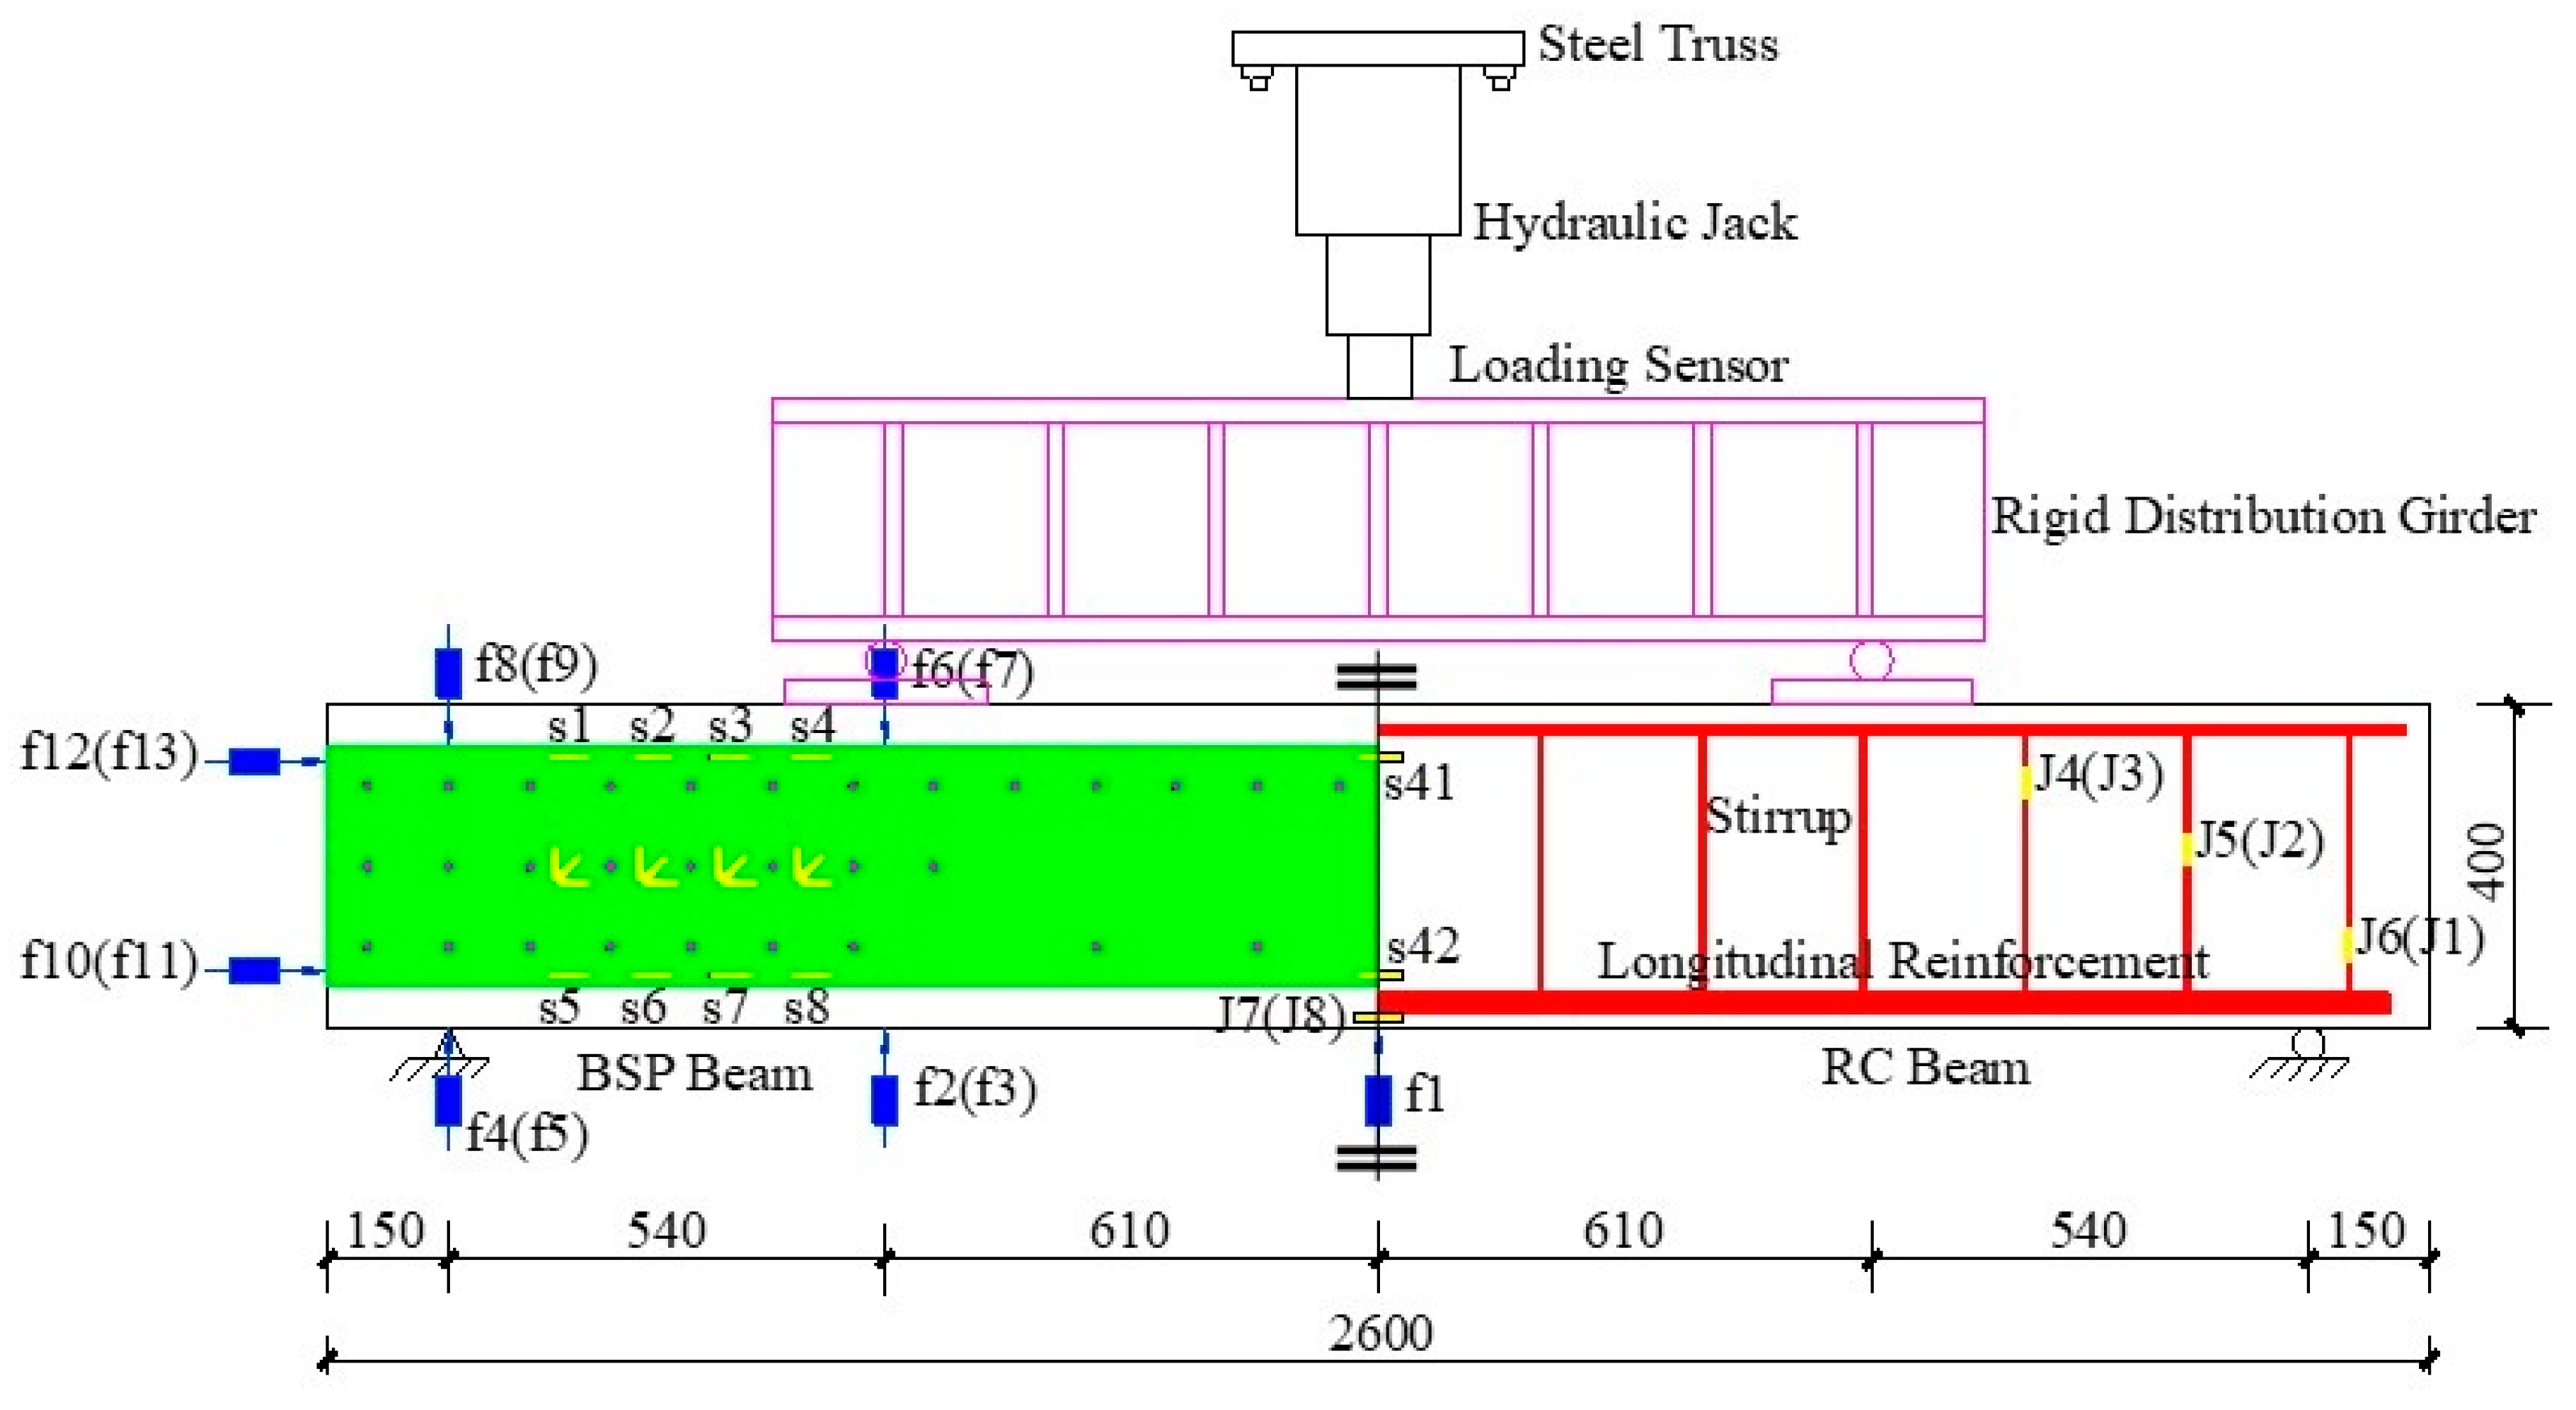
2.4.2. Four-Point-Bending Shear Test
3. Result Discussion
3.1. Thermal Response
3.2. Failure Modes and Crack Patterns
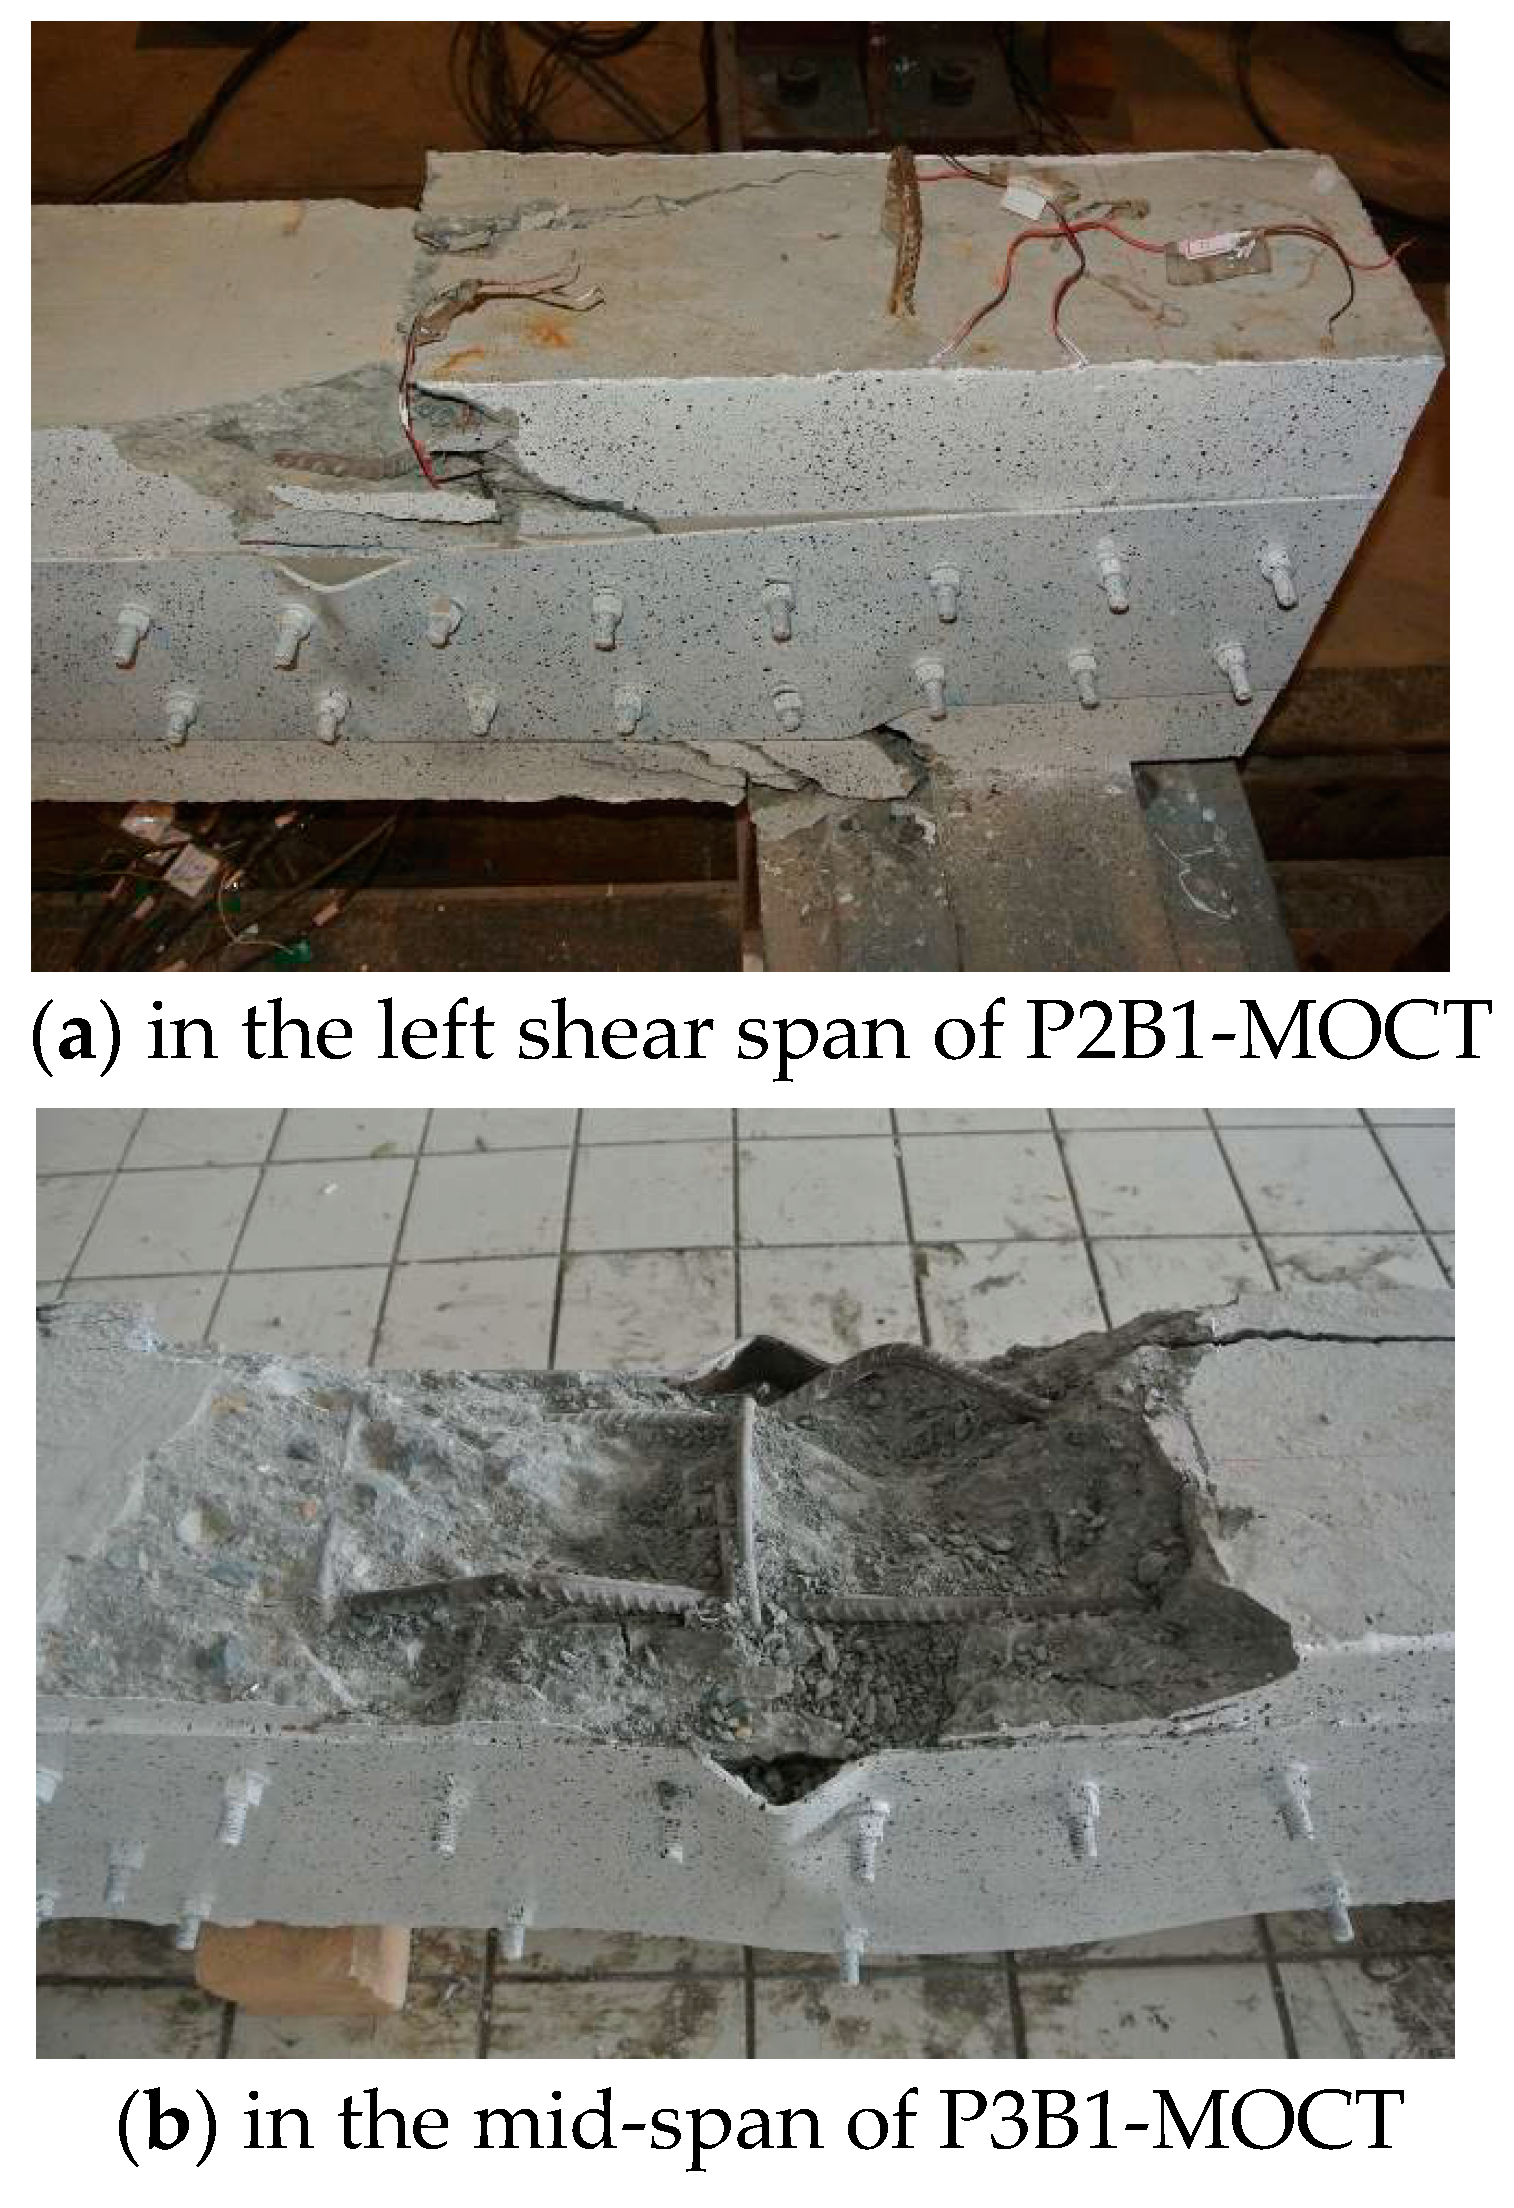
3.2.1. Failure Mode
3.2.2. Crack Patterns
3.3. Strength, Stiffness and Ductility
3.3.1. Shear Capacity
3.3.2. Stiffness
3.3.3. Ductility
3.4. Strain Development
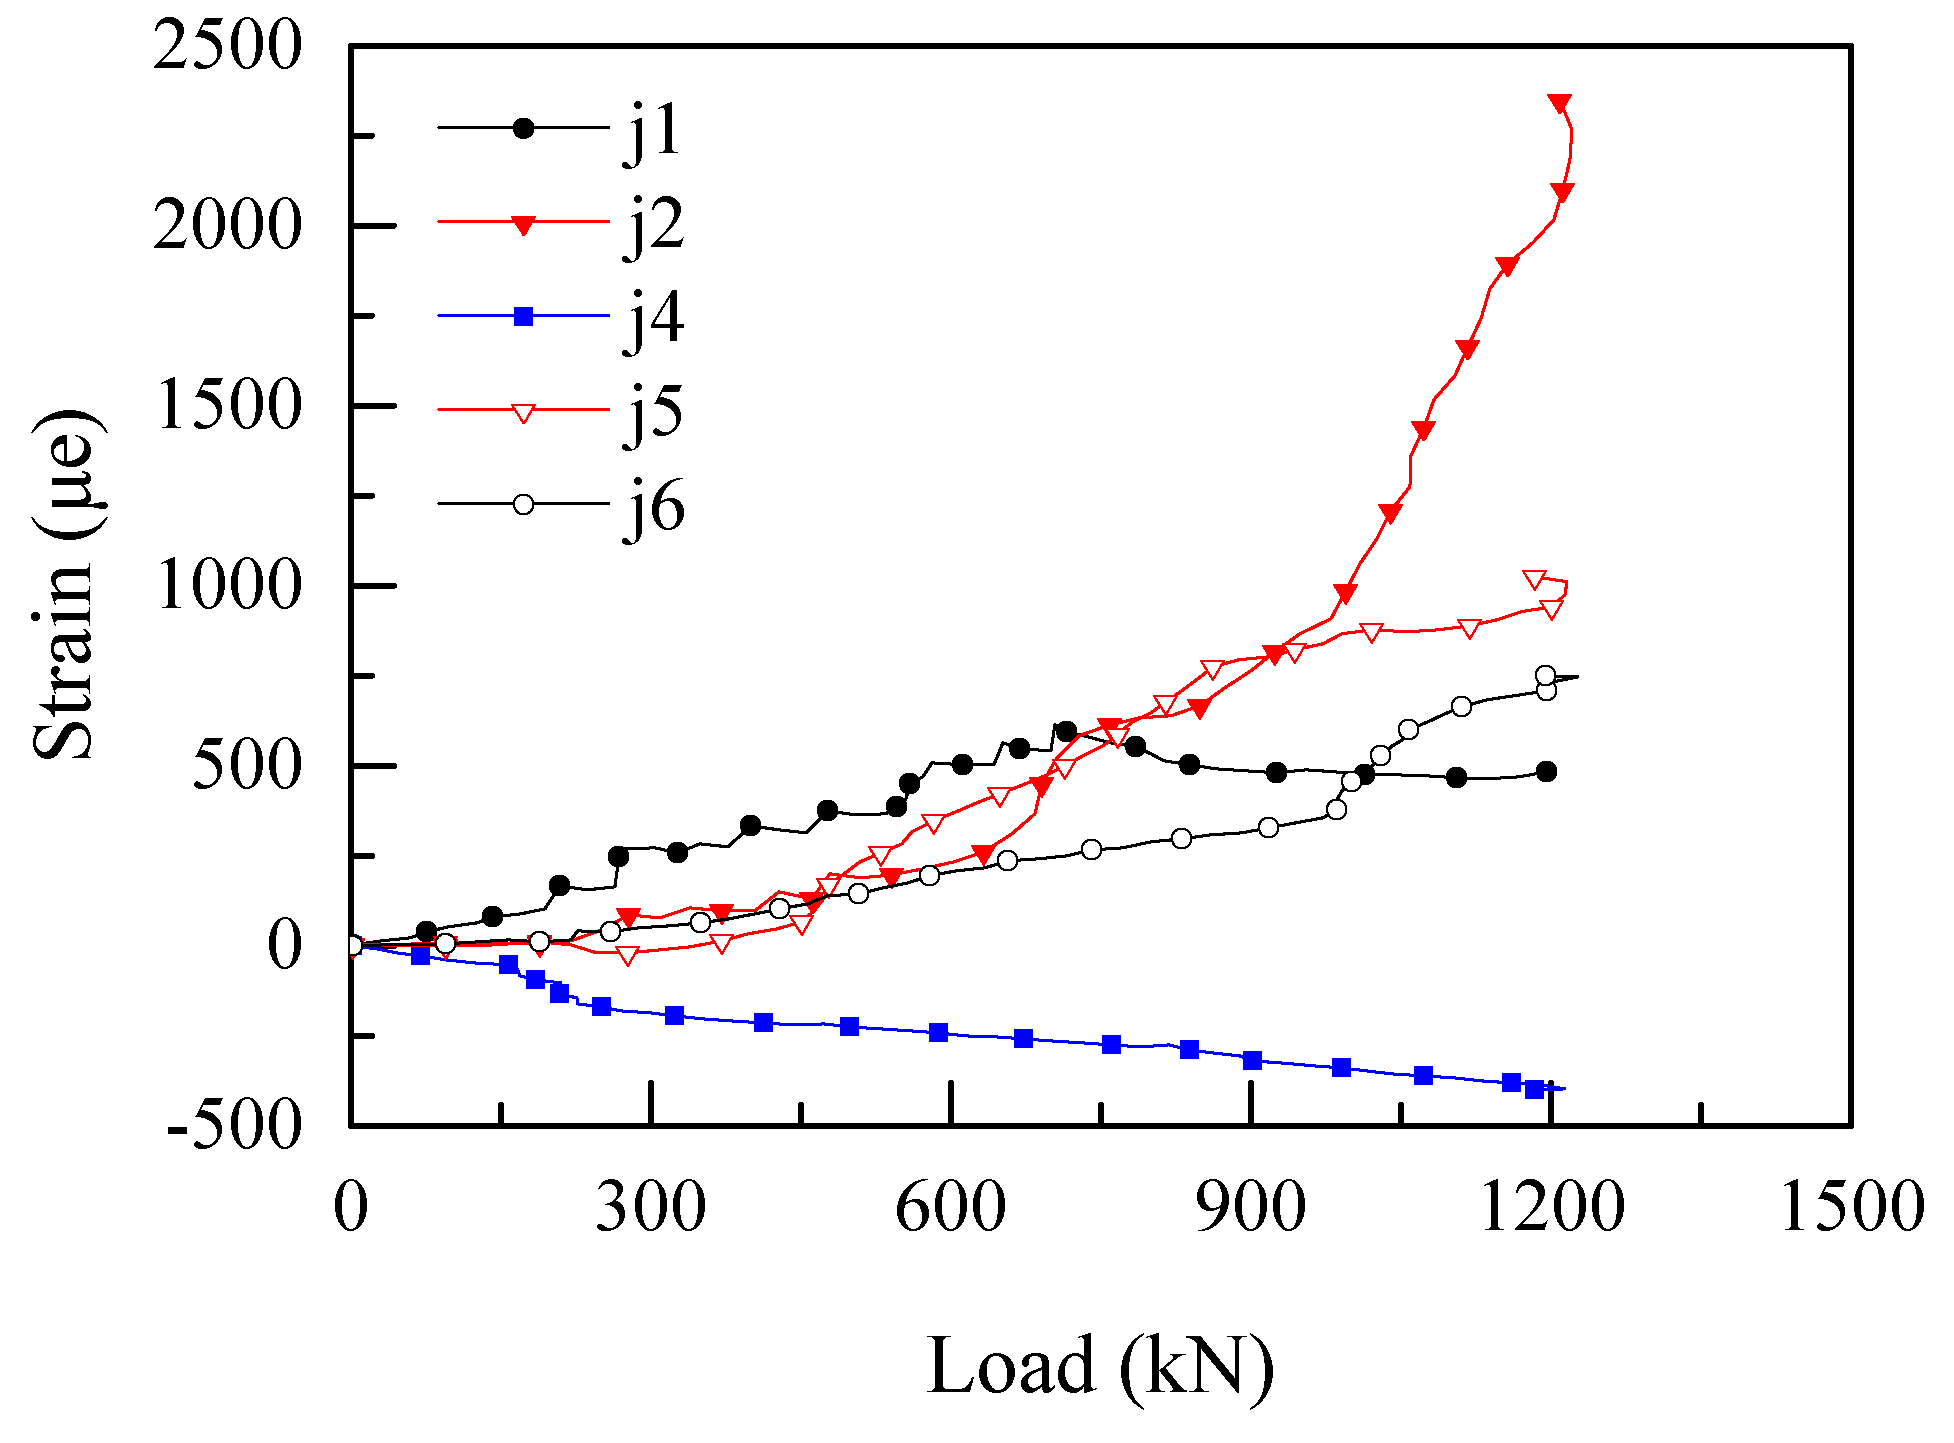
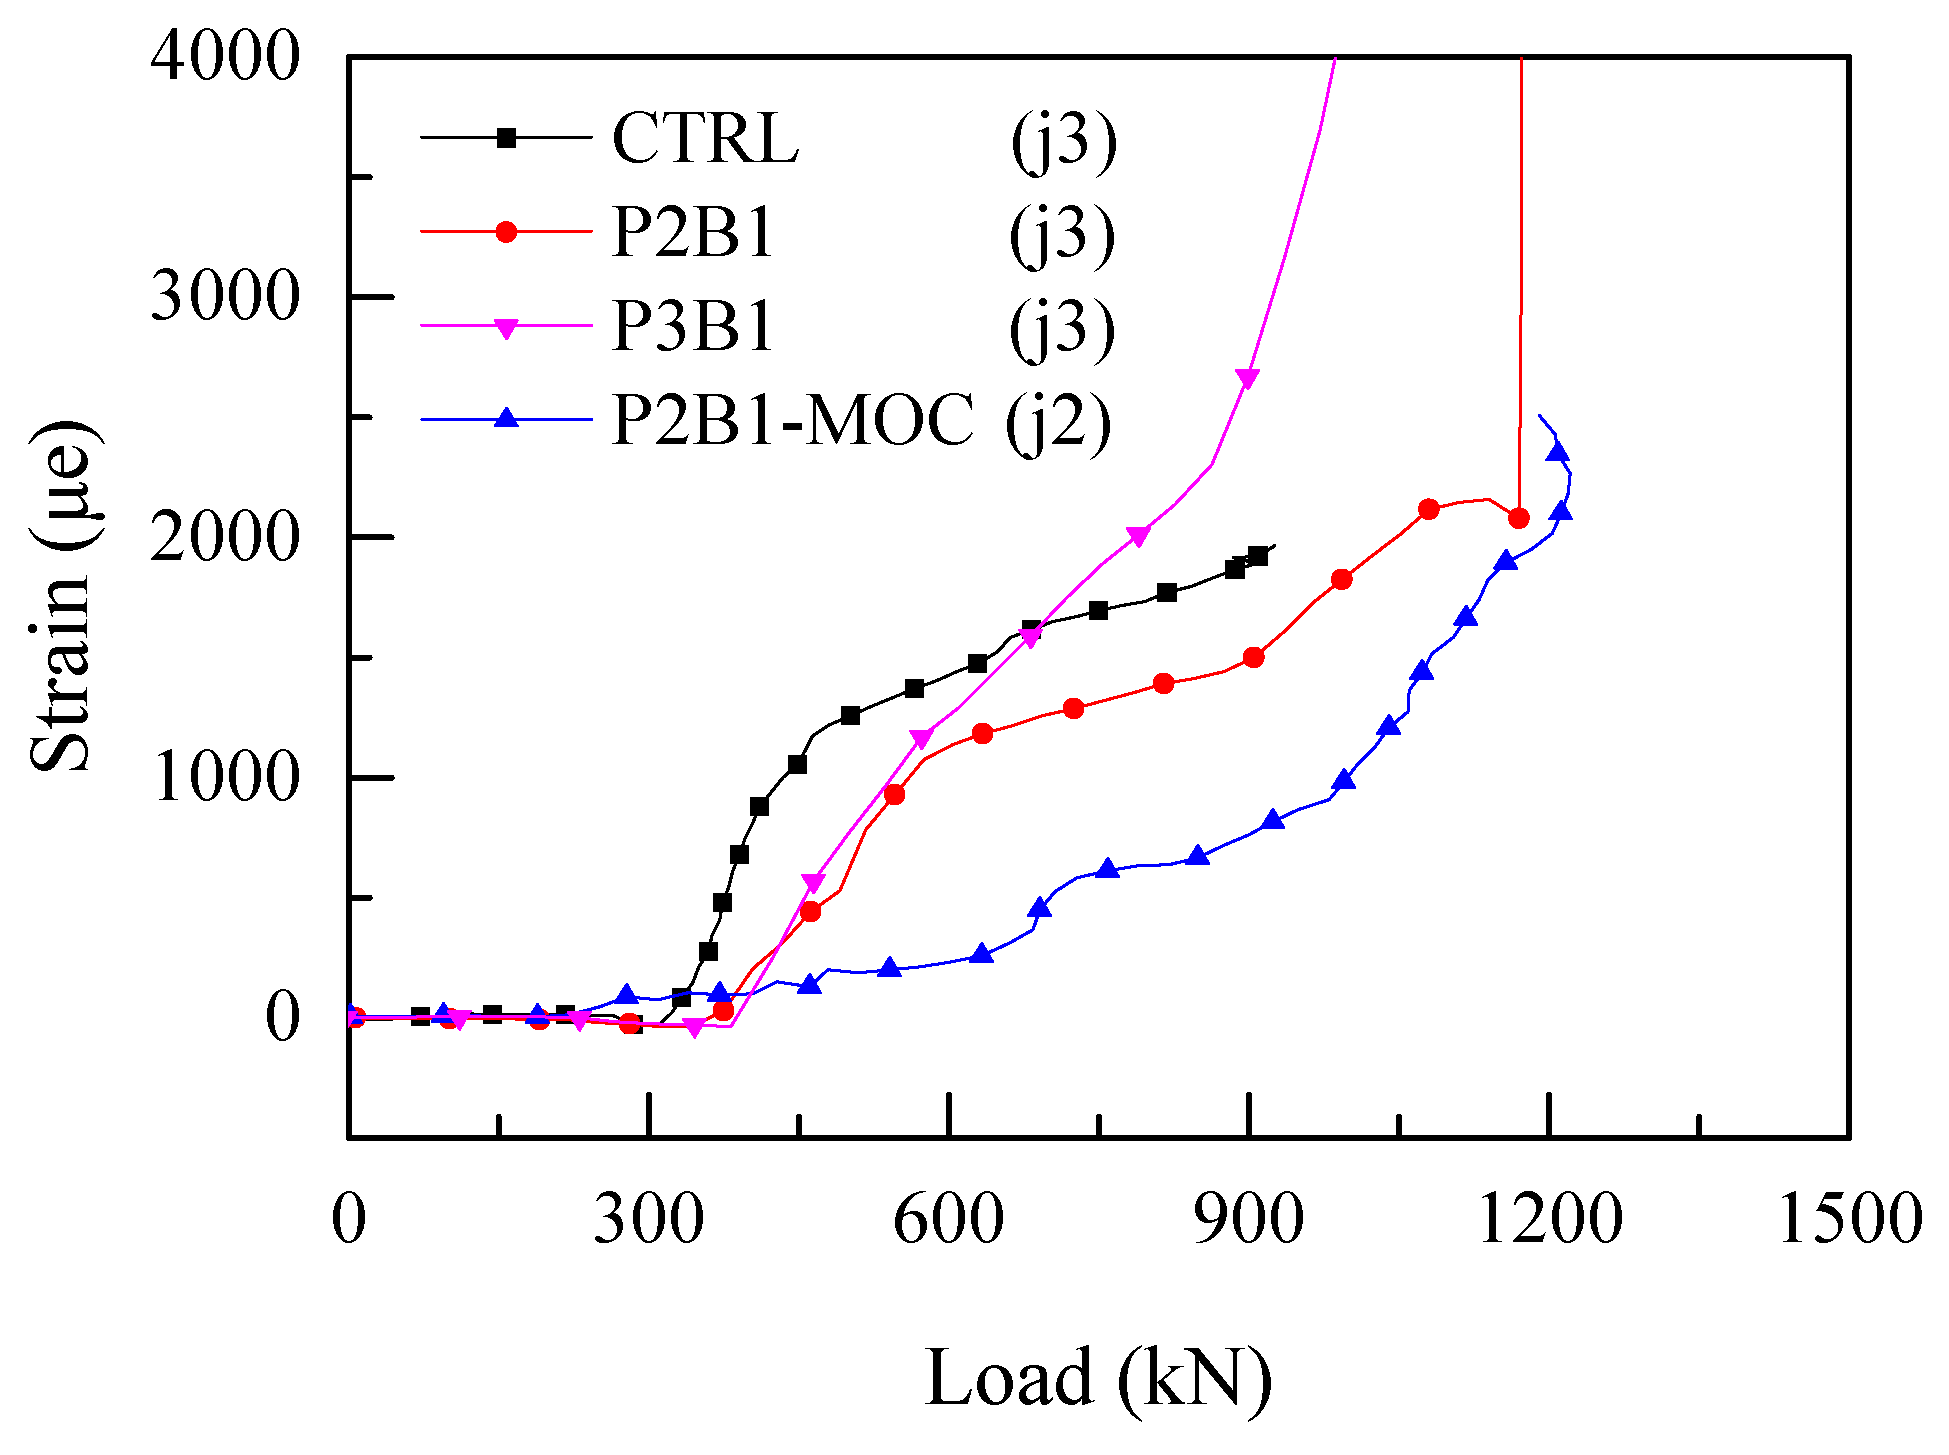
3.4.1. Strains of Stirrups
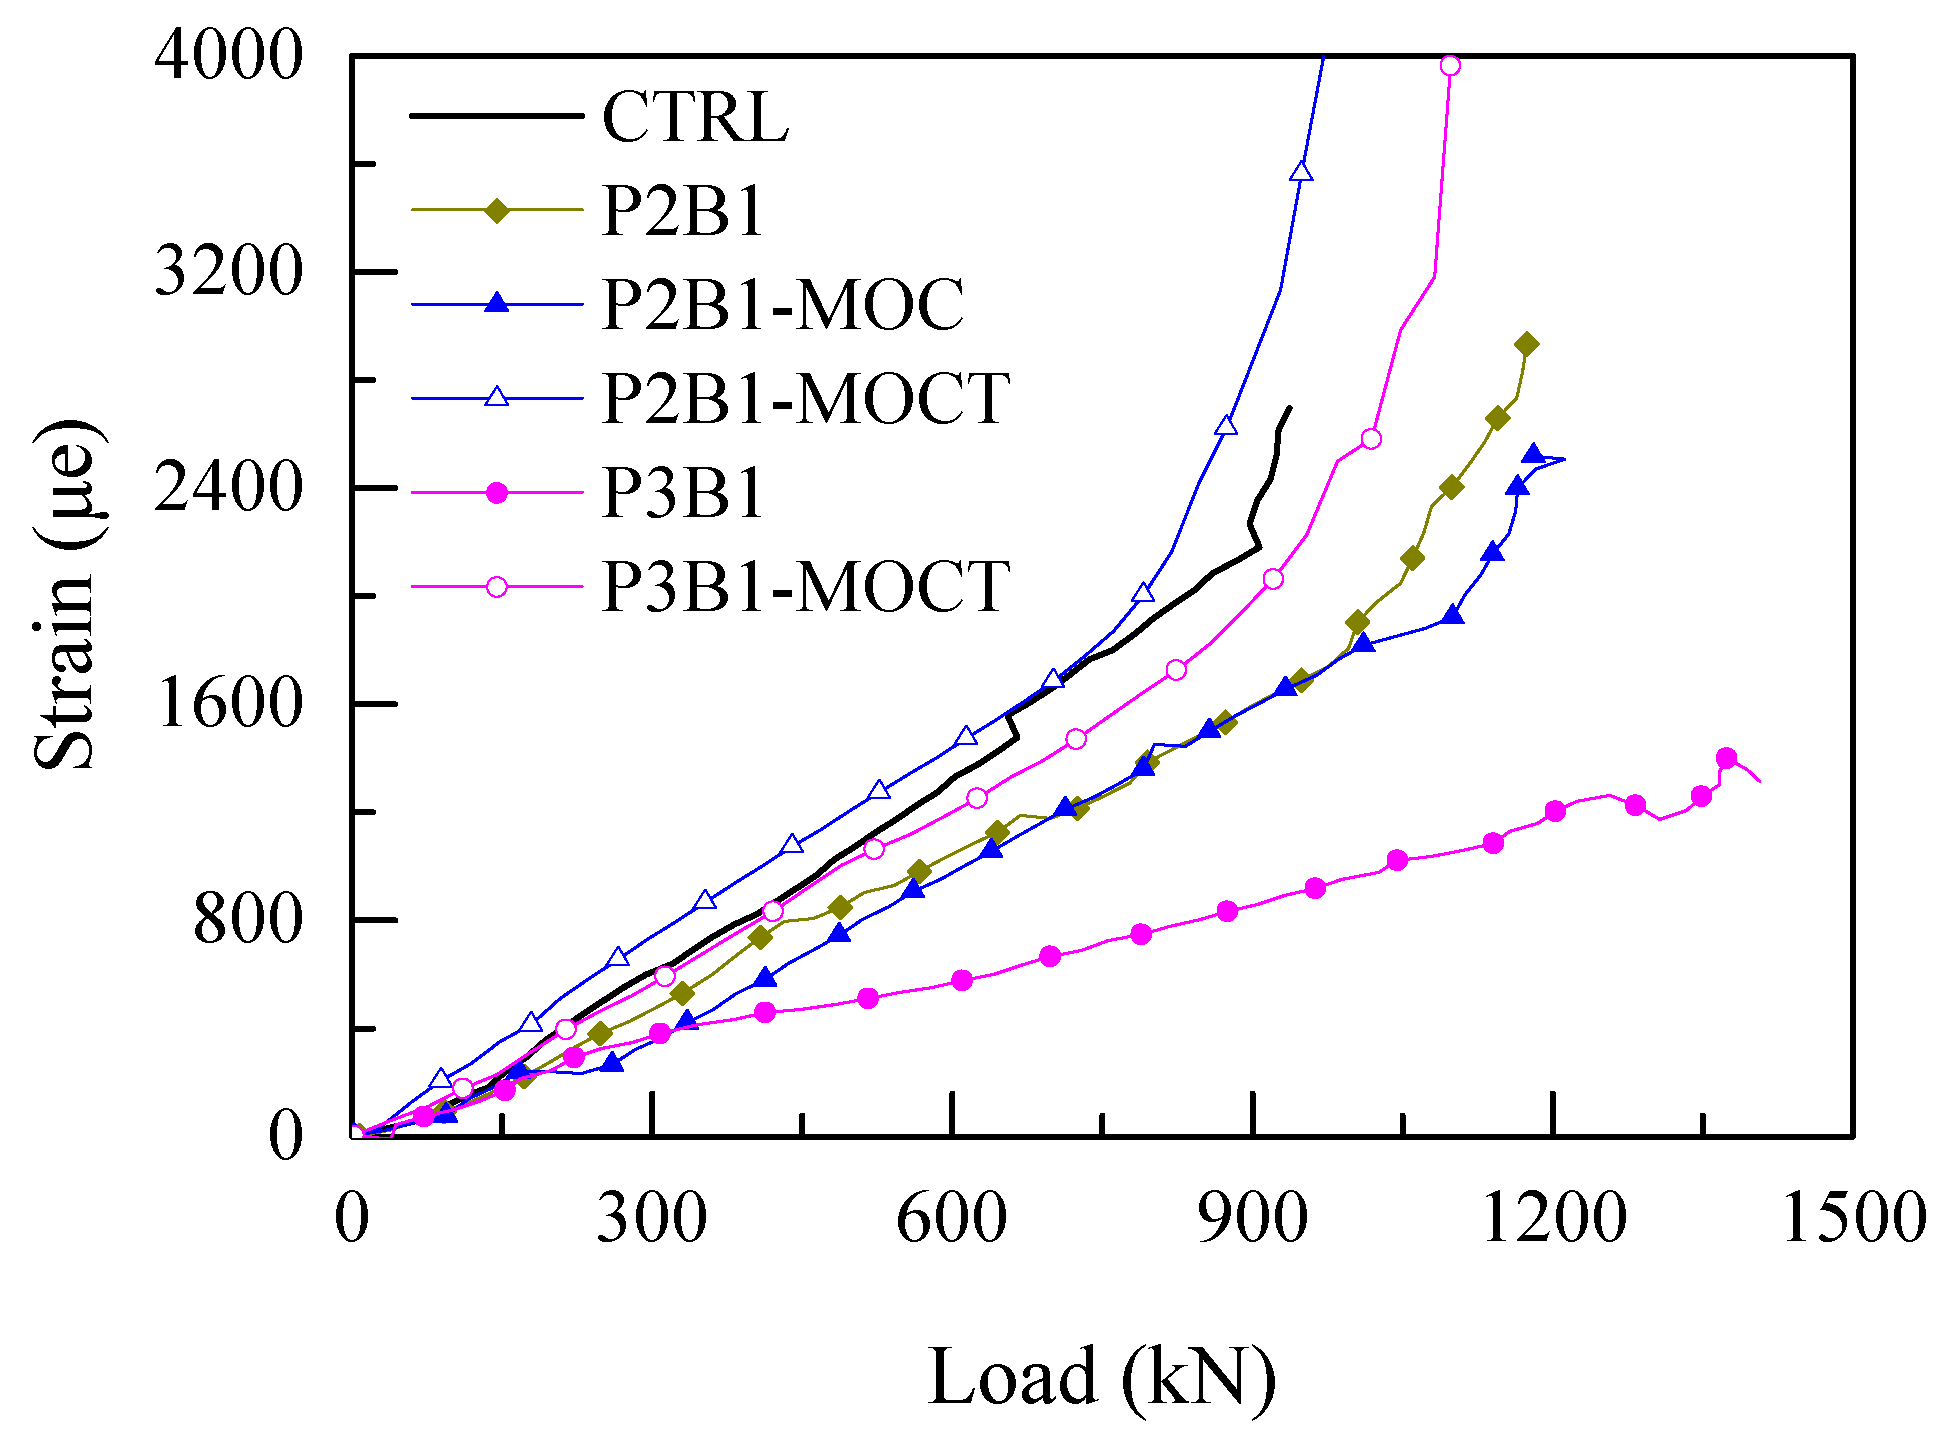
3.4.2. Strains of Tensile Reinforcement
- The deeper steel plates resulted in the smaller strains.
- The specimens after fire intended to exhibit a greater strain, which indicates that the high temperature imposed a harmful influence on the BSP strengthening technique.
- The difference in the strains of the tensile reinforcement caused by the anchor adhesive mortar was negligible.
- The strains developed in the longitudinal rebar of P3B1-MOCT were larger than those of P2B1-MOCT when the external load reached the ultimate bearing capacity. This indicates that the tensile reinforcement sustains higher stress when the failure mode changed from shear-compression to mid-span flexural failure, i.e., the BSP technique is effective in the enhancement of not only the shear capacity but also the bending capacity.
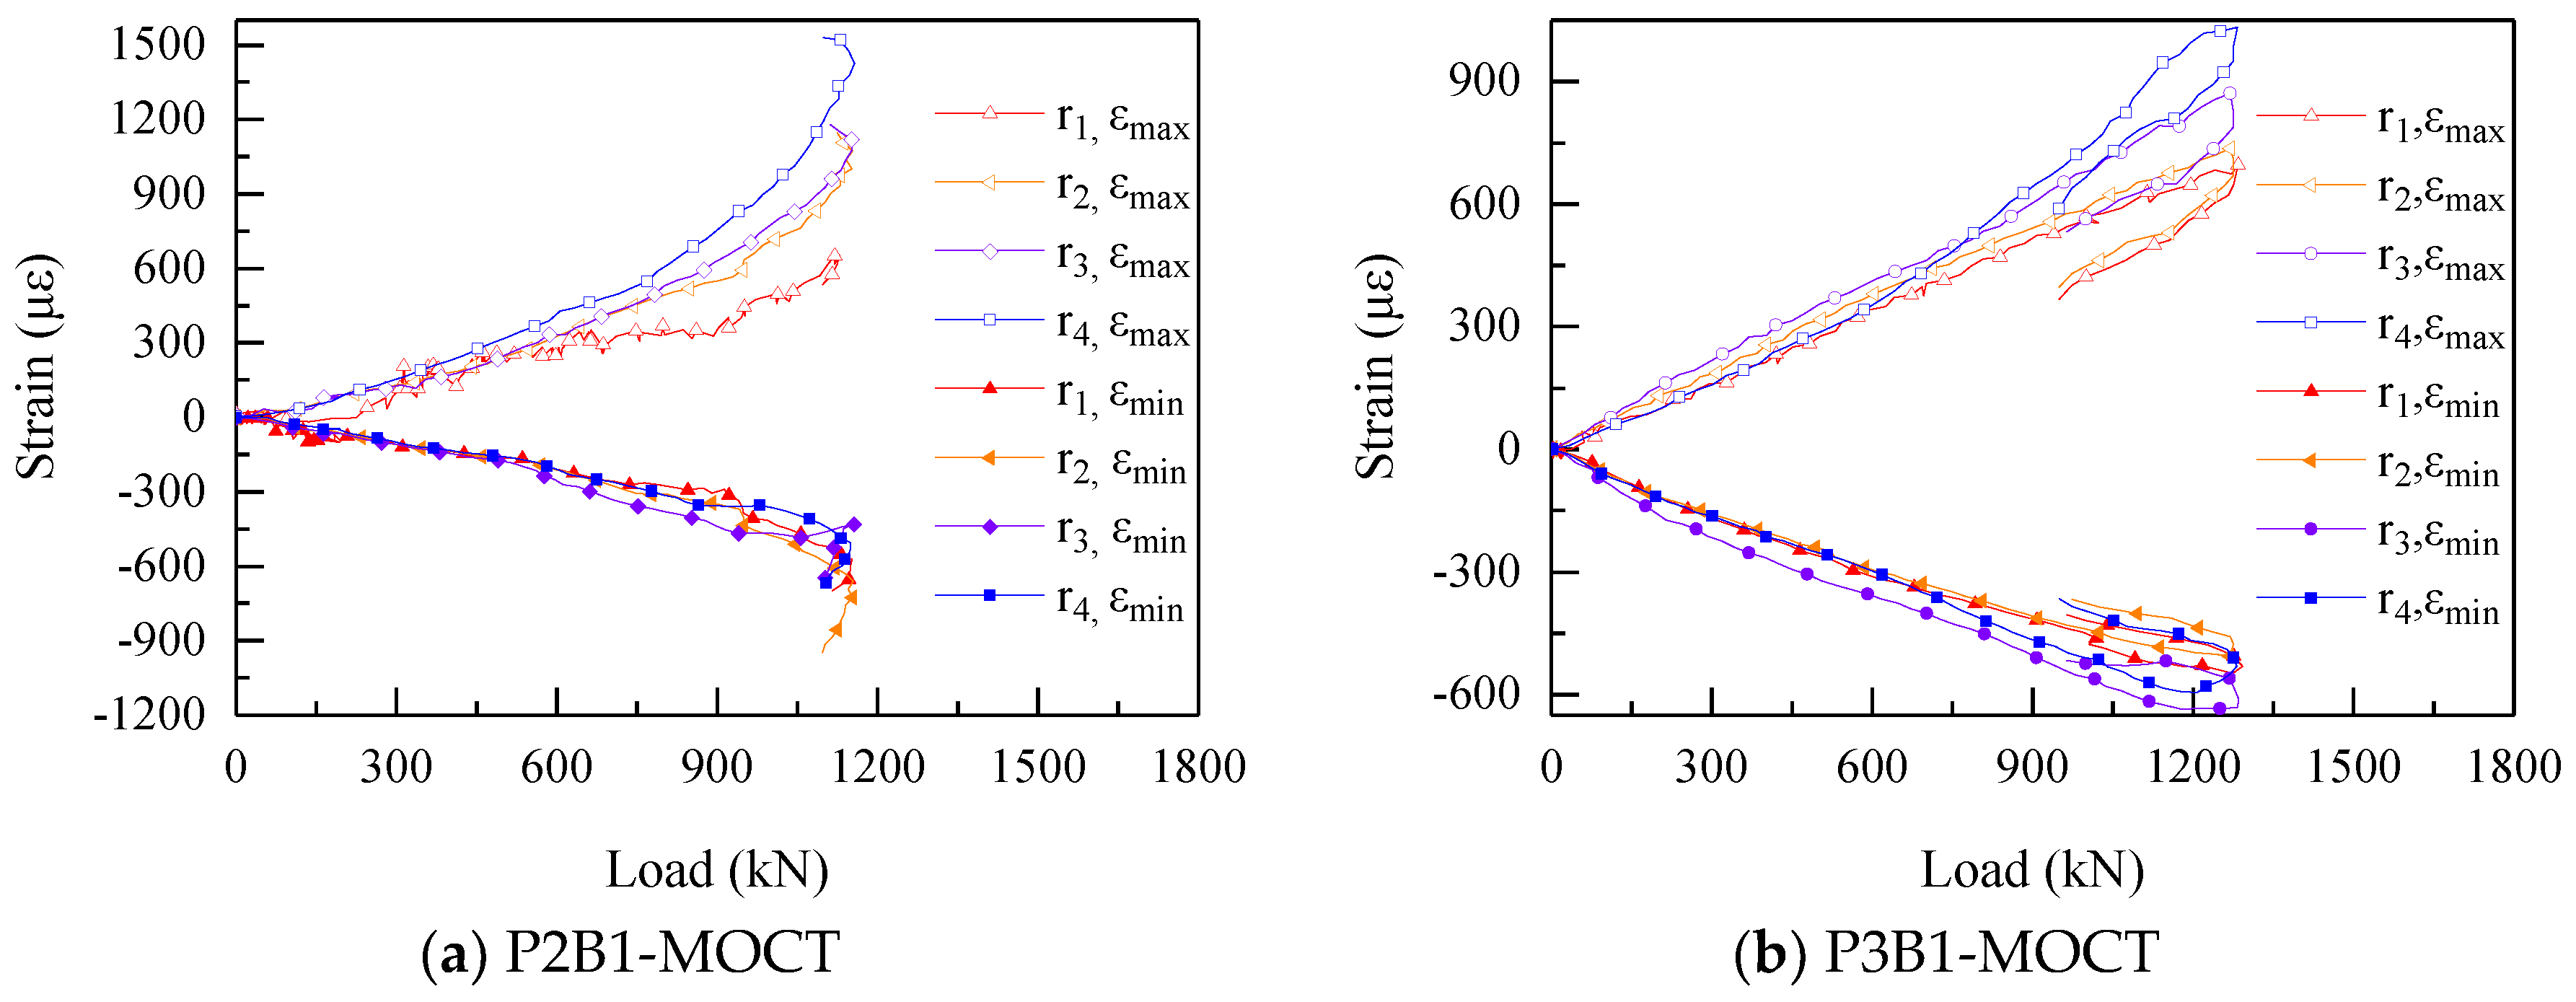
3.4.3. Tensile and Compressive Strains of Steel Plates
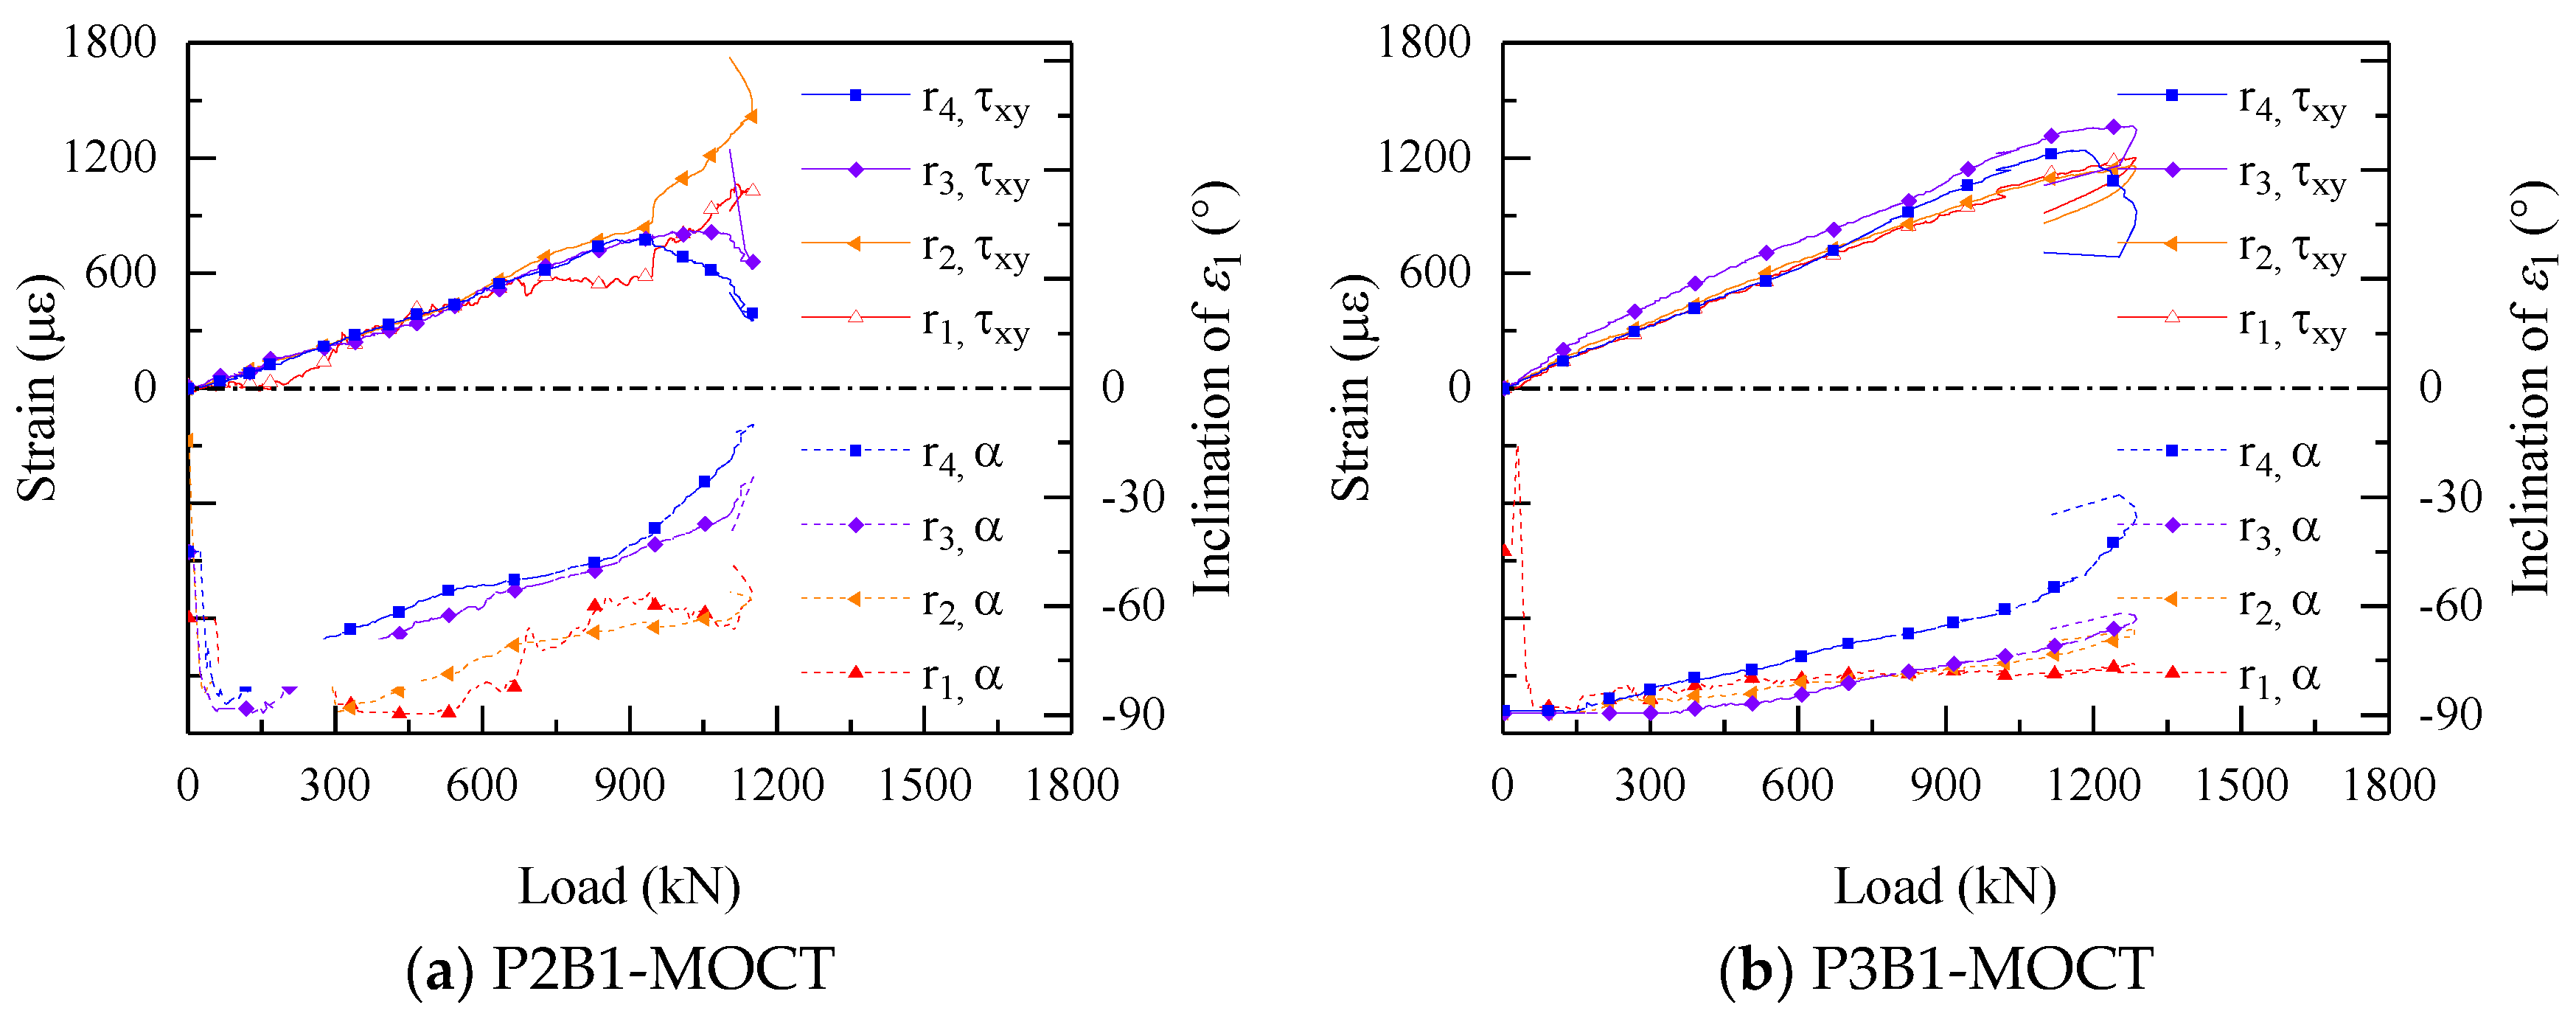
3.4.4. Principal Strains of Steel Plates
3.5. Longitudinal and Transverse Slips
4. Conclusions
Author Contributions
Funding
Conflicts of Interest
References
- Chen, M.T.; Young, B. Material properties and structural behavior of cold-formed steel elliptical hollow section stub columns. Thin-Walled Struct. 2019, 134, 111–126. [Google Scholar] [CrossRef]
- Zhou, J.; Wang, L. Repair of fire-damaged reinforced concrete members with axial Load: A review. Sustainability 2019, 11, 963. [Google Scholar] [CrossRef]
- Wang, L.; Su, R.K.L.; Cheng, B.; Li, L.Z.; Wan, L.; Shan, Z.W. Seismic behavior of preloaded rectangular RC columns strengthened with precambered steel plates under high axial load ratios. Eng. Struct. 2017, 152, 683–697. [Google Scholar] [CrossRef]
- Yang, Y.; Feng, S.Q.; Xue, Y.C.; Yu, Y.L.; Wang, H.Y.; Chen, Y. Experimental study on shear behavior of fire-damaged reinforced concrete T-beams retrofitted with prestressed steel straps. Constr. Build. Mater. 2019, 209, 644–654. [Google Scholar] [CrossRef]
- Lai, M.; Hanzic, L.; Ho, J. Fillers to improve passing ability of concrete. Struct. Concr. 2019, 20, 185–197. [Google Scholar] [CrossRef]
- Li, L.Z.; Cai, Z.W.; Yu, K.Q.; Zhang, Y.X.; Ding, Y. Performance-based design of all-grade strain hardening cementitious composites with compressive strengths from 40 MPa to 120 MP. Cem. Concr. Compos. 2019, 97, 202–217. [Google Scholar] [CrossRef]
- Yu, K.Q.; Li, L.Z.; Yu, J.T.; Wanga, Y.C.; Ye, J.H.; Xu, Q.F. Direct tensile properties of engineered cementitious composites: A review. Constr. Build. Mater. 2018, 165, 346–362. [Google Scholar] [CrossRef]
- Yu, K.; Li, L.; Yu, J.; Xiao, J.; Ye, J.; Wang, Y. Feasibility of using ultra-high ductility cementitious composites for concrete structures without steel rebar. Eng. Struct. 2018, 170, 11–20. [Google Scholar] [CrossRef]
- Yu, K.Q.; Wang, Y.C.; Yu, J.T.; Xu, S.L. A strain-hardening cementitious composites with the tensile capacity up to 8%. Constr. Build. Mater. 2017, 137, 410–419. [Google Scholar] [CrossRef]
- Ding, Y.; Yu, J.T.; Yu, K.Q.; Xu, S.L. Basic mechanical properties of ultra-high ductility cementitious composites: From 40 MPa to 120 MPa. Compos. Struct. 2018, 185, 634–645. [Google Scholar] [CrossRef]
- Yu, K.Q.; Yu, J.T.; Dai, J.G.; Lu, Z.D.; Surendra, P.S. Development of ultra-high performance engineered cementitious composites using polyethylene (PE) fibers. Constr. Build. Mater. 2018, 158, 217–227. [Google Scholar] [CrossRef]
- Weinberg, K.; Khosravani, M.R. On the tensile resistance of UHPC at impact. Eur. Phys. J. Spec. Top. 2018, 227, 167–177. [Google Scholar] [CrossRef]
- Khosravani, M.R.; Weinberg, K. A review on split Hopkinson bar experiments on the dynamic characterisation of concrete. Constr. Build. Mater. 2018, 190, 1264–1283. [Google Scholar] [CrossRef]
- Keshtegar, B.; Bagheri, M.; Yaseen, Z.M. Shear strength of steelfiber-unconfined reinforced concrete beam simulation: Application of novel intelligent model. Compos. Struct. 2019, 212, 230–242. [Google Scholar] [CrossRef]
- Khosravani, M.R.; Nasiri, S.; Anders, D.; Weinberg, K. Prediction of dynamic properties of ultra-high performance concrete by an artificial intelligence approach. Adv. Eng. Softw. 2019, 127, 51–58. [Google Scholar] [CrossRef]
- Su, R.K.L.; Cheng, B.; Wang, L.; Siu, W.H.; Zhu, Y. Use of bolted steel plates for strengthening of reinforced concrete beams and columns. IES J. Part A Civ. Struct. Eng. 2011, 4, 55–68. [Google Scholar] [CrossRef]
- Li, L.Z. New Partial Interaction Models for Bolted-Side-Plated Reinforced Concrete Beams. Ph.D. Thesis, The University of Hong Kong, Pokfulam Road, Hong Kong, China, 2013. [Google Scholar]
- Li, L.Z.; Jiang, C.J.; Jia, L.J.; Lu, Z.D. Local buckling of bolted steel plates with different stiffener configuration. Eng. Struct. 2016, 119, 186–197. [Google Scholar] [CrossRef]
- Liu, X.; Lu, Z.D.; Li, L.Z. The use of bolted side plates for shear strengthening of RC beams: A review. Sustainability 2018, 10, 4658. [Google Scholar] [CrossRef]
- Park, D.G.; Cho, J.Y.; Oh, B.H. Failure behavior and separation criterion for strengthened concrete members with steel plates. J. Struct. Eng. 2003, 129, 1191–1198. [Google Scholar]
- Yu, J.T.; Liu, K.K.; Li, L.Z.; Wang, Y.C.; Yu, K.Q.; Xu, Q.F. A simplified method to predict the fire resistance of RC Beams strengthened with near-surface mounted CFRP. Compos. Struct. 2018, 193, 1–7. [Google Scholar] [CrossRef]
- Zhu, J.H.; Wei, L.L.; Moahmoud, H.; Redaelli, E.; Xing, F.; Bertolini, L. Investigation on CFRP as dual-functional material in chloride-contaminated solutions. Constr. Build. Mater. 2017, 151, 127–137. [Google Scholar] [CrossRef]
- Zhu, J.H.; Su, M.N.; Huang, J.Y.; Ueda, T.; Xing, F. The ICCP-SS technique for retrofitting reinforced concrete compressive members subjected to corrosion. Constr. Build. Mater. 2018, 167, 669–679. [Google Scholar] [CrossRef]
- Carpinteri, A.; Cornetti, P.; Lacidogna, G.; Paggi, M. Towards a unified approach for the analysis of failure modes in FRP-retrofitted concrete beams. Adv. Struct. Eng. 2009, 12, 715–729. [Google Scholar] [CrossRef]
- Carpinteri, A.; Lacidogna, G.; Paggi, M. Acoustic emission monitoring and numerical modeling of FRP delamination in RC beams with non-rectangular cross-section. Mater. Struct. 2007, 40, 553–566. [Google Scholar] [CrossRef]
- Oehlers, D.J.; Nguyen, N.T.; Ahmed, M.; Bradford, M.A. Transverse and longitudinal partial interaction in composite bolted side-plated reinforced-concrete beams. Struct. Eng. Mech. 1997, 5, 553–563. [Google Scholar] [CrossRef]
- Nguyen, N.T.; Oehlers, D.J.; Bradford, M.A. An analytical model for reinforced concrete beams with bolted side plates accounting for longitudinal and transverse partial interaction. Int. J. Solids Struct. 2001, 38, 6985–6996. [Google Scholar] [CrossRef]
- Su, R.K.L.; Zhu, Y. Experimental and numerical studies of external steel plate strengthened reinforced concrete coupling beams. Eng. Struct. 2005, 27, 1537–1550. [Google Scholar] [CrossRef]
- Su, R.K.L.; Li, L.Z.; Lo, S.H. Longitudinal partial interaction in bolted side-plated reinforced concrete beams. Adv. Struct. Eng. 2014, 17, 921–936. [Google Scholar] [CrossRef]
- Su, R.K.L.; Li, L.Z.; Lo, S.H. Shear transfer in bolted side-plated reinforced concrete beam. Eng. Struct. 2013, 56, 1372–1383. [Google Scholar] [CrossRef]
- Siu, W.H.; Su, R.K.L. Effects of plastic hinges on partial interaction behaviour of bolted side-plated beams. J. Constr. Steel Res. 2010, 66, 622–633. [Google Scholar] [CrossRef]
- Siu, W.H.; Su, R.K.L. Load–deformation prediction for eccentrically loaded bolt groups by a kinematic hardening approach. J. Constr. Steel Res. 2009, 65, 436–442. [Google Scholar] [CrossRef]
- Su, R.K.L.; Siu, W.H. Nonlinear response of bolt groups under in-plane loading. Eng. Struct. 2007, 29, 626–634. [Google Scholar] [CrossRef]
- Li, L.Z.; Lo, S.H.; Su, R.K.L. Experimental study of moderately reinforced concrete beams strengthened with bolted-side steel plates. Adv. Struct. Eng. 2013, 16, 499–516. [Google Scholar] [CrossRef]
- Lo, S.H.; Li, L.Z.; Su, R.K.L. Optimization of partial interaction in bolted side-plated reinforced concrete beams. Comput. Struct. 2014, 131, 70–80. [Google Scholar] [CrossRef]
- Li, L.Z.; Jiang, C.J.; Su, R.K.L.; Lo, S.H. Design of bolted side-plated reinforced-concrete beams with partial interaction. Proc. Inst. Civ. Eng. Struct. Build. 2016, 169, 81–95. [Google Scholar] [CrossRef]
- Li, L.Z.; Jiang, C.J.; Su, R.K.L.; Lo, S.H. A piecewise linear transverse shear transfer model for bolted side-plated beams. Struct. Eng. Mech. 2017, 62, 443–453. [Google Scholar] [CrossRef]
- Xu, X.L.; Lu, Z.D.; Li, L.Z.; Jiang, C.J. Numerical study on the local buckling behaviour of bolted steel plates in steel jacketing. Adv. Mater. Sci. Eng. 2017, 2017, 1352084. [Google Scholar] [CrossRef]
- Li, L.Z.; Wu, Z.L.; Yu, J.T.; Wang, X.; Zhang, J.X.; Lu, Z.D. Numerical simulation of the shear capacity of bolted side-plated RC beams. Eng. Struct. 2018, 171, 373–384. [Google Scholar] [CrossRef]
- Li, L.Z.; Liu, X.; Luo, Y.; Su, M.N.; Zhu, J.H. Flexural performance of bolted-side-plated reinforced concrete beams with local buckling restraining. ACI Struct. J. 2019, 116, 77–87. [Google Scholar]
- Barnes, R.A.; Baglin, P.S.; Mays, G.C.; Subedi, N.K. External steel plate systems for the shear strengthening of reinforced concrete beams. Eng. Struct. 2001, 23, 1162–1176. [Google Scholar] [CrossRef]
- Li, L.Z.; Cai, Z.W.; Lu, Z.D.; Zhang, X.L.; Wang, L. Shear performance of bolted side-plated reinforced concrete beams. Eng. Struct. 2017, 144, 73–87. [Google Scholar] [CrossRef]
- Jiang, C.J.; Lu, Z.D.; Li, L.Z. Shear performance of fire-damaged reinforced concrete beams repaired by a bolted side-plating technique. J. Struct. Eng. Asce 2017, 143, 4017007. [Google Scholar] [CrossRef]
- Department for Communities and Government. Fire Statistics: Great Britain April 2013 to March 2014; Department for Communities and Government: London, UK, 2015.
- Jiang, C.J.; Yu, J.T.; Li, L.Z.; Wang, X.; Wang, L.; Liao, J.H. Experimental study on the residual shear capacity of fire-damaged RC frame beams and cantilevers. Fire Saf. J. 2018, 100, 140–156. [Google Scholar] [CrossRef]
- Li, L.Z.; Liu, X.; Yu, J.T.; Lu, Z.D.; Su, M.N.; Liao, J.H.; Xia, M. Experimental study on seismic performance of post-fire reinforced concrete frames. Eng. Struct. 2019, 179, 161–173. [Google Scholar] [CrossRef]
- Arioz, O. Effects of elevated temperatures on properties of concrete. Fire Saf. J. 2007, 42, 516–522. [Google Scholar] [CrossRef]
- Kodur, V. Properties of concrete at elevated temperatures. Isrn Civ. Eng. 2014, 2014, 1–15. [Google Scholar] [CrossRef]
- Kadhum, M.M. Fire resistance of reinforced concrete rigid beams. J. Civ. Eng. Constr. Technol. 2014, 5, 35–48. [Google Scholar]
- Topcu, I.B.; Boga, A.R.; Demir, A. The effect of elevated temperatures on corroded and uncorroded reinforcement embedded in mortar. Constr. Build. Mater. 2010, 24, 2101–2107. [Google Scholar] [CrossRef]
- Topcu, I.B.; Isikdag, B. The effect of cover thickness on rebars exposed to elevated temperatures. Constr. Build. Mater. 2008, 22, 2053–2058. [Google Scholar] [CrossRef]
- Topcu, I.B.; Karakurt, C. Properties of reinforced concrete steel rebars exposed to high temperatures. Res. Lett. Mater. Sci. 2008, 2008, 1–4. [Google Scholar] [CrossRef]
- Unluoglu, E.; Topcu, I.B.; Yalaman, B. Concrete cover effect on reinforced concrete bars exposed to high temperatures. Constr. Build. Mater. 2007, 21, 1155–1160. [Google Scholar] [CrossRef]
- Ergun, A.; Kurklu, G.; Baspinar, M. The effects of material properties on bond strength between reinforcing bar, concrete exposed to high temperature. Constr. Build. Mater. 2016, 112, 691–698. [Google Scholar] [CrossRef]
- Li, G.Q.; Jiang, S.C.; Yin, Y.Z.; Chen, K.; Li, M.F. Experimental studies on the properties of constructional steel at elevated temperatures. J. Struct. Eng. 2003, 129, 1717–1721. [Google Scholar] [CrossRef]
- Miamis, K. A Study of the Effects of High Temperature on Structural Steel Framing. Ph.D. Thesis, Purdue University, West Lafayette, Indiana, 2007. [Google Scholar]
- Kwon, I.; Shin, S. Mechanical thermal properties of SM 490 at high temperature for fire engineering design. Met. Mater. Int. 2010, 16, 559–564. [Google Scholar] [CrossRef]
- Santiago, A.; Silva, L.S.D.; Real, P.V.; Vaz, G.; Lopes, A.G. Experimental evaluation of the influence of connection typology on the behavior of steel structures under fire. Eng. J. 2009, 46, 81–98. [Google Scholar]
- Kirby, B.R. The behaviour of high-strength grade 8.8 bolts in fire. J. Constr. Steel Res. 1995, 33, 3–38. [Google Scholar] [CrossRef]
- Banea, M.D.; de Sousa, F.; da Silva, L.; Campilho, R.; de Pereira, A.B. Effects of temperature and loading rate on the mechanical properties of a high temperature epoxy adhesive. J. Adhes. Sci. Technol. 2011, 25, 2461–2474. [Google Scholar] [CrossRef]
- Li, Z.J.; Chau, C.K. Influence of molar ratios on properties of magnesium oxychloride cement. Cem. Concr. Res. 2007, 37, 866–870. [Google Scholar] [CrossRef]
- Alley, R.I.; Caine, G.E. Magnesium Oxychloride Cement Compositions and Methods for Manufacture and Use. U.S. Patent 5,004,505, 2 April 1991. [Google Scholar]
- Malinowski, S.; Jaroszyńskawolińska, J. The physical and mechanical properties of magnesium oxychloride cement-based materials. Bud. I Archit. 2015, 14, 89–98. [Google Scholar]
- Wu, J.Y.; Zhu, S.Q. The development of magnesium oxychloride cement and its products. China Non-Met. Min. Ind. Her. 2006, 1, 3. [Google Scholar]


| Specimen | Plate Depth (mm) | Bolt Spacing (mm) | Anchor Adhesive Mortar | Temperature Environment |
|---|---|---|---|---|
| CTRL | N/A | N/A | N/A | N/A |
| P2B1 | 200 | 100 | HIT-RE500 | Room Temperature |
| P3B1 | 300 | 100 | HIT-RE500 | Room Temperature |
| P2B1-MOC | 200 | 100 | MOC | Room Temperature |
| P2B1-MOCT | 200 | 100 | MOC | High Temperature |
| P3B1-MOCT | 300 | 100 | MOC | High Temperature |
| Sample | Diameter/Thickness (mm) | Yield Strength (MPa) | Ultimate Strength (MPa) | Young’s Modulus (GPa) |
|---|---|---|---|---|
| Shear stirrup | 6 | 574 | 675 | 219 |
| Compressive rebar | 12 | 484 | 628 | 184 |
| Tensile rebar | 25 | 471 | 636 | 194 |
| Steel plate | 4 | 324 | 469 | 209 |
| Anchor bolt | 12 | 689 | 810 | 211 |
| Composition | MgO | MgCl2 | H2O | Water Cement Ratio |
|---|---|---|---|---|
| Mass ratio | 1000 | 384 | 276.8 | 0.2 |
| No. | Tmax (°C) | Time (min) | No. | Tmax (°C) | Time (min) |
|---|---|---|---|---|---|
| Furnace | 989 | 120 | M1D90 | 588 | 138 |
| M0 | 859 | 120 | R2D90 | 139 | 178 |
| M1 | 116 | 180 | R1D90 | 310 | 180 |
| M3 | 100 | 178 | R2D45 | 170 | 177 |
| L3D90 | 112 | 180 | R1D45 | 327 | 148 |
| L2D90 | 133 | 176 | Tensile rebar | 483 | 136 |
| L1D90 | 327 | 163 | Stirrup | 191 | 177 |
| Specimen | Pf (kN) | Pd (kN) | Pu (kN) | Pf/Pu | Pd/Pu | Pu/PCTRL−1 | Failure Mode |
|---|---|---|---|---|---|---|---|
| CTRL | 126 | 212 | 942 | 0.13 | 0.23 | -- | ST |
| P2B1 | 160 | 400 | 1174 | 0.14 | 0.34 | 25% | SC |
| P3B1 | 85 | 500 | 1409 | 0.06 | 0.35 | 50% | SC |
| P2B1-MOC | 125 | 401 | 1230 | 0.1 | 0.33 | 31% | SC |
| P2B1-MOCT | 263 | 315 | 1158 | 0.11 | 0.27 | 23% | SC |
| P3B1-MOCT | 140 | 503 | 1292 | 0.11 | 0.39 | 37% | MF |
| Specimen | Stiffness | Maximum Deflection | Modulus of Toughness | |||
|---|---|---|---|---|---|---|
| Ke (kN/mm) | Improvement | Dmax (mm) | Improvement | Ut (kN.mm) | Improvement | |
| CTRL | 92.0 | -- | 11.5 | -- | 6019.4 | -- |
| P2B1 | 116.5 | 27% | 14.3 | 24% | 10,894.7 | 81% |
| P3B1 | 133.9 | 46% | 25.0 | 117% | 27,752.6 | 362% |
| P2B1-MOC | 109.3 | 19% | 20.2 | 76% | 17,974.4 | 199% |
| P2B1-MOCT | 81.5 | −11% | 21.9 | 90% | 17,103.7 | 184% |
| P3B1-MOCT | 86.4 | −6% | 28.5 | 147% | 27,101.9 | 350% |
© 2019 by the authors. Licensee MDPI, Basel, Switzerland. This article is an open access article distributed under the terms and conditions of the Creative Commons Attribution (CC BY) license (http://creativecommons.org/licenses/by/4.0/).
Share and Cite
Liu, X.; Chen, Y.; Li, L.-Z.; Su, M.-N.; Lu, Z.-D.; Yu, K.-Q. Experimental Study on the Shear Performance of Reinforced Concrete Beams Strengthened with Bolted Side-Plating. Sustainability 2019, 11, 2465. https://doi.org/10.3390/su11092465
Liu X, Chen Y, Li L-Z, Su M-N, Lu Z-D, Yu K-Q. Experimental Study on the Shear Performance of Reinforced Concrete Beams Strengthened with Bolted Side-Plating. Sustainability. 2019; 11(9):2465. https://doi.org/10.3390/su11092465
Chicago/Turabian StyleLiu, Xin, Yu Chen, Ling-Zhi Li, Mei-Ni Su, Zhou-Dao Lu, and Ke-Quan Yu. 2019. "Experimental Study on the Shear Performance of Reinforced Concrete Beams Strengthened with Bolted Side-Plating" Sustainability 11, no. 9: 2465. https://doi.org/10.3390/su11092465
APA StyleLiu, X., Chen, Y., Li, L.-Z., Su, M.-N., Lu, Z.-D., & Yu, K.-Q. (2019). Experimental Study on the Shear Performance of Reinforced Concrete Beams Strengthened with Bolted Side-Plating. Sustainability, 11(9), 2465. https://doi.org/10.3390/su11092465