Article

Research on Population-Land-Industry Relationship Pattern in Underdeveloped Regions: Gansu Province of Western China as an Example

College of Geography and Environmental Science, Northwest Normal University, Lanzhou 730000, China
*
Author to whom correspondence should be addressed.
Sustainability 2019, 11(8), 2434; https://doi.org/10.3390/su11082434
Submission received: 14 March 2019 / Revised: 19 April 2019 / Accepted: 19 April 2019 / Published: 24 April 2019

Abstract

:
Urbanization is a three-dimensional process including population, spatial, and economic changes. The coordination among the three dimensions is the key to sustainable urban development. Here, a population-land-industry index system of urbanization is constructed, and the degree of coupling and mutual feedback among population urbanization, land urbanization, and industrial urbanization are analyzed. The urbanization patterns and their spatiotemporal variation are identified. The results show that: (1) Population and land urbanization proceeded slowly in Gansu Province and their trends were similar, whereas industry urbanization proceeded faster than the two. From a spatial perspective, population, land, and industrial urbanization levels (PUi, LUi, and IUi) decreased from southwest to northeast. The coupling degree of population, land, and industrial urbanization increased from 1998 to 2016 and showed significant spatial variation, decreasing from northwest to southeast. (2) Population, land, and industry all play a role in urbanization. PUi was significantly and positively correlated with LUi. However, there was no significant correlation between IUi and PUi and between IUi and LUi. The improvement of PUi, LUi, and IUi effectively promoted the coupling degree of population, land, and industrial urbanization. (3) Seven urbanization patterns were identified in Gansu Province and evaluation units with the same urbanization pattern tended to be spatially close to each other. IUi > PUi > LUi (IX), IUi > LUi > PUi (X) and IUi > PUi = LUi (XI) were the dominant urbanization patterns. There was crisscross distribution of various urbanization patterns and, thus, it was not easy to observe the agglomeration center of certain urbanization pattern. (4) The urbanization pattern of the same evaluation unit changed with time. This change was mainly reflected in the change of relationship between population and land urbanization. Urbanization pattern changed more significantly in 2008–2016 than in 1998–2008. The changes were dominant by IX→XI, X→XI, XI→IX, and XI→X.

1. Introduction

Urbanization is a global phenomenon of socioeconomic transformation. With the acceleration of economic globalization, global urbanization and urban systems are undergoing important transformation and reconstruction. The urbanization of developed countries has basically reached a mature stage, and the focus of research has thus shifted to urbanization in developing countries. China’s unique urbanization pattern has especially attracted extensive attention [1,2,3]. Since the 21st century, China has been experiencing rapid urbanization and industrialization. Although remarkable achievements have been made, the drawbacks of traditional urbanization pattern with the goal of quantity growth have become increasingly apparent [4,5]. These drawbacks include waste of land resources, lack of urban functions, social disharmony, population urbanization lagging behind land urbanization, widening urban-rural gap, short settlement period, etc. The most severe problem is the poor quality of urbanization, especially the incoordination between land and population urbanization [6,7]. This is an important issue that is related to the sustainable development of human society and is a comprehensive research field that requires extensive and in-depth investigation. Friedmann pointed out that urbanization is a complex multidimensional process involving social space [8].
Chinese scholars pointed out that the growth of urbanization in China is characterized by incoordination, and specifically, land urbanization is proceeding faster than population urbanization [9]. In China, local governments often focus too much on urban spatial expansion or population agglomeration. It is also their custom to ignore the comprehensive development of land resources and fail to guide the urbanization of farmers. In this background, the coordinated growth of population urbanization and land urbanization has gradually become a hot research topic [10,11,12]. Most related research focuses on the influencing factors of coordination in urbanization [13], the causes of coordination in urbanization, and coordination in different types of urbanization [5,14,15]. Moreover, the definition of urban and rural areas is still controversial, causing difficulties in the differentiation of urban and rural populations [16]. International scholars generally define cities and villages through multiple indicators, such as population size and density, land use scale and density, and commuting time, and then judge the level of urbanization [17,18,19]. In China, scholars generally measure the comprehensive urbanization level of a region by weighted summation of multiple indicators. The key to this method is to construct a comprehensive indicator system that reflects the characteristics of urbanization in a region and then calculate the urbanization level based on the established indicator system. The multidimensional characteristics of the comprehensive indicator system overcomes the defect that single indicator method cannot reflect the rich connotation of urbanization. Indicator selection mainly considers population, economy, society, landscape, or environment, and is in accordance with the specific connotation of urbanization (e.g., population-land urbanization, population-land-industry urbanization, population-economy-land-society urbanization, etc.). On this basis, the calculated comprehensive urbanization level is able to reflect the connotation of urbanization.
Due to historical or practical reasons, there are still many problems remaining unsolved. The most prominent one is that they ignore something important. Researchers analyze urbanization from multiple dimensions, but they neglect a series of changes in economic development, social structure, and lifestyle during urbanization [7,20,21,22]. They also do not notice the structural relationships between dimensions and the evolution patterns of various dimensions [23]. Notably, there is little research on the time-series evolution of urbanization pattern, which is not conducive to revealing the rules of regional urbanization. On this basis, this paper focused on the three most important factors influencing urbanization: Population, land, and industry. Population agglomeration, urbanization of industry, and urbanization of land use should match with each other [24]. In other words, each of the three dimensions should adapt to and coordinate with each other. During rapid urbanization, the transfer of rural population to cities leads to the increase of demand for urban construction land, which then promotes the conversion of rural lands to urban uses. Land is the basic carrier of industrial development. Its various functions support continuous industrial development and lead to the accumulation of production factors in nonagricultural sector [24]. The coordination among them is conducive to promoting the development of coordination and sustainable of the three major systems of economy, society, and environment, as well as the regional economy and population, resources, environment, society, and internal strata [25,26,27]. It means the realization of effective nonagricultural transformation of population livelihood, coordinated development of land urbanization and population urbanization, and coordinated transformation of land urbanization and industrial transformation. A schematic illustrating the relationship among the three dimensions of urbanization and their coordination is presented (Figure 1) [28].
The Gansu Province, with poor economic development and low per capita income, is a typical underdeveloped region of China. In the process of urbanization, it faces problems such as low-level of urbanization, incomplete modern urban systems, uncoordinated urban-rural development, and excessive urbanization of agricultural lands. These problems are obstacles to the sustainable development of cities and can influence national economic construction, social stability, and security. Urban sustainable development is the process of achieving urban sustainability. Sustainable urbanization is a dynamic process that considers the various environmental, social, economic, and governance factors [29,30]. It emphasizes the simultaneous development of economy, society, and environment in the process of urbanization, as well as coordination between cities, between cities and rural areas, and between population, lands, and industries in development. The goal is to effectively manage and solve problems in urban space, such as ecological environmental protection, rational utilization of resources, personal welfare, and the satisfaction of basic human needs, to realize the comprehensive progress of urban society and the sustainable, stable, and coordinated development of the entire urban and rural regional system [31,32]. Taking the Gansu Province as the research object, we constructed a comprehensive evaluation index system for urbanization and used the coupling degree and Pearson models to analyze. The coordination and mutual feedback among the three dimensions (population, land, and industry) of urbanization as well as the time-series evolution of urbanization pattern are analyzed concretely in this paper. This paper attempts to use qualitative and quantitative methods in combination to reveal the coupling degree of population, land, and industrial urbanization in the Gansu Province and further understand the interaction between various elements in the process of urbanization. The results can provide useful information for solving the incoordination in urbanization process and achieving scientific development of cities.

2. Overview of Study Region

Gansu Province is located in inland western China and specifically at the intersection of China’s northwest arid region, Qinghai-Tibet alpine region, and eastern monsoon region. It is thus the only province in China that has three natural geographical regions. The whole province is between 92°13′ E and 108°46′ E and between 32°31′ N and 42°57′ N (Figure 2). The total area of the province is 42.58 × 10⁴ km2, accounting for 4.72% of total area of China. The terrain tilts from southwest to northeast, and the areas of mountains and plateaus account for about 70% of the total land area of Gansu Province. Since the Gansu Province is located in inland China, it is difficult for warm and humid air currents from oceans to reach this region, precipitation is infrequent, and the climate in most regions is dry. Overall, the province has a continental temperate monsoon climate. The rivers in the Gansu Province include both exoreic rivers (Yangtze River and Yellow River) and inland rivers. The drainage basin areas of these rivers account for 8%, 32%, and 60% of the total area of the Gansu Province, respectively.
The Gansu Province has jurisdiction over 14 cities (or prefectures) and 87 counties (or county-level cities and districts). It can be divided into five regions: Hexi Corridor region (Jiuquan city, Jiayuguan city, Zhangye city, Jinchang city, and Wuwei city), Longzhong region (Lanzhou city, Dingxi city, Baiyin city, and Linxia prefecture), Longdong region (Pingliang city and Qingyang city), Longdongnan region (Tianshui city and Longnan city), and Gannan region (Gannan prefecture). In 2017, the total population of Gansu Province reached 26.2571 million, among which the urban population reached 12.1807 million, accounting for 46.39% of permanent resident population. Many economic indicators of the Gansu Province are poorer than those of other provinces of China. In 2017, the GDP of Gansu Province was 767.7 billion Yuan and per capita GDP was 29,326 Yuan, both showing an increasing trend. The population of Gansu Province accounted for 1.89% of total population of the country, whereas its GDP accounted for only 0.93% of that of the country. The Gansu Province’s social fixed asset investment accounted for 0.89% of that of the country, and general public budget revenue accounted for only 0.48% of that of the country. Gross agricultural product and the yields of main agricultural products both accounted for about 2.0% of those of the country. Gansu’s GDP accounts for only about 30% of Shanghai and Liaoning’s, and about 10% of Guangdong and Jiangsu’s. The gap is widening. Among the 12 provinces (municipalities and autonomous regions) in western China, the Gansu Province is only ranked eigth in terms of GDP. Its further development is limited by market, capital, technology, ecology, environment, and human resources. In 2017, the per capita disposable income of urban residents in Gansu Province was 27,763.4 Yuan, and the per capita net income of farmers in Gansu Province was 8076.1 Yuan. In 2011–2017, the annual average growth rates of both exceeded 11%. The per capita consumption expenditure of urban residents in Gansu Province was 20,659.4 Yuan, which was 2.66 times of that of rural residents. The Engel’s coefficient of residents in Gansu Province was 29.6%, and the difference in the coefficient between urban and rural areas was small. The incidence of poverty was 9.7%.

3. Research Methods and Data Sources

3.1. Research Methods

3.1.1. Constructing an Index System of Population-Land-Industry Urbanization

According to existing research and considering the availability and quantifiability of data, we selected three indices to evaluate urbanization rural transformation degree at a county scale in Gansu Province. The three indices included population urbanization rate, land urbanization rate, and industrial urbanization rate [28]. The calculation procedures are as follows:
P U i = U P i / T P i
L U i = U L i + I L i U L i + I L i + R L i
I U i = G D P i P G D P i G D P i
where PUi is the population urbanization rate of the ith county. Increase in PUi reflects the transfer of rural population to urban areas, which leads to increasing share of urban population in total population. UPi is the permanent urban population at year end in ith county. TPi is the total permanent population at year-end in ith county. LUi is the land urbanization rate of the ith county. ULi is the area of urban construction lands (including urban lands used for residential, commercial, industrial, warehousing, institution, school, and other purposes) in the ith county. RLi is the area of rural construction lands (including rural lands used for residential, industrial, warehousing, institution, school, and other purposes) in the ith county. ILi is the area of industrial and mining lands (including lands used for industrial and mining purposes) in the ith county [33]. IUi is the industrial urbanization rate of the ith county. Increase in IUi reflects the flow of production factors from rural areas to urban areas, which leads to the change and development of industrial structure with socio-economic development. GDPi is the GDP of the ith county. PGDPi is the primary sector GDP of the ith county.

3.1.2. Constructing a Model for Evaluating Coordination of Population-Land-Industry Urbanization

In order to objectively and scientifically determine the coordination of population, land, and industrial urbanization, the concept of capacitive coupling and capacitive coupling coefficient model in physics were used for measurement [34].
C i = [ P U i × L U i × I U i ( P U i + L U i + I U i 3 ) 3 ] 1 3
where Ci is the coupling degree of population, land, and industrial urbanization in the ith county. The coupling degree Ci ranges between 0 and 1, and the larger the value, the better the coordination of the three dimensions. The coupling degree reaches a maximum value of 1 only when PUi = LUi = IUi. This approach is based on existing results [35,36] and the actual situation of the study region. According to the calculation results of coupling degree, the relationship among the three dimensions of urbanization can be classified into four stages: Low-coupling stage (Ci ≤ 0.3), antagonistic stage (0.3 < Ci ≤ 0.6), run-in stage (0.6 < Ci ≤ 0.8), and high-coupling stage (0.8 < Ci ≤ 1).

3.1.3. Local Spatial Autocorrelation

Spatial autocorrelation is a spatial statistical method that analyzes the degree to which a variable is correlated with itself through space. Here, Getis-Ord G i * was used to identify the spatial agglomeration characteristics (or hotspots and coldspots) of PUi, LUi and IUi.
G i * = j n W i j x j / i = 1 n x i
where xi is the observed value of ith county; Wij is the spatial weight matrix (1 for spatial neighbor and 0 for nonadjacent region). If G i * > 0, then it indicates high-high agglomeration, i.e., a hotspot region; if G i * < 0, then it indicates low-low agglomeration, i.e., a coldspot region; if G i * = 0, then it indicates high-low agglomeration.

3.1.4. Pearson Correlation Analysis

Ci were taken as dependent variables (Y), and PUi, LUi, and IUi were taken as independent variables (X). Then, Pearson correlation coefficient method was used to analyze the statistical relationship between the independent and dependent variables. A two-tailed test was performed at 0.05 and 0.01 significance levels to determine the influence of various factors on Ci.
C ( Y i , X j ) = ± m a x { | C 1 ( Y i , X j ) | , | C 2 ( Y i , X j ) | }
C 2 ( Y i , X j ) = ± m a x { | C 1 ( l n Y i , X j ) | , | C 1 ( Y i , l n X j ) | , | C 1 ( l n Y i , l n X j ) | }
where Yi is the ith dependent variable; Xj is the jth independent variable; C1(Yi,Xj) is the Pearson correlation coefficient between the Yi and Xj; C1(lnYi,Xj) is the Pearson correlation coefficient between lnYi and Xj; C1(Yi,lnXj) is the Pearson correlation coefficient between Yi and lnXj; C1(lnYi,lnXj) is the Pearson correlation coefficient between lnYi and lnXj; C2(Yi,Xj) is the coefficient with the greatest absolute value among C1(lnYi,Xj), C1(Yi,lnXj) and C1(lnYi,lnXj) and its sign is consistent with that of the original coefficient; C(Yi,Xj) is the coefficient with greater absolute value between C1(Yi,Xj) and C2 (Yi, Xj) and its sign is consistent with that of the original coefficient.

3.1.5. Identifying Urbanization Pattern

Population urbanization level, land urbanization level, and industrial urbanization level were selected as three basic indices of urbanization. After PUi, LUi, and IUi were calculated, their values were graded at 10% intervals. Then, the values were ranked and their ranks RPUi, RLUi, and RIUi were obtained. This means that rank data, in addition to absolute value data, were used to examine the relationship among population, land, and industrial urbanization in the same region. The aim is to examine which dimension changes faster and which one tends to lag in the process of regional urban-rural structural change. On this basis, the urbanization pattern can be classified into 13 categories, corresponding to different relationships among the three dimensions of urbanization (Table 1).

3.2. Data Sources

This paper selected the 87 counties of Gansu Province as the research object and took 1998–2016 as the research period. Basic data including total population, rural population, urban population, urban construction land area, rural construction land area, industrial and mining land area, regional GDP, primary-sector GDP, etc. Those data were from the Gansu Province Development Yearbook (1998–2016).

4. Results

4.1. Temporal-Spatial Patterns of PUi, LUi, and IUi

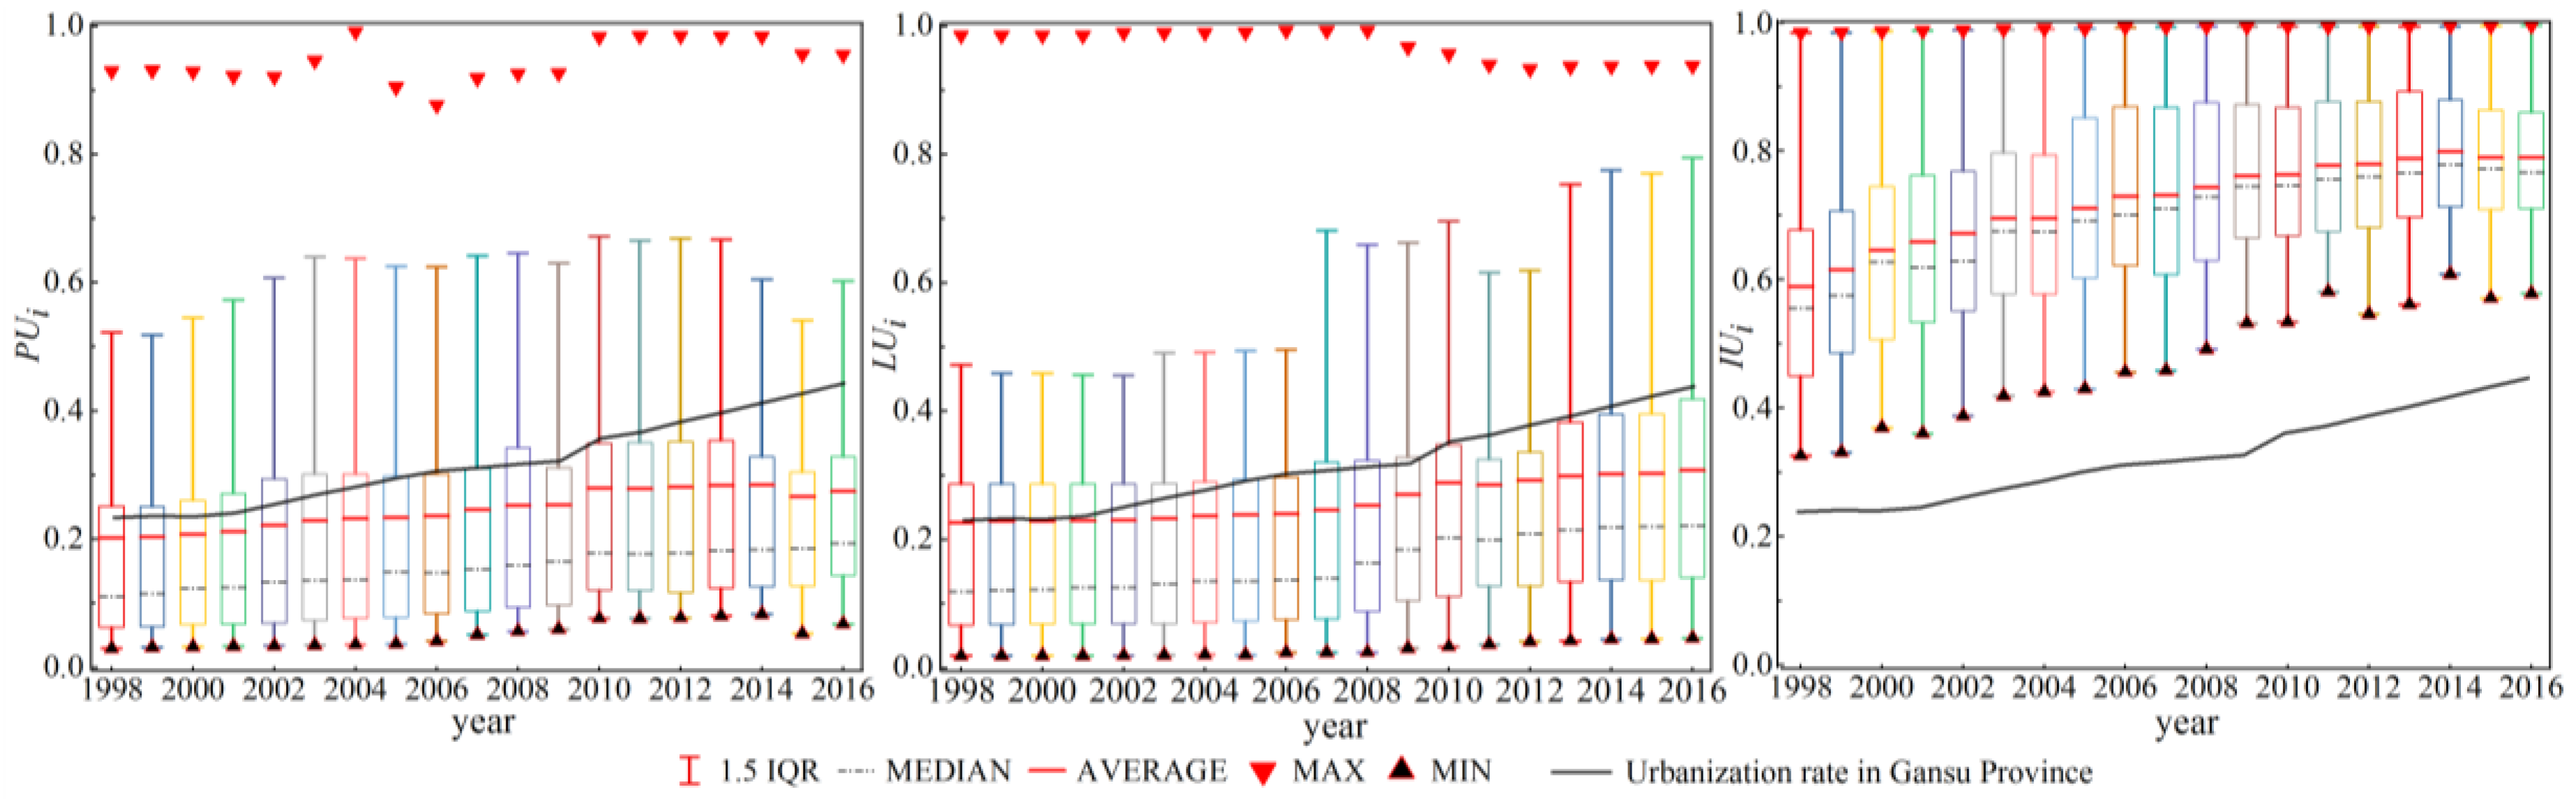
4.1.1. Temporal Pattern of PUi, LUi, and IUi

From 1998 to 2016, population and land urbanization proceeded slowly in the Gansu Province and showed similar trends (Figure 3). In comparison, industrial urbanization was at a high level and proceeded faster than population and land urbanization (Figure 3). The PUi and LUi results were relatively consistent with the actual urbanization status (black curve, Figure 3) of the Gansu Province from 1998 to 2016, while IUi results tended to deviate from the actual urbanization status of the Gansu Province. The fitting degrees between PUi and the actual urbanization rate and between LUi and the actual urbanization rate were high, with fitting coefficients reaching 0.47 and 0.81, respectively. This shows that the urbanization process in the Gansu Province is more affected by changes of population and land structures.
From 1998 to 2016, PUi and LUi were generally lower than IUi of 87 evaluation units in the Gansu Province. The outliers of PUi and LUi were concentrated on the larger value side, the median differed greatly from the average, and the median was located in the lower end of the interquartile range (Figure 3). Therefore, both indices presented skewed distribution. The distribution of PUi changed from dispersion to concentration with time, and the difference between the average and the median was gradually decreased. In 1998, 28.74% of the counties had a PUi greater than the average. In 2016, this proportion increased to 35.63%. The change process of LUi can be divided into two stages: 1998–2006 and 2007–2016. There was no obvious change in LUi distribution in the previous stage, while in 2007–2016 the interquartile range and the full range of LUi distribution shrank gradually. In 2016, the maximum value of LUi reached 0.938 and decreased by 0.047 and 0.055 than those in 1998 and 2007, respectively. In 2016, the average of LUi increased by 36.28% and 25.2% compared with those in 1998 and 2007, respectively. IUi values were concentrated within the range about 1.5 times of interquartile range and basically presented symmetrical distribution. In 1998–2016, the difference between the average and median of IUi remained smaller than 0.043 and was only 0.0145 in 2008. IUi showed a rising trend with time and since 2003 it remained greater than 0.4. In 2016, 43.53% of counties had an IUi value greater than the average (0.793).

4.1.2. Spatial Pattern of PUi, LUi, and IUi

Natural breaks method was used to classify PUi, LUi, and IUi into five grades and then their spatial patterns in 1998, 2008, and 2016 were obtained (2008 is a key year for transformation of China’s urban-rural relationship from urban-rural integration to urban-rural economic and social integration). All three indices showed significant spatial variation and generally decreased from southwest to northeast (Figure 4).
The spatial pattern of PUi changed significantly from 1998 to 2008 and remained almost stable after 2008. In 1998, the number of evaluation units with V-level PUi was small and such evaluation units only included Jiayuguan city, Lanzhou city, and several municipal districts. The PUi of the regions to the west of central Hexi Corridor were relatively high, mainly of III- or IV-level. The PUi of the regions to the east of Zhangye City (except Lanzhou city and Baiyin city) were generally low, mainly of I-level, and the evaluation units with I-level PUi accounted for 60.92% of all evaluation units. From 1998 to 2008, the PUi of most evaluation units in the Gansu Province increased significantly. The PUi of central Hexi Corridor increased steadily, whereas the PUi of the regions to the east of Lanzhou city were still mainly of I- and II-levels. Evaluation units with IV- or V-level PUi were sparsely distributed in municipal district regions. From 2008 to 2016, the PUi of the eastern part of Hexi Corridor increased, while the changes in PUi of other regions were insignificant.
The spatial pattern of LUi was similar to that of PUi. In 1998, LUi decreased from west to east. The evaluation units with III-level or higher LUi were mainly distributed in the central and western parts of Hexi Corridor, Lanzhou city, and Gannan region, accounting for 29.88% of all evaluation units. From 1998 to 2008, the LUi of the central and western parts of Hexi Corridor changed little, still mainly of level-III or higher level. The LUi of the regions to the east of central Hexi Corridor changed significantly: The number of evaluation units with level-III or higher LUi increased, while that of evaluation units with I-level LUi decreased. These evaluations units were mainly distributed in Longzhong, Longdong, and Longdongnan regions to the east of Lanzhou city. From 2008 to 2016, LUi changed little, and the LUi of evaluation units around the evaluation units already with III-level or higher LUi increased to reach level III or higher levels. The number of evaluation units with I-level LUi decreased a little, and such evaluation units were mainly distributed in Longzhong, Longdong, and Longdongnan regions, accounting for 89.29% of all evaluation units in these three regions.
The spatial pattern of IUi changed dramatically. In 1998, the IUi was low in general. The number of evaluation units with I-level IUi reached 62, accounting for 71.26% of all evaluation units. The number of evaluation units with level-III or higher IUi reached 19, and these evaluation units were sparsely distributed in municipal district regions. From 1998 to 2008, IUi increased significantly. It presented a spatial pattern of high value in the west and low value in the east. The number of evaluation units with I-level IUi decreased to 32, and the number of evaluation units with III-level or higher IUi increased to 45, accounting for 51.72% of all evaluation units. In Hexi Corridor region, more than 75% of evaluation units had a III-level IUi. In the regions to the east of Lanzhou city, 42.53% of evaluation units had a I- or II-level IUi. From 2008 to 2016, IUi increased again. There were only nine evaluation units with I-level IUi, sparsely distributed in Longzhong and Gannan regions. The number of evaluation units with III-level or higher IUi reached 61, accounting for 70.11% of all evaluation units.
A hotspot analysis tool was used for local spatial autocorrelation analysis to obtain the hotspots and coldspots of PUi, LUi, and IUi (Figure 5). The spatial patterns of hotspots and coldspots of each index were consistent in all three years, all presenting certain spatial agglomeration. The hotspots of PUi were distributed in the municipal districts of Jiuquan city and Jiayuguan city and the regions surrounding Lanzhou city urban area. The coldspots of PUi were distributed in Longzhong and Longdongnan regions. With the extension of time, the spatial range of hotspots and coldspots of PUi increased first and then increased. The hotspot and coldspot regions of LUi expanded compared with those of PUi. The hotspots of LUi included the municipal districts of Jiuquan city and Jiayuguan city as well as the regions surrounding Lanzhou city urban area. The coldspots of LUi included Longzhong, Longdongnan, and Longdong regions. These results suggest that population and land urbanization were spatially consistent in the Gansu Province, and the urbanization of lands in some evaluation units was even faster than that of population. With the extension of time, the hotspot and coldspot regions of IUi expanded. Notably, the coldspots of IUi expanded toward the northwest of the Gansu Province.

4.2. The coupling Relationship among PUi, LUi, and IUi

4.2.1. Temporal Pattern of Coupling Relationship among PUi, LUi, and IUi

From 1998 to 2016, the coupling degree (C) of population, land, and industrial urbanization in Gansu Province remained higher than 0.3 (Figure 6). The minimum and average values of C increased from 0.389 and 0.741 to 0.515 and 0.809, respectively. The difference between the average and the median remained smaller than 0.012 and in 2013 the two were equal. The median gradually reached the middle of the box with the extension of time. C values were mainly in the range about 0.15 time of the interquartile range, and the distribution tended to be concentrated. In 2016, the C of 95.4% of evaluation units exceeded 0.6. Therefore, the population, land, and industry systems in Gansu Province were in run-in stage or high coupling stage.

4.2.2. Spatial Pattern of Coupling Relationship among PUi, LUi, and IUi

The coupling relationship among the population, land, and industrial urbanization in Gansu Province showed significant spatial variation. The coupling degree (C) of them decreased from northwest to southeast (Figure 7a–c).
In 1998, the population, land, and industrial urbanization in 68 (78.16%) evaluation units were in high coupling stage or run-in stage. Specifically, the three processes were mainly in high coupling stage in the Hexi Corridor and Gannan region, and in run-in stage in the Longdongnan region. The coupling of the three processes in Longzhong and Longdong regions showed significant center-periphery pattern: Three processes in run-in stage in central regions and in antagonistic stage in peripheral regions. From 1998 to 2008, the spatial pattern of the coupling degree of the three processes changed little. From 2008 to 2016, the coupling degree of the three processes increased. The number of evaluation units with three processes in antagonistic stage decreased from 16 in 2008 to four in 2016 and these evaluation units were mainly in Longzhong and Longdong regions. The number of evaluation units with three processes in high coupling stage reached 47. More than 90% of evaluation units in the regions to the west of Lanzhou city had three processes in high coupling stage, while the regions to the east of Lanzhou city had three processes in run-in stage. Hexi Corridor is characterized by good economic development. Its industrial agglomeration, transformation and upgrading have effectively accelerated regional urbanization. The demand for lands for industrial development, infrastructure construction, and human settlement expansion continue to increase, resulting in large-scale conversion of cultivated lands to construction uses. The urbanization of lands is extremely rapid, leading to the transfer of farmers who lose their lands to nonagricultural sectors for employment. In comparison, the Longzhong, Longdong, Longdongnan, and Gannan regions are all characterized by a relatively simple industrial structure and a relatively high proportion of primary industry. Their industrialization is in an initial stage. Compared with industrial and employment transformation, the conversion of cultivated lands to construction uses is of small scale and slow. Therefore, the coupling degree of population, land, and industrial urbanization is relatively low.

4.3. Mutual Feedback among PUi, LUi, IUi, and C

Population, land and industry all play a role in urbanization. The mutual feedback between the indices of urbanization can reflect the degree of synergy among different processes in urbanization. The correlation between PUi, LUi, IUi, and C was analyzed by the Pearson correlation analysis (in SPSS, the variance inflation factor (VIF) of PUi, LUi, and IUi was far less than 10, which means that there is no collinearity among them).
Figure 8 presents Pearson correlation analysis results of PUi, LUi, IUi and C. It reveals that the Adjust R2 value for fitting PUi and LUi was greater than 0.75, thus, there was a significant positive correlation between them and the correlation coefficient reached 0.86. No stable mutual feedback was found between IUi and PUi as well as between IUi and LUi. Generally, the increase of IUi means the optimization and upgrading of industrial structure, that is, the transformation from agricultural industry to nonagricultural industry. This can then lead to the rapid development of rural secondary industry and commercial service industry and promote the diversification of employment choices of farmers. Ultimately, the proportion of urban population in the total population is increasing. However, for the Gansu Province, the increase of IUi did not lead to the increase of PUi [37], which is possibly due to the low education level and low professional skills of farmers. The weak mutual feedback between LUi and IUi is mainly caused by the overexploitation and illegal occupation of lands [38].
C was significantly and positively correlated with PUi, LUi, and IUi and the correlation coefficients were 0.949, 0.947, and 0.786, respectively. C indicates the state of coupling among population, land, and industrial urbanization. The results suggest that the increases in PUi, LUi, and IUi lead to the improvement of coupling degree. The rapid urbanization of each dimension (population, land or industry) may lead to a higher comprehensive urbanization level, which often means a higher level of economic development.

4.4. Spatiotemporal Variation of Urbanization Pattern

4.4.1. Temporal Variation of Urbanization Pattern

The PUi, LUi, and IUi results were graded and compared, and seven urbanization patterns based on different relationships among PUi, LUi, and IUi were obtained (Table 2). From 1998 to 2016, the urbanization patterns in the Gansu Province remained stable, with IX, X, and XI as primary patterns and the other four patterns as secondary patterns (evaluation units with these four urbanization patterns accounted for less than 10% of all evaluation units). In 1998, 2008, and 2016, XI remained the dominant pattern, and evaluation units with XI urbanization pattern accounted for 55.17%, 36.78%, and 44.82% of all evaluation units in these three years, respectively. Note that the three primary urbanization patterns suggest high IUi and close PUi and LUi. This reflects that the industrial urbanization of industry proceeded fast in the Gansu Province. The population and land urbanization proceeded coordinately and slowly, which were the major driving forces of urbanization in the Gansu Province. The relationship between population urbanization and land urbanization changed with time. In 2008, the urbanization of population was faster than that of lands. In 2016, the latter was faster than the former.
Transition matrices for the transformation of urbanization patterns in 1998–2008 and 2008–2016 were constructed (Table 3). As can be seen, the urbanization pattern of the same evaluation unit changed with time. This variation is mainly reflected in the relationship between population and land urbanization. From 1998 to 2008, the number of evaluation units with changes in urbanization pattern reached 35, accounting for 40.23% of all evaluation units. Among them, the number of evaluation units with urbanization pattern changing from XI to IX was the largest, reaching 16, accounting for 33.33% of all evaluation units with XI urbanization mode. However, the number of evaluation units with urbanization pattern changing from IX to XI was the least. This means that the urbanization of population was faster than that of lands in the evaluation units with changing urbanization patterns. In addition, X was found to change to XI, and XI was also found to change to X. The number of such evaluation units was considerable. Six evaluation units had urbanization pattern changing from XI to X and five evaluation units had urbanization pattern changing from X to XI. From 2008 to 2016, urbanization patterns changed dramatically. There were 55 evaluation units with changes in urbanization patterns, accounting for 63.22% of all evaluation units. The number of evaluation units with urbanization pattern changing from IX to XI and from X to XI reached 18 and nine. These account for 58.06% and 42.86% of all evaluation units with IX and X urbanization patterns, respectively. The number of evaluation units with urbanization pattern changing from XI to IX and to X reached eight and 12, together accounting for 62.5% of evaluation units with XI urbanization pattern. This implies that population and land urbanization proceed at different speeds, resulting in urbanization pattern transformation. The Ganzhou District of Zhangye City and Jinta County of Jiuquan City in 1998 were the typical area for the XI pattern. In 2008, the area changed to IX pattern, and returned to the XI pattern in 2016. In 1998, Qingshui County and Wushan County of Tianshui City were the typical area for the XI pattern. In 2008, the area changed to the X pattern, and returned to the XI pattern in 2016.

4.4.2. Spatial Variation of Urbanization Pattern

There was crisscross distribution of different urbanization patterns in the Gansu Province, making it difficult to observe the agglomeration center of certain pattern. Also, evaluation units with the same urbanization pattern were spatially close to each other (Figure 9). In 1998, the XI urbanization pattern was dominant in the province, presenting certain agglomeration in the west part of the Hexi Corridor, Longzhong, Longdongnan, and Longdong regions. Under this pattern, population and land urbanization levels were close to each other, but both lower than industrial urbanization level. IX and X patterns were also important urbanization patterns in the province. The patterns mainly distributed in the central part of the province and Gannan region. Under these two patterns, regional development is mainly limited by population and land urbanization. In 2008, the spatial pattern of urbanization pattern changed significantly. The Hexi Corridor was dominated by IX and XI patterns. The Longzhong and Gannan regions were dominated by IX pattern and population urbanization proceeded relatively fast. The Longdong and Longdongnan regions were characterized by crisscross distribution of X, IX, and XI patterns. In 2016, with Lanzhou city as a boundary, both the east and the west parts presented significant center-periphery pattern of urbanization pattern. The Hexi Corridor (Jiuquan city and Zhangye city) and Longzhong region (Dingxi city and Linxia prefecture) were the two centers. The urbanization pattern of these regions, mainly based on XI pattern, indicated close population and land urbanization levels. Peripheral regions were characterized by crisscross distribution of X, IX, and XI patterns.

5. Discussion

This paper studied the degree of coupling and mutual feedback among population urbanization, land urbanization, and industrial urbanization. Three processes are related with each other. Nonagricultural population is the key link of urbanization. Nonagricultural industries employ a large number of agricultural labor force, fundamentally promoting the process of population urbanization. Some studies take urbanization as the connotation and direct extension of industrialization. These studies hold that the differences among regional urbanization models are often significant. The reason is the differences in regional path models of industrialization [39]. In addition, labor force is a necessary input factor for industrial development. The flow of labor force among different departments or regions is an important way to promote knowledge spillover, information diffusion, and industrial growth [40,41]. Population urbanization is also an inevitable path of industrial structure adjustment. Other influencing factors brought by population agglomeration can significantly promote the development of nonagricultural industry. As land is an induced demand, land urbanization is often regarded as a direct result of population urbanization and industrial nonagricultural transformation [42]. Due to the differences in the spatial form of industrial lands and labor productivity, the changes in population, land, and industry from a perspective of urban-rural structure during urbanization are different. Thus, the relationship among the three systems will change with the progression of urbanization [43].
The interaction among population, land, and industry is supported by empirical research on multiple scales, involving case regions at different levels [44]. In China, the mismatch among population urbanization, land urbanization, and industrial urbanization has currently become a prominent problem [24]. During urbanization, the three dimensions are independent and at the same time related to each other, on which basis a relationship model can be established among them [45]. This paper used qualitative and quantitative methods in combination to reveal the coupling degree of population, land, and industrial urbanization in Gansu Province, further recognized the mutual feedback-relationship between different elements and between elements and C, and laid a foundation for guiding the coordinated development of urban and rural areas in the future. In addition, the analysis of the transformation process of urbanization pattern in different stages provides a basis for the in-depth study of urbanization process-pattern-mechanism in Gansu Province [31,46]. Above all, the urbanization pattern proposed in this paper provides a simple way to understand the characteristics of urbanization process. Urbanization pattern was used as a relative standard and development background, under which a certain spatial unit can be evaluated. Then, the dominant and secondary urbanization patterns were identified. Theoretically, urbanization should be based on good industrial development, and the output value structure and the employment structure should adapt to each other. This will form a reasonable urban-rural spatial structure [47]. It means the coordination among population, industry, and land should be ensured in the various stages of urbanization, including the orderly flow of all elements, rational allocation of resources, constant optimization of industrial structure. Thus, there should be a stable population-land-industry relationship during urbanization [48]. However, in rapid regional development, the flow of factors and the change of regional structure are rapid, which can easily lead to some problems, such as conflict among population, economy and land use, mismatch between dimensions, and a sudden change in population-land-industry relationship. Therefore, special attention should be paid to the causes of these problems [49]. The research on the 87 evaluation units of the Gansu Province from 1998 to 2016 also verified the effectiveness of our method. For regions with a relatively high level of urbanization, particular attention should be paid to the coordination among population, land, and industry in future development. For regions with a medium level urbanization, attention should be paid to the relationship among the development of regional factors. For regions with low level of urbanization, it is necessary to first improve regional urbanization level and then pay attention to the coordination among population, land, and industry. In this way, the urbanization in the Gansu Province can work toward a healthier direction.
There has been increasing demand for research on coordination in urbanization. Urbanization itself is a very complex and systematic concept involving social, economic, ecological, spatial, population, and land aspects [50,51]. This paper only studied urbanization from population, land, and industry aspects, and it is necessary to include more aspects into our research. The following problems still need further research: In particular, it is necessary to carry out research in regions with relatively stable urbanization development process to verify the applicability of this method, and then analyze the relationship between urbanization speed and factor coupling stage. Moreover, this paper tends to regard urbanization as a unique path of rapid development from a neutral point of view. This may not be necessarily applied to all urbanization processes, but it is a unique feature of China, which is determined by China’s specific development stage, institutional system, and land finance mode. However, it is necessary to spend more in health urbanization due to the development of healthy people, healthy urban-rural interaction, and healthy resource environment. At the same time, we should pay attention to pay attention to the process of industrial non-agriculturalization [52]. Third, according to the regional environment, this paper analyzes the impact of natural factors such as altitude and slope on the urbanization speed, pattern, and coordination. Finally, the index system and method for evaluating urbanization level should be further improved. Future research will focus on spatial optimization and policy regulation based on population-land-industry coordination.

6. Conclusions

In this paper, we analyzed the degree of coupling and mutual feedback among population urbanization, land urbanization, and industrial urbanization, and identified urbanization patterns and their spatiotemporal variation. The results have certain guiding significance for solving the problems which affect the sustainable and healthy urban development caused by rapid urbanization and economic development. The problems include the disordered flow of population, the imbalance of economic structure, the widening income gap between urban and rural residents, and the overdevelopment of urban and rural land. The following conclusions were drawn.
(1) Population and land urbanization proceed slowly in the Gansu Province and their trends were similar, whereas industrial urbanization proceeded faster than population and land urbanization. The urbanization process in the Gansu Province was mainly affected by population and land use changes. From a spatial perspective, population, land, and industrial urbanization levels decreased from southwest to northeast. From 1998 to 2016, the coupling degree of population, land, and industrial urbanization remained higher than 0.3 and showed a rising trend. It also showed significant spatial variation and decreased from northwest to southeast.
(2) Population, land, and industry all play a role in urbanization. PUi was significantly and positively correlated with LUi. However, there was no significant correlation between IUi and PUi as well as between IUi and LUi. C was significantly and positively correlated with PUi, LUi, and IUi, with correlation coefficients of 0.949, 0.947, and 0.786, respectively. This suggests that the improvement of PUi, LUi, and IUi effectively led to a higher urbanization level.
(3) Thirteen urbanization patterns were classified according to the relationship among population urbanization, land urbanization, and industrial urbanization. Seven urbanization patterns were identified in the Gansu Province. Evaluation units with the same urbanization pattern tended to be spatially close to each other. IX, X, and XI patterns remained the dominant urbanization patterns, whereas the remaining four patterns were secondary. There was crisscross distribution of various urbanization patterns and it was thus not easy to observe the agglomeration center of certain urbanization patterns.
(4) The urbanization pattern of the same evaluation unit changed with time. This change was mainly reflected in the change of relationship between population and land urbanization. Urbanization pattern changed more significantly in 2008–2016 than in 1998–2008. There were 63.22% and 40.23% of evaluation units with changes in urbanization patterns in 2008–2016 and 1998–2008, respectively. The changes were dominant by IX→XI, X→XI, XI→IX and XI→X. More attention should be paid to the transformation of the urbanization pattern. Urbanization in different stages has different leading driving forces. Identifying influencing factors of it will be beneficial to the healthy development of urbanization.

Author Contributions

L.M. and M.C. designed the study and processed the data. X.C. and F.F. gave comments on the manuscript. All authors Contributed to the results, related discussions and manuscript writing.

Funding

This research was funded by the National Natural Science Foundation of China, grant number 41661105.

Acknowledgments

Authors express great thank to the financial support from National Natural Science Foundation of China.

Conflicts of Interest

The authors declare no conflict of interest.

References

  1. Chen, M.X.; Liu, W.D.; Tao, X.L. Evolution and assessment on China′s urbanization 1960–2010: Under-urbanization or over-urbanization? Habitat Int. 2013, 38, 25–33. [Google Scholar] [CrossRef]
  2. Guan, X.L.; Wei, H.K.; Lu, S.S.; Su, H.J. Assessment on the urbanization strategy in China: Achievements, challenges and reflections. Habitat Int. 2018, 71, 97–109. [Google Scholar] [CrossRef]
  3. Zheng, W.; Walsh, P.P. Economic growth, urbanization and energy consumption—A provincial level analysis of China. Energy Econ. 2019, 80, 153–162. [Google Scholar] [CrossRef]
  4. Ye, Y.M. The Road of Chinese Urbanization: Economic Support and Institutional Innovation; The Commercial Press: Beijing, China, 2001; pp. 197–198. [Google Scholar]
  5. Ma, L.B.; Cheng, W.J.; Qi, J.H. Coordinated evaluation and development model of oasis urbanization from the perspective of new urbanization: A case study in Shandan County of Hexi Corridor, China. Sustain. Cities Soc. 2018, 39, 78–92. [Google Scholar] [CrossRef]
  6. Zhang, P.; Qin, G.; Wang, Y. Optimal Maintenance Decision Method for Urban Gas Pipelines Based on as Low as Reasonably Practicable Principle. Sustainability 2019, 11, 153. [Google Scholar] [CrossRef]
  7. Cui, X.G.; Fang, C.L.; Liu, H.M.; Liu, X.F. Assessing sustainability of urbanization by a coordinated development index for an Urbanization-Resources-Environment complex system: A case study of Jing-Jin-Ji region, China. Ecol. Indic. 2019, 96, 383–391. [Google Scholar] [CrossRef]
  8. Friedmann, J. Four theses in the study of China’s urbanization. Int. J. Urban Reg. 2006, 30, 440–451. [Google Scholar] [CrossRef]
  9. Lu, D.D.; Yao, S.M.; Li, G.P.; Liu, H.; Gao, X.L. Comprehensive analysis of the urbanization process based on China’s conditions. Econ. Geogr. 2007, 27, 883–887. [Google Scholar]
  10. Li, Y.H.; Jia, L.R.; Wu, W.H.; Yan, J.Y.; Liu, Y.S. Urbanization for rural sustainability–Rethinking China’s urbanization strategy. J. Clean. Prod. 2018, 178, 580–586. [Google Scholar] [CrossRef]
  11. Ma, W.Q.; Jiang, G.H.; Li, W.Q.; Zhou, T. How do population decline, urban sprawl and industrial transformation impact land use change in rural residential areas? a comparative regional analysis at the peri-urban interface. J. Clean. Prod. 2018, 205, 76–85. [Google Scholar] [CrossRef]
  12. Cai, Y.Y.; Selod, H.; Steinbuks, J. Urbanization and land property rights. Reg. Sci. Urban Econ. 2018, 70, 246–257. [Google Scholar] [CrossRef]
  13. Zhou, T.; Jiang, G.H.; Zhang, R.J.; Zheng, Q.Y.; Ma, W.Q.; Zhao, Q.L.; Li, Y.L. Addressing the rural in situ urbanization (RISU) in the Beijing–Tianjin–Hebei region: Spatio-temporal pattern and driving mechanism. Cities 2018, 75, 59–71. [Google Scholar] [CrossRef]
  14. Henderson, V. The Urbanization Process and Economic Growth: The So-What Question. J. Econ. Growth 2003, 8, 47–71. [Google Scholar] [CrossRef]
  15. Jabareen, Y.R. Sustainable Urban Forms Their Typologies, Models, and Concepts. J. Plan. Educ. Res. 2016, 26, 38–52. [Google Scholar] [CrossRef]
  16. He, C.F.; Chen, T.M.; Mao, X.Y.; Zhou, Y. Economic transition, urbanization and population redistribution in China. Habitat Int. 2016, 51, 39–47. [Google Scholar] [CrossRef]
  17. Brown, D.L.; Kulcsar, C.L.J. Micropolitan areas and the measurement of American urbanization. Popul. Res. Policy Rev. 2004, 23, 399–418. [Google Scholar] [CrossRef]
  18. Das, S.; Majumder, M.; Roy, D.; Mazumdar, A. Determination of Urbanization Impact on Rain Water Quality with the Help of Water Quality Index and Urbanization Index. In Impact of Climate Change on Natural Resource Management; Jana, B., Majumder, M., Eds.; Springer: Dordrecht, The Netherlands, 2010. [Google Scholar] [CrossRef]
  19. Hirotsugu, U.; Andrew, N. Agglomeration Index towards a New Measure of Urban Concentration; WIDER Working Paper Series 029; United Nations University World Institute for Development Economic Research (UNU-WIDER): Tokyo, Japan, 2010. [Google Scholar]
  20. Gu, C.; Li, Y.; Han, S.S. Development and transition of small towns in rural china. Habitat Int. 2015, 50, 110–119. [Google Scholar] [CrossRef]
  21. Xu, Q.R.; Zheng, X.Q.; Zheng, M.R. Do urban planning policies meet sustainable urbanization goals? A scenario-based study in Beijing, China. Sci. Total Environ. 2019, 670, 498–507. [Google Scholar] [CrossRef] [PubMed]
  22. Shang, J.S.; Li, P.F.; Li, L.; Chen, Y. The relationship between population growth and capital allocation in urbanization. Technol. Forecast. Soc. 2018, 135, 249–256. [Google Scholar] [CrossRef]
  23. Cao, G.Z.; Bian, X.; Liu, T. Comprehensive evaluation of the urbanization level in Yangtze River Delta Region: An index frame work based on the population, economic structure and land use. Geogr. Res. 2011, 30, 2139–2149. [Google Scholar]
  24. Yang, R.; Liu, Y.S.; Long, H.L. The study on non-agricultural transformation co-evolution characteristics of “population-land-industry”: Case study of the Bohai Rim in China. Geogr. Res. 2015, 34, 475–486. [Google Scholar]
  25. Shen, L.Y.; Ochoa, J.J.; Shah, M.N.; Zhang, X. The application of urban sustainability indicators–a comparison between various practices. Habitat Int. 2011, 35, 17–29. [Google Scholar] [CrossRef]
  26. Zhao, D.X.; He, B.J.; Johnson, C.; Mou, B. Social problems of green buildings: From the humanistic needs to social acceptance. Renew. Sustain. Energy Rev. 2015, 51, 1594–1609. [Google Scholar] [CrossRef]
  27. Li, T.T.; Long, H.L. Analysis of rural transformation development from the viewpoint of “population-land-industry”: The case of Shandong province. Econ. Geogr. 2015, 35, 149–155. [Google Scholar]
  28. Wang, Y.; Fang, C.L.; Wang, Z.B. The study on comprehensive evaluation and urbanization division at county level in China. Geogr. Res. 2012, 31, 1306–1316. [Google Scholar]
  29. Bugliarello, G. Urban sustainability: Dilemmas, challenges and paradigms. Technol. Soc. 2006, 28, 19–26. [Google Scholar] [CrossRef]
  30. Wang, H.X.; Xu, J.L.; Sheng, L.X. Study on the comprehensive utilization of resources city kitchen waste in China. Energy 2019, 173, 263–277. [Google Scholar] [CrossRef]
  31. Tan, Y.T.; Xu, H.; Zhang, X.L. Sustainable urbanization in China: A comprehensive literature review. Cities 2016, 55, 82–93. [Google Scholar] [CrossRef]
  32. He, B.J.; Zhao, D.X.; Zhu, J.; Darko, A.; Gou, Z.H. Promoting and implementing urban sustainability in China: An integration of sustainable initiatives at different urban scales. Habitat Int. 2018, 82, 83–93. [Google Scholar] [CrossRef]
  33. The Standardization Administration of the People’s Republic of China. Current Land Use Condition Classification, (GB/T21010-2007); China Zhijian Publising House: Beijing, China, 2007.
  34. Sun, P.J.; Ding, S.B.; Xiu, C.L.; Wei, Z. Population-Economy-Space Urbanization of Northeast China. Sci. Geogr. Sin. 2012, 32, 450–457. [Google Scholar]
  35. Li, E.L.; Cui, Z.Z. Coupling Coordination Between China’s Regional Innovation Capability and Economic Development. Sci. Geogr. Sin. 2018, 38. Available online: http://en.cnki.com.cn/Article_en/CJFDTotal-DLKX201809003.htm (accessed on 24 April 2019).
  36. Cao, W.L.; Zhang, X.L.; Pan, Y.Y.; Zhang, C.M. Coordinate development among population, land and economy urbanization in developed area: The case of Jiangsu province. Chin. Popul. Resour. Environ. 2012, 22, 141–146. [Google Scholar]
  37. Yao, L.J. Industry Cluster and the Research on the Development of Urbanization Gansu; Northwest Normal University: Lanzhou, China, 2007. [Google Scholar]
  38. Wang, L.J.; Dong, X.F.; Liu, X.G. Spatio-temporal characteristics of coupling coordination between the quality of population urbanization: The case of 12 central cities in Gansu Province, China. J. Appl. Ecol. 2016, 27, 3335–3343. [Google Scholar]
  39. Han, X.; Wu, P.L.; Dong, W.L. An analysis on interaction mechanism of urbanization and industrial structure evolution in Shandong, China. Procedia Environ. Sci. 2012, 13, 1291–1300. [Google Scholar] [CrossRef] [Green Version]
  40. Topel, R. Labor Markets and Economic Growth. Handb. Labor Econ. 1999, 3, 2943–2984. [Google Scholar]
  41. Henderson, V. Externalities and industrial development. J. Urban Econ. 1997, 42, 449–470. [Google Scholar] [CrossRef]
  42. Liu, Y.S.; Lu, S.S.; Chen, Y.F. Spatio-temporal change of urban-rural equalized development patterns in china and its driving factors. J. Rural Stud. 2013, 32, 320–330. [Google Scholar] [CrossRef]
  43. Yang, Y.Y.; Liu, Y.S.; Li, Y.R.; Li, J.T. Measure of urban-rural transformation in Beijing-Tianjin-Hebei region in the new millennium: Population-land-industry perspective. Land Use Policy 2018, 79, 595–608. [Google Scholar] [CrossRef]
  44. Long, H.L.; Qu, Y. Land use transitions and land management: A mutual feedback perspective. Land Use Policy 2018, 74, 111–120. [Google Scholar] [CrossRef]
  45. Chen, W.; Shen, Y.; Wang, Y.N. Evaluation of economic transformation and upgrading of resource-based cities in Shaanxi province based on an improved TOPSIS method. Sustain. Cities Soc. 2018, 37, 232–240. [Google Scholar] [CrossRef]
  46. Wei, S.Q.; Chen, J.F. Land Use Pattern Change in the Process of Rural Urbanization in Jinjiang City of Fujian Province. Res. Sci. 2004, 26, 111–118. [Google Scholar]
  47. Chen, X.Y. Spatial Structure Reorganization of Hengyang City Based on Interaction Between Urban and Rural Area—Theory and Practice. Sci. Geogr. Sin. 2005, 25, 3288–3293. [Google Scholar]
  48. Chen, X.Y.; Gu, C.L. Adjustment of Industrial and Spatial Structure of Fujian Province on the Basis of Interaction Between Taiwan and Fujian Provinces. Sci. Geogr. Sin. 2003, 23, 414–421. [Google Scholar]
  49. Bian, X.; Chen, H.Y.; Cao, G.Z. Patterns of regional urbanization and its implications: An empirical study of the Yangtze River Delta region. Geogr. Res. 2013, 32, 2281–2291. [Google Scholar]
  50. Jiang, Y.; Wu, D.T.; Yang, H.; Yue, X.Y. Research on regional models of balancing urban and rural development. Urban Stud. 2011, 18, 42–47, 93. [Google Scholar]
  51. Long, H.L.; Heilig, G.K.; Li, X.B.; Zhang, M. Socio-economic development and land-use change: Analysis of rural housing land transition in the transect of the Yangtse river, China. Land Use Policy 2007, 24, 141–153. [Google Scholar] [CrossRef]
  52. Cheng, Y. Trends and Policies of “Floating Population” in the Context of Healthy Urbanization. Econ. Geogr. 2012, 32. Available online: http://en.cnki.com.cn/Article_en/CJFDTotal-JJDL201204005.htm (accessed on 22 April 2019).
Figure 1. Mechanism of population-land-industry urbanization.
Sustainability 11 02434 g001
Figure 2. Location map of the Gansu Province.
Sustainability 11 02434 g002
Figure 3. Trends of PUi, LUi, and IUi of evaluation units of the Gansu Province in 1998–2016.
Sustainability 11 02434 g003
Figure 4. Spatial patterns of PUi, LUi, and IUi in Gansu Province in 1998–2016.
Sustainability 11 02434 g004
Figure 5. Hotspots and coldspots of PUi, LUi, and IUi in the Gansu Province in 1998–2016.
Sustainability 11 02434 g005
Figure 6. Trend of coupling degree C of PUi, LUi, and IUi of Gansu province from 1998 to 2016.
Sustainability 11 02434 g006
Figure 7. Spatial pattern of coupling degree (C) of population, land, and industry systems during urbanization in the Gansu Province in 1998–2016.
Sustainability 11 02434 g007
Figure 8. Pearson correlation analysis of indices of urbanization. Note: At the lower left corner in the figure are scatter plots and the red line in each scatter plot represents the fitted line between each two variables investigated. At the upper right corner in the figure are Adjust R2 values (in black) and Pearson’s r values (in red). At the diagonal of the figure are histograms of PUi, LUi, IUi, and C.
Sustainability 11 02434 g008
Figure 9. Spatial pattern of urbanization patterns in the Gansu Province.
Sustainability 11 02434 g009
Table 1. Urbanization patterns.
Urbanization PatternRelationshipConnotation
IPUi > LUi > IUiPopulation structure changes fastest, followed by land structure and then by industrial structure.
IIPUi > IUi > LUiPopulation structure changes fastest, followed by industrial structure and then by land structure.
IIIPUi > LUi = IUiThe changes in land structure and industrial structures are comparable and slower than the changes in population structure.
IVPUi < LUi = IUiThe changes in land structure and industrial structures are comparable and faster than the changes in population structure.
VLUi > PUi > IUiLand structure changes fastest, followed by population structure and then by industrial structure.
VILUi > IUi > PUiLand structure changes fastest, followed by industrial structure and then by population structure.
VIILUi > PUi = IUiThe changes in population structure and industrial structures are comparable and slower than the changes in land structure.
VIIILUi < PUi = IUiThe changes in population structure and industrial structures are comparable and faster than the changes in land structure.
IXIUi > PUi > LUiIndustrial structure changes fastest, followed by population structure and then by land structure.
XIUi > LUi > PUiIndustrial structure changes fastest, followed by land structure and then by population structure.
XIIUi > PUi = LUiThe changes in population structure and land structures are comparable and slower than then changes in industrial structure.
XIIIUi < PUi = LUiThe changes in population structure and land structures are comparable and faster than the changes in industrial structure.
XIIIPUi = LUi = IUiThe changes of population, land and industrial structures are consistent, indicating good coordination among population, land and industrial urbanization.
Table 2. Urbanization patterns in the Gansu Province.
RelationshipUrbanization Pattern199820082016
PUi < LUi = IUiIV221
LUi > IUi > PUiVI200
LUi < PUi = IUiVIII002
IUi > PUi > LUiIX163118
IUi > LUi > PUiX182126
IUi > PUi = LUiXI483239
PUi = LUi = IUiXIII111
Table 3. Transition matrix for urbanization pattern from 1998 to 2008 and from 2008 to 2016.
YearMode2008
IVVIVIIIIXXXIXIIIIn total
1998IV00-02002
VI10-01002
VIII--------
IX00-1411016
X10-1115018
XI00-16626048
XIII00-00011
In total20-312132187
YearMode2016
IVVIVIIIIXXXIXIIIIn total
2008IV0-200002
VI--------
VIII0-000000
IX0-09418031
X1-01109021
XI0-081212032
XIII0-000011
In total1-2182639187

