Article

Application of Multi-Criteria Decision-Making Model and GM (1,1) Theory for Evaluating Efficiency of FDI on Economic Growth: A Case Study in Developing Countries

Department of Industrial Engineering and Management, National Kaohsiung University of Science and Technology, Kaohsiung 80778, Taiwan
*
Authors to whom correspondence should be addressed.
Sustainability 2019, 11(8), 2389; https://doi.org/10.3390/su11082389
Submission received: 15 February 2019 / Revised: 8 April 2019 / Accepted: 18 April 2019 / Published: 22 April 2019

Abstract

:
Foreign direct investment (FDI) and corporate social responsibility (CSR) spending are one of the major factors in improving sustainable economic development of a country. Therefore, this study focuses on the multi criteria application of FDI and sustainability factors (CSR spending) in various developing countries to explore its impact and decision making for sustainable economic growth. The study uses a case study methodology whereby FDI, exchange rate, and CSR expenditure data from 20 countries were used to assess the efficiency in sustainable economic growth. Data were collected from the World Bank for 20 Asian and African developing countries during 2012–2017 and analyzed using GM (1,1), mean absolute percentage error (MAPE), Malmquist productivity index (MPI)-data envelopment analysis (DEA), and the slacks-based measure of efficiency (SBM) model. Correlation analysis is used to find the relationship for FDI, CSR, exchange rate, gross domestic product (GDP), and GDP per capita (GDPPC). The results of the Malmquist productivity index and the frontier effect clearly highlight that a few countries have witnessed a great improvement in terms of productivity and technological progression. Therefore, the decision makers must adopt the model of those countries with respect to sustainable development of the nation. This study helps developing nations as well as researchers to benchmark efficient countries and follow their strategies to develop a new one for utilizing FDI and CSR spending in sustainable economic development. The study also helps policy makers in multi criterion application of FDI and CSR for decision making in economic development.

1. Introduction

Foreign direct investment (FDI) provides capital, foreign exchange, technology, competition, and increases reach to the foreign market. Therefore, it is considered as a very fruitful factor for the development of the economy [1]. The market measure, framework accessibility, and exchange transparency assume the biggest jobs in pulling in FDI to nations, while characteristic assets accessibility and institutional quality assume inconsequential jobs [2]. Gross domestic product per capita, farming quality included as a level of gross domestic product (GDP), and swelling impact FDI inflows adversely in created nations, while GDP per capita, exchange transparency, horticulture esteem included as a level of GDP, and framework have positive and factually critical effects on FDI inflows in creating nations. Exchange receptiveness as a level of GDP and foundation emphatically influence FDI in created nations. Institutional quality is a progressively vital determinant of FDI in created nations more than in creating nations [3]. In the recent years, it is also been seen that there is increasing competition between developing countries to attract a substantial amount of FDI by offering incentives to the foreign investors and liberalizing trade policies [1]. Developing countries face inadequate savings and liquidity constraints, which result in the important role of FDI inflow to gain more capital in order to achieve sustainable development. However, foreign corporations and investments provide technological benefits and additional direct capital inflow, which indicates that FDI plays a crucial part in modernizing host economies and promoting sustainable growth [4]. Hence, FDI is expected to affect sustainable economic growth through directly increasing the stock of capital, encourage integration of new technologies, and knowledge transformation. FDI also enhances the existing knowledge level in the host country by introducing alternative management strategies and organization practices, which directly impact the labor productivity. Labor productivity improves performance and economics of the organization, which indirectly impacts the economy of the country [5]. However, the most obvious impact of FDI inflows is GDP growth. The transfer of advanced technology from developed countries to developing nations creates spillovers, which is an important aspect in the GDP growth of the country. It is also important that FDI have a positive and direct effect on the rate of GDP growth per capita [4,5]. FDI brings in development of the financial system, trade openness, and institutions for technological adoptions, which helps in development of GDP per capita growth rate. However, apart from FDI, CSR (corporate social responsibility) is also responsible for sustainable economic growth of a country [6].
CSR, or corporate social responsibility, implies the activities of an enterprise or organizations whereby the primary objective is aligned between financial developments and societal and environmental concerns. In a contemporary financial situation, the idea of CSR has turned out to be broadly coordinated with business ethic in all parts of the world. Organizations’ voluntary CSR activities comprises of economic, environmental, and social responsibility [7]. The need for CSR is progressively more critical in developing nations where monetary incongruities are increasingly articulated and both the environment and societies are significantly and progressively powerless against human-instigated ecological dangers [6]. CSR and business ethics center principally on the strengthening of networks and social aspects, improvement of finances, development of the environment, improvement of society and cultures, and upliftment of the employees of the organization [8]. The essential elements needed to achieve high rates of sustainable economic growth include accountable governments, open and effective markets, infrastructure, capable human capital, equality of opportunity, sound environmental management, growing businesses, environmental activities, and investing in people [8]. Sustainable long-term economic growth increases revenue generation, creation of employment, environmental development, and leads to poverty reduction in developing countries [6]. CSR spending therefore plays a major role in covering these aspects for sustainable economic development.
The main aim of the study is to explore and benchmark the most efficient developing countries utilizing its FDI and CSR spending for sustainable economic development in terms of GDP and GDP per capita. The efficiency of the usage of FDI and CSR spending implicates the effective and efficient sustainable growth of the country. In order to address the research aim, it is important to address the research questions of the study. The first is what is the role of CSR spending and FDI in impacting GDP and GDP per capita (GDPPC)? The second research question is which of the chosen developing countries indicate efficient use of CSR spending and FDI? Lastly, the study needs to answer the question of how does the efficient use of multi criteria FDI and CSR spending help in sustainable economic development of the country? In this regard, the main goals and objectives of the study include identifying and benchmarking the most efficient developing country that has been using FDI and CSR spending for sustainable economic growth. Another goal of the study is to use multi criteria aspects of economic development FDI and CSR spending and monitor the efficiency of decision making for sustainable development. One last goal of the study is to indicate the use of FDI and CSR spending based on the multiple-criteria decision-making (MCDM) model with respect to policy making and sustainable development of the nation.
Efficiency is the measure of performance of either a country or a company. In other words, it is the level of performance in maximizing either its inputs or its output value. Usually, the efficiency is based on increased performance of the output either by efficiently reducing or increasing its inputs. Since the main aim of the study is to assess the efficiency of FDI and CSR spending on economic development of the developing countries, efficiency of FDI and CSR spending indicates the efficient increase or decrease of FDI and CSR spending on increased sustainable economic development shown by rise in GDP of the country.
However, the impact of FDI on GDP may not be focused on the total, but rather the sectored distribution. The sectored distribution of GDP includes agriculture, manufacturing, industry, and services. FDI is based on these factors, such that a foreign company in the field of electronics will either invest to improve the industrial GDP or the manufacturing GDP [9]. An FDI investment in the field of agriculture will impact the overall GDP as well as the sectored GDP.
The study uses a unique method of multi criteria for the sustainable development of a developing nation. The multi criterion focuses on equivalent importance of FDI and CSR spending. These are the most important aspects in sustainable development of a nation. However, previous literature lacks the usage of multi criteria financial and sustainable aspects in decision making for sustainable economic growth. The study also uses this MCDM model in order to help policy makers identify the importance and effective strategies for sustainable economic development. Use of MCDM in data envelopment analysis is very rare but helps in identifying and benchmarking the most efficient DMUs, so that their models of efficiency can be adopted by other decision-making units (DMUs). Moreover, this study is the first to use MCDM, data envelopment analysis (DEA) analysis, and GM (1,1) whereby efficiency of multiple criteria of FDI, exchange rate, and CSR spending were shown for decision making in sustainable economic development from cases of 20 developing nations.
In this study, literature will review the concepts of MCDM, FDI, and CSR spending in economic development, and the use of DEA in similar studies. The methodology section will show the complete flow of processes used for analyzing and conducting the study. This will also present the formula and data used for the research. The analyzed data were interpreted and presented graphically, and lastly, the research questions and the research limitations have been presented.

2. Literature Review

MCDM, or multiple-criteria decision-making, is concerned with structuring and solving decision and planning problems involving multiple criteria. MCDM uses different models and theories for analyzing a decision model. MCDM is a sub-discipline of operations research and management science that explicitly considers multiple criteria in a decision-making environment [9]. It is mainly used to support decision-makers facing decision and planning problems where a unique optimal solution does not exist, and decision-makers’ preferences are involved. MCDM uses a series of steps for the decision-making process that includes identifying the goal of the decision-making process, selection of the parameters and factors, and weighing methods to represent importance, inference, and decision making based on the results. Therefore, it is important in this study to use an MCDM whereby the strategies of efficient and benchmarked components can be adopted for two criteria, FDI usage and CSR spending, and decide on a plan for sustainable growth. However, according to Nakayama, Arakawa, and Yun, if decision makers can make their decisions by seeing efficiencies of components and factors, the idea of DEA (data envelopment analysis) can be applied to MCDM problems [10,11]. Since MCDM can be used with the help of DEA analysis, the current study can use multiple criteria of finances and sustainability for decision making in strategies for sustainable economic development. Therefore, the decision makers can efficiently use and adopt the multiple criteria and strategize for economic growth.
According to Lee and others, foreign investment can be driven by corporate social responsibility (CSR) [12]. FDI brings in added industrial value and productivity spillovers; technology transfer and R&D activities; and investment in human resources. FDI benefits economic growth and competitiveness through embodied technology, managerial skills, and higher productivity growth. Some works concur that the FDI commitment to development is certain yet relies upon certain variables in the host nation. Alfaro reasoned that the commitment of FDI to development relies upon the area of the economy where the FDI works. The study guaranteed that FDI inflow to the assembling segment positively affects development while FDI inflow to the essential segment will in general negatively affect development. For the administration area, the impact of FDI inflow isn’t so clear [13]. According to the 2030 Agenda for Sustainable Development, foreign investments are important for sustainable development of developing nations [14]. Therefore, CSR is a very important aspect in sustainable economic growth of developing nations. FDI is, however, driven by market liberalization that enables organizations to seek globally new outlets for their products and services and to exploit competitive advantages relating to production cost differentials, access to labor, technologies, and natural resources. On the other hand, CSR activities can help increase social welfare and sustainability by contributing to various social issues such as human capital development, environment protection, and social cohesion. Therefore, CSR spending and FDI are interrelated and have significant impact on sustainable economic development.
Deena Saleh analyzed the connection between Foreign Direct Investment and Economic Growth in Developing Countries; the principle center is around Turkey and Egypt because of likenesses between two nations as far as monetary, political and verifiable terms. A diagram of FDI; types, inspirations, and local nation factors is exhibited. Systems drawing in FDI are analyzed: Fiscal and Financial Incentives, Location Strategic and Marketing Strategies. The effect of FDI on host nations is examined. At last, the examination hole talks about variables identified with both the Egyptian and Turkish economy [15]. The researcher used the slacks-based measure (SMB) model with unexpected output and global Malmquist productivity index to solve the green technology progress index in the case of China. Statistical findings found that China’s investment in developed countries can bring reverse green technology spillovers and promote China’s green technology progress. However, it was therefore implied that FDI has positive impact on the outward foreign direct investment (OFDI) flows, thereby helping efficiently in sustainable growth with respect to green technology progress. Another similar study by Sun and colleagues asserted that there is a positive relationship between outward FDI and the competitiveness of Taiwanese industries [16]. The researcher used data of 15 industries in Taiwan to explore the relationship between competitiveness and expansionary and defensive outward FDI. The findings indicated that outward FDI has an impact on innovation of domestic industries and were also responsible for efficiency of the industries. These industries decrease the international market share, by allowing cost improvements channeled through reallocations that resulted in scale changes. Thus, FDI is responsible for improving the performance of industries. It is indicative from the literature that FDI has a positive impact on the economic growth of a nation and, hence, can also be used to find the efficiency of FDI in sustainable economic growth of developing nations.
However, the study by Malik and Imran contradicts the previous findings that FDI causes positive and significant impact on economic growth [17]. Malik analyzed the impact of FDI and trade openness on economic growth of Pakistan during the period of 2008 to 2013. The researcher used the variables FDI, trade openness, and domestic capital to address the negative impact on economic growth. It was interpreted that policy reformulation and government-related factors were responsible for the poor economic growth in Pakistan. Malik’s study was supported by the study of Zahid Awan, who conducted a study to find the impact of FDI on GDP during the period 1971–2008 [18]. The study indicated a negative impact of gross fixed capital formation, degree of trade openness, inflation rate, and current account balance on the economic growth of Pakistan. Similarly, the study by Sakib found that FDI, nation’s debt, trade, and inflation showed a negative impact on GDP for the years 1981 to 2010 [19]. Thus, FDI may either have a positive or negative impact.
The study focuses on Schumpeterian growth theory as the operational zed FDI and CSR notion models and focuses on the sustainable growth process [20]. In addition, the relationship between CSR and FDI towards economic growth and development with the notion of appropriate growth institutions has been focused on. This theory not only focuses on macroeconomic structure of economic growth of a country, but also the microeconomic issues regarding incentives, policies, and organizations. Similarly, this study includes the macroeconomic factors of FDI and exchange rate as well as corporate social responsibility as macroeconomic policy and macroeconomic incentive. It is also evident from the Schumpeterian growth models focusing on firm dynamics, which are CSR responsibilities and economical reallocation of resources.
According to a study by Hoque and colleagues, CSR spending is motivated towards social and economic development of the nations as well as the community [21]. Corporate social responsibility (CSR), its goals, and practices have always shown an impact on business, society, and the economy. However, the use of CSR by corporations is mainly to show the philanthropic nature of the corporations and is not motivated towards economic growth of the company as well as the country. The study also found that the corporations involved in CSR spending have inadvertently helped in the sustainable financial development of the company as well as the nations. Similarly, Hopkins investigated the impact of CSR on sustainable economic growth of the developing nations India, Bangladesh, Sri Lanka, and Kenya [22]. It was found that investments by foreign nations as a part of their CSR strategy has helped these countries in improving their economic conditions. The CSR spending by the corporation of India and Sri Lanka has also helped them in environment, education, health and hygiene, and socio-economic development. Thus, these findings have helped in improving the financial as well as the economic conditions of the country. Lastly, another study by Aaijaz and bin Ibrahim on the CSR in Malaysia found that CSR stands to be of vital importance for a mutual and symbiotic growth [23]. The study found that CSR was very important for adoption of economic and financial strategies both by the private corporations as well as FDIs. The study indicated that CSR spending has led towards globalization of increased FDI, which, in turn, has helped in the sustainable economic development of Malaysia.
On the other hand, This paper intends to explore observationally the effect of FDI on financial development for Azerbaijan, Kyrgyz Republic, Kazakhstan, Tajikistan, Turkmenistan, and Uzbekistan over the period 1997–2010. The Johansen cointegration and Granger causality tests are utilized so as to break down the causal connection among FDI and monetary development. It is essential to see the headings of causality between two factors for the arrangement creators to energize private segments. The cointegration test results demonstrated that FDI and Economic Growth factors are cointegrated for Azerbaijan and Turkmenistan. By utilizing Granger Causality test we found that FDI causes GDP for Azerbaijan and bidirectional causality is watched for Turkmenistan [24]. Another study by Argiro et al, this research endeavors to address the causal-request between internal FDI and monetary development utilizing a board informational index for two distinctive Economic Associations that is EU (European Union) and ASEAN (Association of South Eastern Asian Nations) over the period 1970–2003. The inflows of FDI to created have nations bring up the issue of how these inflows influence their economies and what is the communication among FDI and development [25]. Supporting the findings of FDI impact, Sharmiladevi pointed out that FDI is a critical factor in the globalization procedure as it gives openings and budgetary difficulties around the globe advances steady and enduring monetary connections between nations through direct access to speculators in home economies to generation units of the host economies. Understanding the impact/effect of internal FDI on monetary development is a dynamic region to think about for analysts, as the observational proof on effect of FDI inflow on and financial development are blended, which merits crisp enquiry [26].
Thus, the literature indicates that sustainability variables and financial variables have direct and positive impacts on the sustainable development of developing nations. Thus, the use of FDI, exchange rate, and CSR spending in the current study will help the decision makers for planning efficient sustainable economic development. However, the literature also found certain gaps in knowledge, whereby very few studies have studied and included MCDM and DEA for efficiency measurement and decision making. There is also a lack of studies using FDI and CSR spending to find efficiency measures and their impact on sustainable growth of developing nations. Lastly, no studies combine DEA, Grey forecasting, and MCDM for exploring the efficiency of FDI and CSR spending on sustainable economic growth of developing nations.

3. Materials and Methods

3.1. Research Development Flow

The study applies the GM (1,1) model to forecast the FDI inflows impacting the economic growth of DMUs represented by the set of developing countries. The study also uses Malmquist data envelopment analysis (MPI) and slack-based measure of efficiency (super SBM) to find the efficiency of the decision-making units (DMUs). The process of conducting the study is defined in the Figure 1 as follows:
Step 1: Identification of the objectives
The objectives of the study have been identified on the basis of current FDI inflows and CSR spending of the developing countries and their impact on sustainable economic growth. These multiple criteria will also help decision makers model efficient methods for CSR spending and FDI for sustainable development of the nation.
Step 2: Literature review
Following the investigation and background about the topic, the present study identified previous literature to understand the current knowledge of the study. This chapter also includes a review of MCDM and literature on the use of FDI and CSR spending for sustainable development in the developing nations.
Step 3: Research methodology
An exploratory study was conducted whereby data envelopment analysis and prediction was done to assess the impact and efficiency of FDI and CSR spending on sustainable economic growth of the nations. Prediction model used GM (1,1) to predict the data available for DMUs from 2012 to 2017. This method of prediction is highly reliable and suitable with the data of DMUs. On the other hand, DEA models were used for estimating the efficiency and performance of the DMUs. Malmquist DEA was conducted whereby the slacks of the variables and SBM model helped in ranking of the DMUs. Finally, the multi-criteria factors FDI and CSR spending were used for decision making of sustainable economic growth of the nations.
Step 4: Research planning
Following this, the researcher defines the major process and tasks that are planned to manage the time and work in an efficient manner. The research planning also comprises all the methods and techniques used in conduction of the study.
Step 5: DMUs collection
The information in regard to the economic and CSR spending parameters in the developing countries has been collected from the World Bank database. Data were collected for 20 developing countries.
Step 6: Input and output collection
FDI inflows, exchange rate, and CSR spending are taken as input variables and the output variables include GDP growth and GDP growth per capita for the period 2012 to 2017. The data was collected from the World Bank database.
Step 7: Pearson correlation method
Then, the researcher records the coefficients are recorded in order to check the correlation between inputs and outputs. The correlation will show the degree of relationship between all the variables.
Step 8: Malmquist DEA analysis and super-SBM model
Analysis of the DMUs for efficiency of the FDI and CSR on GDP and GDPPC using Malmquist DEA from 2012 to 2017 for 20 developing nations was done. The sequence of DEA analysis was then arranged according to the super-SBM model.
Step 9: Grey model prediction
We used the data of economic and sustainability parameters of 20 DMUs 2012–2017 and applying grey GM (1,1) model to predict the economic growth in 2018 and 2019. Mean absolute percentage error (MAPE) was applied to verify the accuracy of the model and to calculate the predicted errors.
Step 10: Conclusion
The last step is to analyze results from the findings and then conclude to address the aim of the study. The findings will help in attributing the multi criteria towards decision making for sustainable economic development.

3.2. DMU Collection

After researching and studying the economic growth in developing countries, data for the decision making units (DMUs) denotes the countries i.e., Argentina, Bangladesh, Cambodia, Chad, China, Costa Rica, Ghana, Guatemala, Guyana, Indonesia, Iraq, Kazakhstan, Kenya, Libya, Maldives, Myanmar, Nigeria, Thailand, and Vietnam from the World Bank database [27]. Table 1 show the 20 selected countries. The choice of countries comes from the fact that the majority of developing countries are also the largest markets for developed nations to invest in for the growth and development of the host nation as well as the investing nation. According to the World Bank, developing nations are usually found in Asian, African, and South American continents, and these continents also produce the largest economies and markets. The study collected data from majority of the African and Asian countries and few from the South American countries, as they are the largest market for developed nations. In addition, the data for CSR spending was also found for these countries, but only for the period 2012–2017. Therefore, the study gathered data for FDI and CSR spending from the chosen 20 countries spread over the major continents.
GDP and GDP per capita are used as output variables and FDI, exchange rate, and CSR spending were used as input variables for the analysis of the super SBM model. For the GM (1,1) forecasting model, the data of all these economic parameters were used to predict the economic growth of developing countries.
GDP growth and GDP growth per capita of the 20 developing countries were taken as output variable, whereas FDI, exchange rate, and CSR defined in terms of USD are considered as input variables in the data envelopment analysis (DEA) approach. The inputs/outputs element will directly impact the results of the analysis and evaluation. The values for inputs and outputs have been provided in the Appendix A Figure A1. The description for inputs and outputs have been presented underneath.
  • Input variables:
    • FDI: Foreign direct investments in the developing nations shown in percentage (%); the data were collected from the World Bank database. The FDI considered here are both Greenfield and Brownfield types of investment, and the FDI for no particular sector, but an overall FDI in the chosen countries.
    • Exchange rate: Exchange rate shown in USD; the data were collected from the World Bank database. It is considered as one of the important factors reflecting the level of economic development of each country.
    • CSR spending: Corporate social responsibility spending by the countries in total from their profits as vales in USD, and the data were collected from World Bank.
  • Output variables:
    • Gross domestic product (GDP): The total economic growth of the nation’s output value of production shown as % value; the data were collected from the World Bank database.
    • GDP per capita (GDPPC): The total economic growth of nation’s output value of production on the basis of per person shown as a percentage (%) value; data were collected from World Bank database.

3.3. GM (1,1) Model

The Grey forecasting model is a method of prediction under the common technique based on modeling and controlling partial information. The objective of this technique is to assist the policy makers for making critical decisions and future predictions [28]. It includes analysis, modeling, forecasting, and controlling on the basis of theory even when the partial information is not known [29]. According to the definition of Zhou, “The grey model (GM) is a theory of analysis, modeling, forecasting and controlling for studying grey system that partial information is known, partial information is unknown” (p. 363). The formula for the GM (1,1) forecasting is presented underneath.
  • As an initial step, it is necessary to check the feasibility of the GM (1,1) model. The judgment criteria are whether the original sequence compares to the ratio.
  • Following this, generate a new set of data series X(i)
    X ( i ) = x 1 , x 2 , x 3 , x 4 , x n .
  • Calculate xi using
    x i = j = 1 j = i x j .
  • Then, construct a matrix:
    [ 1 2 ( x 1 + x 2 ) 1 1 2 ( x 2 + x 3 ) 1 1 2 ( x t 1 + x t ) 1 ] .
  • Then, to construct vectors:
    Y = ( x 2 + x 3 + x 4 + + x t )   T .
  • To create GM (1,1) model, use the formula:
    d x / d t + α x = β .
  • To solve the forecasting model, use the formula:
    x t + 1 = ( x 1 β / α ) e α + β / α ,
    x t + 1 = x t + 1 x t ,
    [ α β ] = ( B T   B ) 1   ( B T   Y ) .
After following the above steps, the researcher comes to the calculation in Ms excel. This models some sort of complex calculation including matrix inverse operation, matrix transposition, matrix multiplication, etc., in excel.
Mean absolute percent error (MAPE) was used to verify the accuracy of the forecast. If MAPE has a lower percentage, the forecast value is typically close to the actual value. It offers multiple advantages in terms of scale independency and interpretability. If Ai and Fi denote the actual and forecasts the values of the data point I, respectively, then the value of MAPE can be calculated using the formula:
MAPE = 1 n [ i = 0 n | A i F i A i | * 100 ] .
The interpretation of the value of MAPE defined [30] is that,
  • <10% is excellent forecasting ability;
  • 10%–20% is good Forecasting ability;
  • 20%–50% is reasonable forecasting ability;
  • 50% is poor forecasting.

3.4. DEA Models

For the creation of DEA methodology for economic parameters, DMUs represent the set of 20 developing countries developing countries. DEA will assist the researcher in identifying the developing countries impacted by the FDI inflows. The input variables are indicated in terms of percentage of GDP and the output variable are in terms of GDP growth.

3.4.1. Malmquist Productivity Index (MPI)

The Malmquist productivity index concept was originally developed for analyzing the consumption of inputs by S Malmquist [31]. Later it was used as a productivity index—directly from input and output data by using DEA [32], it was defined as DEA-MI and was also applied in various fields as a tool to measure the productivity change of DMUs over time. According to the definition of Fare, “Malmquist productivity index is a binary comparison of two entities, in empirical applications usually the same unit at different points in time, but we may also compare different units at the same point in time” (p. 80), the formula for which is presented underneath.
Suppose there are ‘n’ DMUs, where each country is consuming ‘m’ different inputs for the production of ‘s’ different outputs. xrj, yrj represent the ith input and rth output, respectively, of the jth DMU at time t [33].
Dto (xto, yto) = Minimize θ,
Subject to
j = 1 n λ j x t ij θ x t   io ,   i = 1 ,   2 ,   ,   m ,
j = 1 n λ j y t rj θ y t   ro ,   r = 1 ,   2 ,   ,   s ,
λj ≥ 0, j = 1, 2, …, n.
If the value of θ = 1, then DMU will be efficient and its input–output combination lies on the efficiency frontier. If the value of θ < 1, then DMU will be inefficient and its input–output combination lies inside the efficiency frontier.
D o t + 1 ( x o t , y o t ) can be obtained and it compares ( x o t , y o t ) to the frontier at time t+1. Therefore, MPI measures the productivity change of a particular DMU0 at time t+1 and t, can be shown by the following equation:
MI = [ D o t   ( x 0 t + 1 , y 0 t + 1 ) D o t   ( x o t , y o t ) D o t + 1   ( x 0 t + 1 , y 0 t + 1 ) D o t   ( x o t , y o t ) ] 1 / 2 ,
where MI0 shows progress in the total factor productivity of the DMU0 from the period t to t+1, while MI0 = 1 and MI < 1 indicates the status quo and decay in productivity, respectively [31].
MPI can be decomposed into efficiency change and technical change. MPI > 1 represents productivity improvement. If MPI = 1, there is no productivity change and if MPI < 1, there is productivity reduction.
MPI = D o t + 1   ( x 0 t + 1 , y 0 t + 1 ) D o t   ( x o t , y o t )   [ D o t   ( x 0 t + 1 , y 0 t + 1 ) D o t + 1   ( x o t + 1 , y o t + 1 ) D o t   ( x 0 t , y 0 t ) D o t + 1   ( x o t , y o t ) ] 1 / 2 , = Efficiency   change × Technological   change

3.4.2. Super SBM (Slack-Based Measure of Efficiency)

The super SBM model is used to measure the overall efficiency of the model of the DMUs. The analyses are generated using the DEA software [34,35]. According to the definition of Morita [36], “The optimal solution reveals the existence, if any, of a surplus in inputs and a shortage in outputs called slacks and slack-based measure helped to evaluate the efficiency based on the slack values of input and output variables” (p. 358).
Input and output matrix is (X, Y), where X = (xij) ϵ Rmxn and Y = (yij) ϵ Rsxn. λ is a nonnegative vector in Rn. The vector S ϵ Rm and S+ ϵ Rs shows an excess input and a short falling output, respectively [37]. The SBM model is given by following equation [38]:
min   ρ 0 = 1 ( 1 / m ) i = 1 m s i / x i 0 1 ( 1 / s ) i = 1 m s i / y i 0 ,
Subject to:
x0 = X λ + S,
y0 = Y λ + S+
(λ ≥ 0, X ≥ 0, Y ≥ 0).
Suppose (ρ*, λ*, s-*, s+*) is the optimal condition of SBM and (x0, y0) is SBM efficient of DMU. When ρ* = 1, s-* = 0 and s+* = 0. Hence, a super-efficiency model was developed for ranking DMUs, and it was shown by the following formula [39].
min   δ = 1 / m   i = 1 m x ¯ i / x i o 1 / s   r = 1 s y ¯ i / y i o ,
Subject to:
x ¯ j = 1 , j 0 n λ j x j ,
y ¯ j = 1 , j 0 n λ j x j ,
x ¯ x o
y ¯ y o ,
y ¯ 0 ,
λ ≥ 0.
The super SBM model gives a value of the objective function which is greater or equal to one. The higher the value, the more efficient the unit [40].

4. Empirical Results

In order to evaluate the efficiency of FDI on the economic growth, the researcher provides the results of the data analysis in this chapter. For this purpose, this chapter presents the descriptive statistics, MAPE and correlation, DEA Malmquist efficiency, super SBM, and GM (1,1) forecasting.

4.1. Descriptive Analysis

Table 2 indicates the mean and median values of the input and output variables. The mean values of the FDI inflows and GDP growth and GDP per capita growth fall over time. On the other hand, the mean and median values of the exchange rate increase over time. This is evident from the fact that the FDI of few countries like Argentina, Kenya, Nigeria, Kzakasthan, and others had decreased FDI between 2012 and 2017. On the other hand, FDI of countries like Vietnam, Iraq, China, Guatemala, and few others have increased rates of FDI. Similarly, the exchange rates of these countries decreased with the increased FDI. On the other hand, the exchange rate increased for the countries with poorer FDI. However, CSR of the countries indicated a steady growth over the years of 2012 to 2017, except for a few that were modulated by the rate of FDI and exchange rate. Countries with lower FDI for a year also indicated decreased CSR spending. Therefore, it may indicate that the growth of FDI and CSR spending are congruent to each other, as increased FDI will improve the economy of the country and this will improve the financial position of the corporations. In this case, the CSR will also rise, and vice versa. This is indicated by the descriptive findings of the data chosen.

4.2. Pearson Correlation

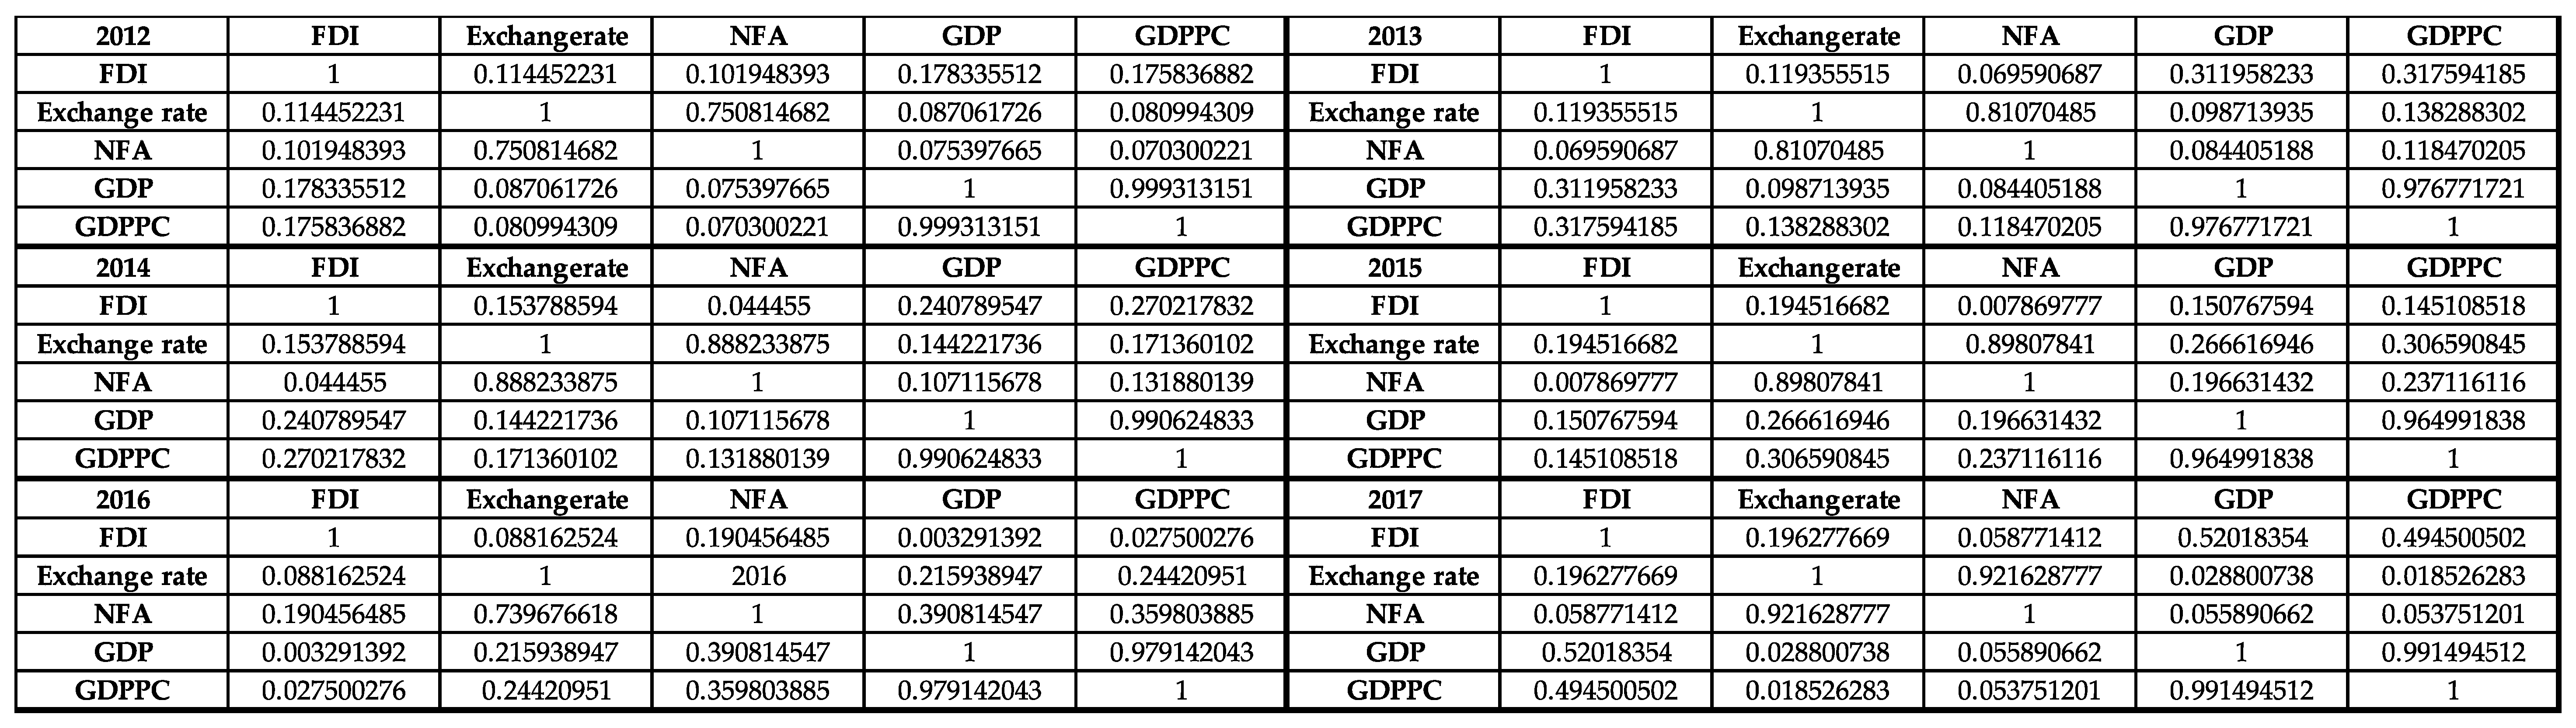
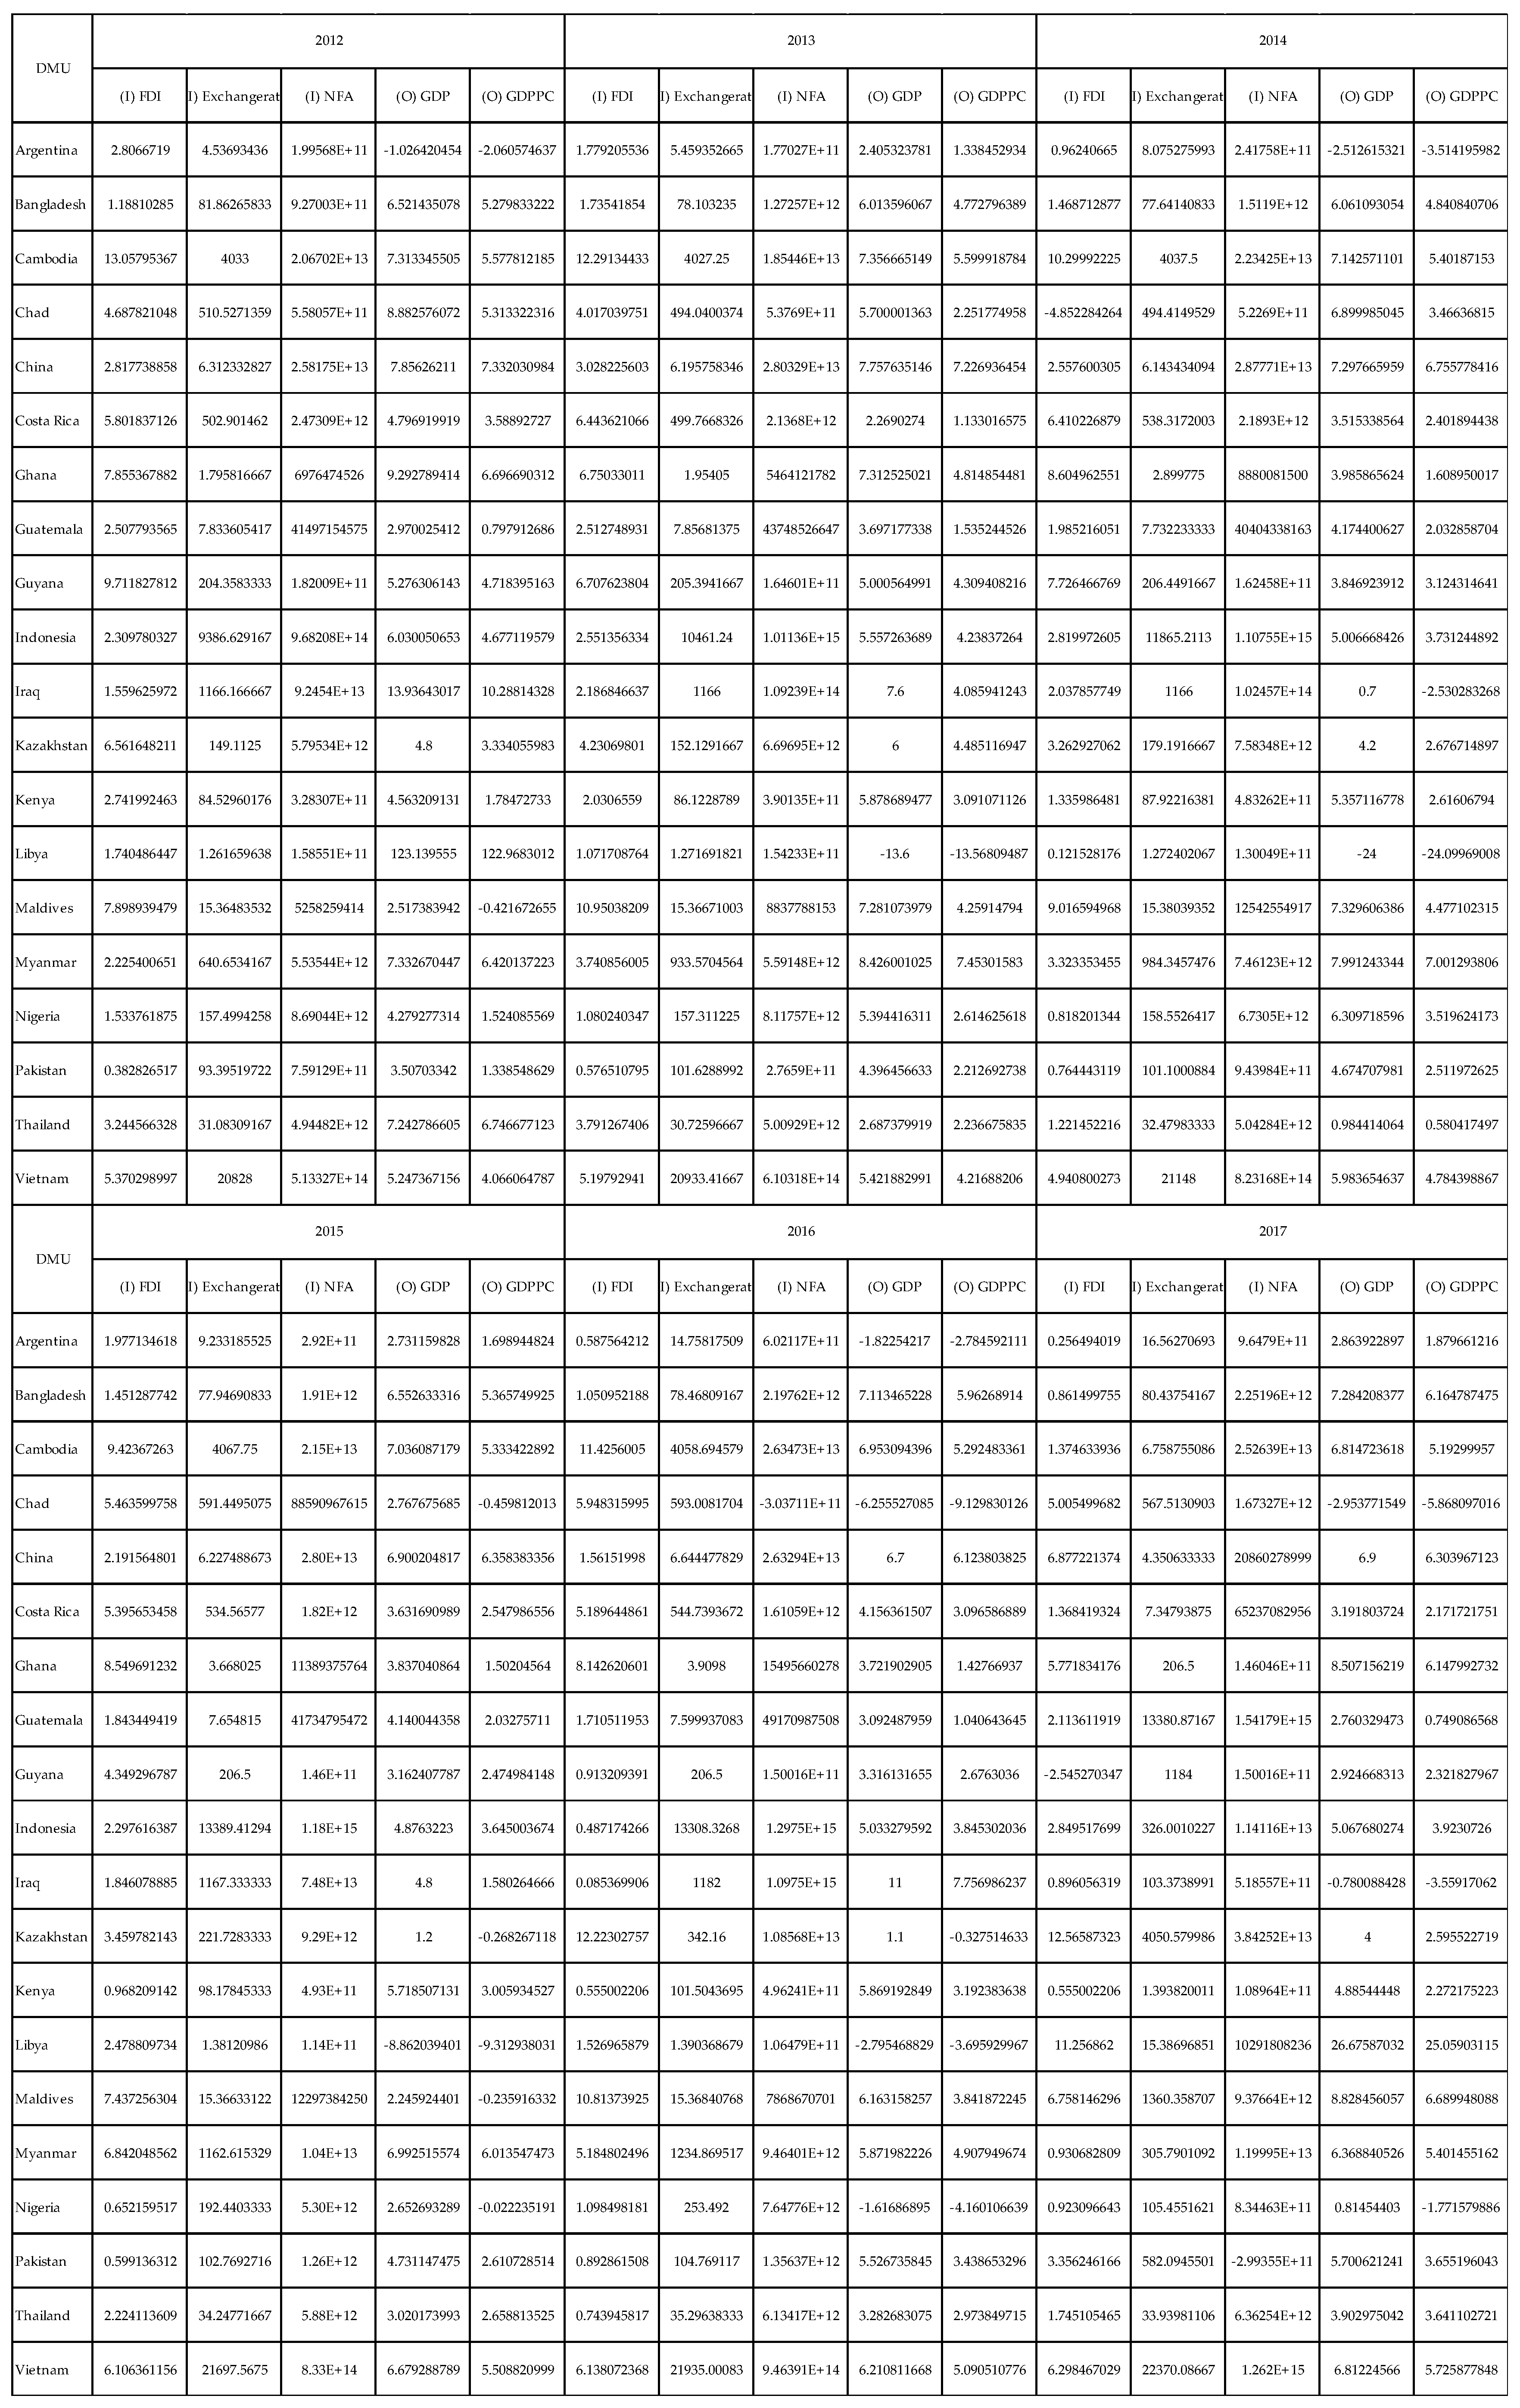
Pearson correlation analysis was utilized to analyze the relationship between inputs and outputs factors. The Pearson relationship coefficient in the analysis was determined throughout the years. Pearson connection coefficient to decide the information was utilized in this analysis, which is inappropriate for the DEA necessities. Connection coefficients are dependable from the dimension of (−1) to (1); if this factor is close to (1), it is an ideal straight connection. After effects of the Pearson connection coefficient from Table 3 and Appendix A Figure A2 demonstrate that the elements utilized in this analysis have a solid straight relationship, which is steady with the states of DEA and can be utilized for analysis. In this regard, the study conducted by Tintin [41] revealed that the relationship between FDI, economic growth, and productivity in developing countries can only be established in the long run. Some of the developing economies, like Nepal and Iraq, face several political and legal barriers in the context of foreign direct investment. In addition to this, the positive impact of FDI on economic growth and productivity is partly verified in developing countries. This is because there is a key element of technology rather than FDI and international trade that play a major role in the economic growth of the developing countries.
The correlation findings indicated that FDI and GDP are positively correlated. This is from the fact that FDI is invested in by a foreign nation, usually a developed nation, to improve the economic conditions of the host nation as well as improve resource utilization. One of the most important facts is that the profit needs to be higher than the costs of communications, transportation, and other barriers due to language, policies, and culture. In this respect, the receiving country remains as the financial inflow and use to improve its resources and financial outflow for the investing country/firm to influence its presence in the receiving country. This helps the receiving country to better utilize its economy and its resources to stabilize the country. Similarly, FDI is also impacted by the CSR policies and activities. CSR activities lead to sustainable utilization of its resources, causing economic and social benefits. This, in turn, helps the receiving country better implement strategies of social, economic, and environmental responsibilities.

4.3. MAPE

Table 4 compares the productivity across different countries in order to rank countries that are generated by optimally utilizing the input variables are presented in the table below [42]. The best productivity is shown by Libya, however this DEA does not show benchmarking values and it is suggested that, to benchmark the countries for the same time period, multistage DEA can be performed. The forecast is calculated by the actual data, and if the errors are in the allowable range, then it will be a reliable and usable model for the study [43]. The forecasted results of this study have a high level of accuracy, as average MAPE of 20 DMUs is 8.21% as in Table 5. If MAPE is smaller, the volatility in forecasts will be less, so the slacks-based measure of efficiency can be predicted.

4.4. GM (1,1)

The Grey forecasting mode has been used by the researcher to evaluate the efficiency of FDI on economic growth in 20 developing countries 2012–2017, which are shown in Table 6, Table 7 and Table 8. It was assessed that forecasting values of 2015 for the 20 countries worked out because MAPE (mean absolute percentage error) is small with 8.21%. Average MAPE of the 20 DMUs is less than the 10% limit. Therefore, based on the rules, the forecasted results in this study have a high level of accuracy. Here, the MAPE is small, therefore there will be less volatility in forecasts; it is also called the slacks-based measure of efficiency (SBM) [40]. The forecasted values using the Grey method indicate the rate of rise of both Greenfield and Brownfield FDIs in the chosen developing nations. Moreover, the forecasted values show the rise in CSR spending and FDI, and their impact will also raise the GDP of the chosen nations for the years 2018, 2019, and 2020. However, a few countries may have a negative impact on their GDP due to poor growth of FDI and CSR spending and increased exchange rates. This collaborated how current structure of FDI and CSR spending has an impact on the economy of the nations and how they cause rises in the exchange rate.
Forecasted values of the data indicate the expected amount of FDI the chosen developing nation may expect during the years 2018 to 2020. However, this must help the governments and the authorities of the developing nation to plan for effective and sustainable expenditure of the FDI for economic growth. In addition, the data also shows the needed amount of CSR expenditure to meet the needs of efficient resource utilization. Effective resource utilization will help the country in efficient economic growth and attract more FDI. Furthermore, it indicates that the FDI may increase in any of the following sectors of GDP: Agriculture, industry, manufacturing, and services.

4.5. DEA Model

Super SBM Efficiency
The slack-based model has been used in order to improve the existing model that can generate efficiency in the existing model. In the present study, the model evaluates the technical efficiency of the 20 developing countries [
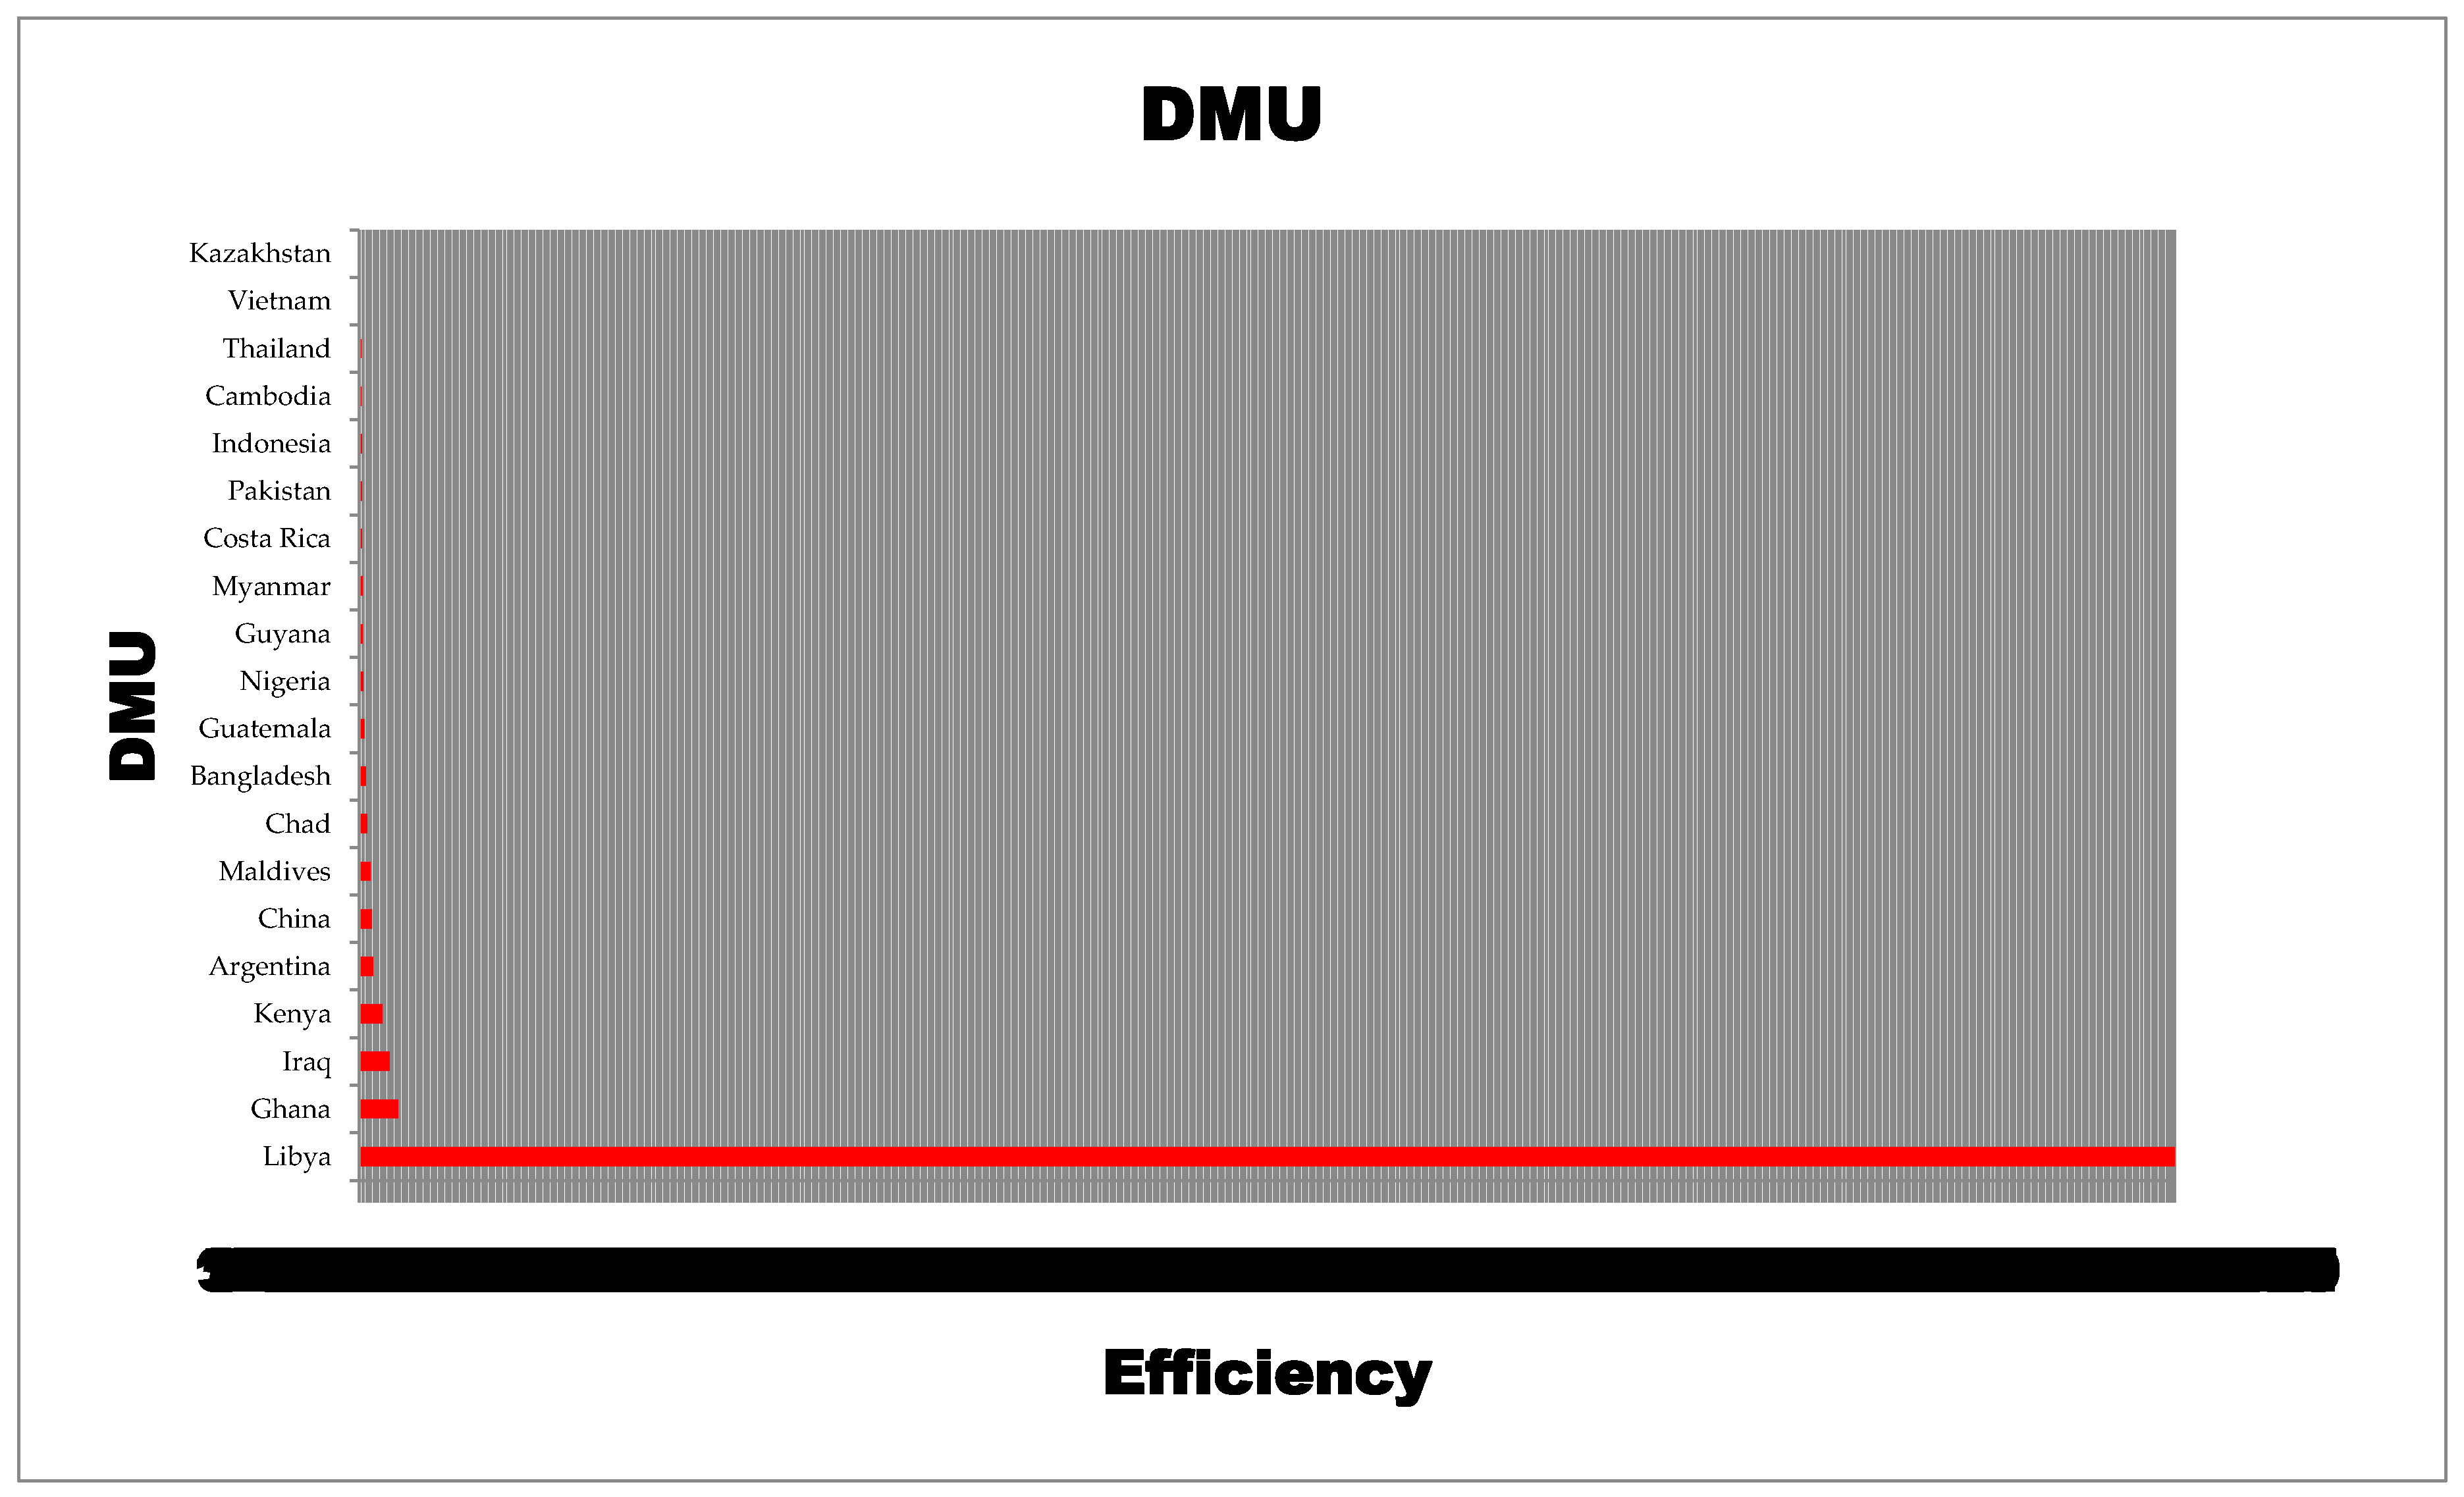
41]. From DEA super SBM model, it is analyzed that Libya is the most efficient amongst the 20 DMUs in 2012–2017. This is from the fact that Libya has an important standing in the world economy and a different political and economic system. Moreover, in Libya, socialist and Islamic factors have impacted on the nature of corporate social responsibility disclosure (CSRD) [44]. As a result, the level of CSRD has increased in Libya since 2000 due to pressures from stakeholders for information which may influence organizational performance for Libyan companies. Libya has a unique economic, political, and social system. The Libyan economy is neither a classical political economy nor a bourgeois political economy. Studies have indicated that Libyan social environment have influenced CSR and CSRD [45]. It has also showed the importance of CSRD, and stakeholders’ pressure in particular, after the establishment of a stock market in Libya. Figure 2 clearly highlights that Libya has shown consistent efficiency among the entire decision-making units. Since the slack-based measure deals directly with the input excesses and the output shortfalls of the decision making unit (DMU), it shows that the inputs are in excess for Libya, in comparison to the output received. Therefore, the country may reduce its inputs to increase its outputs. The measure also indicates that Libya is the only country that shows input excess and output shortfall. The measure of slacks also indicates that the measures of Libya are determined only by consulting the reference set of developing nations and is not affected by analysis for 2012 to 2017.
Table 9 shows the efficiency scores and the ranking of the decision-making units under the super SBM model. The results clearly highlight that Libya has displayed consistently amongst 20 decision-making units 2012–2017 by scoring the score of 1.00. The country has ranked first among all the decision-making units. In addition to this, Ghana also showed consistent progress by achieving the score of 1.00 for 2012–2016 but its efficiency declined in 2017 by displaying a score of about 0.425. Also, Kenya achieved efficiency from the period of 2013 to 2017 by achieving an efficiency score of 1. Lastly, Iraq and China have achieved efficiency until 2016 followed by a decline in 2017. The efficiency score can be seen for only Argentina, Bangladesh, China, Ghana, Guatemala, Guyana, Iraq, Pakistan, Maldives, Libya, and Kenya. Only Libya showed a consistent efficiency value of 1.000. This indicates that the input variables of FDI and CSR spending in Libya have helped in the sustainable economic development. This is evident from the fact that the Greenfield and Brownfield FDI of Libya has increased with respect to the fall in the exchange rate of the country to USD. In addition, reduced exchange rate has caused the increased inflows of FDI and hence helped the corporations to spend more on CSR spending. Thus, this improved the GDP growth of the country, whereas, the FDI and CSR spending of other countries have fluctuated over time and, hence, do not have stable efficiency values.
Efficiency is measured by the examining the production units. In addition to this, it is also essential to identify the inefficient sources that need to be improved to achieve a position in the competitive environment. The DEA technique is widely used for benchmarking in a linear programming model. This technique is widely used by the researcher to measure technical efficiency. This technique uses the input–output variable to measure the amount of output that can be generated with the given level of inputs. This technique acts as a mathematical tool to evaluate the efficiency and deal with a certain set of uncertainties [46].
Malmquist Efficiency
The Malmquist index is commonly used for measuring the performance of the country in terms of technical efficiency, change in the technology, change in pure technical efficiency, and the change in the total factor productivity [38]. This index assists the researcher in comparing the productivity change within the groups. Malmquist productivity Index is used for assessing the performance of 20 DMU’s for further analysis. This index identifies the productivity change over time in the context of economic growth. In the present study, performance of the DMUs was measured through Malmquist Productivity Index, catch-up effect, and frontier shift. This helps the DMUs in assessing and improving their performance.
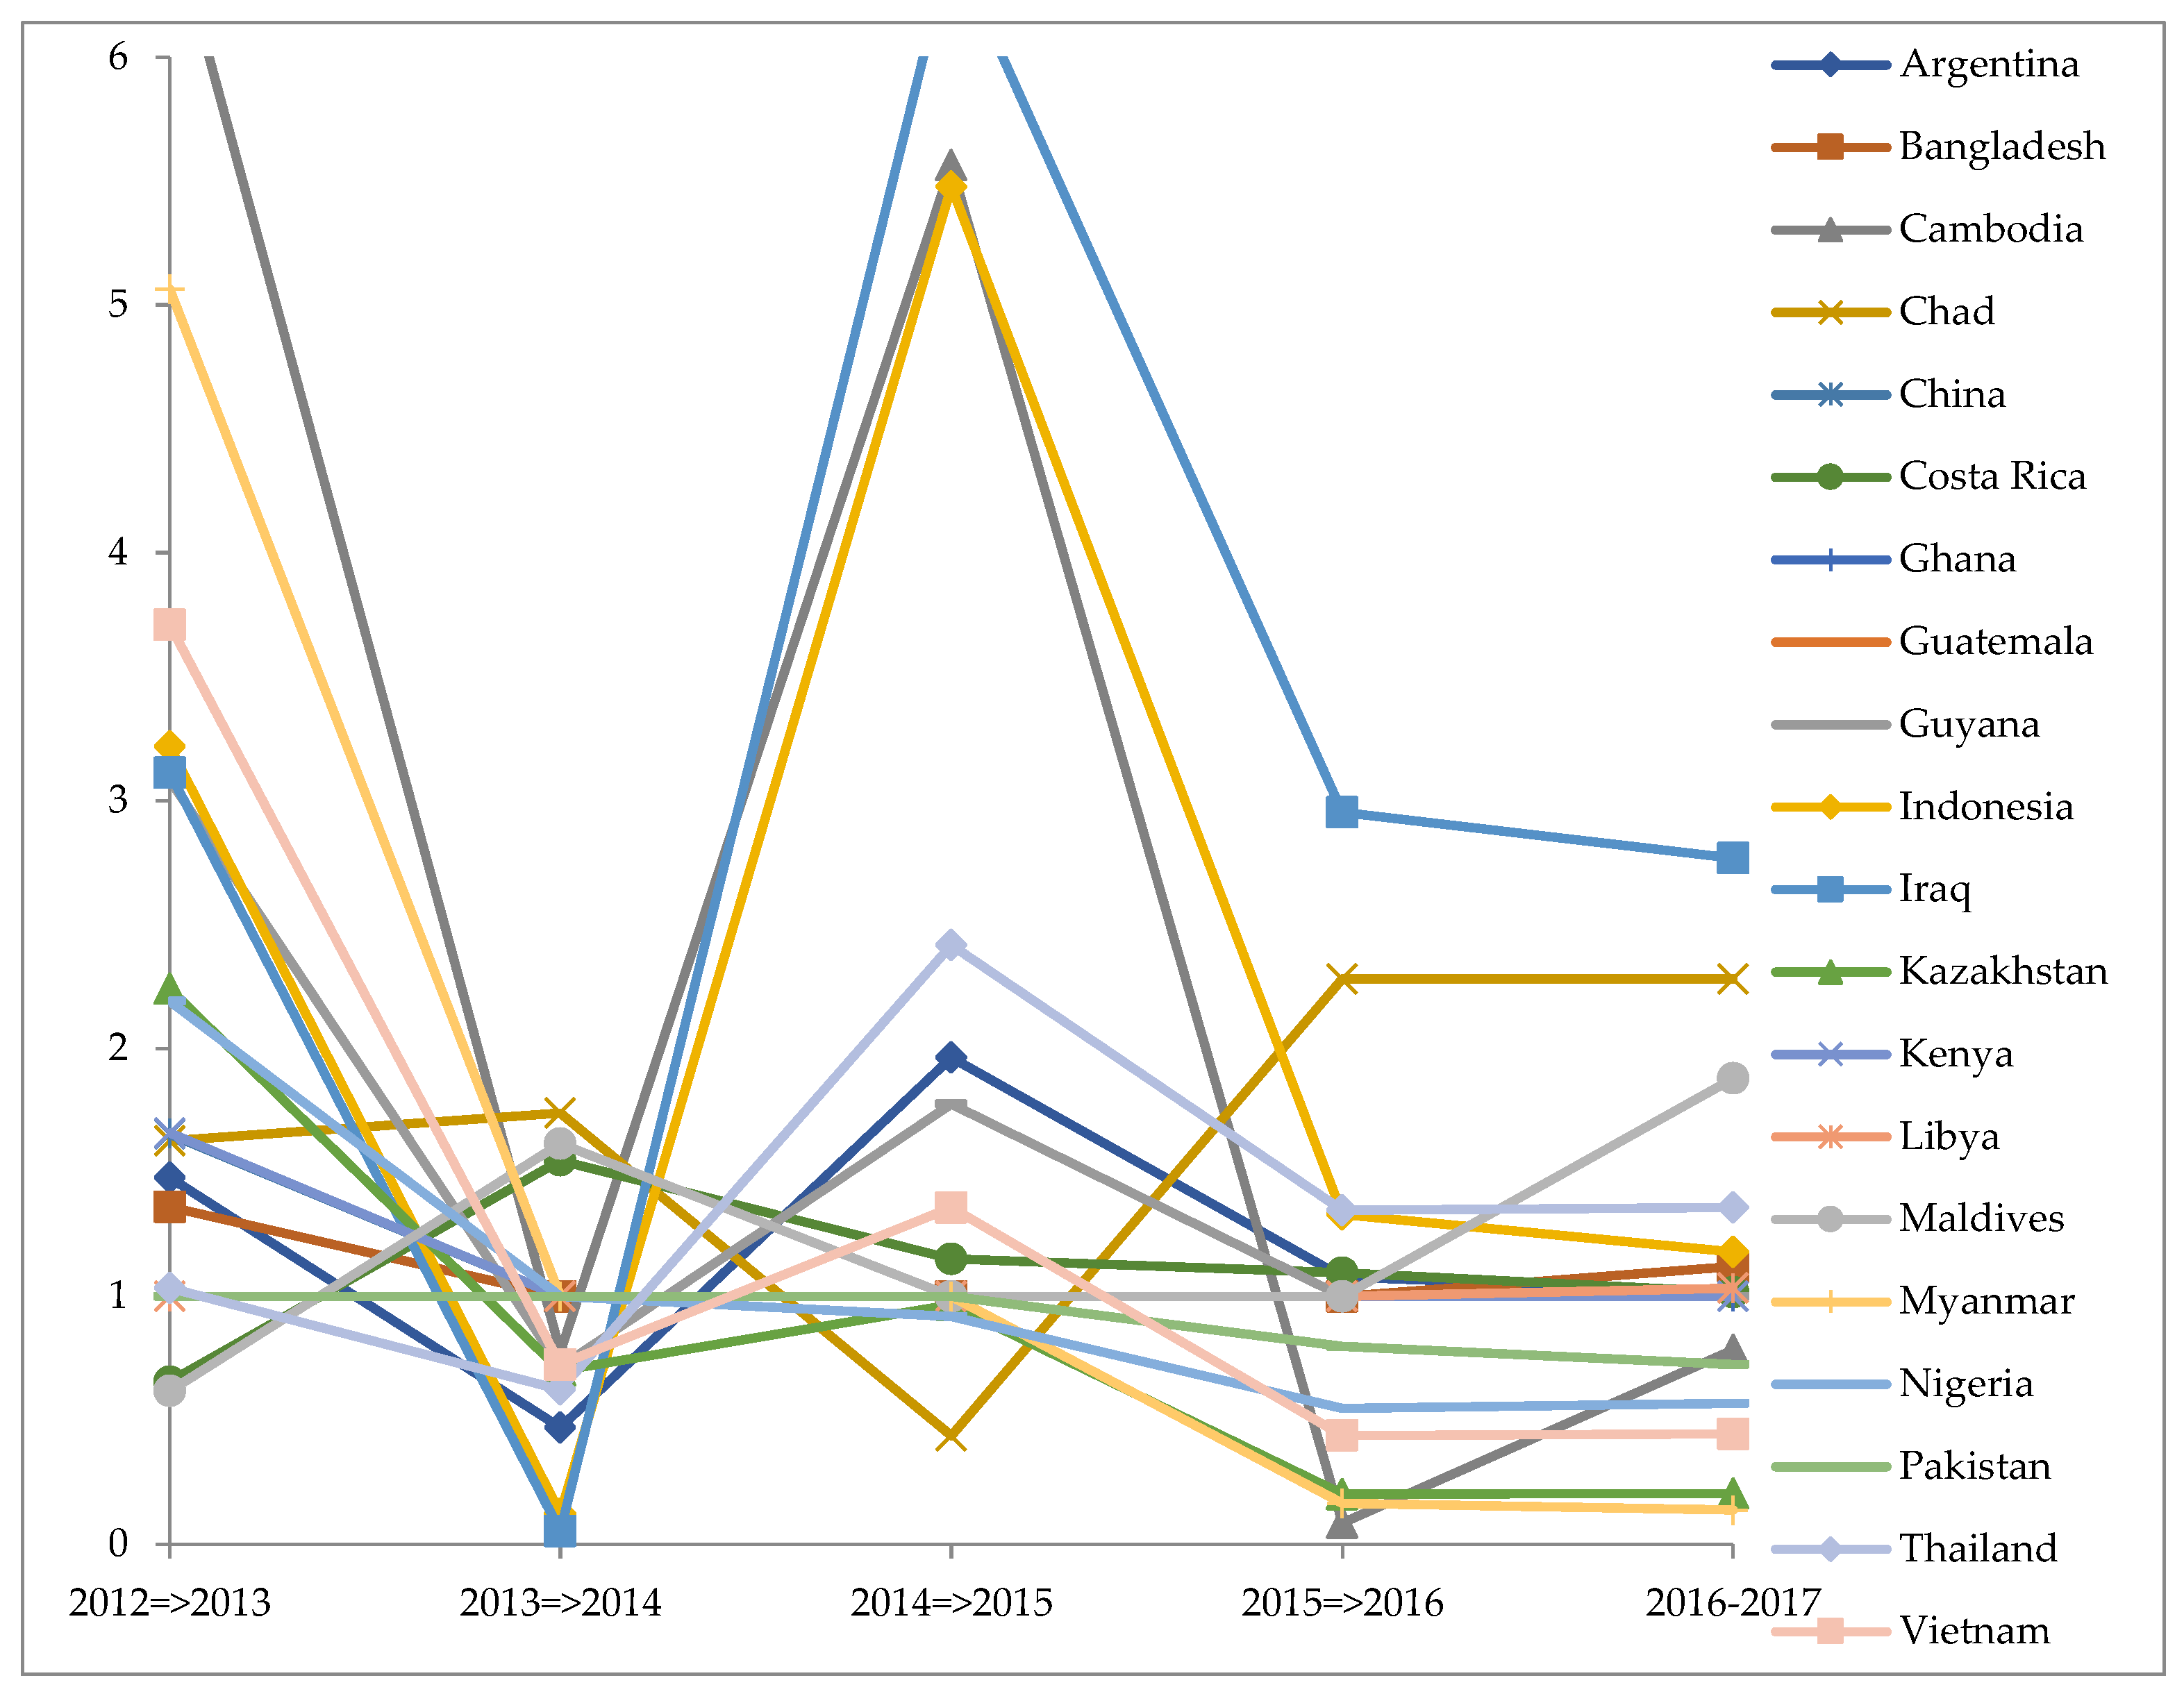
Catch-Up Effect
The catch effect is concerned with the amount of recovery that is obtained under the DMU to increase its efficiency. The catch-up effect represents the efficiency change indicating the extent to which a particular DMU improves or deteriorates its efficiency. If the change in efficiency is greater than 1, it represents the relative efficiency from an initial time period. In addition to this, if the change in efficiency is equal to 1, it represents no change. Further, if the change in efficiency is less than 1, it means that the DMUs have displayed an inefficient behavior [
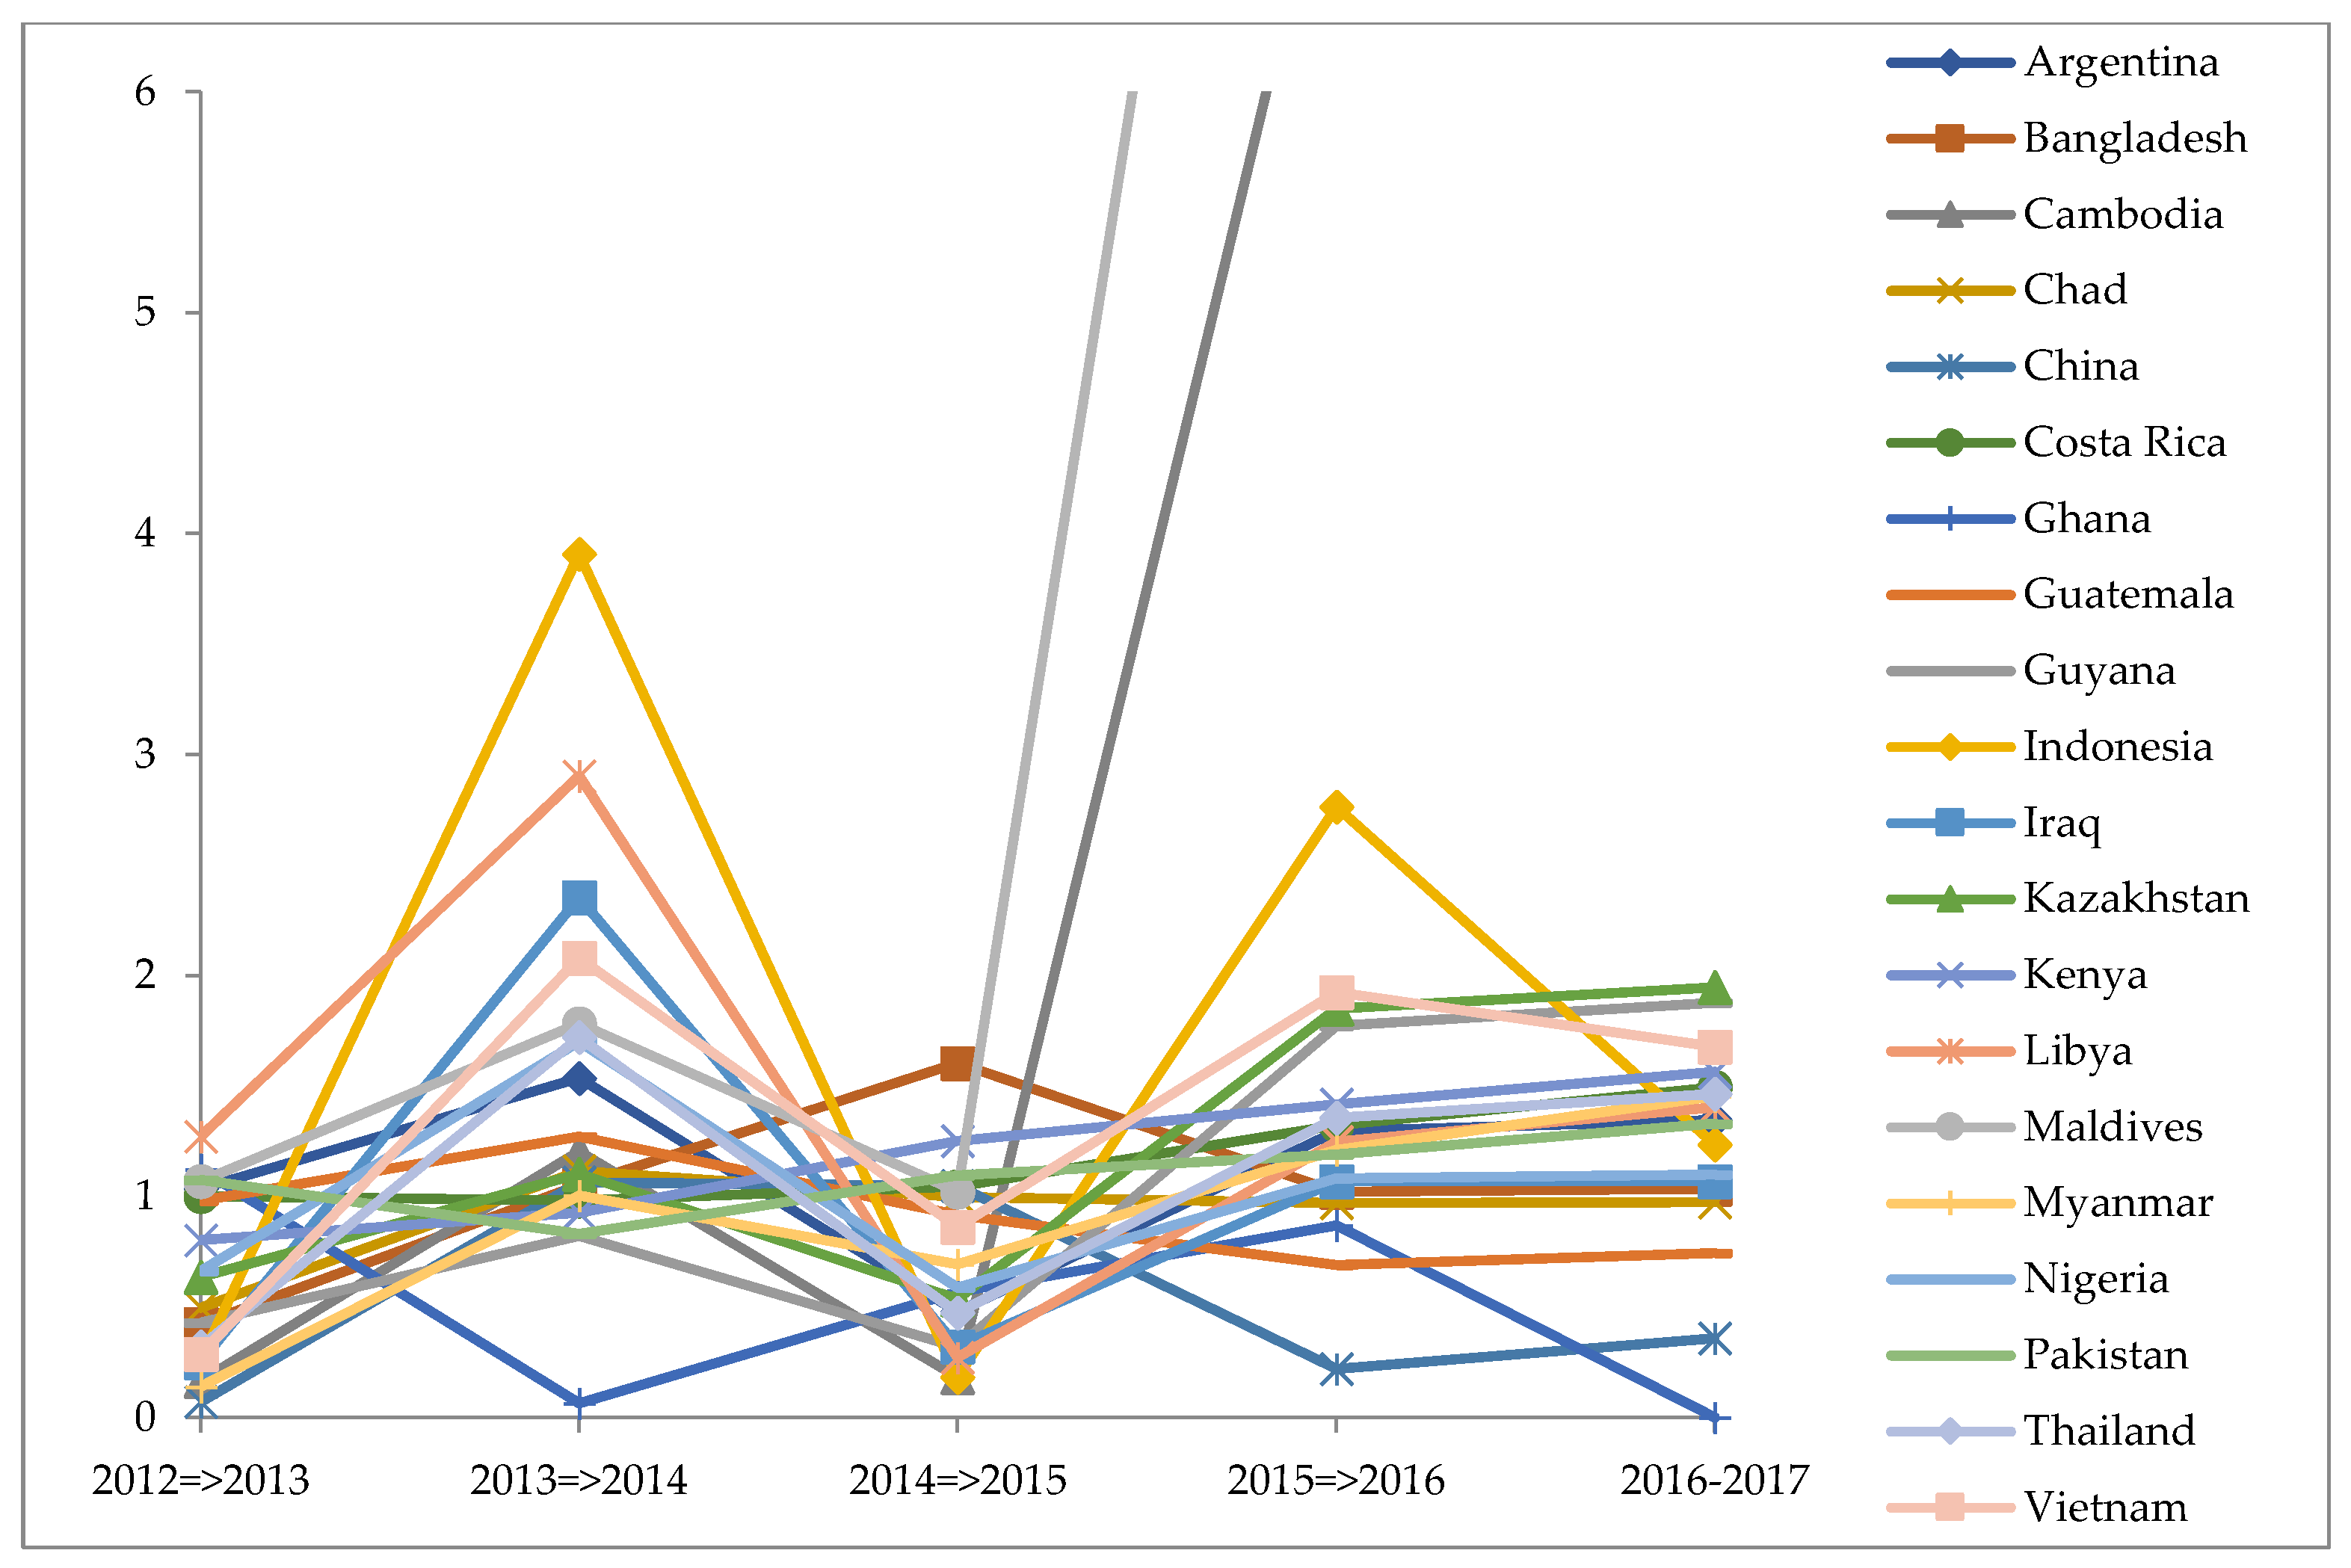
47]. In regard to the efficiency change displayed by different countries, the catch effect indicates the value needed by particular DMU to improve its productivity. The results in Table 10 indicate that Iraq and Cambodia have displayed a high level of improvement in efficiency as compared to 2012. However, few countries, like Pakistan, need to catch up with the other countries in terms of achieving efficiency.
Figure 3 shows the efficiency change of the 20 DMUs from 2012 to 2016, indicating that the efficiency is improved and reached the highest point for Cambodia, Iraq, and Indonesia for the period of 2014–2015 and displayed a decreasing trend in the following year. These countries have been unstable due to the largest fluctuations and need to focus on their development. This might be from the fact that the multi-criteria FDI and CSR approach increased for Cambodia, Iraq, and Indonesia during the period of 2014–2015. In addition, the exchange rate of Cambodia, Iraq, and Indonesia also decreased in the year 2014–2015. Since the catch-up effect is the amount of recovery that is obtained under the DMU to increase its efficiency, countries like Cambodia, Iraq, and Indonesia indicates the rate of the particular DMU that may have improved or deteriorated its efficiency in the coming years.
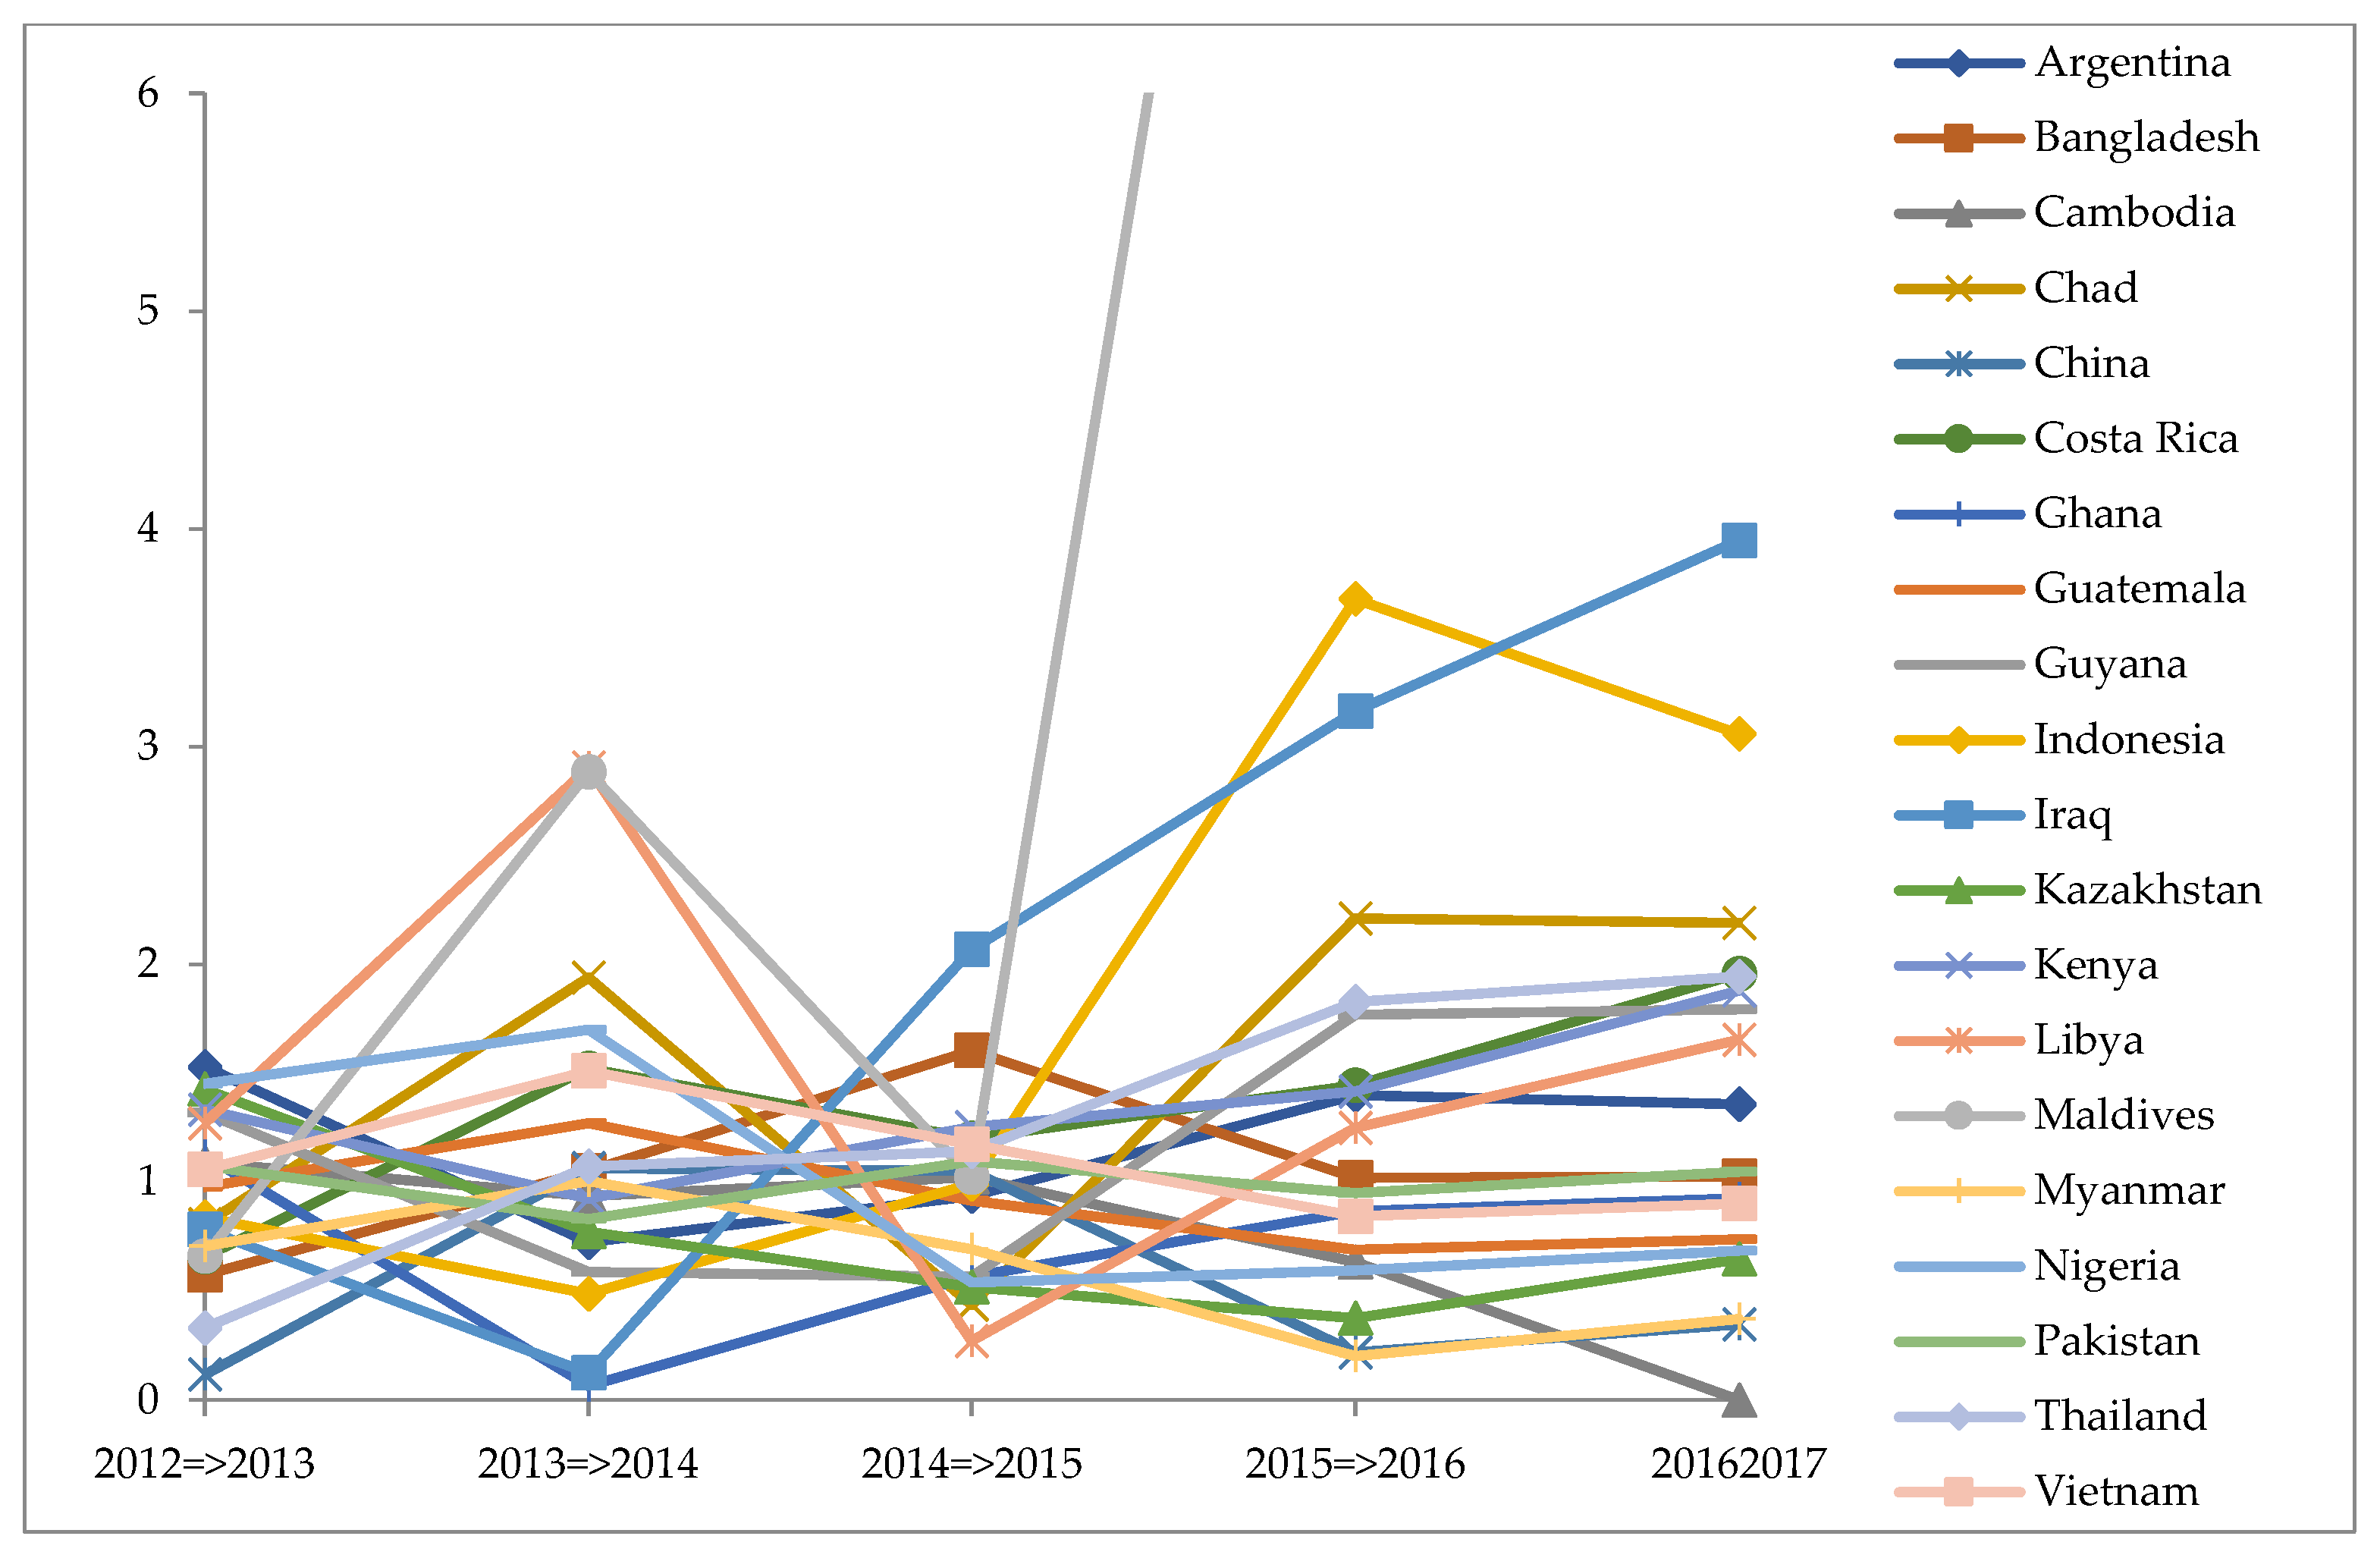
Frontier Shift
The frontier effect measures the difference within the efficient frontiers within the two time periods. It is used for measuring the improvement in the technology of the decision-making units. The value of the technological frontier greater than 1 represents the technological progression and a value of less than 1 represents the technological recession [41]. In this regard, the present study measures the change in technological among the countries. Table 11 represents the technological changes within 20 DMUs during the period of 2012–2017. The results indicate that almost all the countries were enhancing their technology and achieved technological efficiency. Few developing countries, like Maldives and Cambodia, have achieved a frontier effect of greater than 2, indicating these countries have achieved technological progression. However, few countries, like China and Guyana, lacked in comparison to other countries to achieve overall technological efficiency.
The graph in Figure 4 clearly indicates that, though Cambodia was operating at a very low level of technical efficiency until 2014–2015, the country witnessed a great scale of improvement post-2015. Also, Guyana, which displayed one of the lowest technical efficiencies amongst all the decision-making units until 2014, also displayed a high level of improvement in 2015. However, countries like China, which was operating at a high level of technical efficiency until 2013, have recently witnessed a technological recession. Since this model indicates the difference within the efficient frontiers within the two time periods for Cambodia, Guyana, and China, the values indicate the required improvement in the technology of the decision-making units for multi-criteria FDI and CSR spending. These countries, along with a few others, need to improve their technological efficiency in the years 2015–2016 to become efficient for the years 2016–2017. It may also be indidcated that the difference within the efficient frontiers during 2015–2016 will help Cambodia, Guyana, and China to improve their input variables and exponential outputs.
Malmquist Productivity Index
The Malmquist productivity index is used under the DEA model to measure the productivity in MPI. This measure is used to capture the relative overall performance of the decision-making units within different periods. This measure uses technology for the base period. This measure takes into account the efficiency and technological change in a geometric mean. It measures the overall change in productivity. If the value of the index is greater than 1, it means that there is an improvement in the overall productivity [42]. Table 12 shows the total productivity of the 20 DMUs from the period 2012–2017. The results clearly indicate that countries like Libya and Maldives have witnessed a long-term upwards trend during the period of 2014–2017. These countries have displayed improvement in their efficiency. However, China’s productivity has fallen since 2015, indicating poor performance in terms of total productivity.
The graph in Figure 5 reflects that there is a constant improvement in technical efficiency over time in almost all countries. Only Cambodia appears unstable with the largest fluctuations as the country was operating at a low level of efficiency but observed a great improvement in technological efficiency post-2015. Some countries, such as Costa Rica, require improvement in inputs like FDI inflows, CSR, and exchange rate to improve the economic countries. Since, Malmquist DEA indicates the productivity of the input and output variables, the multi-criteria measures of FDI and CSR for Cambodia are used to capture the relative overall performance of the decision-making units within different periods for the years 2014–2017. This also implicates that all other countries may follow the model of FDI usage and CSR expenditure for improved sustainable growth of the country.
The results of the Malmquist productivity index and the frontier effect clearly highlight that Cambodia has witnessed a great improvement in terms of productivity and technological progression post-2015. In this regard, the study conducted by Richardson in 2014 [48] revealed that Cambodia has witnessed a technological progression in the recent years. In addition to this, the government is imparting training among the students in order to offer them exposure to computers and the internet. Further, the schools and educational institutes have started adopting the latest technological tools and e-learning courses to impart education among the students. The government has shown a favorable attitude in the context of the use of technology by providing the necessary infrastructure of electricity. The study conducted by the government of Cambodia, 2015 (Government of Cambodia, 2015) highlighted that the government has ensured internet availability, human capital, and cellphone coverage across long distances [49]. An improvement in technological equipment has led to increased productivity and output across all the sectors in the economy. Further, the government has also ensured a stable political system that focuses on the technological assistance and industrial development. Technological assistance has also helped the companies in higher proficiencies and financial performances. CSR spending in Cambodia in the recent years has also grown. However, in developing countries in East Asia, such as Cambodia, CSR is a relatively new concept, and the implications of developments in CSR for local companies are still being explored [
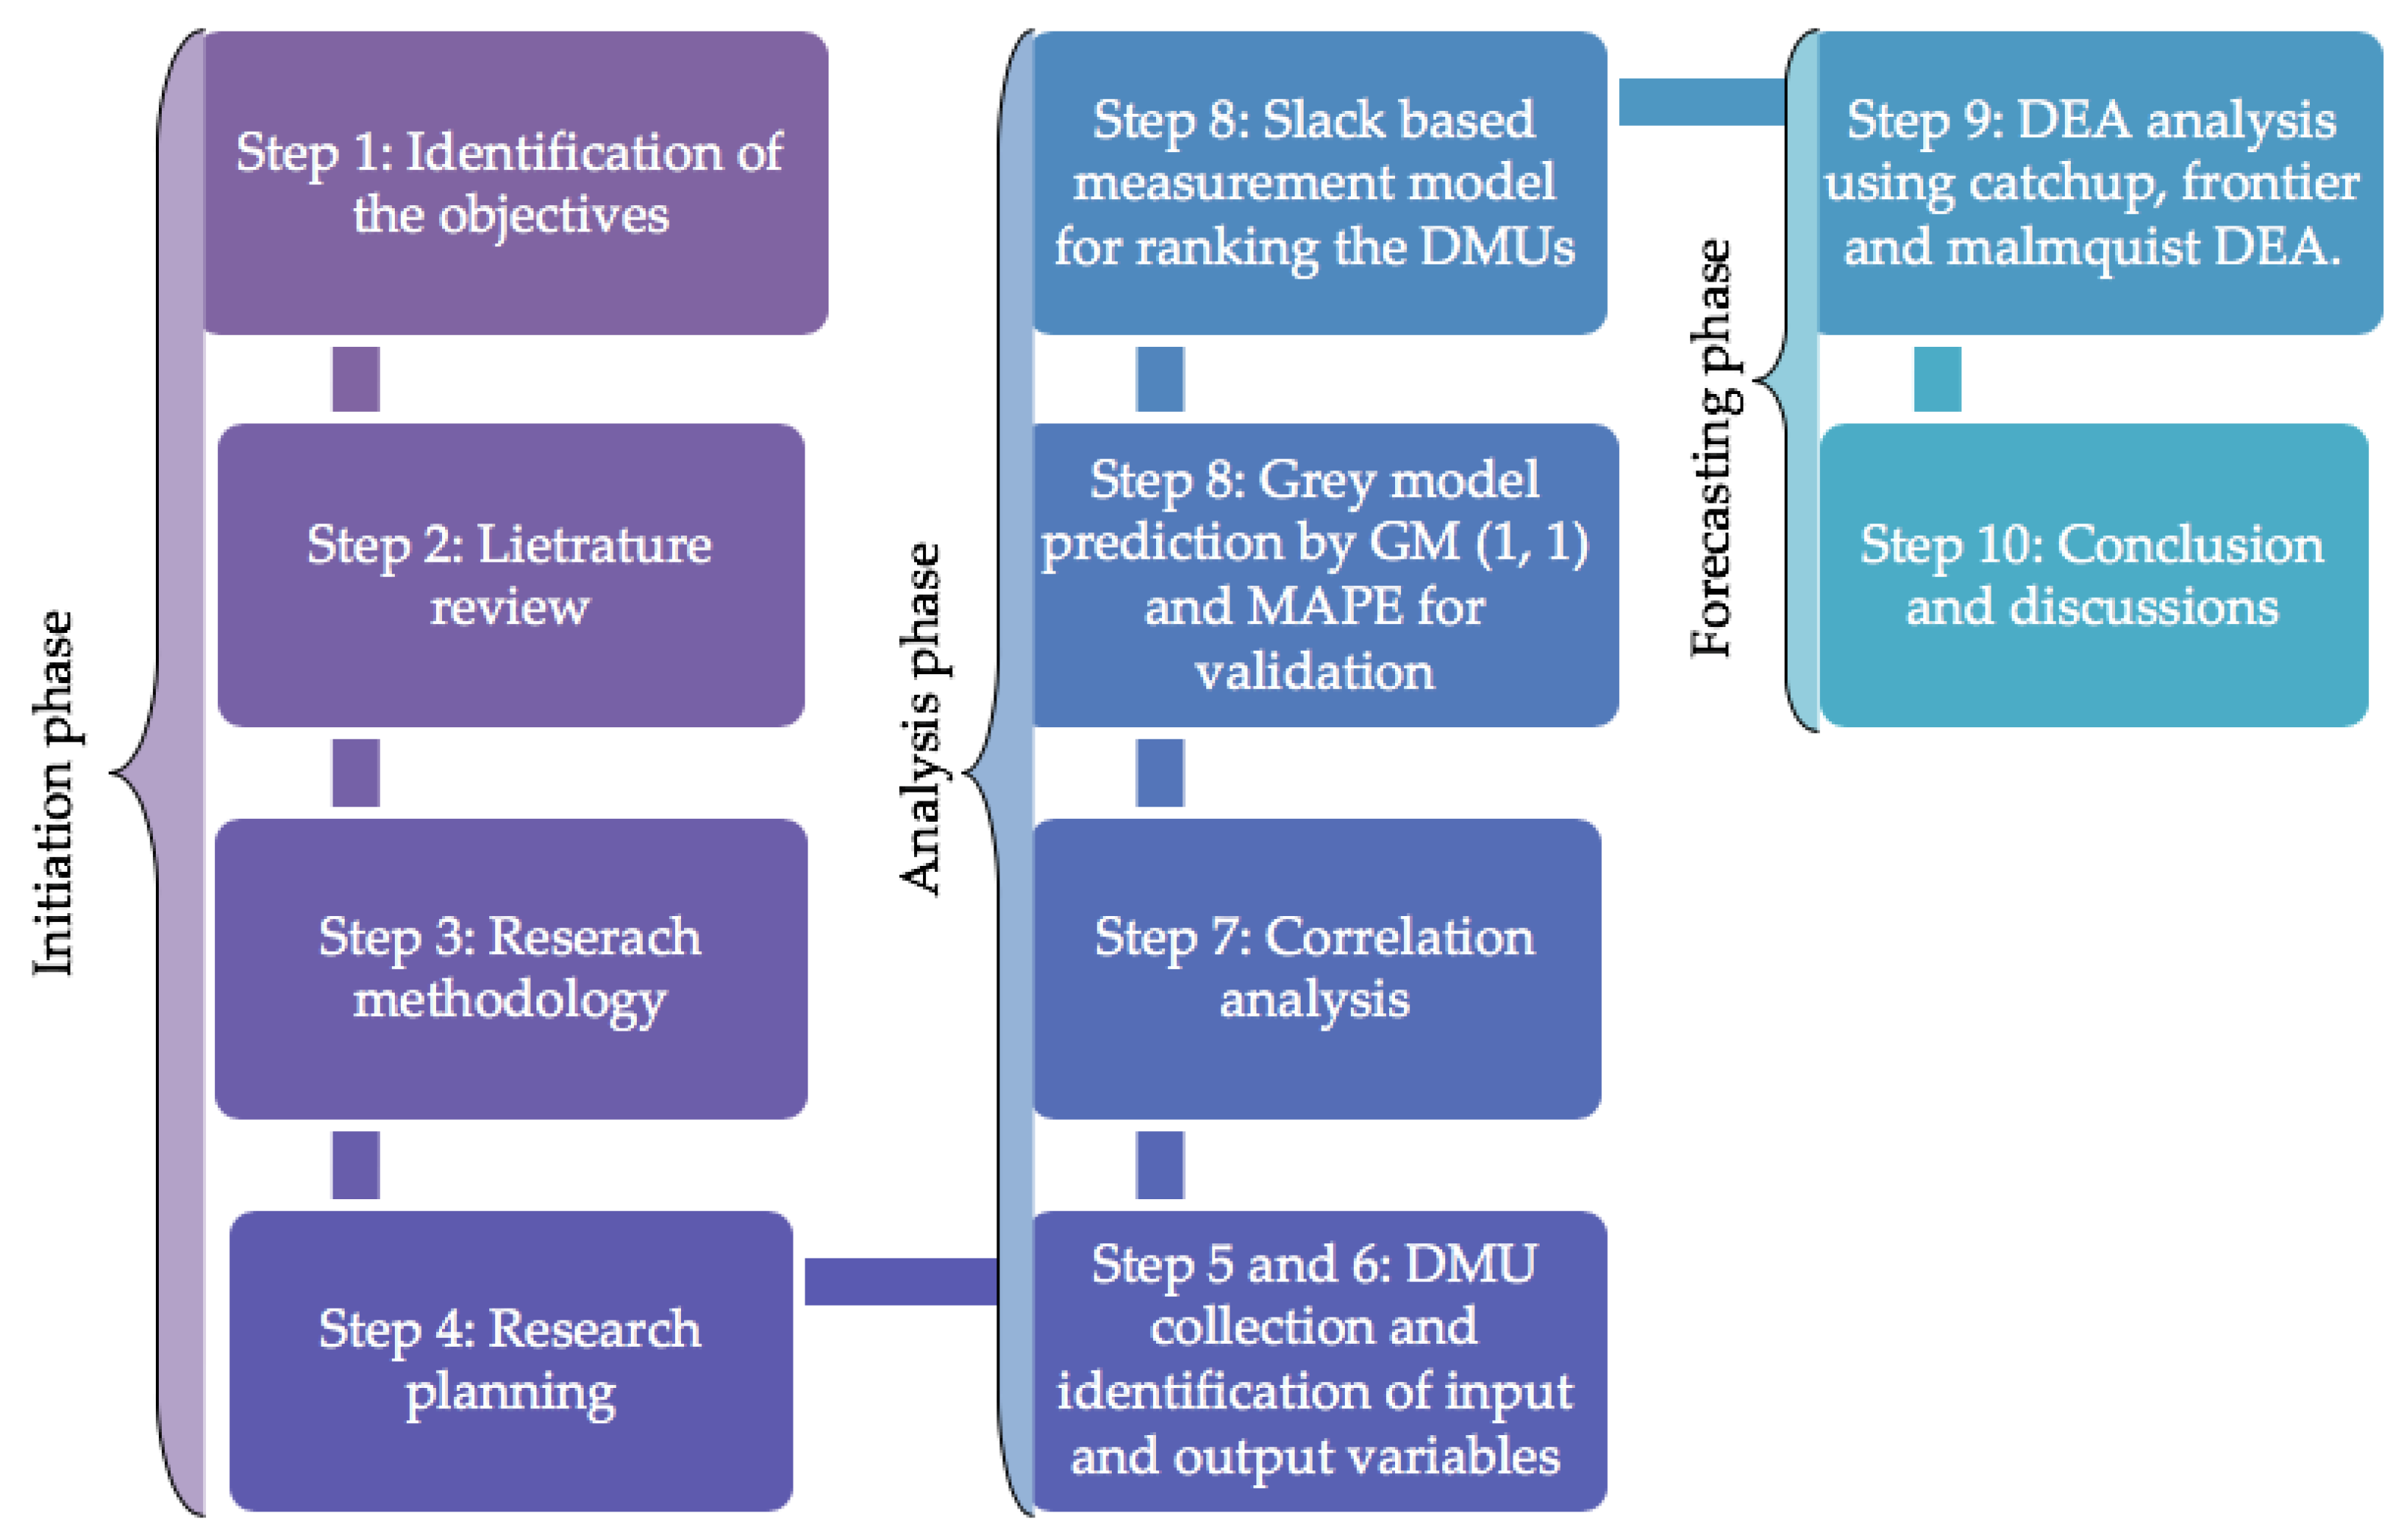
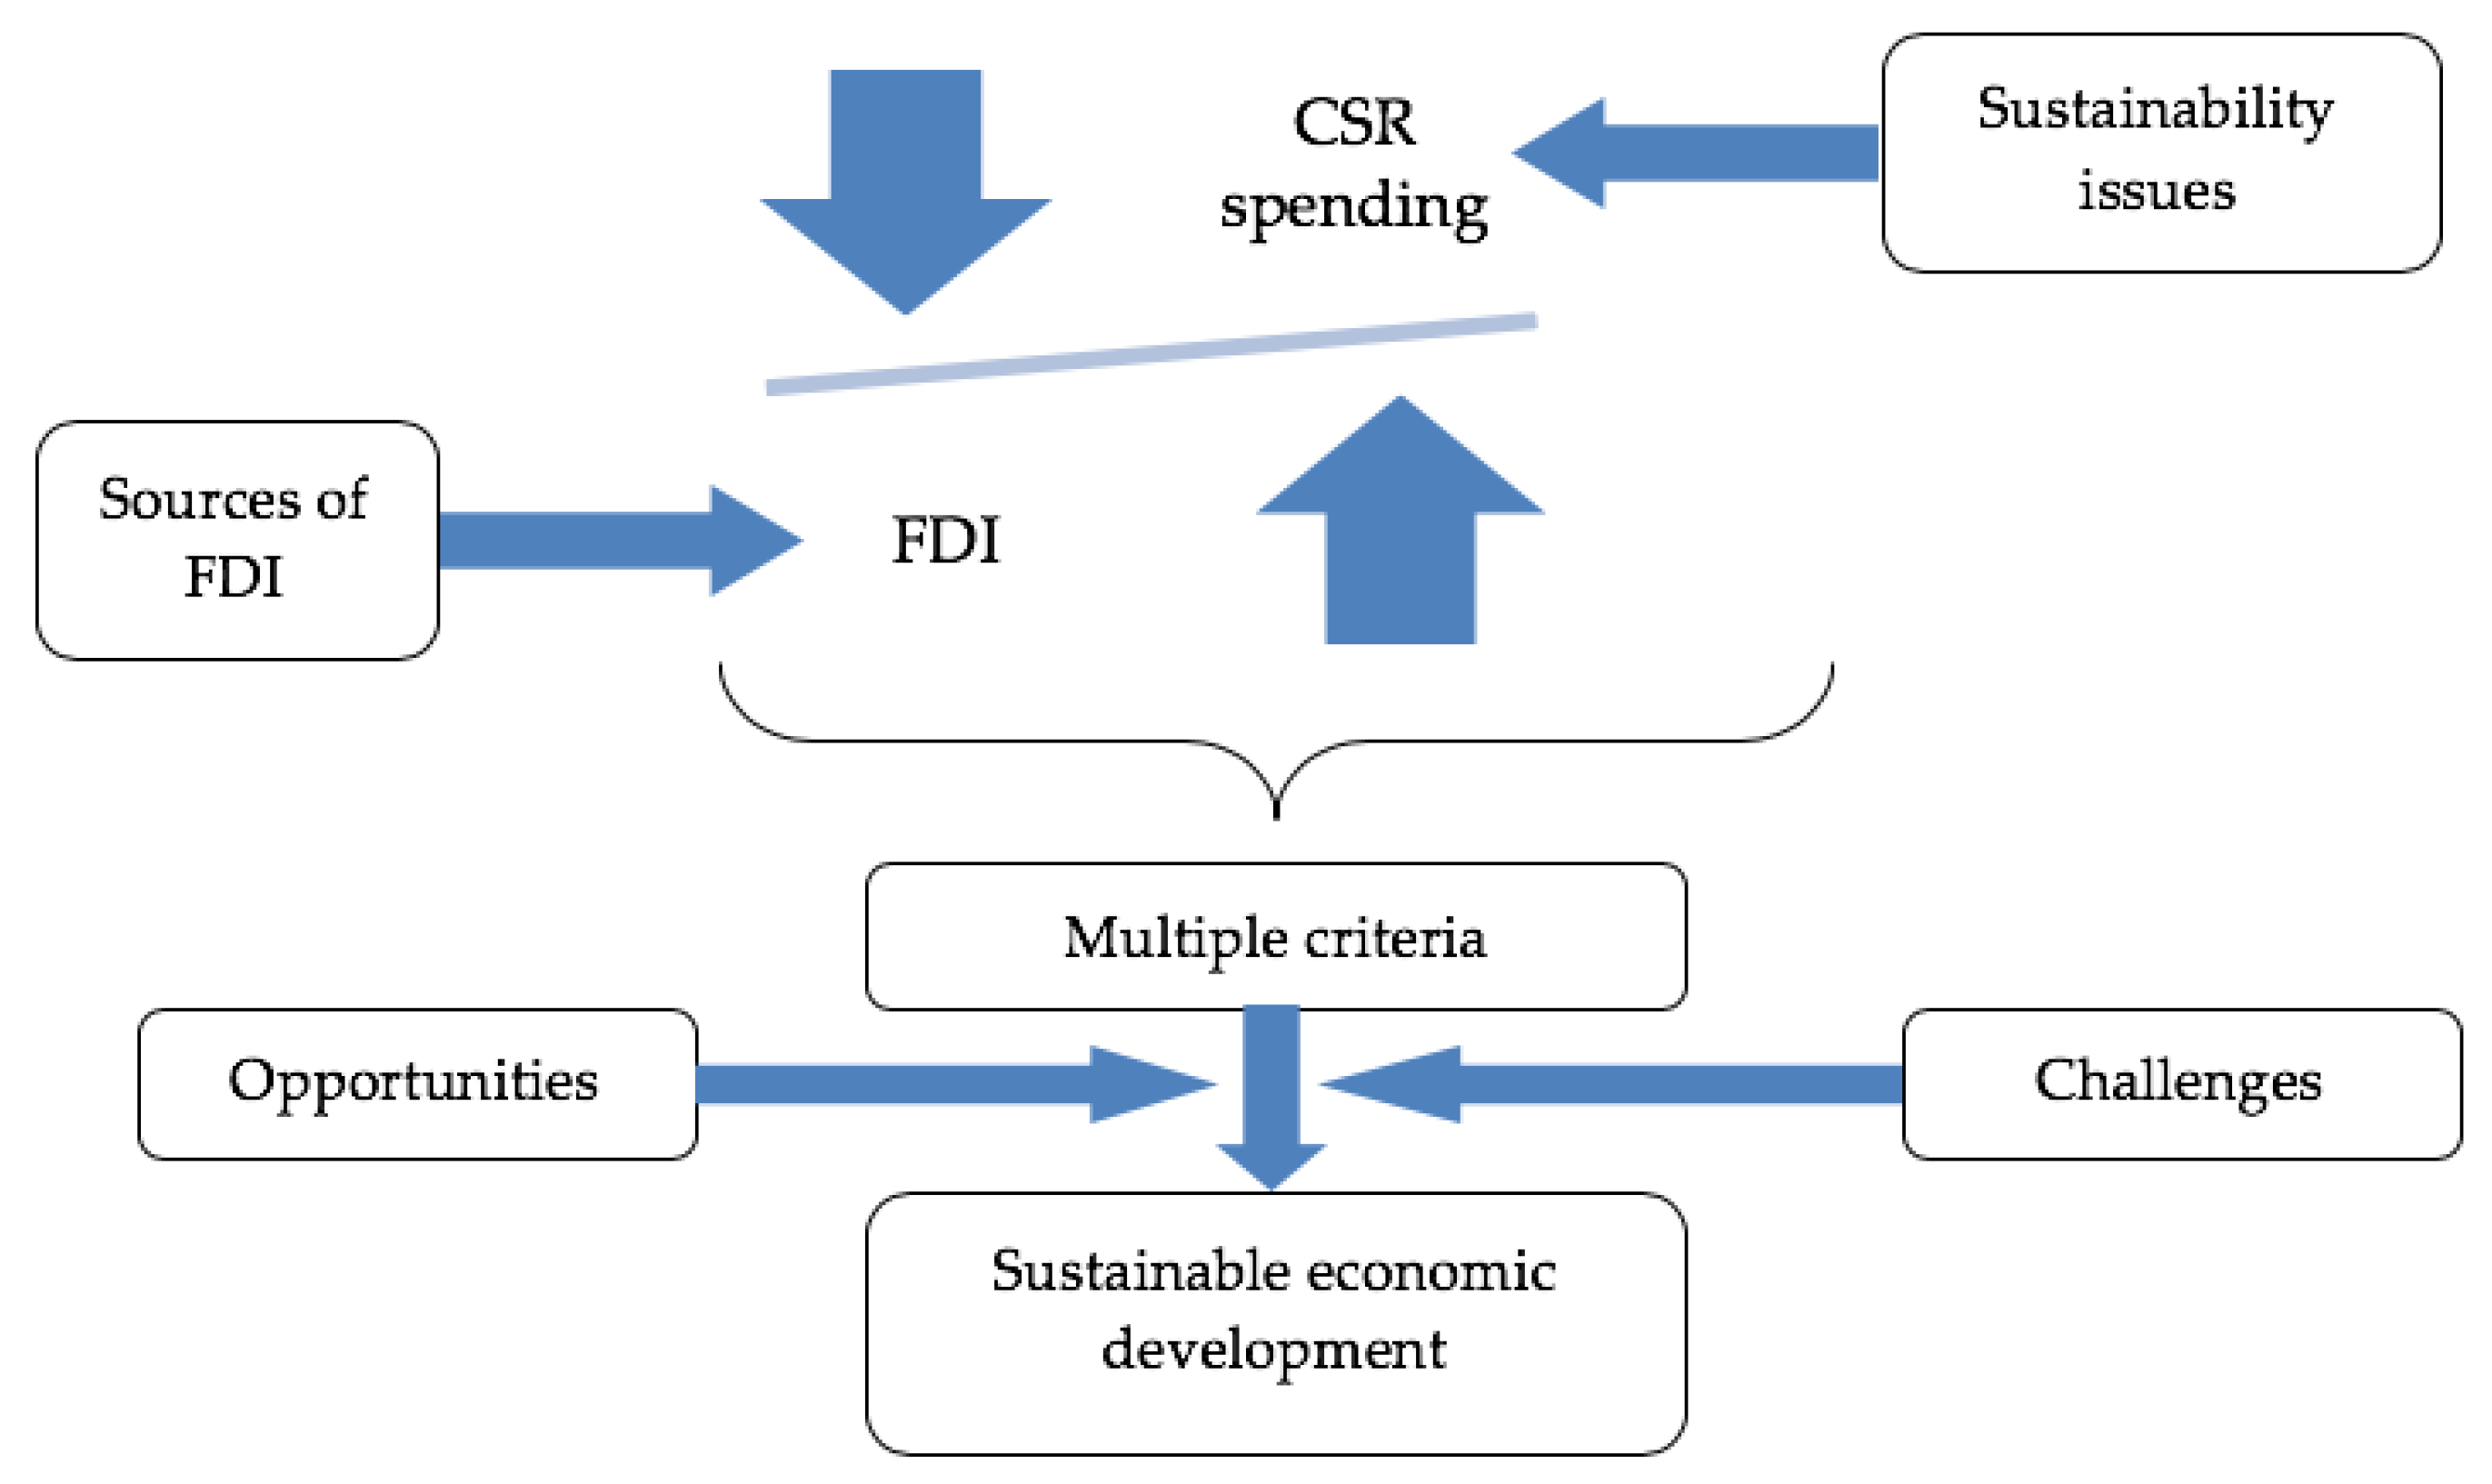
50]. In Cambodia, the size of the industrial base and the extent to which the industrial structure offers potential for CSR activities are limited. However, the spending has increased over the years and is being efficiently used. This must help the decision makers in adopting the strategies of Cambodia so that multiple criteria FDI, exchange rate, and CSR spending can be used efficiently for sustainable development of the nations. In this regard, a conceptual framework may be used by the decision makers for efficient use of multiple criteria FDI and CSR (Figure 6).
The decision makers are responsible for achieving sustainable economic growth of the nation. Therefore, it is very important the authorities efficiently evaluate the FDI inflows from organizations or international governments. This will help in the effective adoption of technologies and gather knowledge with respect to sustainable development and issues. CSR spending, as found from the literature, is an important method of solving sustainability issues. Therefore, CSR spending and FDI should be in conglomerate and function in a balanced way. The more FDI, the more CSR expenditure can be exerted to resolve the sustainability issues. Thus, these two multiple criteria can be used for the economic growth of the nation. However, during the line, the nation may face challenges and opportunities for sustainability, financial issues, technological changes, and human capital. Henceforth, policy makers must take note of the opportunities and challenges and come up with policies that will help in sustainable economic development.
The study, therefore, hypothesizes the theory of Schumpeterian growth theory. The findings from the study clearly indicated that developing nations have improved the economic conditions and improved growth generated by innovations. As a result, innovations result from FDI investments that are themselves motivated by the prospects. FDI investments, along with CSR spending, allows innovations to replace old policies; in other words, growth involves creative destruction. Therefore, using FDI and CSR will help in positive multi-criteria economic growth of developing nations. Therefore, the decision makers must follow the multi criteria of using FDI and sustainability values efficiently and benchmark the multi criteria models of Libya for sustainable economic development. Thus, for the forecasted years of 2018 to 2020, the decision makers of developing nations must suffice to attract larger inflows of FDI and increased CSR spending. This will have a direct positive impact on the GDP and GDPPC. In addition, the decision makers may view the forecasted values of their respective nations and contract it to the values of Libya for benchmarking and efficient implementation of multiple criteria (FDI and CSR) for sustainable economic developments in the years 2018–2020.

5. Conclusions

FDI and CSR spending are one of the most important aspects of sustainable economic development of nations. FDI helps the countries through increased development and implementation of different strategies for improving the finances and economics of a country. However, sustainable development focuses on the environmental, social, and economic aspects. Therefore, CSR expenditures are one of the best strategies of sustainable development, especially in developing nations. The results show that the average MPI of developing countries has improved over the years. This implies that FDI has a significant impact on the economic growth of developing countries. Due to FDI, there is an improvement in the technical efficiency, which leads to improvement in total factor productivity. The Maldives stood in the top position in the Malmquist productivity index amongst developing countries. The reason behind this might be due to the rapid expansion of tourism in recent years. On the other hand, Iraq stood at the second highest position with an average value of 1.53 in MPI. Therefore, there is an improvement in total factor productivity (TFP) of countries which have values of MPI greater than 1. This further indicates that FDI is one of the major factors in enhancing the growth of the economy of developing countries. All developing nations still mainly focus on FDI to improve their economic conditions and therefore lack sustainable development. Apart from FDI, CSR spending is strategic for developed nations. Therefore, it is important that developing nations improve their CSR policies along with foreign investments. Larger foreign investments mean better usage of CSR. Improved CSR will help industries to flourish and henceforth help increase the GDP of the countries.
The findings, however, indicate that the decision makers of sustainable economic development will be now able to assess the economic growth models of Libya. This is on the fact that Libya was found to have the lowest slacks between the input variables and the output variables, and hence was also considered as rank 1 under SBM assessment. Although different nations were found to have MPI values of 1, Libya was the only one with the best SBM value. Therefore, the decision makers must follow the multi-criteria of using FDI and sustainability values efficiently and benchmark the multi-criteria models of Libya for sustainable economic development. Thus, for the forecasted years of 2018 to 2020, the decision makers of developing nations must suffice to attract larger inflows of FDI and increased CSR spending. This will have a direct positive impact on GDP and GDPPC. In addition, the decision makers may view the forecasted values of their respective nations and contract it to the values of Libya for benchmarking and efficient implementation of multiple criteria (FDI and CSR) for sustainable economic developments in the years 2018–2020. Thus, the study asserts the following conclusions: (i) CSR spending is an important activity that indicates the sustainable development of a country. Contributions of CSR to the economic development of the developing nations implicate sustainable economic development. (ii) The correlation findings indicated that larger foreign investments positively influence CSR spending capabilities. Improved CSR will help industries to flourish and henceforth help increase the GDP of the countries. (iii) In addition, the exchange rate plays a major role in allowing FDI inflows to developing countries. The higher the exchange rates, the better FDI inflows to the country, and vice versa. (iv) Forecasting indicates that the FDI and exchange rate of the chosen DMUs will constantly increase, except for a few countries (China, Guyana, Maldives, and a few other countries). This indicates that the countries with stable growth of FDI and exchange rate will become efficient in the future years with respect to GDP growth. Countries like Vietnam, Cambodia, Indonesia, Argentina, and a few others showed distinctive growth of FDI and CSR spending for the years 2018 to 2020. Henceforth, their GDP and GDPCC too seem to increase in a larger percentage. (v) Efficiency values indicate that increased inputs of FDI and CSR spending have made countries like Argentina, China, Vietnam, Thailand, Kenya, and others efficient in improving its economic status and on the way of fulfilling plans of sustainable economic development. (vi) Forecasted values CSR and FDI must be efficiently used by the developing nations for lowering the slack values and thereby focusing on outputs GDP and GDPPC. SBM values and MPI of the t+1 year (2017) must be used for benchmarking one or more than one DMU by the decision makers of the developing nations. The multiple criteria forecasted values can be used for developing a model of sustainable economic development.
However, there are certain limitations of the study, which are: (i) There is a lack of sustainability reports and data for the chosen countries. (ii) Moreover, the data collected as CSR spending is just one variable with respect to sustainable development. (iii) The study tried usage of MCDM but lacks usage of models due to lack of data availability. MCDM models need algorithm testing, which has been ignored in this study as it was outside the scope.
In order to overcome these issues, future studies must focus on: (i) A larger dataset of DMUs and output/input variable. (ii) Another important future scope is the exploration of other sustainability variables for developing nations to see the impact on sustainable economic development. (iii) The future studies may also make comparative studies on developing and developed countries to find the efficient use of FDI and sustainability variables. (iv) In future research, we will also use the robustness analysis to enrich research methods. In addition, the study and research on the negative aspects of FDI will be our concern to have a more multidimensional perspective in assessing the effectiveness of FDI.

Author Contributions

C.-N.W. guided the research direction, guided the analysis method, and edited the content; A.P.L. designed the research framework, analyzed the empirical result, and wrote the paper. Both authors contributed to issuing the final results.

Funding

No funding.

Acknowledgments

The authors appreciate the support from the National Kaohsiung University of Science and Technology, Ministry of Sciences and Technology in Taiwan.

Conflicts of Interest

The authors declare no conflict of interest.

Abbreviations and Acronyms

The following abbreviations and acronyms are used in this manuscript:
DEAData envelopment analysis
MPIMalmquist productivity index
MCDMMultiple criteria decision-making
SBMSlack-based measurements
GMGrey Model forecasting
MAPEMean absolute percent error
DMUDecision-making units
CSRCorporate social responsibility
FDIForeign direct investment
GDPGross domestic product
GDPPCGross domestic product per capita

Appendix A

Figure A1. List of variables for input and output variables.
Sustainability 11 02389 g0a1
Figure A2. Correlation for inputs and outputs for the year 2012 to 2017.
Sustainability 11 02389 g0a2

References

  1. Abdul, K. Determinants of Foreign Direct Investment and Its Impact on Economic Growth in Developing Countries; MPRA Paper 9457; University Library of Munich: Munich, Germany, 2008; Available online: https://mpra.ub.uni-muenchen.de/9457/ (accessed on 7 December 2018).
  2. Asongu, S.; Akpan, U.S.; Isihak, S.R. Determinants of foreign direct investment in fast-growing economies: evidence from the BRICS and MINT countries. Financ. Innov. 2018, 4. [Google Scholar] [CrossRef]
  3. Sabir, S.; Rafique, A.; AbbasInstitutions, K. Institutions and FDI: evidence from developed and developing countries. Financ. Innov. 2019, 5. [Google Scholar] [CrossRef]
  4. Elkomy, S.; Ingham, H.; Read, R. Economic and political determinants of the effects of FDI on growth in transition and developing countries. Thunderbird Int. Bus. Rev. 2016, 58, 347–362. [Google Scholar] [CrossRef]
  5. Alina-Mihaela, B.; Radu-Marcel, J. FDI structural effects on developing countries. Presented at the 23rd IBIMA Conference on Vision 2020: Sustainable Growth, Economic Development, and Global Competitiveness, Valencia, Spain, 13–14 May 2014; Volume 1–5, pp. 91–95. Available online: https://ibima.org/conference/23rd-ibima-conference/ (accessed on 9 December 2018).
  6. Ghosh, A.; Chakraborti, C. Beyond corporate social responsibility: Ethics in action. Glob. Virtue Ethics Rev. 2014, 6, 60–99. [Google Scholar]
  7. Jamali, D.; Karam, C. Corporate social responsibility in developing countries as an emerging field of study. Int. J. Manag. Rev. 2018, 20, 32–61. [Google Scholar] [CrossRef]
  8. Zhang, D.; Morse, S.; Kambhampati, U. Sustainable Development and Corporate Social Responsibility; Routledge: London, UK, 2017; pp. 1–350. ISBN 9781317609322. [Google Scholar]
  9. Zhang, C.; Xu, J. Retesting the causality between energy consumption and GDP in China: Evidence from sectoral and regional analyses using dynamic panel data. Energy Econ. 2012, 34, 1782–1789. [Google Scholar] [CrossRef]
  10. Mardani, A.; Jusoh, A.; Nor, K.M.D.; Khalifah, Z.; Zakwan, N.; Valipour, A. Multiple criteria decision-making techniques and their applications—A review of the literature from 2000 to 2014. Econ. Res. 2015, 28, 516–571. [Google Scholar] [CrossRef]
  11. Yun, Y.; Nakayama, H. Generalized data envelopment analysis and computational intelligence in multiple criteria decision making. In Multicriteria Decision Aid and Artificial Intelligence: Links, Theory and Applications; Doumpos, M., Grigoroudis, E., Eds.; Wiley: Hoboken, NJ, USA, 2007; pp. 209–233. ISBN 9781119976394. [Google Scholar] [CrossRef]
  12. Nakayama, H.; Arakawa, M.; Yun, Y.B. Data envelopment analysis in multicriteria decision making. In Multiple Criteria Optimization: State of the Art Annotated Bibliographic Surveys; Gandibleux, X., Ed.; Springer: New York, NY, USA, 2002; pp. 333–368. [Google Scholar] [CrossRef]
  13. Alfaro, L.; Chanda, A.; Kalemli-Ozcan, S.; Sayek, S. FDI and economic growth: the role of local financial markets. J. Int. Econ. 2004, 64, 89–112. Available online: https://EconPapers.repec.org/RePEc:eee:inecon:v:64:y:2004:i:1:p:89-112 (accessed on 9 December 2018). [CrossRef]
  14. Statistical Commission Pertaining to the 2030 Agenda for Sustainable Development. Annex: Global Indicator Framework for the Sustainable Development Goals and Targets of the 2030 Agenda for Sustainable Development, Work of the Statistical Commission Pertaining to the 2030 Agenda for Sustainable Development. 2017, pp. 1–21. Available online: https://unstats.un.org/sdgs/indicators/Global Indicator Framework_A.RES.71.313 Annex.pdf (accessed on 19 December 2018).
  15. Saleh, D. FDI and Economic Growth in Developing Countries; A Cross-Comparison between Egypt and Turkey. In Proceedings of the EY International Congress on Economics II “Growth, Inequality, and Poverty”, Ankara, Turkey, 5–6 November 2015. [Google Scholar]
  16. Sun, L.; Fulginiti, L.E.; Chen, Y.C. Taiwanese industry competitiveness when outward FDI is defensive. J. Asian Econ. 2010, 21, 365–377. [Google Scholar] [CrossRef]
  17. Malik, K. Impact of foreign direct investment on economic growth of Pakistan. Am. J. Bus. Manag. 2015, 4, 190–202. [Google Scholar] [CrossRef]
  18. Awan, M.Z.; Khan, B.; Zaman, K. A Nexus between foreign direct investment & Pakistan’s economy. Int. Res. J. Financ. Econ. 2010, 52, 17–27. [Google Scholar]
  19. Saqib, D.; Masnoon, M.; Rafique, N. Impact of foreign direct investment on economic growth of Pakistan. Adv. Manag. Appl. Econ. 2013, 3, 35–45. [Google Scholar]
  20. Aghion, P.; Akcigit, U.; Howitt, P. What do we learn from Schumpeterian growth theory? In Handbook of Economic Growth; Elsevier: Amsterdam, The Netherlands, 2014; pp. 515–563. [Google Scholar]
  21. Hoque, N.; Rahman, A.; Molla, R.I.; Noman, A.H.M.; Bhuiyan, M.Z.H. Is corporate social responsibility pursuing pristine business goals for sustainable development? Corp. Soc. Respon. Environ. Manag. 2018, 25, 1130–1142. [Google Scholar] [CrossRef]
  22. Hopkins, M. CSR and international development. In CSR and Sustainability; Routledge: London, UK, 2017; pp. 88–108. [Google Scholar]
  23. Aaijaz, N.; Ibrahim, M.D. CSR inflections: An overview on CSR global strategies adopted by companies in Malaysia and other Asian countries. J. Southeast Asian Res. 2012, 1. [Google Scholar] [CrossRef]
  24. Gursoy, F.; Sekreter, A.; Kalyoncu, H. FDI and economic growth relationship based on cross-country comparison. Int. J. Econ. Financ. 2013, 3, 519–524. Available online: http://www.econjournals.com/index.php/ijefi/article/view/460/pdf (accessed on 7 December 2018).
  25. Argiro, M.; Dimitrios, K. FDI and Economic Growth: Causality for the EU and ASEAN. J. Econ. Integr. 2011, 26, 554–577. Available online: https://search-proquest-com.autorpa.lib.nkust.edu.tw/docview/898665564/?pq-origsite=primo (accessed on 7 December 2018).
  26. Sharmiladevi, J.C. Understanding the Impact of Inward FDI and Economic Growth. TSM Bus. Rev. 2017, 5, 52–59. [Google Scholar] [CrossRef]
  27. World Bank. Countries|Data. 2017. Available online: https://data.worldbank.org/ (accessed on 7 December 2018).
  28. Liu, S.; Lin, Y. Introduction to grey systems theory. In Understanding Complex Systems; Kelso, S.J.A., Ed.; Springer: Basel, Switzerland, 2018; Volume 127, pp. 1–399. [Google Scholar] [CrossRef]
  29. Zhou, J.J. The application of grey forecasting model based on excel modeling and solving in logistics demand forecast. In Proceedings of the 10th International Computer Conference on Wavelet Active Media Technology and Information Processing (ICCWAMTIP), Chengdu, China, 17–19 December 2013; pp. 362–365. [Google Scholar]
  30. Wang, C.N.; Le, T.M.; Nguyen, H.K. Application of Optimization to Select Contractors to Develop Strategies and Policies for the Development of Transport Infrastructure. Mathematics. 2019, 7, 98. [Google Scholar] [CrossRef]
  31. Malmquist, S. Index Numbers and Indifference Surfaces. Trabajos de Estadistica 1953, 4, 209–242. [Google Scholar] [CrossRef]
  32. Färe, R.; Grosskopf, S.; Lindgren, B.; Roos, P. Productivity Changes in Swedish Pharamacies 1980–1989: A Non-Parametric Malmquist Approach. J. Prod. Anal. 1992, 3, 85–101. [Google Scholar] [CrossRef]
  33. Shen, Y.; Hermans, E.; Ruan, D.; Vanhoof, K.; Brijs, T.; Wets, G. A DEA-Based Malmquist Productivity Index Approach in Assessing Road Safety Performance; World Scientific: Singapore, 2011; pp. 923–928. [Google Scholar] [CrossRef]
  34. Huang, J.; Chen, J.; Yin, Z. A network DEA model with super efficiency and undesirable outputs: An application to bank efficiency in China. Math. Probl. Eng. 2014, 2014. [Google Scholar] [CrossRef]
  35. Elsayed, A.; Shabaan, K.N. Evaluate and analysis efficiency of safaga port using DEA-CCR, BCC and SBM models-comparison with DP world sokhna. IOP Conf. Ser. Mater. Sci. Eng. 2017, 245. [Google Scholar] [CrossRef]
  36. Morita, H.; Hirokawa, K.; Zhu, J. A slack-based measure of efficiency in context-dependent data envelopment analysis. Omega 2005, 33, 357–362. [Google Scholar] [CrossRef]
  37. Tone, K. A slacks-based measure of efficiency in data envelopment analysis. Eur. J. Oper. Res. 2001, 130, 498–509. [Google Scholar] [CrossRef]
  38. Düzakın, E.; Düzakın, H. Measuring the performance of manufacturing firms with super slacks based model of data envelopment analysis: An application of 500 major industrial enterprises in. Eur. J. Oper. Res. 2007, 182, 1412–1432. [Google Scholar] [CrossRef]
  39. Tone, K. Continuous optimization A slacks-based measure of super-efficiency in data envelopment analysis. Eur. J. Oper. Res. 2002, 14, 32–41. [Google Scholar] [CrossRef]
  40. Ing, K.V. Using DEA Models to Measure Efficiency. Available online: https://www.nbs.sk/_img/Documents/BIATEC/BIA08_05/24_28.pdf (accessed on 10 December 2018).
  41. Tintin, C. The Impacts of FDI on Productivity and Economic Growth: A Comparative Perspective. Master’s Thesis, Department of Economics, School of Economics and Management, LUND University, Lund, Sweden, 2010. [Google Scholar]
  42. Afonso, A.; Ayadi, M.; Ramzi, S. Assessing Productivity Performance of Basic and Secondary Education in Tunisia: A Malmquist Analysis. ISEG Economics Working Paper No. 19/2013/DE/UECE. Available online: https://ssrn.com/abstract=2365003 (accessed on 10 December 2018).
  43. Wang, C.N.; Nguyen, H.K.; Liao, R.Y. Partner selection in supply chain of Vietnam’s textile and apparel industry: The application of a hybrid DEA and GM (1,1) approach. Math. Probl. Eng. 2017, 2017. [Google Scholar] [CrossRef]
  44. Bayoud, N.S.; Kavanagh, M.; Slaughter, G. Corporate social responsibility disclosure and employee commitment: Evidence from Libya. Int. J. Econ. Financ. 2012, 4, 37–50. [Google Scholar] [CrossRef]
  45. Elmogla, M.; Cowton, C.J.; Downs, Y. Corporate social reporting in Libya: a research note. Soc. Responsib. J. 2015, 11, 923–932. [Google Scholar] [CrossRef]
  46. Pattanamekar, P.; Kim, C.; Park, D.; Lee, K. Technical efficiency analysis of shippers using DEA. J. Adv. Transp. 2011, 4, 161–172. [Google Scholar] [CrossRef]
  47. Wang, C.N.; Lin, H.S.; Hsu, H.P.; Le, V.T.; Lin, T.F. Applying data envelopment analysis and grey model for the productivity evaluation of Vietnamese agroforestry industry. Sustainability 2016, 8, 1139. [Google Scholar] [CrossRef]
  48. Jayson, W.; Richardson, J.B.N.; Kevin, L.F. Unsystematic technology adoption in Cambodia: Students’ perceptions of computer and internet use. Int. J. Educ. Dev. Inf. Commun. Technol. 2014, 10, 63–76. [Google Scholar]
  49. Government of Cambodia. Cambodia Industrial Development Policy 2015–2025. Available online: http://www.mih.gov.kh/File/UploadedFiles/12_9_2016_4_29_43.pdf (accessed on 19 December 2018).
  50. Hanlon, R.J. Corporate Social Responsibility and Human Rights in Asia; Routledge: London, UK, 2014; pp. 1–212. ISBN 9781134503391. [Google Scholar]
Figure 1. Research framework.
Sustainability 11 02389 g001
Figure 2. Efficiency of the DMUs.
Sustainability 11 02389 g002
Figure 3. Graphical representation of catch-up effect.
Sustainability 11 02389 g003
Figure 4. Graphical representation of frontier shift.
Sustainability 11 02389 g004
Figure 5. Graphical representation of Malmquist productivity index.
Sustainability 11 02389 g005
Figure 6. Conceptual framework for decision makers from the data envelopment analysis (DEA) analysis.
Sustainability 11 02389 g006
Table 1. List of 20 developing countries as 20 decision-making units (DMUs).
NoDMUCountriesNoDMUCountries
1DMU1Argentina11DMU11Iraq
2DMU2Bangladesh12DMU12Kazakhstan
3DMU3Cambodia13DMU13Kenya
4DMU4Chad14DMU 14Libya
5DMU5China15DMU15Maldives
6DMU6Costa Rica16DMU16Myanmar
7DMU7Ghana17DMU17Nigeria
8DMU8Guatemala18DMU18Pakistan
9DMU9Guyana19DMU19Thailand
10DMU10Indonesia20DMU20Vietnam
Table 2. Descriptive analysis of inputs/outputs for 20 developing countries.
201220132014201520162017
Mean values
(I) FDI4.3002224.13373.2413173.7778463.813973.613895
(I) Exchange rate1895.3411968.242055.9312179.4022201.4252235.44
(I) CSR8.26 × 10139.04 × 10131.06 × 10141.09 × 10141.72 × 10141.46 × 1014
(O) GDP11.723954.6277843.2474183.7406743.6310445.528482
(O) GDPPC9.9985272.9153931.5693772.1019112.0284863.934829
Median Values
(I) FDI2.8122053.382.2977292.3882131.5442432.113612
(I) Exchange rate121.2538126.88129.8264147.6048155.6346155.9776
(I) CSR1.70 × 10121.7 × 10121.85 × 10121.87 × 10121.90 × 10121.32 × 1012
(O) GDP5.6531785.634.8406883.9885434.5948214.976562
(O) GDPPC4.6977574.152.9005152.5114853.1444853.648149
Standard deviation values
(I) FDI3.2127521743.0859672413.5493879232.6593366043.9510830162.674947
(I) Exchange rate4841.124594945.8316765112.5996425362.4537065392.71285856935436.77
(I) CSR2317802054318662.4951 × 10142.90871 × 10143.04179 × 10143.99725 × 10143.3488 × 1013
(O) GDP25.732473114.5328248746.739451033.3687205583.9941746524.016798263
(O) GDPPC26.074150554.1548843216.4098690733.3427675734.0706377344.975242728
Table 3. Correlation results in 2012.
2012FDIExchange RateNFAGDPGDPPC
FDI10.1144522310.1019483930.1783355120.175836882
Exchange rate0.11445223110.7508146820.0870617260.080994309
NFA0.1019483930.75081468210.0753976650.070300221
GDP0.1783355120.0870617260.07539766510.999313151
GDPPC0.1758368820.0809943090.0703002210.9993131511
Table 4. Comparing the productivity among DMUs.
DMUScoreRank
Argentina6.6918185
Bangladesh3.1831239
Cambodia0.94216617
Chad3.5831698
China5.9570266
Costa Rica1.24166914
Ghana19.004782
Guatemala2.34198910
Guyana1.45340112
Indonesia0.96271916
Iraq14.771373
Kazakhstan0.29290120
Kenya11.072974
Libya890.50831
Maldives5.3617317
Myanmar1.44330713
Nigeria1.70351811
Pakistan115
Thailand0.84799818
Vietnam0.30826419
Table 5. Average mean absolute percentage error (MAPE) value of 20 DMUs comparing the productivity among DMUs.
DMUCountryAverage MAPE %
DMU1Argentina28.41%
DMU2Bangladesh4.36%
DMU3Cambodia9.45%
DMU4Chad3.66%
DMU5China3.13%
DMU6Costa Rica1.69%
DMU7Ghana7.31%
DMU8Guatemala4.41%
DMU9Guyana10.87%
DMU10Indonesia4.82%
DMU11Iraq19.97%
DMU12Kazakhstan5.56%
DMU13Kenya7.75%
DMU14Libya4.09%
DMU15Maldives21.2%
DMU16Myanmar1.91%
DMU17Nigeria2.67%
DMU18Pakistan4.13%
DMU19Thailand11.01%
DMU20Vietnam7.83%
Average of 15 DMUs8.21%
Table 6. Predicted values of 2018 by Grey forecasting.
DMUsInputsOutputs
FDIExchange RateCSRGPDGDPPC
Argentina1.6225976.8261874.2243918595.5252894.874841
Bangladesh1.37889578.8885540.1337236759.5111449.82243
Cambodia11.29974041.3752026.3373493033.8562530.097
Chad4.993812522.6079263.8008603393.2044328.5026
China2.431336.2197534.3255416975.2726484.799095
Costa Rica5.848197518.8878262.3680064390.6279326.498
Ghana7.9805942.5794175.2800055713.9297114.604858
Guatemala2.1119447.7693674.9406554296.3550115.647833
Guyana5.881685205.6754105.7785508155.727130.7528
Indonesia2.0931811275.625638.8582658457.2417048.05
Iraq1.5431561166.375583.9590779875.167729.5631
Kazakhstan5.947617175.540490.74401663133.1422111.9431
Kenya1.52636989.1882745.3573218467.272856.31506
Libya1.38791.2967411.3423203231.3195311.330925
Maldives9.22338215.3695712.2964749713.8330213.06475
Myanmar4.263292930.2962467.2797648698.788583.0339
Nigeria1.036572166.450983.74373935125.0973104.4205
Pakistan0.64315699.7233650.1832598874.9533162.56829
Thailand2.24506932.1341517.1896105824.6618820.92575
Vietnam5.55069221151.7510578.6483715865.213221.92
Table 7. Predicted values of 2019 by Grey forecasting.
DMUsInputsOutputs
FDIExchange RateCSRGPDGDPPC
Argentina1.1757028.0448837.06 × 10112.3432332.558359
Bangladesh1.32365178.158961.87 × 10127.1988376.013214
Cambodia10.383074048.8752.34 × 10136.8839095.267612
Chad5.4214536.15751.30 × 10124.6046498.314397
China2.1035626.1968928.99 × 10126.86.168845
Costa Rica5.665175530.59038.12 × 10113.6740832.865371
Ghana8.4324253.0490729.94 × 10106.114532.60775
Guatemala1.8463927.7188051.03 × 10152.9264090.967754
Guyana4.329658206.20821.58 × 10113.12042.587685
Indonesia1.86825412176.753.38 × 10145.050483.864745
Iraq1.3231021166.5693.40 × 10135.8900446.707532
Kazakhstan6.315246192.15352.77 × 10132.550.894517
Kenya0.95306691.762961.92 × 10115.3773192.962332
Libya1.3757681.3167845.90 × 101014.735679.036705
Maldives9.08919715.37216.25 × 10127.4958074.553891
Myanmar5.1167351025.7529.85 × 10126.1204115.031326
Nigeria0.856286172.48133.36 × 10121.2157063.562975
Pakistan0.752147101.1976−2.70 × 10105.6136793.492789
Thailand1.39650432.95395.90 × 10123.5928293.140663
Vietnam5.72841121332.441.03 × 10156.5115295.249353
Table 8. Predicted values of 2020 by Grey forecasting.
DMUsInputsOutputs
FDIExchange RateCSRGPDGDPPC
Argentina1.2376978.76117.06 × 10102.34792.559
Bangladesh1.59882178.45221.85 × 10147.1996.01356
Cambodia11.167024049.2122.34 × 10126.8879015.2689
Chad5.378105538.1291.30 × 10104.607218.3191
China1.9877626.100867.19 × 10126.91346.16972
Costa Rica5.436101530.98778.89 × 10133.675192.8695
Ghana7.2290533.046799.21 × 10106.115142.6021
Guatemala1.1279967.98571.27 × 10142.927930.9645
Guyana4.447296206.34911.65 × 10103.12382.5878
Indonesia1.67342712177.793.76 × 10125.051213.8656
Iraq1.5911051166.9693.90 × 10105.8900616.70219
Kazakhstan7.269014193.0722.17 × 10152.590.89912
Kenya1.55247991.79261.19 × 10125.3790212.9976
Libya1.9769211.90285.61 × 101114.731469.03678
Maldives10.2781916.04716.44 × 10127.4978094.554221
Myanmar5.9689451025.8739.67 × 10116.1209215.0391
Nigeria1.529017172.49013.31 × 10111.2199013.5645
Pakistan0.862964102.017−2.30 × 10115.611893.49347
Thailand1.98857132.9565.40 × 10133.5967793.1408
Vietnam6.1979221332.621.09 × 10146.5142925.24978
Table 9. Efficiency score of 20 developing countries (super slacks-based measure of efficiency (SBM) model).
DMU201220132014201520162017Rank
Argentina0.0133040.1487640.0781330.37546810.0908735
Bangladesh0.0775820.2730660.0217210.93750610.1261719
Cambodia0.0079160.0471650.0035110.1298820.08040.47132117
Chad0.0267820.1195010.0697740.2972870.8245020.1277368
China0.0394080.2018730.0629780.86668110.8896676
Costa Rica0.0116860.0277490.0086490.1375550.1747180.5222514
Ghana111110.4255872
Guatemala0.0893210.6055620.488747110.00005910
Guyana0.0363380.2478450.1124850.25409410.26548112
Indonesia0.03690.1716440.008990.364070.3376040.01606216
Iraq0.12630.2738630.0062610.32926810.2782593
Kazakhstan0.010340.1117580.0065180.0669460.0246280.00313120
Kenya0.0235220.228130.0597381114
Libya1111111
Maldives0.3594160.61560910.63455910.031797
Myanmar0.0465720.1774960.0121760.2099370.1643930.02141113
Nigeria0.0394350.3935160.039050.5151010.6538260.0911411
Pakistan0.1294820.6009430.03096510.7560630.26842215
Thailand0.0315520.0558580.0040810.3437570.7938460.06580918
Vietnam0.0138110.0821970.0061320.2070330.1225570.00021719
Table 10. Catch-up effect of 20 developing countries.
Catch-up2012–20132013–20142014–20152015–20162016-2017Average
Argentina1.4802840160.4717671.9637340151.0794064741.021.248798
Bangladesh1.3611888021111.121.090297
Cambodia6.5841002970.7775745.5636994670.0863278270.78345673.252925
Chad1.6284711961.7406120.4383334562.2813681832.2813681831.522196
China1.6547220511111.163681
Costa Rica0.6567152331.5480911.1505213451.0947450771.01687641.112518
Ghana111111
Guatemala1.00000954511111.000002
Guyana3.0842797710.7156981.777166107111.644286
Indonesia3.2185662330.1247625.477045081.3312585181.17898672.537908
Iraq3.1118954850.05246.459674882.9543254412.7687479083.144574
Kazakhstan2.2400788260.7019630.9676157060.2030861770.2046798091.028186
Kenya1.66000664511111.165002
Libya0.9999910.9999999611.0000002371.0334579010.999998
Maldives0.6182672691.6174380.9999912521.0000087491.8790798731.058926
Myanmar5.06296747310.9999999990.1662746090.1387965751.807311
Nigeria2.19130589710.918686770.5485263840.5678899351.16463
Pakistan1.00000896110.7973716880.7257901880.949345
Thailand1.0351132790.6241792.4175834311.3475539291.3579092361.356107
Vietnam3.7093863650.726621.3588359280.4388020310.4457292031.558411
Average2.1648678670.9050551.874644371.0164527661.0613083881.490255
Max6.5841002971.7406126.459674882.9543254412.7687479083.252925
Min0.6182672690.05240.4383334560.0863278270.1387965750.949345
SD1.5637480530.4247581.7680816660.6659572760.6459361270.695167
Table 11. Frontier shift of 20 developing countries.
Frontier2012–20132013–20142014–20152015–20162016–2017Average
Argentina1.0337291.5359750.4774821.2956421.3457681.085707
Bangladesh0.4218191.0527221.6037031.019531.035751.024443
Cambodia0.1655621.2054630.1837737.318187.457692.218245
Chad0.4963041.1147490.9962170.9692050.9754540.894119
China0.0701361.0639081.0498620.2202870.3590560.601048
Costa Rica1.0015470.9819161.04421.3209231.4940771.087146
Ghana1.1230620.0644460.5684730.8681660.9875560.656037
Guatemala0.9791011.2709480.9163750.6896630.7447340.964021
Guyana0.4280750.8201610.3182351.7704531.8765480.834231
Indonesia0.2604873.9076610.1814142.7625861.2357961.778037
Iraq0.2511572.3533150.3201091.0700471.0674350.998657
Kazakhstan0.636861.1016010.5356421.8503571.946391.031115
Kenya0.8025790.92521.2519741.4153661.5639461.09878
Libya1.2701062.9034080.2711991.2489311.4035361.423411
Maldives1.0671611.7831571.02221411.7929811.467443.916378
Myanmar0.1395911.0054680.6936921.2121071.4537840.762715
Nigeria0.6628731.700560.587351.0825911.0974561.008344
Pakistan1.0769150.8305241.0959161.1912761.3299761.048658
Thailand0.3201811.7196470.472051.3571391.4639360.967254
Vietnam0.2857442.0786990.8623911.9230621.6763451.287474
Average0.6246491.4709760.7226142.1189242.1576381.234291
Max1.2701063.9076611.60370311.7929811.467443.916378
Min0.0701360.0644460.1814140.2202870.3590560.601048
SD0.388190.847090.3934582.6951432.685870.731341
Table 12. Catch-up effect of 20 developing countries.
Malmquist2012–20132013–20142014–20152015–20162016–2017Average
Argentina1.5302130.7246230.9376481.3985241.3568941.147752
Bangladesh0.5741751.0527221.6037031.019531.0253871.062533
Cambodia1.090080.9373361.022460.6317630.7353830.92041
Chad0.8082171.9403460.4366752.2111132.1907651.349088
China0.1160561.0639081.0498620.2202870.3476390.612528
Costa Rica0.6577311.5200961.2013741.4460731.9575941.206319
Ghana1.1230620.0644460.5684730.8681660.9262860.656037
Guatemala0.979111.2709480.9163750.6896630.7392650.964024
Guyana1.3203040.5869870.5655561.7704531.7935491.060825
Indonesia0.8383960.4875260.9936113.6777163.0575951.499312
Iraq0.7815740.1233142.0677983.1612683.9467441.533488
Kazakhstan1.4266170.7732840.5182960.3757820.6487440.773495
Kenya1.3322860.92521.2519741.4153661.8794391.231206
Libya1.2700942.9034080.2711991.2489311.6537391.423408
Maldives0.6597912.8841461.02220511.7930811.793034.089806
Myanmar0.7067441.0054680.6936920.2015430.3729260.651862
Nigeria1.4525571.700560.5395910.593830.6847351.071634
Pakistan1.0769250.8305241.0959160.949891.0474350.988314
Thailand0.3314241.0733671.1412211.8288181.9436741.093707
Vietnam1.0599361.5104251.1718470.8438430.9015271.146513
Average0.9567641.1689320.9534741.8172822.0140511.224113
Max1.5302132.9034082.06779811.7930811.793034.089806
Min0.1160560.0644460.2711990.2015430.3476390.612528
SD0.3831230.755210.4230072.5171952.5405570.725004

