Article

Right-Sizing Cities for Maximum Power: Urban Form Parameters for New York City and the Greater Philadelphia Region

1
School of Architecture, University of Ulsan, Ulsan 44610, Korea
2
Department of Architecture, University of Pennsylvania, Philadelphia, PA 19104, USA
*
Author to whom correspondence should be addressed.
Sustainability 2019, 11(8), 2352; https://doi.org/10.3390/su11082352
Submission received: 29 March 2019 / Revised: 14 April 2019 / Accepted: 17 April 2019 / Published: 19 April 2019
(This article belongs to the Special Issue Architectural Theory for Sustainable Urban Design)

Abstract

:
This paper examines the urban form parameters in theories and ideas related to the urbanizing world. Adopting emergy (spelled with an “m”) synthesis, we studied New York City and the Greater Philadelphia region to determine the appropriate urban form, including building height, development density, bulkiness, and transportation. The European and North American mid-rise urban block is an effective settlement type for reducing per capita emergy in construction and building operations. Buildings over 40 stories with a development density exceeding a floor area ratio of 5 tend to show higher emergy investments per person. Large and bulky buildings with low surface-area-to-volume ratios that reside on the periphery of cities consume a significant amount of energy due to conditioning building space and the increased transportation needs for commuters.

1. Introduction: Rethinking Efficiency

Efficiency was an identified goal in almost all aspects of industry, society, and lifestyle during the twentieth century. The fields of urban planning and architecture were no exception. City building practice during the last century focused on increasing the speed of construction while reducing costs. Consequently, city builders invested less in the quality of construction, place-making, and the reduction of energy use. As a result, contemporary cities have suffered from an excessive emphasis on efficiency. Streets have become racetracks for automobiles rather than social places. Housing is considered to be a commodity rather than a home for families.
Fortunately, a group of scholars have challenged the wisdom of making efficiency the ultimate priority in the decision-making process. Odum and Pinkerton [1] revealed that a natural or man-made system never runs at its highest efficiency, or the fastest rate of energy invested. Rather, a system is organized to maximize power, or the rate of work being done. For example, people rarely drive their cars at 6000 rpm to grocery stores. Even Formula 1 racers try to stay under 2000 rpm for better fuel economy. However, we have treated the urbanizing process as a car race. We took out our seats and other amenities, added a rear-spoiler for better speed, and guzzled nitro-power fuel at the maximum rpm. Our Formula 1 cities have resulted in rising coastal lines, air pollution, lack of life and vibrancy in urban places, engineered and underused public spaces, zoning exclusions, and many other urban problems. Therefore, our faith in efficiency, especially with regard to the urbanizing process, must be revisited.
The maximum power principle has the potential to be an alternate guide to assess the sustainability of an ecosystem, replacing efficiency [2]. Furthermore, reducing the consumption of energy and resources while maintaining or improving the current lifestyle is one of the immediate goals of healthy urbanization. In this study we explore emergy indices, including emergy intensity per land (ED) and per capita (EC), in order to identify urban forms that can maximize power, facilitate economic growth, and house people effectively in the process of urbanization. After presenting an emergy synthesis of 5 boroughs in New York City and 9 counties of the Delaware Valley Regional Planning Commission, we analyze the results and vet them against the predominant theories in urban form discussions, including high-rise buildings, high-density development, compact cities, and volume-to-surface ratio.

2. Literature Review

2.1. Urban Form Research

Urban form represents the spatial characteristics of human settlement, including land use patterns, transportation systems, and urban design [3] (pp. 152,153). Land use includes the intensity of development or density, as well as the kinds of activities within (for example, residential, commercial, industrial, and institutional). The network of roads and modes of travel are the two major components of a transportation system. The road network has been expanded to facilitate streetcars, trains, and automobiles in cities, with the necessary changes in urban form being made as the transport technologies have advanced over time [4] (p. 171). Unlike the other two characteristics, urban design governs a smaller scale of urban form, specifically the arrangement of buildings, roads, and parks at the neighborhood level.
The components of urban form are highly associated with each other. A compact urban area can minimize transportation energy by reducing travel distance [5,6,7]. Mixing different land uses can reduce the number of trips and transport energy consumption in turn [8,9]. A strong city center of high density can make cities more efficient when they are supported by an effective public transit system [10] (p. 33), [11]. More people walk in a walkable district, where streets are designed to human scale and building edges are transparent to attract a pedestrian’s attention [12,13,14].
In the search for an efficient or sustainable urban form, two large groups of researchers have conquered their own territories. First, a group of transportation researchers investigated the relationship between land use and transportation systems. Transportation scholars have investigated primarily how to reduce gasoline consumption by reducing travel distance [8,9], encouraging non-motorized trips [15,16], increasing development density [10,11,17], and adopting mass transportation systems [10]. A second group of researchers was more concerned with the energy used on the individual building level by configuring building arrangements, building in bulk, and building environment systems. The heating and cooling load of buildings can be greatly reduced by adjusting the location, orientation, floor plan, and landscape [18,19]. The building design parameters, including the exposed surface area, width-to-height ratio, and albedo of a building’s color, can improve the urban microclimate and reduce energy use for a building’s climate control system [20] (p. 43), [21,22].
The two groups have covered the premise of urban form research, however, they did not provide a comprehensive perspective on land use, transportation, and urban design because the units of measurements were inconsistent among the disciplines. For example, the unit used for transportation research was vehicle miles traveled, whereas the building researchers used British thermal units or kilowatts per hour to measure the thermal load or rate of energy consumption in buildings. Thus, the differences in the units of analysis make it difficult to bridge the two disciplines.
Fortunately, another group of researchers comprehensively explored urban form from transportation and urban design perspectives. Peter Calthorpe (1993) [23] compared the energy reduction in a passive house and the required energy to travel from a city workplace to a rural home; he concluded that the transportation mode and travel distance are as critical as the building type and density of development. Thus, a compact development serviced by a public transport system (known as transit-oriented development) is the urban form that can save the most energy. Calthorpe and other New Urbanists tried to understand the dynamics of urban form more comprehensively, but they relied on qualitative and historical evidence. Quantitative research could help urban scholars to identify urban form parameters and pinpoint the most sustainable urban form for the era of climate change.

2.2. Emergy Research on the Built Environment

To overcome the challenges of comprehensively studying urban form, we can adopt emergy (spelled with an “m”) analysis as a research method. Emergy study is a unique accounting method that directly compares different forms of energy, materials, and services [24,25]. Emergy is an accumulation of all energy spent in the process from raw material or initial state to reaching the final product or state. It is a comprehensive concept for understanding life cycles and is even more inclusive than life cycle analysis (LCA) [22]. Emergy analysis uses the solar emjoule (seJ) as a common unit. After exploring different baselines from coal and other fossil fuels, Odum and early systems ecologists adopted solar as their basis because the sun is the most constant source of energy [26]. Due to its versatility and unit compatibility, researchers have applied the emergy method to architecture, urban planning, economics, anthropology, energy, and other social sciences.
Emergy researchers have developed a series of projects that maneuver different scales to understand how human settlement works. From small to large, researchers have evaluated various building types in different regions. The residential buildings that have been evaluated in emergy terms range from single-family housing to apartment buildings [27,28]. Emergy investments in the construction and operation of an experimental building were estimated in Switzerland [29]. The overall emergy values of buildings in Manhattan were computed using property tax data and building construction estimates [30]. The Greater Philadelphia region also was comprehensively investigated to understand how a constellation of towns and cities work together [31].

2.3. Empower Density and Emergy Per Capita

As described previously, efficiency cannot aptly capture how sustainable cities grow because it represents the rate of energy consumption rather than the amount of work being done per unit of energy. Contradictorily, high efficiency is the lavish use of energy in the urbanization process, which should be avoided. Therefore, a better indicator is necessary to measure the growth of cities.
Emergy indices have the potential to replace efficiency by providing insights into the lifestyles of citizens. Based on Odum and Pinkerton’s [1] findings, Odum and his colleagues developed several emergy indicators, including empower density (ED, seJ/yr/m2), emergy per capita (EC, seJ/yr/person), emergy yield ratio (EYR), emergy index of sustainability (ESI), and others [32,33]. Empower density and emergy per capita measure the amount of emergy invested per unit per year. ED uses land area (1 m2) and EC uses the individual as denominators. These two indicators help us to understand what parts of a city are over- or under-invested in emergy, or which social classes or neighborhoods suffer from a lack of resources or enjoy a surplus of emergy. The emergy yield ratio and emergy index of sustainability identify where emergy comes from (local or imported emergy). The EYR measures a local system’s ability to produce a final product by comparing local and imported emergy. The ESI compares the amount of existing local renewable emergy to the amount of imported emergy.
Among the many emergy indices, ED and EC provide an intuitive understanding of how cities work. ED measures the total amount of emergy invested on 1 m2 of land in a year (seJ/yr/m2). Generally, ED is higher in the city center and lower in rural areas as it corresponds to development density as a floor area ratio (FAR). EC differs from ED, however, in that it uses the number of people in census tracts as its denominator (seJ/yr/person). EC tracks resources and energy spent per person. More affluent residents tend to show higher per capita emergy than less affluent residents, and urban residents typically show a higher intensity of emergy than rural residents.
We can use both empower density and emergy per capita as a reference for a cross-sectional case study. By comparing ED and EC for multiple cities, we can assess the level of emergy investment in the unit area or per capita. By comparing the ED and EC of San Juan [32], Taipei [34], Macao [35], and Rome [36], we can understand the hierarchy and characteristics of these cities. For example, Rome used three times more emergy per capita than Taipei and Rome’s ED appeared to be twice as large. The difference can be attributed to the industry structure: Taipei relies on manufacturing, whereas Rome requires more information and services, which results in higher emergy intensity.

3. Materials and Methods

We adopted emergy synthesis as our primary method because the available data uses different units, including kilowatts (kW) for electricity, British thermal units (BTU) for heating and cooling energy, weights (kg, ton, and lb) for building materials and fuels, and currency ($) for taxes. As discussed in Section 2.2, emergy is versatile unit dealing with incompatible units. We gathered data from a number of sources and converted the data into emergy terms (seJ/yr) to understand the dynamics of urban form comprehensively.
We computed and analyzed the emergy synthesis of New York City and the Greater Philadelphia region to identify the most effective urban form. Instead of a conventional emergy analysis, which identifies material sources and energy inputs and outputs from the top down, we used a bottom-up approach with various sources of data, including individual property tax data, building GIS data, RSMeans square foot cost data, the American Community Survey, the Comprehensive Annual Financial Report, and a transportation survey. We mathematically reconstructed individual buildings using the square-foot-cost estimation technique and synthesized emergy at the building level with the available demographic and financial data, following a previous research method [30,31].
The scope of study included 5 boroughs of New York City and 9 counties of the Delaware Valley Regional Planning Commission. We identified the energy and material sources, kinds of processes, consumers, and interactions among them, as seen in Figure 1. The total building materials and energy spent were estimated using two data sources. Building bulk was quantified using property tax data from municipal governments. Building bulk was divided out as building components, including foundation, columns, beams and girders, slabs, exterior walls, and windows. The interior was based on RSMeans construction cost estimation. The demographics of residents, such as household income and number of residents, were approximated from the 2010 United States Census and the American Community Survey. Public services provided by local governments were calculated from the Comprehensive Annual Financial Report, which summarizes revenues and expenses. From the municipal governments’ financial data, we were able to estimate how much tax money was spent by tax items. Transportation energy consumption was calculated from the Census Transportation Planning Products, which surveys modes of travel and travel distances for commutes and non-commutes. Public infrastructure was estimated using GIS data, which reports the widths and types of roads and sidewalk information, as well as the locations of traffic signals, fire hydrants, manholes, sewer pipes, and water mains. Similar to building material quantity estimation, RSMeans infrastructure data were used to calculate the quantity of infrastructure material.
A total of 3,101,261 buildings in 3547 census tracts were analyzed, including 1,101,623 buildings in 2168 tracts in New York City and 1,999,638 buildings in 1379 tracts in the Greater Philadelphia region (see Figure 2). Table 1 shows the typical calculation formulae for tract 12 in Trenton, New Jersey. Emergy synthesis was performed for three entities: Residential, non-residential, and government. This was because this division helped to track inputs and outputs more effectively and avoided double counting.

4. Findings and Discussion

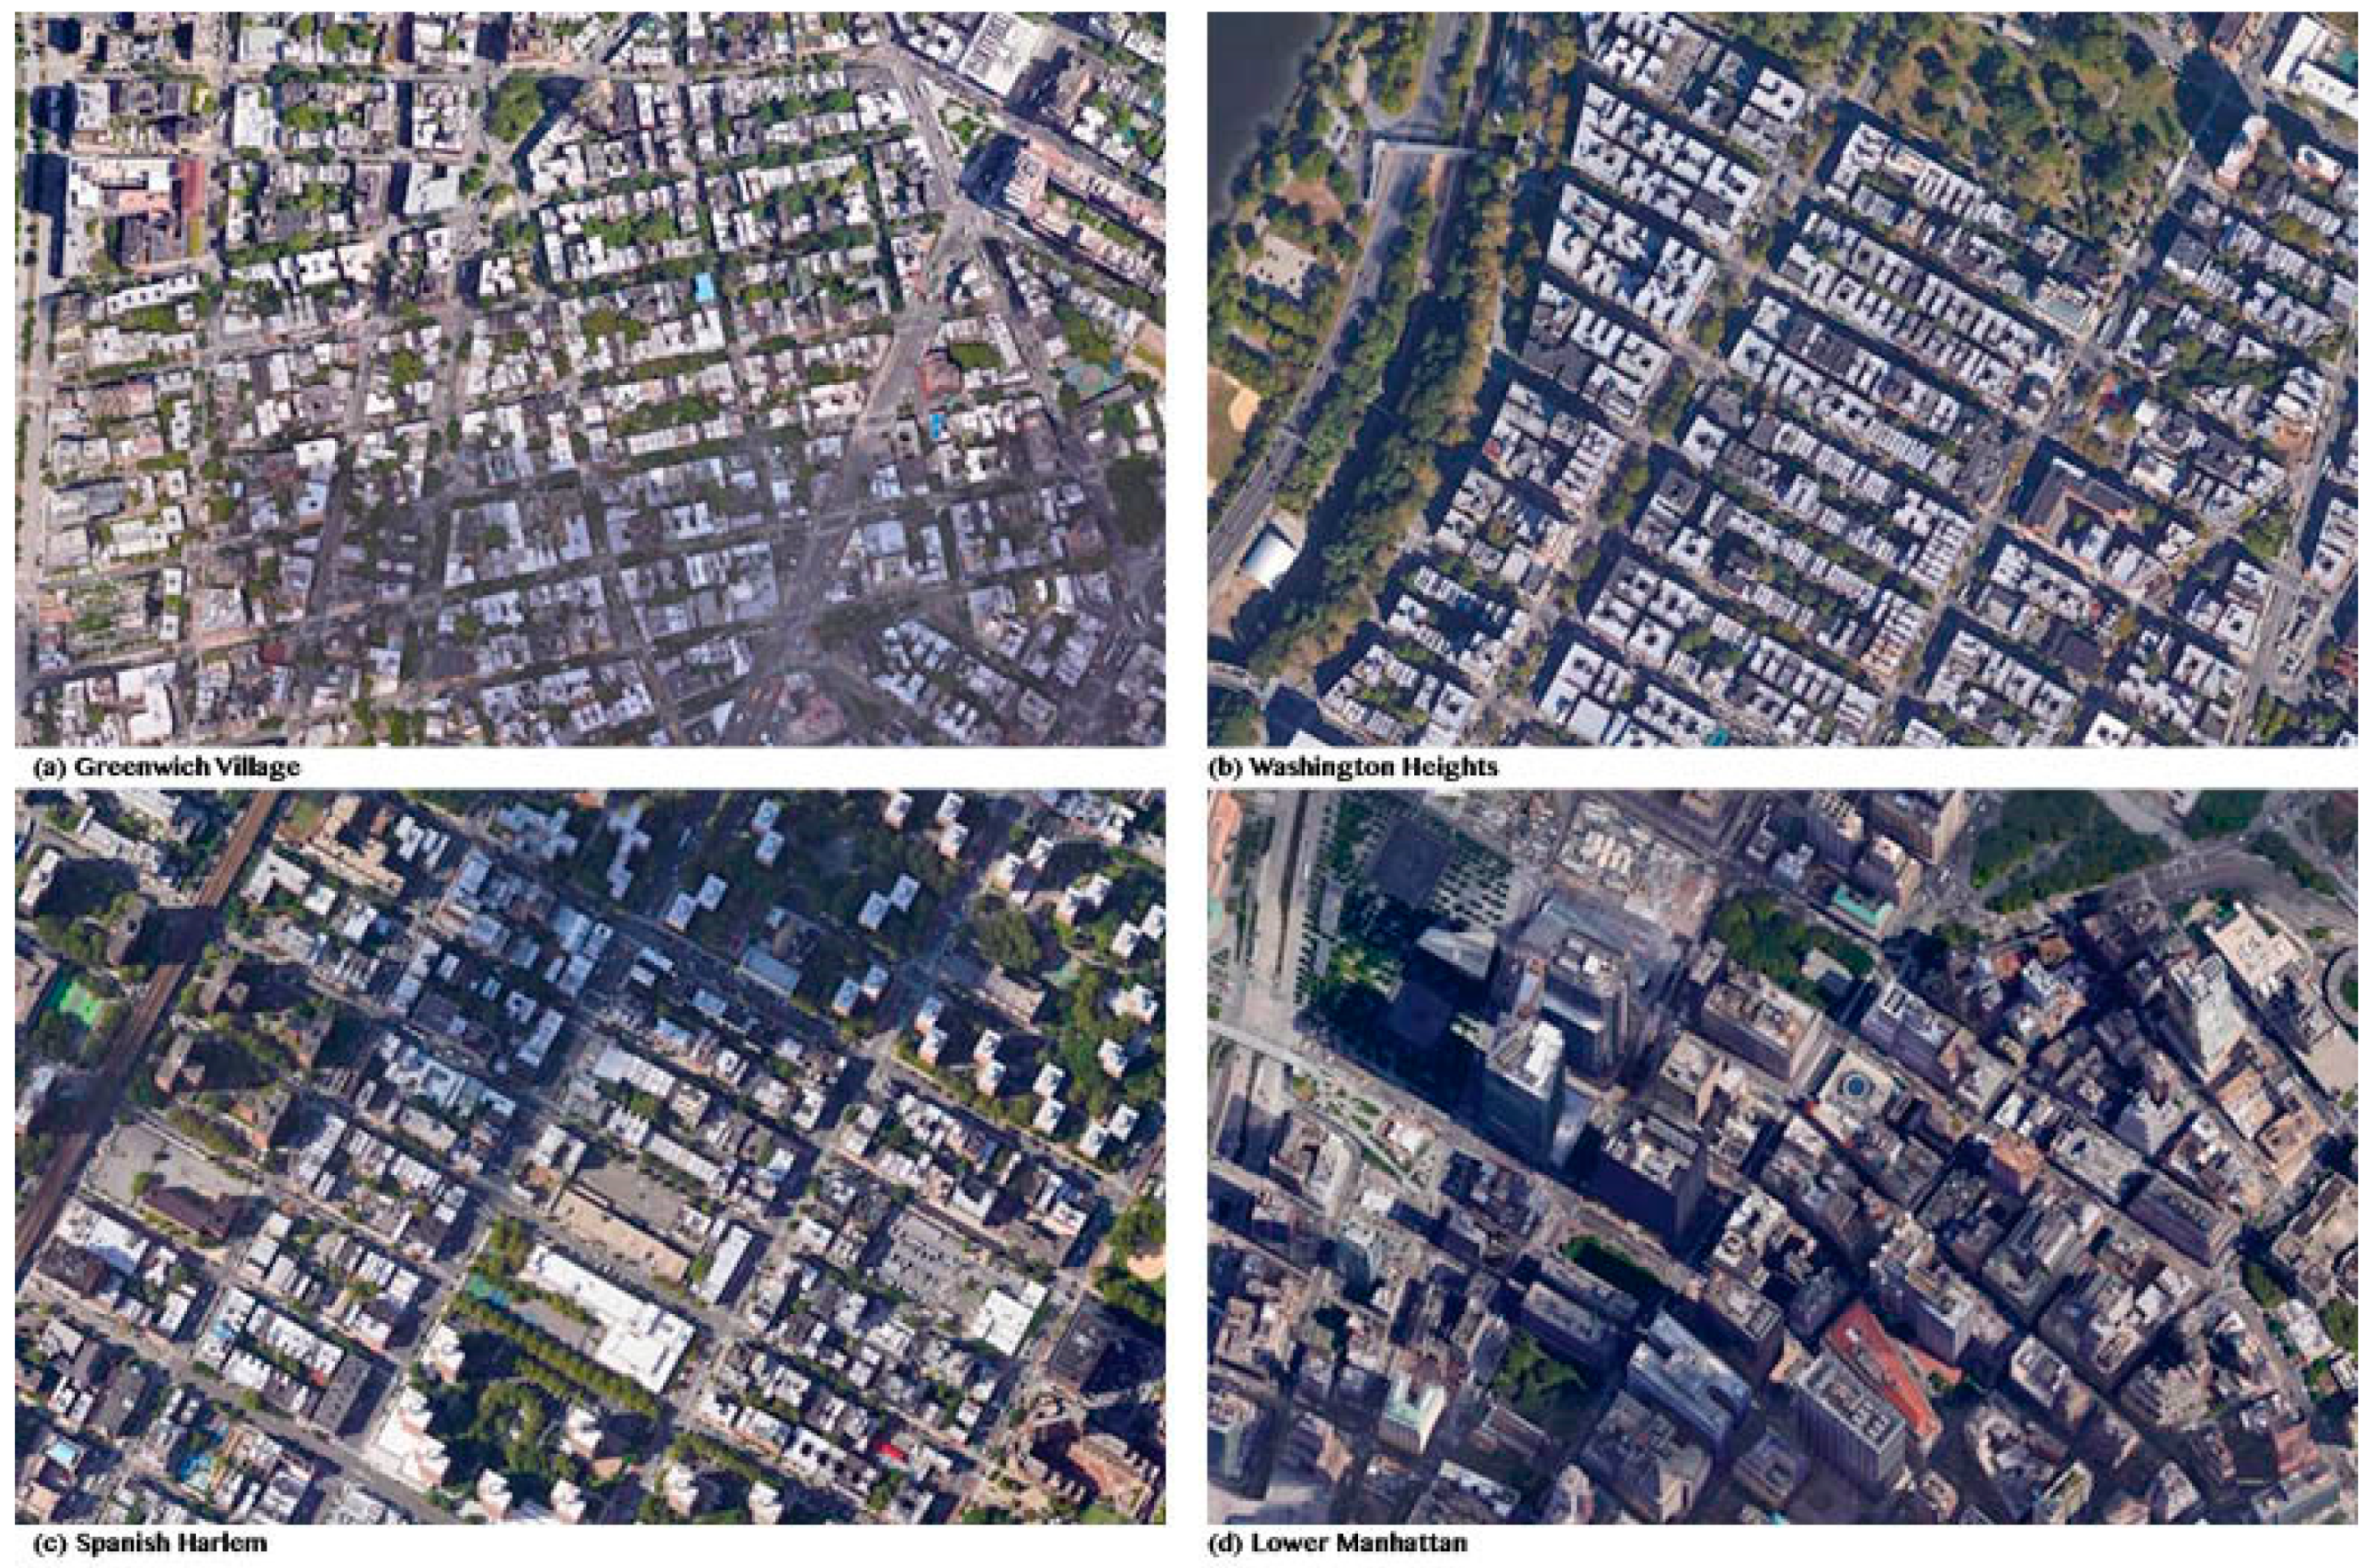
4.1. High-Rise Buildings and High-Density Development
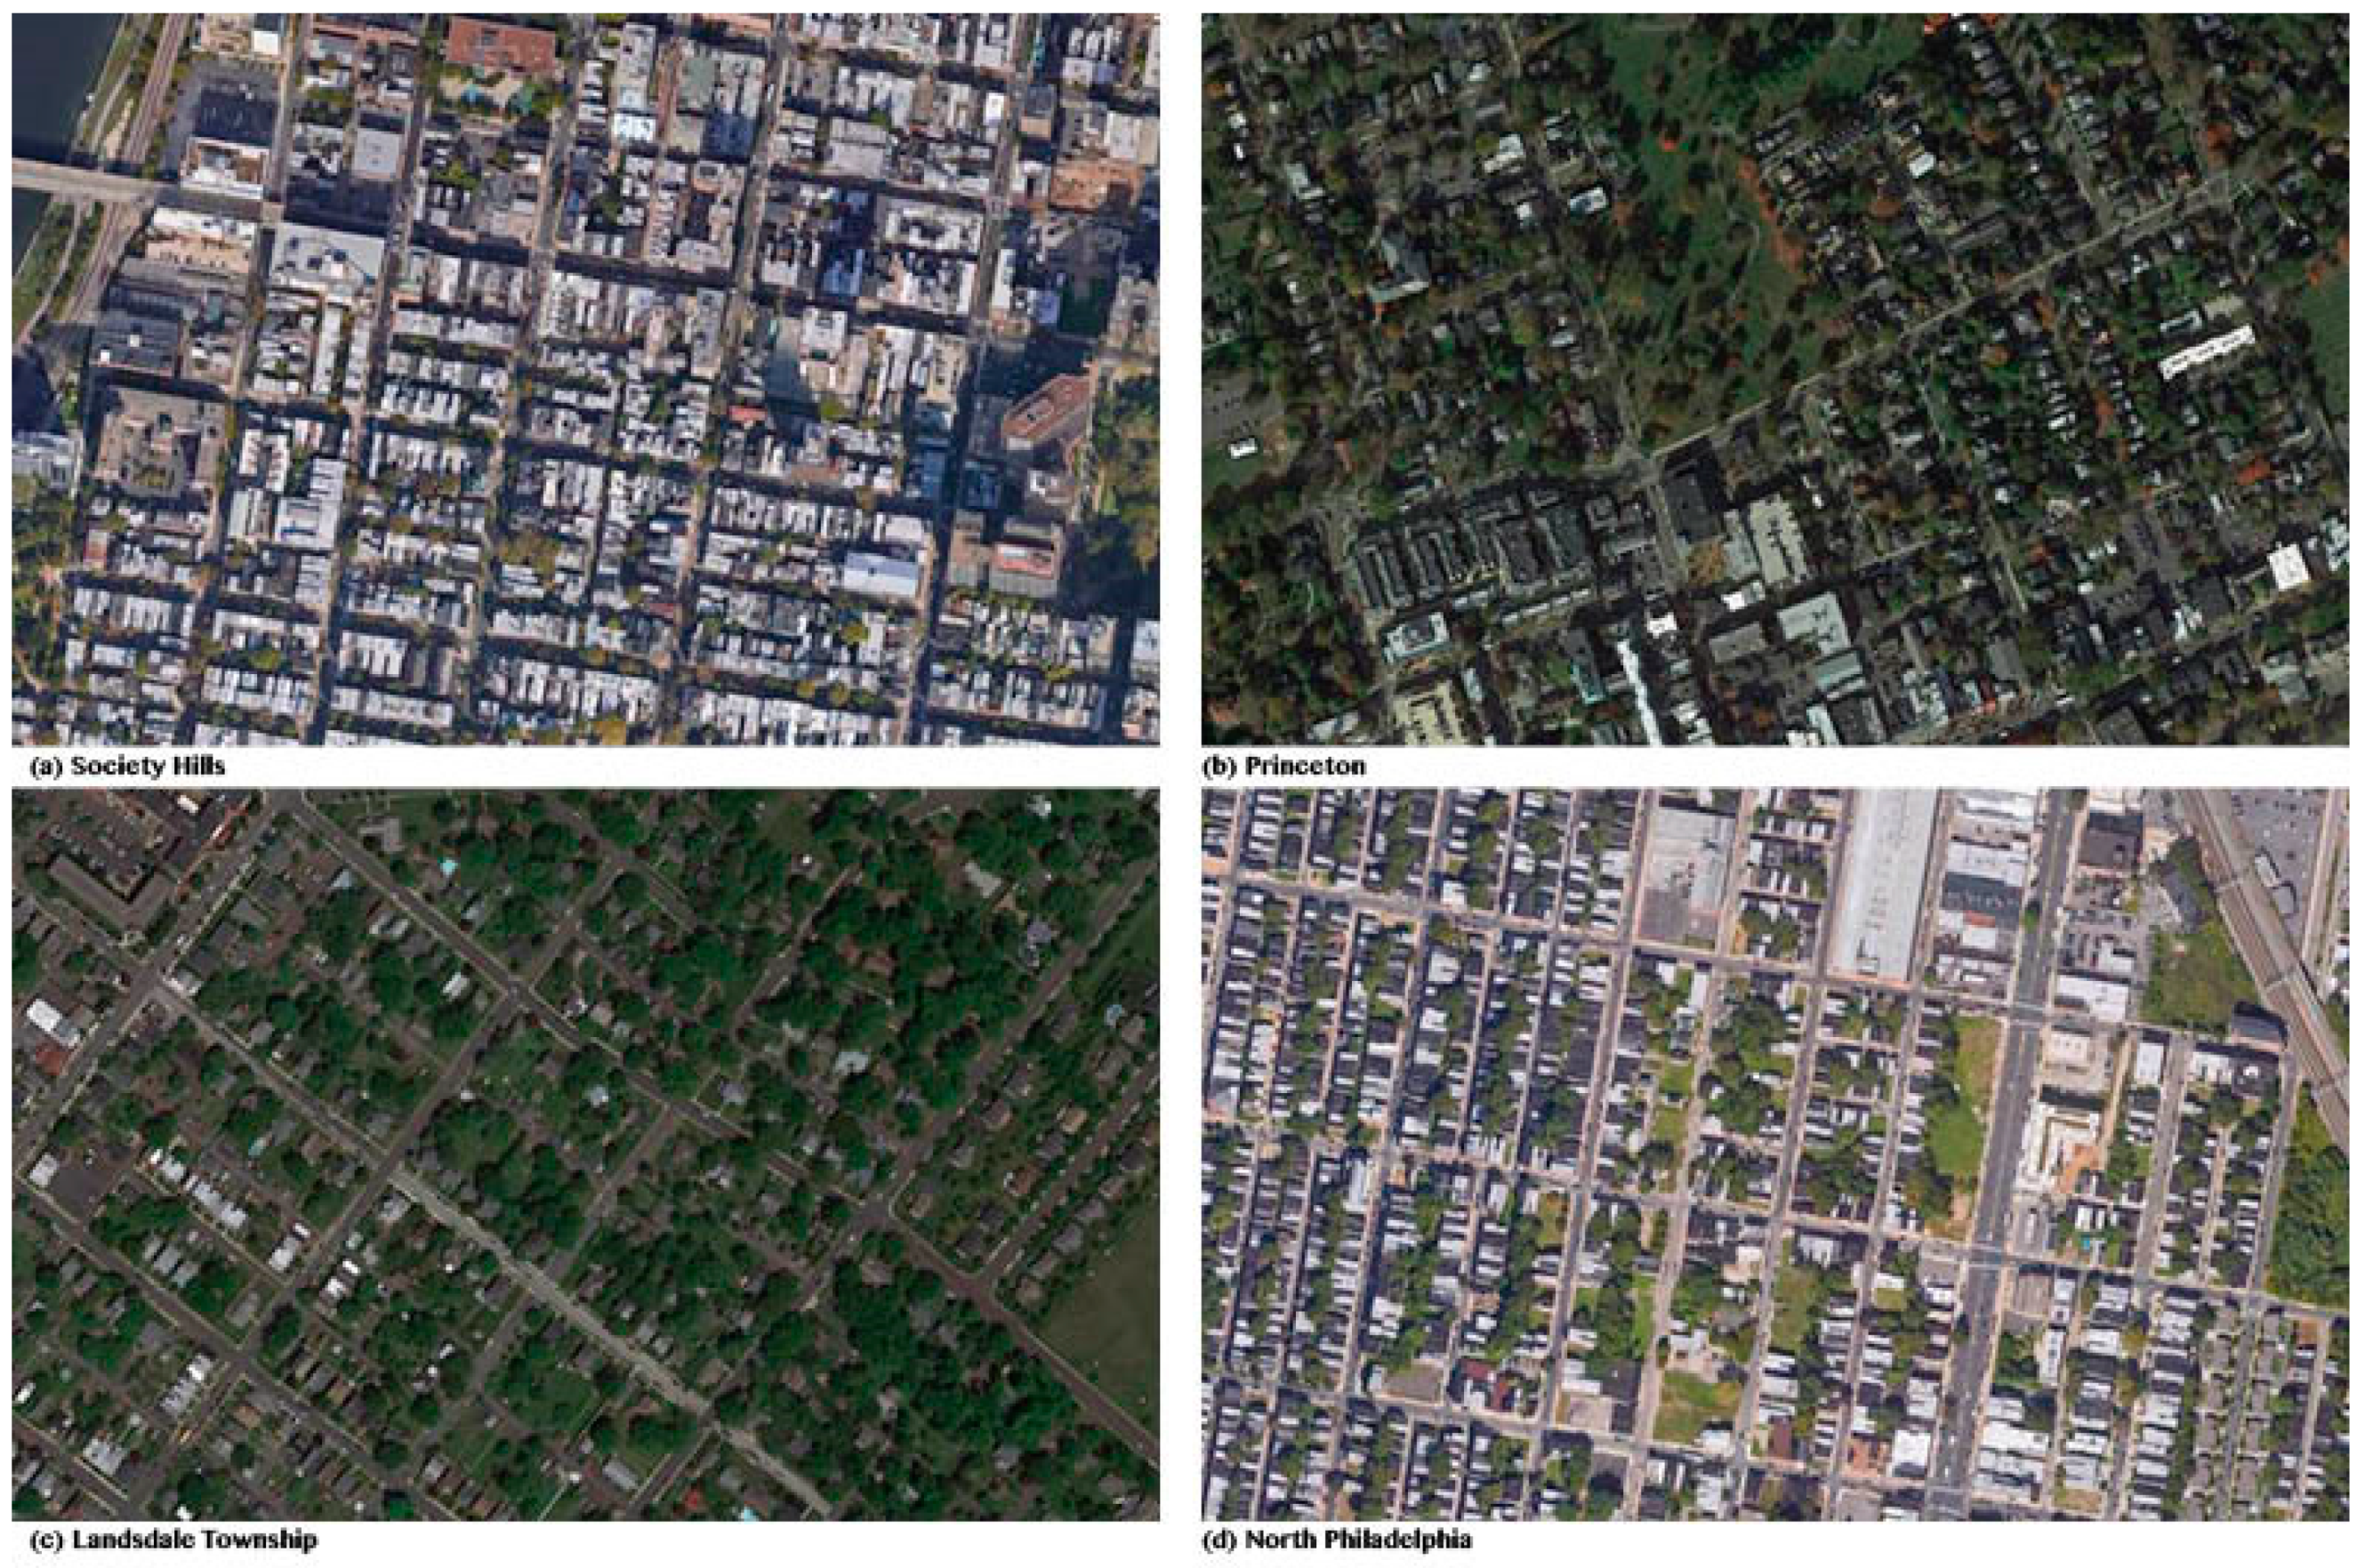
Urban scholars have praised high-density cities, such as New York and Hong Kong, as the defining examples of the sustainable urban form [37,38]. The positive effect of an agglomeration economy, supported by a large population and diverse demographics, exceeds the negative externality of traffic congestion and increased crime. These scholars argue that there is no upper-end limit of density. However, there seems to be a range of development densities and building heights. The emergy per capita was lowest for a FAR of 1 to 5 in a study of the densities and height limits of entire buildings in Manhattan [30]. In addition, buildings taller than 40 stories tend to show higher emergy per capita. That is, high-rise towers and high-density or sprawling developments tend to use more construction materials and expend more operation energy, as shown in Figure 3 and Figure 4.
An increase in emergy investment is expected for high-rise development. High-rise towers involve more structural enforcement with higher quality materials. Extra mechanical and electrical equipment is also necessary to service larger buildings. Therefore, the construction cost increases for taller buildings. When the land price and locational advantages are greater than the additional construction costs, the market demand increases the number of buildings and development density until the costs and benefits offset each other. Figure 4 represents the dynamics of land price and density.
Buildings above 40 stories, however, show much higher emergy intensity per person than average. In other words, tall towers require more emergy to build and operate, are more spacious, and house fewer people. The purpose of a high-rise building changes from maximum use of the limited land to the speculation of vertical space. Buildings over 40 stories in New York City are a luxury for the wealthy. It is no myth that financiers and wealthy professionals prefer penthouses in Manhattan; they are also the primary customers for luxury residences and Class A offices. High-rise development is another version of a “McMansion”, or a vertical suburbia, rather than a model for a sustainable future.
A development density with a FAR between 1 and 5 seems to be more appropriate for urbanization. Most residential neighborhoods in Manhattan, including the East Village, Greenwich Village, Spanish Harlem, and Washington Heights, fall into this range of density (see Figure 5). These neighborhoods can be characterized as typical New York City blocks, consisting of row houses with corner stores to serve the residents—a model that has been celebrated for creating the most vibrant urban scenes (i.e., Jane Jacobs). Despite the high intensity of social life in these neighborhoods, emergy per capita is lower than average. Small living units, higher occupancy rates, lower automobile dependency, a lower structural requirement for row houses, and higher building ages reduce the per capita emergy investment.
Building type, however, does not necessarily determine low per capita emergy. In addition to the grid blocks, it is interesting to see large super-block residential developments, such as Stuyvesant Town, show similar emergy per capita as the row-house neighborhoods. The residents’ economic status is one of the factors driving the per capita emergy down; at $54,000, the median household income is slightly lower in Stuyvesant Town than it is in Manhattan. However, Stuyvesant Town benefits from a higher population density. As more residents share infrastructure, resources and energy are divided and consequently per capita emergy is reduced. Stuyvesant Town is home to 60,938 New Yorkers, with a higher population density at 150 persons per acre [39].

4.2. Building Types

Building type, in conjunction with land use and transportation, has been the focus of sustainable urban design discussions. Some scholars believe that mid-density traditional American and European communities are the most effective settlement type for reducing fossil energy consumption [25,40]. Others believe that the types of buildings do not matter, instead, high density and better access to public transit systems are the two most important factors for sustainability [10,41].
Considering that one of the goals of urbanization is to reduce the per capita consumption of energy and resources, low-emergy per capita communities could provide insight for the urbanization process. Table 1 provides a summary of census tract characteristics based on emergy per capita and empower density. Figure 6 is a comparison of the four census tracts. The four census tracts show how similar building types house a wide spectrum of socio-economic classes as seen in Table 2. The residents of urban communities such as Rittenhouse Square and Fitler Square are mainly affluent young professionals. They enjoy the amenities around the urban centers. Princeton is a defining example of suburban community with commuters to metropolitan centers. Rural communities, including Landsdale, show similar density to other suburban communities, however, they tend to be embedded in agricultural land. Lastly, North Philadelphia is notorious for its economic degradation. Compared to other suburban and urban communities, North Philadelphia shows a concentration of poverty and African American groups.
The residents of low-EC tracts use public transit, such as the bus and subway, more than automobiles. Workplaces are typically not far from home, with the average commute being only 13.5 minutes. These residents also live in a neighborhood with a high-population density of 435.1 people per acre. However, Philadelphia’s low-EC tracts represent disenfranchised communities. Most of these census tracts are located in North and West Philadelphia. Residents here are not as educated as they are in other communities. In addition, at just $22,000, the annual household income is half the amount that it is in neighboring areas. To offset transportation costs, lower-income families have to find homes closer to their workplaces. They also require access to the public transit system. This is evidence of how self-organization works in cities like Philadelphia.
As expected, wealthy suburban neighborhoods have higher per capita emergy. These tracts cover a much larger geographic territory and are located away from the city center of Philadelphia. As a result, these communities show much higher transportation emergy; residents make both commute and non-commute trips by automobile. The higher household income allows these residents to enjoy an affluent lifestyle. They are also more educated. The density index shows that they enjoy an uncrowded lifestyle at 4.1 people per acre with a FAR of 0.01.
Interestingly, high-empower-density communities in the Greater Philadelphia Region share the characteristics of sustainable neighborhoods. These tracts are highest in population density at 527.2 people per acre. People commute via a wide variety of transportation modes. Although they depend on public transit, a large number of people either walk or bike to work. Taxis are used more often in Philadelphia than in other parts of the region. The frequent use of the public transit system is supported by the tracts’ highest population density and development density. High-empower-density communities include Society Hill, Fitler Square, Art Museum, and the well-established or up-and-coming neighborhoods of Philadelphia City. Young professionals and graduate students from adjacent universities prefer to live in these communities. As a result, the level of education here is highest among the regions compared in the census tracts.
The findings from the Greater Philadelphia Region favor New Urbanists and compact city proponents. The communities with three-story urban townhouses lower transportation emergy by sharing the public transit system. Limited land in cities drives people to build denser and to live closer together. Smaller and older homes allow for a diverse mix of social classes [42]. Despite Philadelphia communities showing class segregation, townhomes serve as homes for families of various social classes with differing incomes and education levels. Both high-empower-density and low-emergy-per-capita share building and block typology: Mid-rise row-house urban blocks. Because these communities share the public transit system, they boast lower transportation emergy. Development densities are around a FAR of 1 regardless of income and education level.

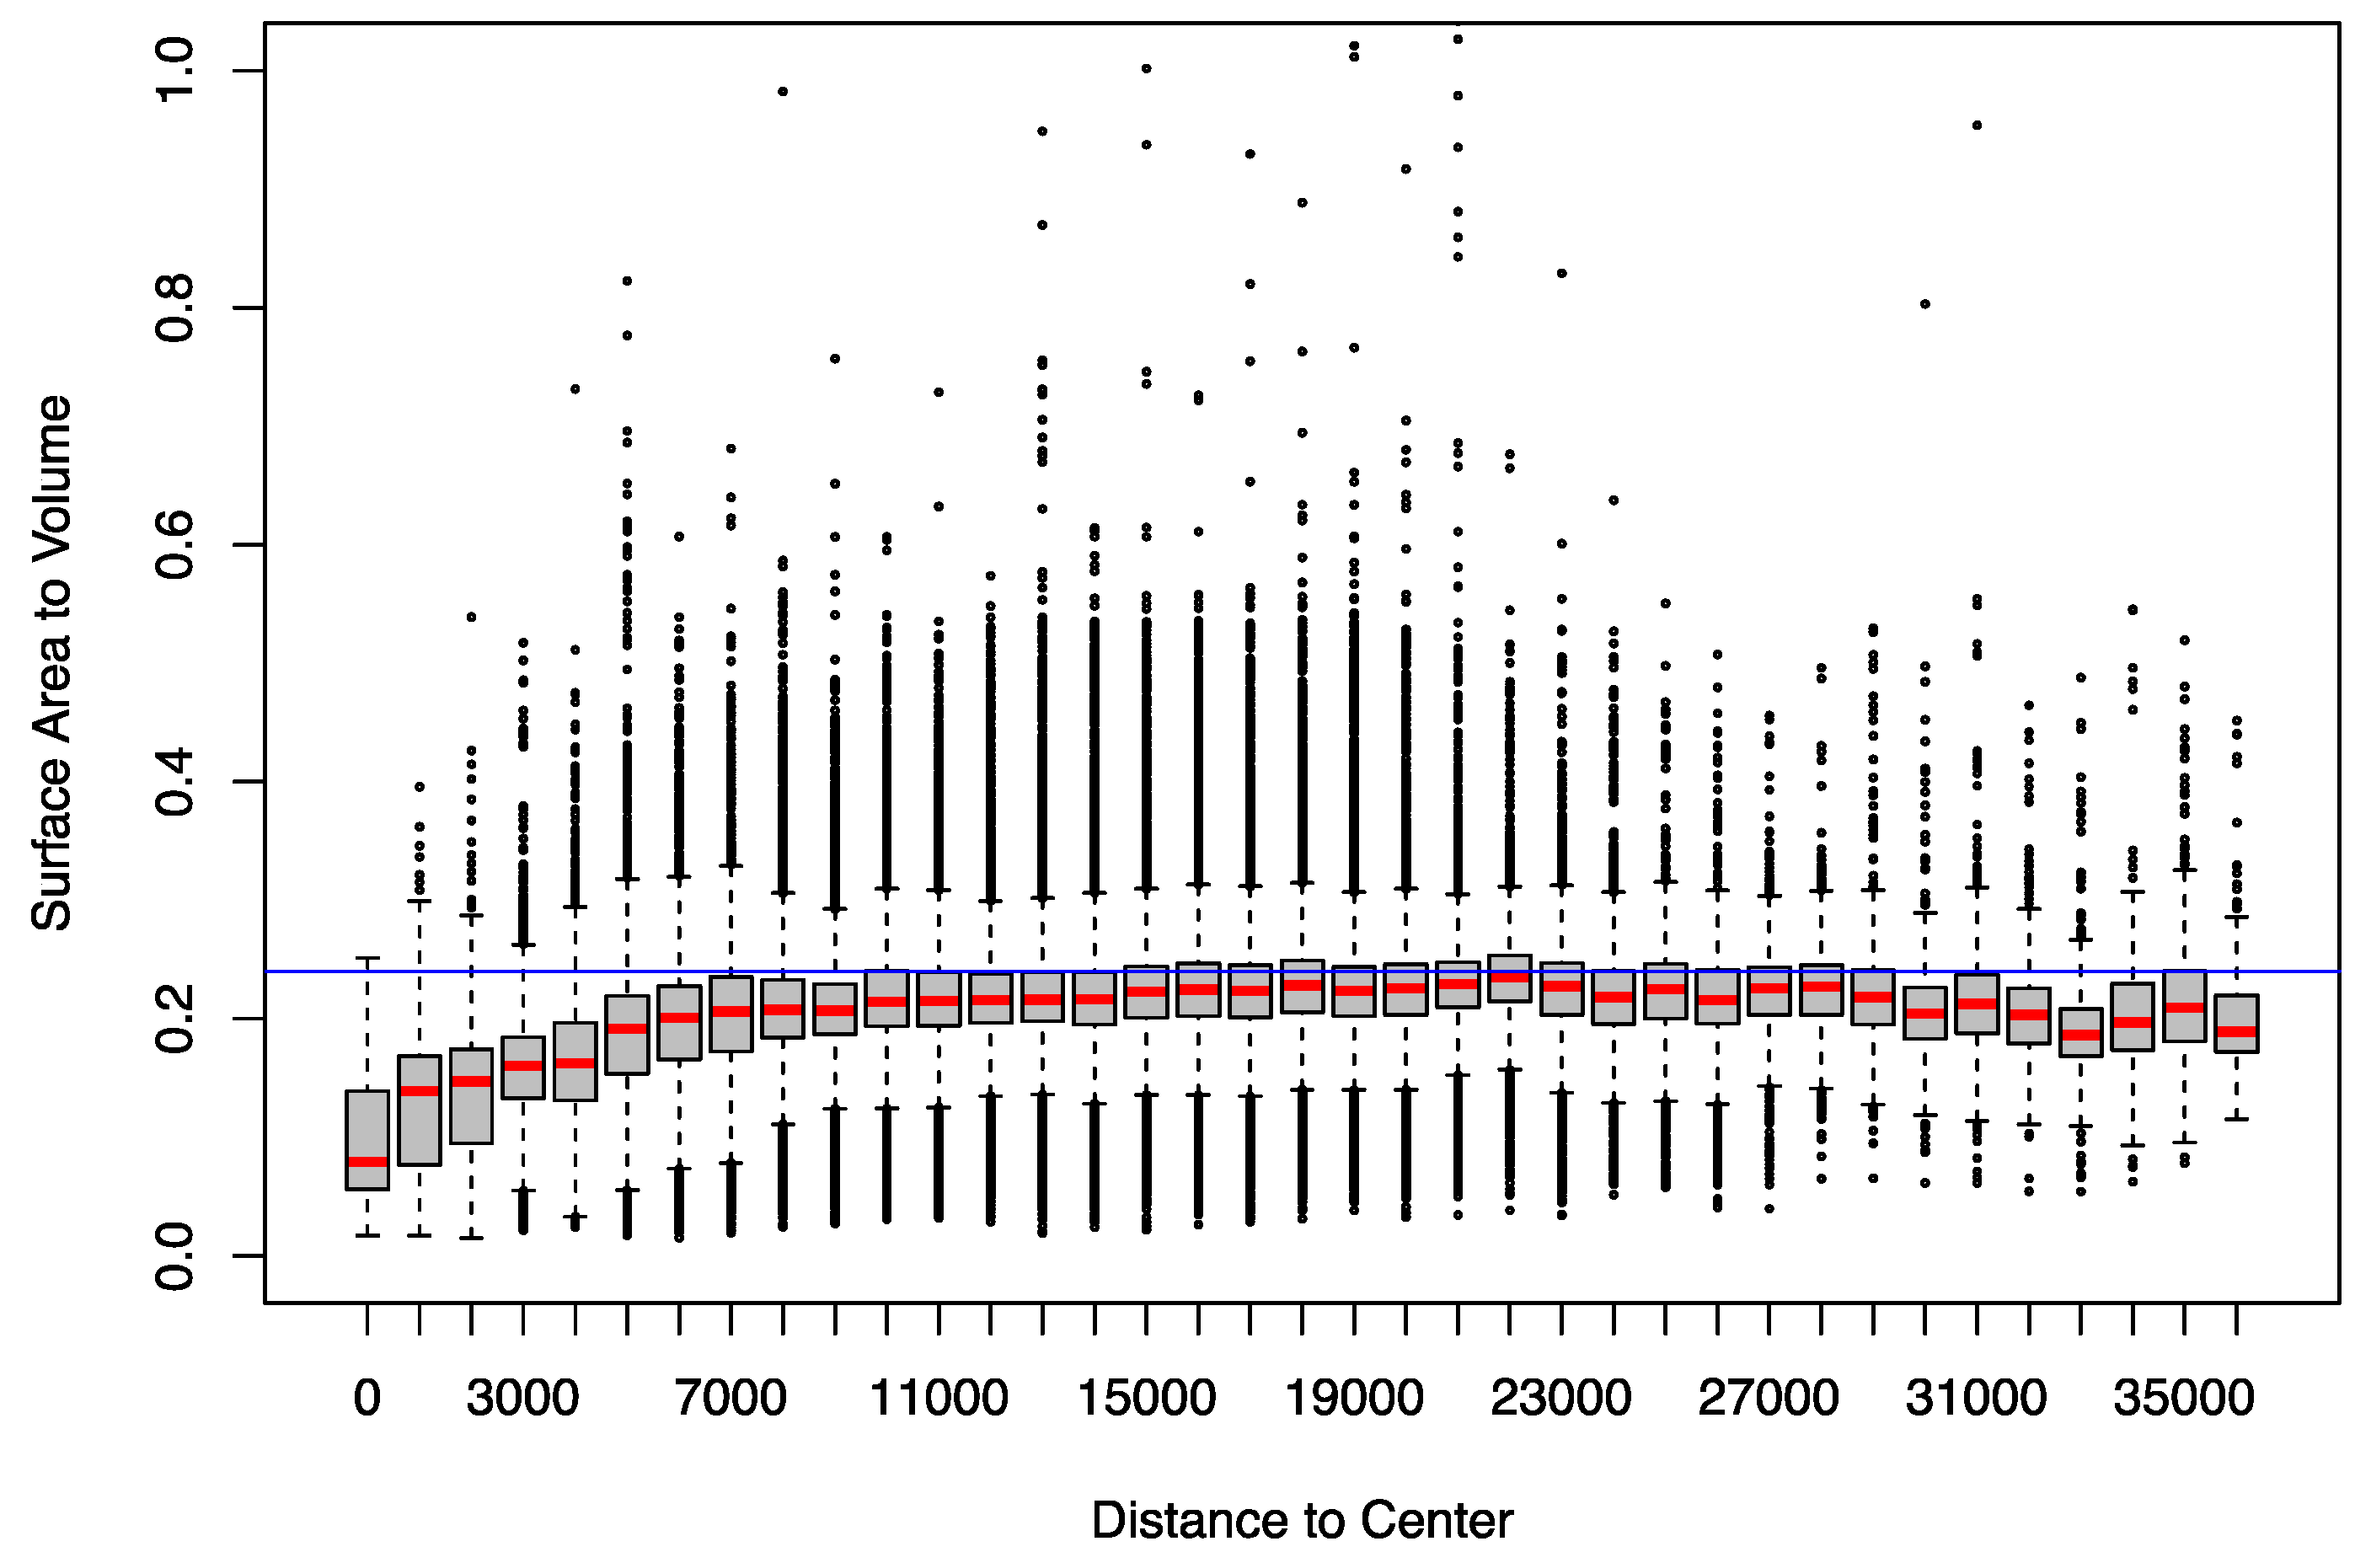
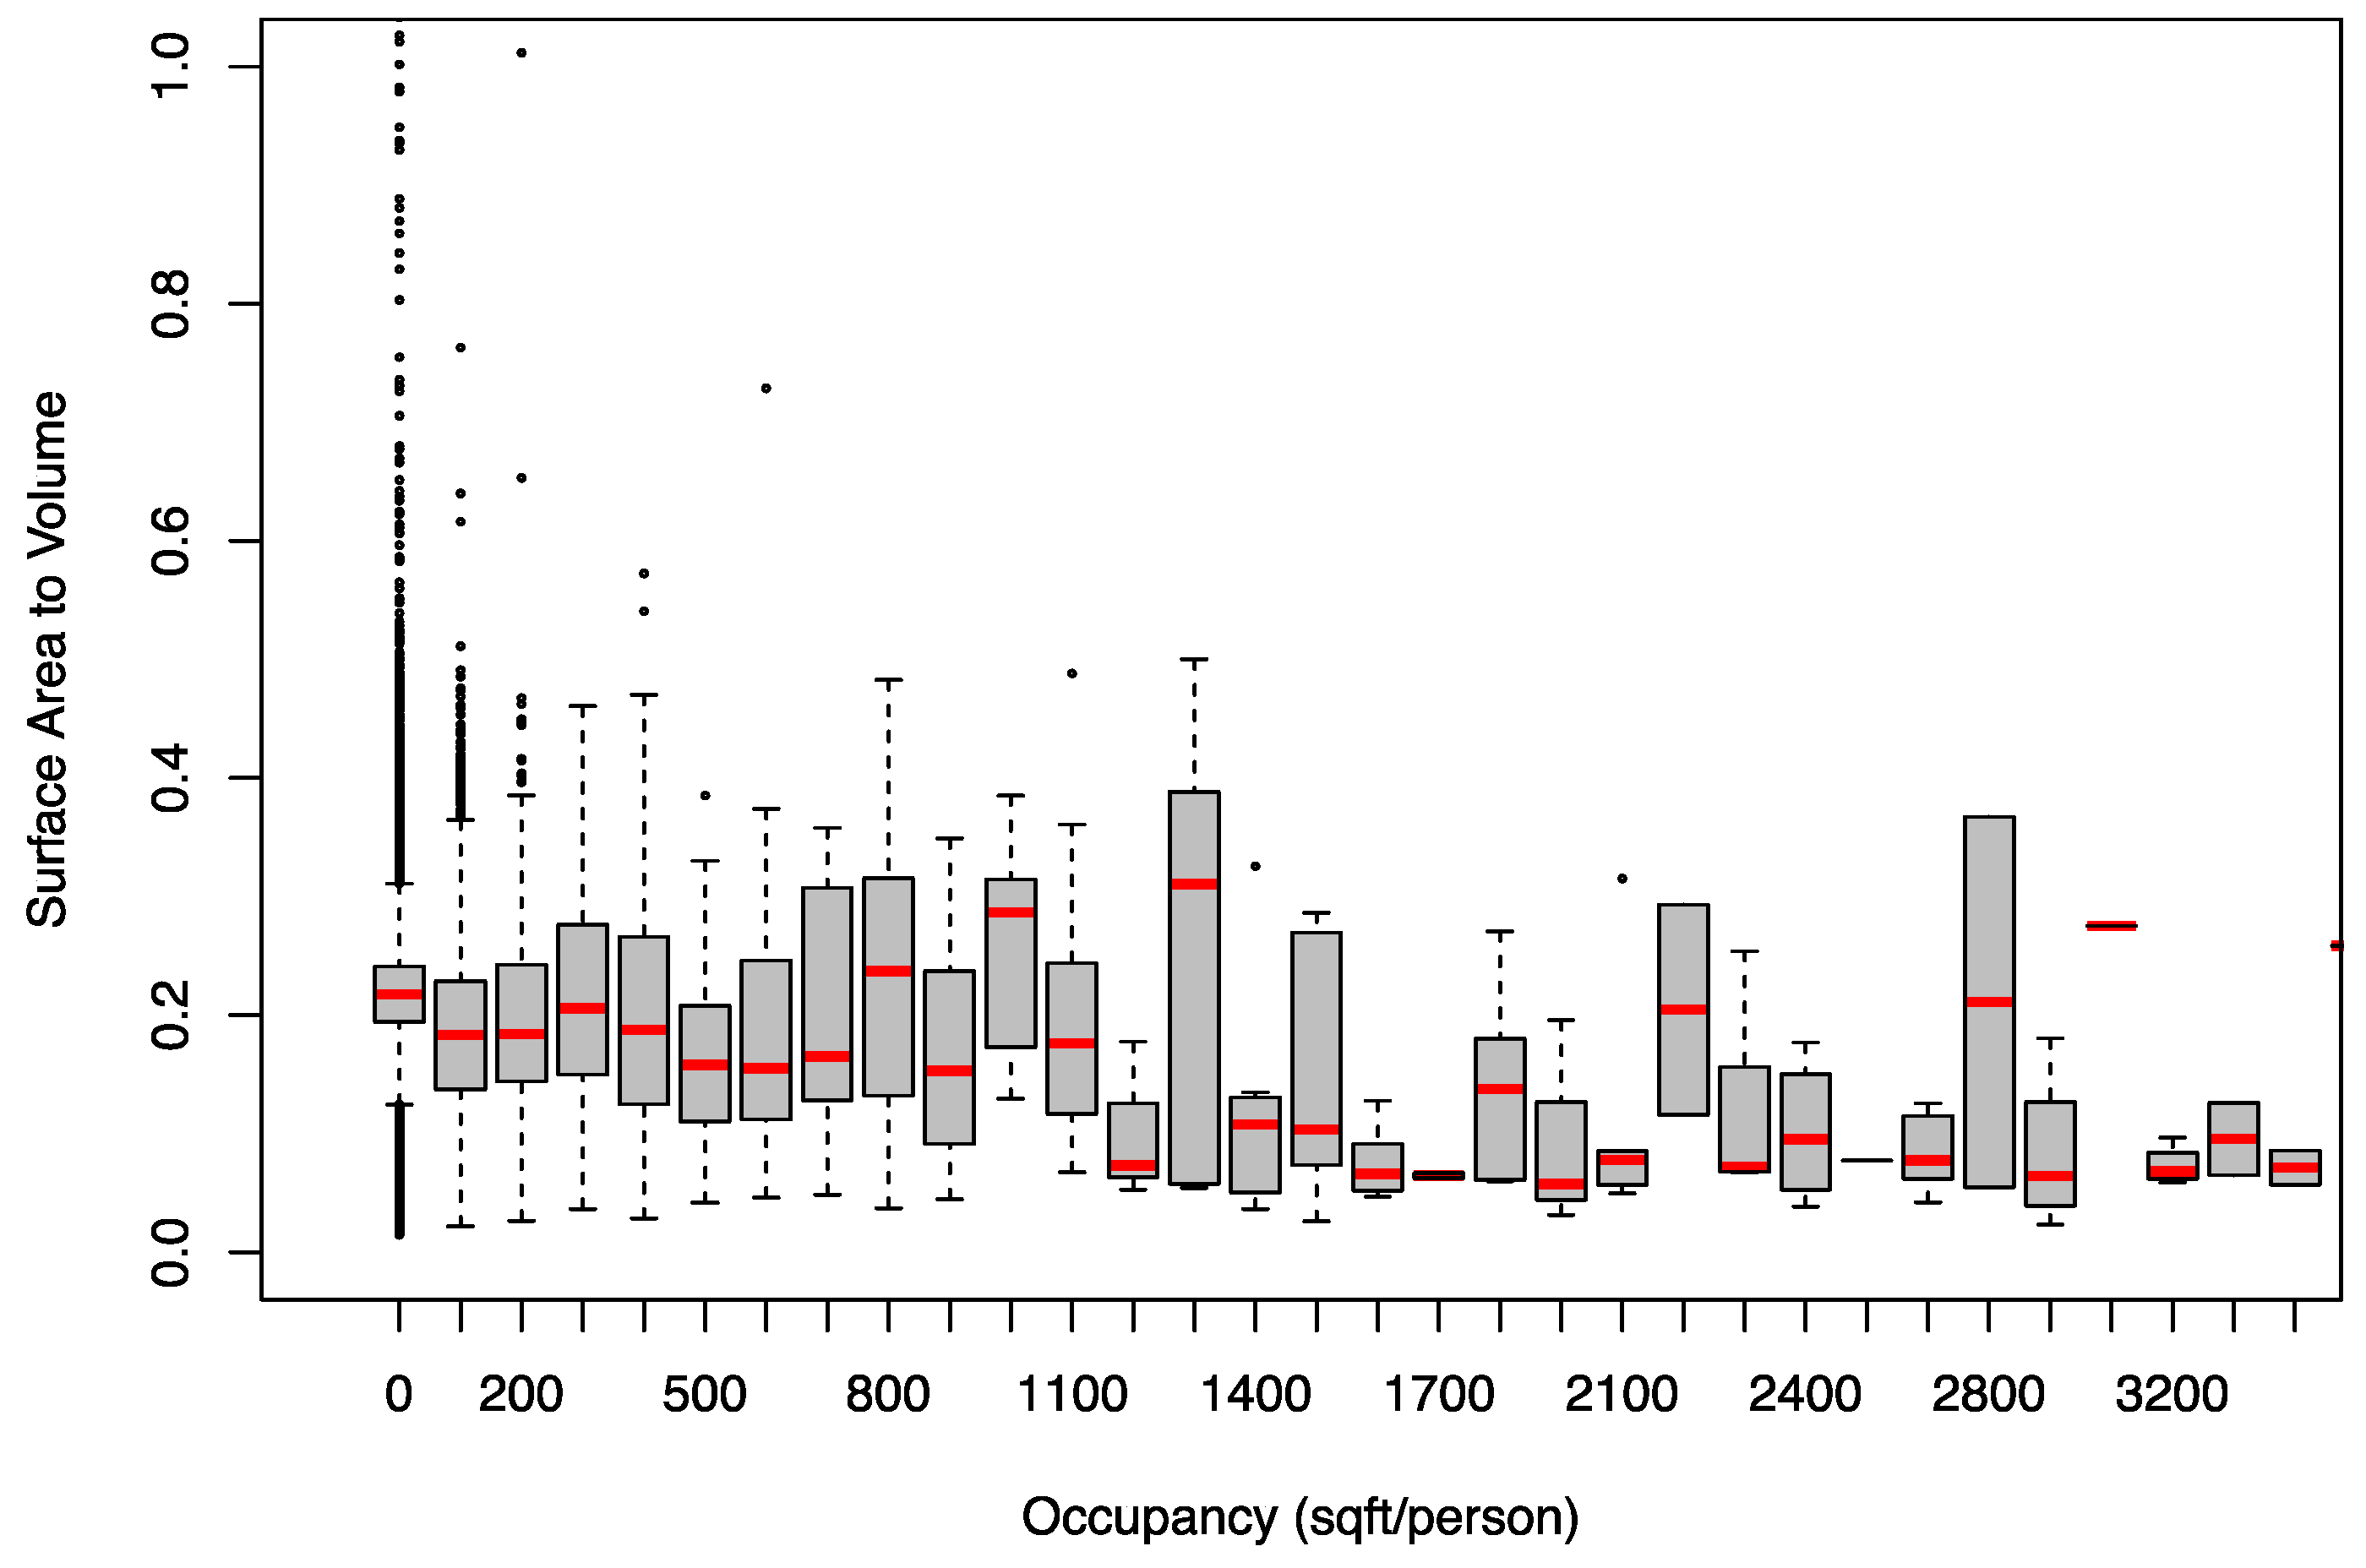
4.3. Surface-Area-to-Volume Ratio

Building massing is somewhat related to urbanization goals. Surface-area-to-volume ratio (SVR) is an urban form indicator used to assess the bulkiness of buildings. SVR is lower for bulky buildings, such as large office towers, but higher for small row houses. Figure 7 shows the contrast in building bulk, where the left image is of a typical big box retail and industrial warehouse, whereas the right image is of a neighborhood with rowhomes, which are low SVR buildings. The SVR is closely related to the energy consumption of the heating, ventilation, and air-conditioning systems. This is because the building volume determines the heating and ventilation loads, whereas surface area determines the rate of heat exchange and air circulation. Buildings with lower SVR tend to be less efficient in cooling and ventilation [21]. After the second half of the twentieth century, buildings became larger as structural and ventilation technology advanced [43,44]. Because larger and bulkier buildings, such as modern offices and big-box stores, require a much higher intensity of energy in cooling and ventilation, they are highly dependent on fuel and electricity.
In addition to energy efficiency, the SVR can also explain the intensity of per capita emergy. As discussed previously, lower SVR buildings tend to consume a higher intensity of energy in cooling, lighting, and ventilation. However, transportation is as important as building operations for increasing high emergy per capita. Because land is expensive and limited in city centers, lower SVR buildings, big-box stores, and suburban office buildings tend to be located on the outskirts of urban development. The additional travel distance, combined with limited public transit access, results in higher per capita emergy. Subways and buses do not serve lower-density suburbs. Thus, larger and lower SVR buildings tend to show higher per capita emergy in general.
Figure 8 illustrates the relationship between SVR and transportation emergy. There is an inversed U-shape at both ends, in the center and at the periphery. The SVR is lower within 10,000 feet from the center, where there are tall towers for maximizing land efficiency. Office headquarters and residential towers are bulkier and show a lower SVR than buildings located between 10,000 and 30,000 feet away from the center. At the other end, the SVR for buildings located further than 30,000 feet from the center is also lower. These developments are horizontally massive big-box retailers, and they are larger for a different reason—to facilitate the demand for generous space.
Big-box retail and suburban office buildings are designed to facilitate both a spacious working environment and the storage of products. Because space represents the primary goal, lower occupancy rates for workers and customers occur as a result. That is, these buildings are too large for the economic and social activities that they house. Per capita use increases when fewer people use the same building and its services (as seen in Figure 9). This is the well-known vicious circle of unsustainable energy consumption in big-box retail. Ample space and poor construction require much higher energy to condition the working and retail environment.
The conventional knowledge of relocating workplaces from the center to the periphery needs to be revisited. Suburban office parks enjoy lower land rent and larger space, however, they might not be as economical or efficient as corporate decision-makers think. When we assess the process comprehensively, the spacious suburban office environment may actually be less sustainable because it incurs an over-investment in resources and transportation energy for the same amount of work.

5. Conclusions

An emergy synthesis of New York City and the Greater Philadelphia region confirmed Odum and Pinkerton’s [1] conclusion that a natural or man-made system does not achieve maximum efficiency. Odum and Pinkerton established the maximum power theory, the fourth law of thermodynamics, which describes how a system organizes itself to maximize power intake and to transform lower quality energy into a high-quality product or information [32] (p. 311). Cities and their built environment operate under the same principle: They self-organize to take high-intensity fossil fuel to create information, knowledge, know-how, and an agglomeration economy for growth.
Unlike the images that we see of futuristic cities filled with ever-rising tall buildings, there is a limit to how high buildings can be. Similarly, there are certain ranges of urban form parameters that seem to be more effective in growing cities. A New York City study illustrated that buildings over 40 stories and with a development density beyond a FAR of 5 tend to be higher in per capita emergy. That is, the emergy spent per person in these buildings exceeds the average. Development beyond these parameters could be considered ineffective. The size of buildings for the scale of economy also has an upper limit. Low-SVR buildings depend heavily on the mechanical and electrical conditioning of space, which consumes a significant amount of energy. Their lavish use of resources might be justified in the city center, where social and economic diversity and prosperity can facilitate the growth. The interactions among various social groups, as well as the exchange of products and ideas, fuel urbanization. However, large buildings with a low SVR located on the periphery do not contribute to urbanizing areas. They exist simply to provide generous amounts of space. For this reason, we should consider these buildings detrimental to urbanization and limit their construction in the future.
This study vetted results against the existing urban form theories, compact city and New Urbanism, confirming that the European and North American mid-rise urban block is an effective settlement type for reducing per capita emergy in construction and building operations. As seen in Philadelphia, the gridded urban block can minimize per capita emergy. The same building type is also flexible enough to facilitate diverse socio-economic classes.
The emergy synthesis of New York City and the Greater Philadelphia region showed a somewhat comprehensive and detailed understanding of how cities work. However, two cases are not enough to reach a generalizable theory on the urbanizing process. Cross-sectional studies considering various climate conditions, cultures, and demographics will provide greater insight on the process of urban growth and guide us to a sustainable future.

Author Contributions

Conceptualization, J.M.L. and W.B.; methodology, J.M.L.; writing—original draft preparation, J.M.L.; writing—review and editing, W.B.; visualization, J.M.L.

Funding

This research was partly funded by University of Ulsan, grant number 2018-0803.

Conflicts of Interest

The authors declare no conflict of interest.

References

  1. Odum, H.T.; Pinkerton, R.C. Time’s speed regulator: The optimum efficiency for maximum power output in physical and biological systems. Am. Sci. 1955, 43, 331–343. [Google Scholar]
  2. Cai, T.T.; Montague, C.L.; Davis, J.S. The maximum power principle: An empirical investigation. Ecol. Model. 2006, 190, 317–335. [Google Scholar] [CrossRef]
  3. Handy, S. Methodologies for exploring the link mbetween urban form and travel behavior. Transp. Res. Transp. Environ. 1996, D2, 151–165. [Google Scholar] [CrossRef]
  4. Barrett, G. The transport dimension. In The Compact City: A Sustainable Urban Form? Jenks, M., Burton, E., Williams, K., Eds.; E & FN Spon: London, UK, 1996; pp. 171–180. [Google Scholar]
  5. Elkin, T.; McLaren, D.; Hillman, M. Reviving the City: Towards Sustainable Urban Development; Friends of the Earth: London, UK, 1991. [Google Scholar]
  6. Dieleman, F.M.; Dijst, M.; Burghouwt, G. Urban form and travel behaviour: Micro-level household attributes and residential context. Urban Stud. 2002, 39, 507–527. [Google Scholar] [CrossRef]
  7. Lin, Z.; Greene, D.L. Assessing energy impact of plug-in hybrid electric vehicles: Significance of daily distance variation over time and among drivers. Transp. Res. Rec. 2011, 2252, 99–106. [Google Scholar] [CrossRef]
  8. Parker, T. The Land Use—Air Quality Linkage: How Land Use and Transportation Affect Air Quality; California Air Resources Board: Sacramento, CA, USA, 1994.
  9. Coupland, A. Reclaiming the City: Mixed Use Development; Routledge: Abingdon-on-Thames, UK, 2005. [Google Scholar]
  10. Newman, P.; Kenworthy, J. Gasoline consumption and cities: A comparison of US cities with a global survey. J. Am. Plan. Assoc. 1989, 55, 23–37. [Google Scholar] [CrossRef]
  11. Walker, L.; Rees, W. Urban density and ecological footprints—An analysis of Canadian households. In Eco-City Dimensions: Healthy Communities, Healthy Planet; Roseland, M., Ed.; New Society Publishers: Gabriola Island, BC, Canada, 1997. [Google Scholar]
  12. Mehta, V. Lively streets: Determining environmental characteristics to support social behavior. J. Plan. Edu. Res. 2007, 27, 165–187. [Google Scholar] [CrossRef]
  13. Gehl, J. Life Between Buildings: Using Public Space; Island Press: Washington, WA, USA, 2011. [Google Scholar]
  14. Ewing, R.; Clemente, O. Measuring Urban Design: Metrics for Livable Places; Island Press: Washington, WA, USA, 2013. [Google Scholar]
  15. Thorne, R.; Filmer-Sankey, W. Transportation. In Sustainable Urban Design; Randall, T., Fordham, M., Eds.; Spon Press: London, UK, 2003; pp. 25–32. [Google Scholar]
  16. Heath, G.W.; Brownson, R.C.; Kruger, J.; Miles, R.; Powell, K.E.; Ramsey, L.T.; Task Force on Community Preventive Services. The effectiveness of urban design and land use and transport policies and practices to increase physical activity: A systematic review. J. Phys. Act. Health 2006, 3, S55–S76. [Google Scholar] [CrossRef] [PubMed]
  17. Carl, P. Urban density and block metabolism. In3 Architecture, city, environment. In Proceedings of the PLEA 2000, Cambridge, UK, 2–5 July 2000. [Google Scholar]
  18. Owens, S. Energy, environmental sustainability and land-use planning. In Sustainable Development and Urban Form; Breheny, M., Ed.; Pion: London, UK, 1992; pp. 79–105. [Google Scholar]
  19. Rohdin, P.; Molin, A.; Moshfegh, B. Experiences from nine passive houses in Sweden–Indoor thermal environment and energy use. Build. Environ. 2014, 71, 176–185. [Google Scholar] [CrossRef]
  20. Yannas, S. Living with the city: Urban design and environmental sustainability. In Environmentally Friendly Cities; Eduardo, M., Yannas, S., Eds.; James & James: London, UK, 1998; pp. 41–48. [Google Scholar]
  21. Ratti, C.; Baker, N.; Steemers, K. Energy consumption and urban texture. Energy Build. 2005, 37, 762–776. [Google Scholar] [CrossRef]
  22. Ewing, R.; Rong, F. The impact of urban form on US residential energy use. Hous. Policy Debate 2008, 19, 1–30. [Google Scholar] [CrossRef]
  23. Calthorpe, P. The next American Metropolis: Ecology, Community, and the American Dream; Princeton Architectural Press: Hudson, NY, USA, 1993. [Google Scholar]
  24. Srinivasan, R.; Moe, K. The Hierarchy of Energy in Architecture Energy Analysis; Routledge: Abingdon, UK; New York, NY, USA, 2015. [Google Scholar]
  25. Braham, W.W. Architecture and Systems Ecology: Thermodynamic Principles of Environmental Building Design, in Three Parts; Routledge: Abingdon-on-Thames, UK, 2016. [Google Scholar]
  26. Brown, M.T.; Ulgiati, S. Emergy Analysis and Environmental Accounting. In Encyclopedia of Energy; Cutler, J., Ed.; Elsevier: Amsterdam, The Netherlands, 2004. [Google Scholar]
  27. Braham, W.W.; Yi, H. Hierarchies of Production in a Contemporary Residence. In Proceedings of the Emergy Synthesis 8, 8th Biennial Emergy Conference, University of Florida, Gainseville, FL, USA, 16–18 January 2014. [Google Scholar]
  28. Braham, W.W.; Benghi, N. The Varieties of Building Emergy Intensity. 2016. Available online: https://niccolobenghiarchitect.files.wordpress.com/2016/12/benghi_braham_buildingvariety_paper_rev1.pdf (accessed on 29 March 2019).
  29. Meillaud, F.; Gay, J.B.; Brown, M.T. Evaluation of a building using the emergy method. Sol. Energy 2005, 79, 204–212. [Google Scholar] [CrossRef]
  30. Lee, J.M.; Braham, W.W. Building emergy analysis of Manhattan: Density parameters for high-density and high-rise developments. Ecol. Model. 2017, 363, 157–171. [Google Scholar] [CrossRef]
  31. Braham, W.W.; Oskierko-Jeznacki, E.; Lee, J.M.; Silverman, B.; Khansari, N. E[m]ergy Model of the Greater Philadelphia Region. In Proceedings of the BIWAES 2017: Biennial International Workshop Advance in Energy Studies, Naples, Italy, 25–28 September 2017. [Google Scholar]
  32. Odum, H.T.; Brown, M.T.; Whitfield, D.F.; Lopez, S.; Woithe, R.; Doherty, S. Zonal Organization of Cities and Environment—A Study of Energy Systems Basis for Urban Society. Center for Environmental Policy; University of Florida: Gainesville, FL, USA, 1995. [Google Scholar]
  33. Huang, S.-L.; Lai, H.; Lee, C. Energy Hierarchy and Urban Landscape System. Landsc. Urban Plan. 2001, 53, 145–161. [Google Scholar] [CrossRef]
  34. Huang, S.-L. Urban Ecosystems, Energetic Hierarchies, and Ecological Economics of Taipei Metropolis. J. Environ. Manag. 1998, 52, 39–51. [Google Scholar] [CrossRef]
  35. Lei, K.; Wang, Z.; Ton, S. Holistic Emergy Analysis of Macao. Ecol. Eng. 2008, 32, 30–43. [Google Scholar] [CrossRef]
  36. Ascione, M.; Campanella, L.; Cherubini, F.; Ulgiati, S. Environmental Driving Forces of Urban Growth and Development: An Emergy-Based Assessment of the City of Rome, Italy. Landsc. Urban Plan. 2009, 93, 238–249. [Google Scholar] [CrossRef]
  37. Owen, D. The Efficiency Dilemma:If Our Machines Use Less Energy, Will We Just Use Them More? The New Yorker, 12 December 2010. [Google Scholar]
  38. Glaeser, E.L. Triumph of the City: How Our Greatest Invention Makes Us Richer, Smarter, Greener, Healthier, and Happier; Penguin Press: New York, NY, USA, 2011. [Google Scholar]
  39. Population Density by Neighborhood Tabulation Area* New York City. 2010. Available online: https://www1.nyc.gov/assets/planning/download/pdf/data-maps/nyc-population/census2010/m_pl_p2_nta.pdf (accessed on 29 March 2019).
  40. Jenks, M.; Jones, C. Dimensions of the Sustainable City (Future City 2); Springer: Berlin/Heidelberg, Germany, 2010. [Google Scholar]
  41. Cervero, R. The Transit Metropolis: A Global Inquiry; Island Press: Washington, DC, USA, 1998. [Google Scholar]
  42. Jacobs, J. The Death and Life of Great American Cities; Random House: New York, NY, USA, 1961. [Google Scholar]
  43. Banham, R. Architecture of the Well-tempered Environment; University of Chicago Press: Chicago, IL, USA, 1984. [Google Scholar]
  44. Oldfield, P. Five Energy Generations of Tall Buildings: An Historical Analysis of Energy Consumption in High-Rise Buildings. J. Archit. 2009, 14, 591–613. [Google Scholar] [CrossRef]
Figure 1. Conceptual emergy diagram for a typical census tract. Emergy sources, processes, consumers, assets, and flows are identified to represent how a typical census block works. A comprehensive emergy accounting is possible by separating the assets and flows in a census block.
Sustainability 11 02352 g001
Figure 2. Emergy per capita in the Delaware Valley Regional Planning Commission and New York City. City centers are lower in per capita emergy; that is, less emergy are spent per person in the centers of Philadelphia and New York City. Sharing city assets, including public transportation, park systems, and developable land are the main causes for the decrease in EC.
Sustainability 11 02352 g002
Figure 3. Emergy per capita by number of floors. High-rise buildings over 40 stories show higher per capita emergy. Buildings over 40 stories are not intended for efficient use of limited land in city centers but for affluent classes to enjoy spacious residences and work places.
Sustainability 11 02352 g003
Figure 4. Emergy per capita by floor area ratio (FAR). Emergy per capita is lower for FAR values from 1 to 5. Low-density development below a FAR of 1 is ineffective because it consumes higher emergy per person, whereas development over an FAR of 5 shows a slight decline in emergy per capita as density increases.
Sustainability 11 02352 g004
Figure 5. Four neighborhoods in New York City: (a) Greenwich Village, (b) Washington Heights, (c) Spanish Harlem, and (d) Lower Manhattan. (These images were taken from Google Maps, Map Data: ©2019 Google).
Sustainability 11 02352 g005
Figure 6. Four neighborhoods in the Greater Philadelphia region: (a) Society Hill, (b) Princeton, (c) Lansdale Township, and (d) North Philadelphia. (These images were taken from Google Maps, Map Data: ©2019 Google). These neighborhoods show a similar housing type: Rowhomes; however, they show a wide spectrum of resident demographics.
Sustainability 11 02352 g006
Figure 7. Examples of high (left) and low (right) surface-area-to-volume ratio buildings. (These images were taken from Google Maps, Map Data: ©2019 Google). Big-box retail buildings or warehouses are typically located in the city periphery, where land is cheaper.
Sustainability 11 02352 g007
Figure 8. Surface-area-to-volume ratio and distance to center. Larger and lower SVR buildings are located in the center, where the land price is high, and at the periphery, respectively, where the per capita building area is higher.
Sustainability 11 02352 g008
Figure 9. Per capita building area and surface-area-to-volume ratio. People use more space per person in buildings with a lower SVR or in larger buildings.
Sustainability 11 02352 g009
Table 1. Emergy synthesis of a census tract: Trenton tract 12.
Land UseTypeItemUnitntsQuant. (unit)UEV (sej/Unit)Emergy (Sej/yr)
Non-ResidentialAssetsLand value assessment$81.26 × 10⁵
Building constructionSej/yr96.40 × 1021varies1.45 × 1020
FlowsRenewable inputssqm32.63 × 1051.23 × 1093.25 × 1014
City tax property tax$91.65 × 1031.97 × 10123.25 × 1015
Education property tax$91.72 × 1031.97 × 10123.38 × 1015
Labor wage$109.92 × 1061.97 × 10121.95 × 1019
WaterL/yr121.05 × 1071.55 × 1091.62 × 1016
WastewaterL/yr137.84 × 1062.37 × 10101.86 × 1017
FoodCal145.41 × 10113.99 × 1092.16 × 1021
Solid wastekg/yr158.21 × 1042.25 × 10111.85 × 1016
Non-durable supplies$161.49 × 1051.97 × 10122.93 × 1017
Electricity 45%J171.10 × 10121.78 × 1051.96 × 1017
Fuel 55%J171.35 × 10121.41 × 1051.90 × 1017
Transp. - commutingkm185.85 × 107Varies8.78 × 1018
CarAlonekm182.70 × 1072.15 × 10115.81 × 1018
Carpool2km182.82 × 1062.15 × 10116.07 × 1017
Carpool3km182.11 × 1062.15 × 10114.53 × 1017
Buskm182.39 × 1076.61 × 10101.58 × 1018
Subwaykm182.68 × 1066.52 × 10101.74 × 1017
Railroadkm180.00 × 106.52 × 10100.00 × 10
WalkJ181.66 × 10119.53 × 1051.58 × 1017
TaxiBikekm180.00 × 102.15 × 10110.00 × 10
ResidentialAssetsLand value assessment$85.25 × 10⁷
Residentspeople233.87 × 103
Res-high school and <people191.31 × 1034.03 × 10165.28 × 1019
Res-collegepeople191.14 × 1035.40 × 10166.15 × 1019
Res-grad school and > people193.32 × 1027.25 × 10162.41 × 1019
Building constructionSej/yr93.92 × 1023Varies3.24 × 1018
Automobilescar202.27 × 1038.42 × 10131.91 × 1017
FlowsRenewable inputssqm28.07 × 1051.23 × 1099.96 × 1014
City tax property tax$99.58 × 1051.97 × 10121.89 × 1018
Education property tax$93.89 × 1061.97 × 10127.67 × 1018
Household income $111.02 × 1081.97 × 10122.01 × 1020
WaterL/yr121.06 × 1081.55 × 1091.64 × 1017
WastewaterL/yr137.92 × 1072.37 × 10101.88 × 1018
FoodCal149.86 × 10123.99 × 1093.93 × 1022
Solid wastekg/yr151.50 × 1062.25 × 10113.36 × 1017
Non-durable supplies$161.47 × 1071.97 × 10122.90 × 1019
Electricity 45%J173.70 × 10131.78 × 1056.58 × 1018
Fuel 55%J174.52 × 10131.41 × 1056.37 × 1018
Transp. non commutekm186.93 × 106Varies1.88 × 1021
CarAlonekm187.12 × 1052.15 × 10111.53 × 1017
Carpool2km185.27 × 1052.15 × 10111.13 × 1017
Carpool3km182.07 × 1062.15 × 10114.46 × 1017
Buskm187.96 × 1056.61 × 10105.26 × 1016
Subwaykm180.00 × 106.52 × 10100.00 × 10
Railroadkm182.89 × 10106.52 × 10101.88 × 1021
WalkJ180.00 × 109.53 × 1050.00 × 10
TaxiBikekm180.00 × 102.15 × 10110.00 × 10
GovernmentAssetsLand value assessment$83.83 × 10⁵
Building constructionSej/yr99.58 × 1020Varies9.17 × 1016
Infrastructure-utilitylnft218.31 × 104Varies8.79 × 1017
FireHyea211.66 × 1021.78 × 10142.96 × 1016
WTftlnft218.31 × 1044.58 × 10123.81 × 1017
SWftlnft218.31 × 1044.88 × 10124.06 × 1017
Manholeea211.39 × 1024.56 × 10146.32 × 1016
Infrastructure-roadslnft218.31 × 104Varies9.29 × 1017
roadSQFTsqft213.14 × 1062.29 × 10117.19 × 1017
swSQFTsqft217.06 × 1033.71 × 10102.61 × 1014
STlightea214.61 × 1023.45 × 10141.59 × 1017
TRlightea211.43 × 1023.62 × 10145.16 × 1016
FlowsRenewable inputssqm32.38 × 1051.23 × 1092.94 × 1014
GovExp$222.70 × 1061.97 × 10125.31 × 1018
PSOutFlow$222.41 × 1051.97 × 10124.74 × 1017
EduExp$231.43 × 1071.97 × 10122.81 × 1019
RoadOutFlow$228.96 × 1041.97 × 10121.77 × 1017
UtilOutFlow$225.65 × 1051.97 × 10121.11 × 1018
RecOutFlow$224.65 × 1041.97 × 10129.17 × 1016
Table 2. Emergy characteristics and demographics of census tracts.
High Empower Density – LandLow Empower Density – LandHigh Emergy Per CapitaLow Emergy Per CapitaRegional Average
Unit(a)(b)(c)(d)
Number of census tractsEach676869701332
Empower density—landseJ/yr/sqm1.21 × 10157.83 × 10131.88 × 10144.18 × 10142.07 × 1014
Emergy per capitaseJ/yr/pp1.45 × 10171.89 × 10172.65 × 10186.27 × 10161.53 × 1017
Census tract areasqm315,8338,549,18537,277,828511,6842,157,664
Population densitypp/acre527.217.24.1435.167.4
Number of employeesPeople110514289404051072
Median household income$47,04566,77484,82122,86664,682
Number of residentsPeople35293669346848003956
High school and below%24.549.539.272.242.1
College %43.543.346.925.845.3
Graduate degree and above%28.68.013.11.910.3
Education expenditure$/pp4702512215215121705
TransportationseJ/yr4.69 × 10182.76 × 10194.12 × 10197.16 × 10181.42 × 1019
Carpp × min25,01543,75547,75023,63840,725
Buspp × min13,465197587519,7885112
Subwaypp × min7250585014,5001140
Railroadpp × min3295002138420
Walkpp × min168514395604801405
Taxi/bikepp × min540523750640270
Mean travel timemin17.714.114.413.514.6
Floor area ratio 1.120.210.010.940.36
Notes: (a) Affluent urban communities include Rittenhouse Square, Society Hill, Fitler Square, and South Philadelphia. (b) Suburban communities include Princeton Township, West Nantmeal Township, and West Marlborough Township. (c) Rural communities includes Lansdale Township. (d) Disenfranchised urban communities include census tracts in North and West Philadelphia.

