Article

Considerations on the Environmental and Social Sustainability of Animal-Based Policies

Department of Science of Agriculture, Food and Environment, University of Foggia, via Napoli 25, 71121 Foggia, Italy
*
Author to whom correspondence should be addressed.
Sustainability 2019, 11(8), 2316; https://doi.org/10.3390/su11082316
Submission received: 14 March 2019 / Revised: 8 April 2019 / Accepted: 12 April 2019 / Published: 17 April 2019
(This article belongs to the Section Environmental Sustainability and Applications)

Abstract

:
The contribution of the livestock sector to greenhouse gas (GHG) emissions as well as the worsening of animal welfare, with the intensification of production methods, have become increasingly relevant. Our contribution investigates the environmental impacts, in terms of methane and nitrous oxide emissions, of animal-based policies supported by the European Union. We examine factors affecting the adoption and the magnitude of related budget of Measure 215—animal welfare—of Rural Development Programmes 2007–2013. Our focus is cattle farming in Italy. The results highlight that the problem of animal welfare is highly perceived in regions with greater livestock intensity, also where GHG emissions are relevant. Given the adoption of measure 215, more budget tends to be allocated in regions where livestock units are particularly high. In addition, from the analysis emerges the bargaining position of regions with a higher propensity to the agricultural sector.

1. Introduction

The sustainability of the agricultural practices has been longstanding at the forefront of the policy agenda in the European Union (EU). In fact, agriculture, while sustaining food production, is responsible for great impacts on the environment [1]: A remarkable example is the livestock sector [2,3]. Since the 1992 reform, the Common Agricultural Policy (CAP) paid special attention to the improvement of environmental performances of farmers; the mid-term review of the CAP in 2003 emphasised farmers’ responsibility to adhere to a set of environmental, food quality and animal welfare standards. The greening of the direct payments, introduced in the EU greening reform in 2013, stimulated the transition towards more sustainable systems [3]. In addition, the greening architecture of the CAP 2014–2020, which reinforced mandatory and voluntary measures of cross-compliance, reflects the increasing political interest in the environmental implications of agricultural practices. In particular, the Council Regulation (EC) No. 73/2009 ratifies a mandatory ‘cross-compliance’ (Chapter I), based on which a farmer receives direct payments conditional to the compliance with Statutory Management Requirements (Article 5, Annex II) and Good Agricultural and Environmental Condition (Article 6, Annex III). One of the Statutory Management Requirements is animal welfare (Article 5(1c)), laying down minimum standards for the protection of animals that Member States have to achieve. Currently, the cross-compliance is regulated by the Regulation (EU) 1306/2013 (Article 93).
In such a framework, the livestock sector is receiving high pressures to address sustainability challenges, both from environmental and social perspectives [4]: In fact, the contribution of livestock farming to greenhouse gas (GHG) emissions and to worsening of animal welfare have become topics of utmost importance.
The livestock sector exerts a large influence on global GHG emissions, causing environmental impacts particularly relevant in areas with high density of livestock [5]. Livestock husbandries contribute to 35–40% of total anthropogenic methane emissions: Main sources are enteric fermentation (32%) and manure management (7%) [6]. Leaching nitrates, that livestock release into the environment, increases the nitrogen load of fields: major contributors are cattle farms (58%) [7].
The environmental impacts associated with the livestock sector are particularly relevant due to the increasing demand for animal-based foods: In 2050, consumption of meat and dairy produce are expected to increase by 73% and 58%, respectively [8]. The consequent intensification of livestock production raises environmental and ethical concerns [9]: As livestock density increases, animal welfare may be adversely affected, with negative consequences on quality and safety of their production. In fact, a conflicting relationship links welfare and livestock productivity: Intensive techniques for livestock production ensure cheaper animal-based products to the detriment of animal welfare, and vice-versa, the higher the welfare standards the higher the price of livestock production [3].
The term ‘welfare’ is not uniformly defined and used in the literature. According to Broom [10], welfare is a state of mental and physical health, where the animal is in harmony with its environment. The concept of animal welfare may be associated with the normal biological functioning of the animal, the emotional state of the animal, and the ability of the animal to express certain normal behaviours. Animal welfare is based on (but not restricted to) a set of principles, the ‘Five Freedoms of Animal Welfare’ developed by the UK Farm Animal Welfare Council (FAWC) in 1979: freedom from hunger and thirst; freedom from discomfort; freedom from pain, injury or disease; freedom to express normal behaviour; freedom from fear and distress [11,12].
Improving the sustainability of livestock production would contribute to mitigating environmental impacts in terms of GHG emissions (i.e., improvement of environmental sustainability), and ethical concerns such as problems of animal welfare (i.e., improvement of social sustainability). Policymakers respond to these concerns by developing policy instruments intended to ensure animal welfare. An example are farmer-based policies: They compensate livestock farmers for the incremental cost of ensuring higher animal welfare levels, in case of consumers’ low willingness to pay [13]. The aim of animal-based policies is to improve productive performances of livestock and to obtain animal-based foods that are safe and of higher quality. However, they may be related to wider environmental and social implications that merit case-specific assessments.
There is an urgent need to mitigate the environmental impacts by reducing agricultural, and in particular, livestock emissions, while also ensuring an efficient production respectful of the animals’ conditions. Animal-based policies seem to be a key solution to improve productivity and environmental performances at once: they may contribute to meeting the common European Energy and Animal Welfare Strategies [3].
Although animal welfare is relevant to improving the productivity of livestock and the profitability of the livestock sector, farmers raise increasing concerns on the lack of market compensation for extra costs related to higher levels of animal welfare. The issue is in the spotlight: In fact, the European Parliament approved a resolution on the need to adopt a new strategy for animal welfare for the period of 2016–2020, intended to ensure stricter and scientific-based regulations on animal welfare.
A number of recent studies deal with these issues from different points of view (Table 1). Overall, studies on the GHG emissions associated with the livestock sector conclude that the higher intensity of GHG emissions, at the farm stage of livestock products, compared to other food production [14,15,16,17]. In addition, it has been demonstrated that significant reductions in the GHG emissions intensities in livestock production are achievable through enhanced manure management, but also by improving the welfare status of animals [18,19,20]. In particular, Nieto et al. [21] assessed the GHG emission performances of beef production in Argentina and suggest that the GHG emissions are lower in farms with improved standards of animal welfare. Improving the welfare status of livestock is a way to ensure high production efficiency of livestock, while keeping the GHG emission intensity at the minimal level [22]. Also Pelletier et al. [4], who deepened on environmental and socio-economic sustainability of the Canadian egg production industry with a particular focus on animal welfare, recommend the development of management strategies to optimise production in alternative housing systems, able to ensure more environmentally sustainable outcomes.
While a number of studies have investigated the implications of animal welfare provisions on the environmental performance of the livestock sector, to the best of our knowledge none have analysed which factors affect the adoption of measures of animal welfare. We aimed to fill this gap by investigating if site-specific characteristics are able to influence the definition of the political line at a regional level, with consequent impacts on the decision to adopt measures of animal welfare and the magnitude of the related budget. Our focus is on Measure 215 of Rural Development Programmes (RDP) 2007–2013, applied to cattle farms in Italy. Measure 215, regulated by the Council Regulation (EC) No. 1698/2005 (Articles 36(aV) and 40), provided annual subsidies for livestock farmers that voluntary adopted standards to ensure animal welfare higher than mandatory requirements listed in the Council Regulation (EC) No. 1782/2003 (Article 4, Annex III). Measure 215 compensated livestock farmers for incremental costs, or losses of income, of ensuring higher animal welfare levels (e.g., improvement of housing conditions) for a period ranging between five and seven years. We also quantified the environmental impacts, in terms of methane and nitrous oxide emissions, associated with the adoption of Measure 215 in Italy, by providing regional and provincial details. We comment on technical and political considerations, and conclude on how the measure may conciliate environmental and ethical issues. Our contribution would be of interest for policymakers that are planning to implement animal-based policies.

2. Materials and Methods

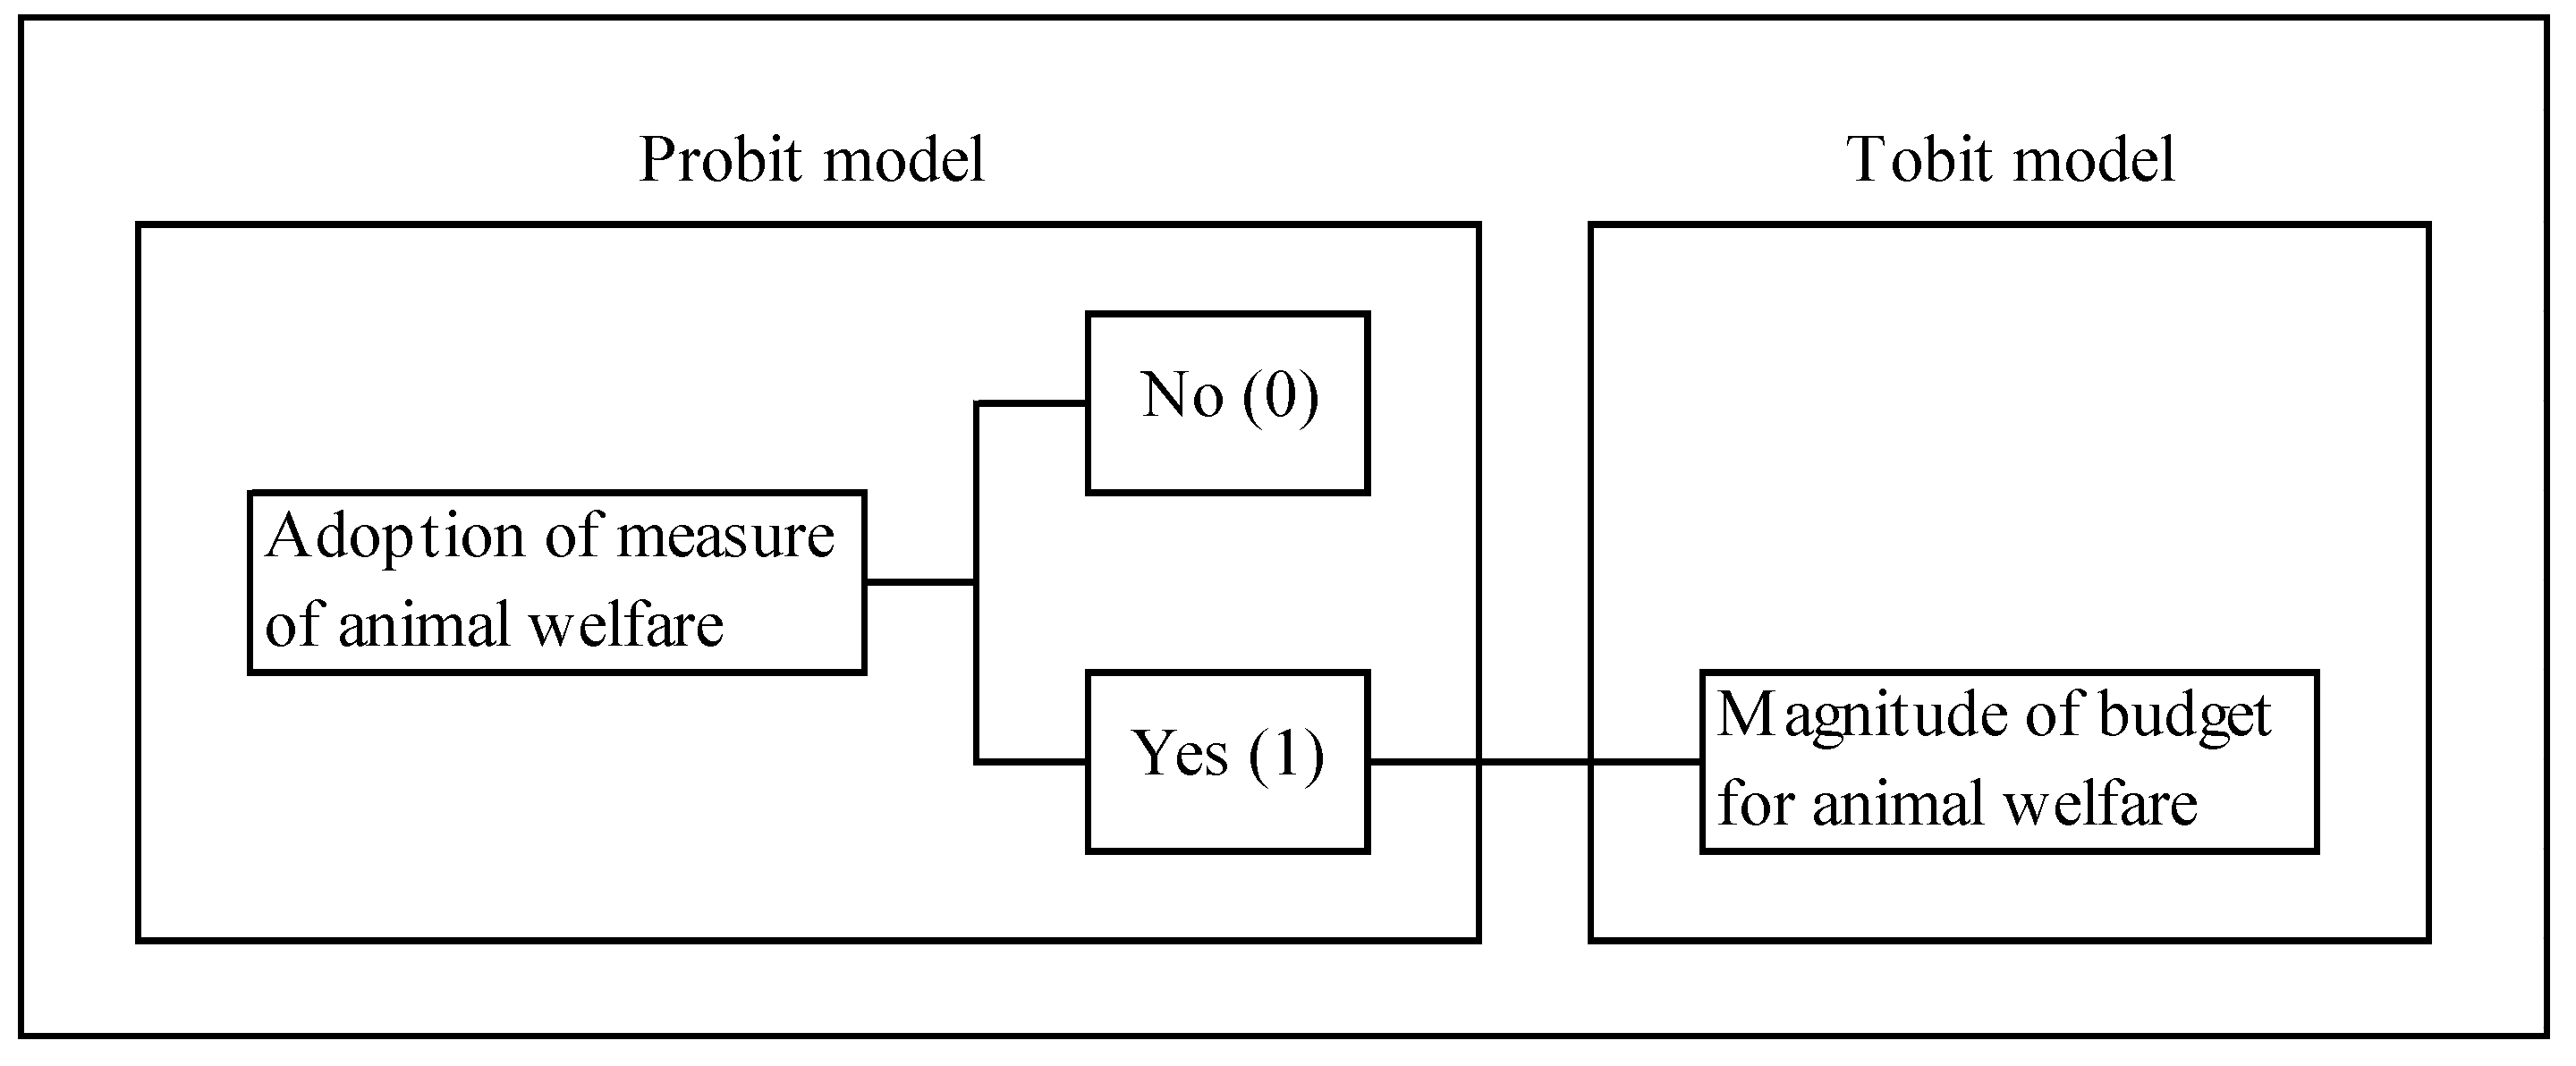
2.1. The Econometric Model

In order to investigate factors affecting the adoption and the magnitude of the budget allocated to measures of animal welfare (Measure 215), by regional Rural Development Programmes 2007–2013, we performed econometric analyses to assess how the characteristics specific for the i-th province in the j-th region influenced the decision to activate the Measure and the decision on budget allocation:
Y i j = α + β L U i j + γ U A A i j + k = 1 K δ k h e a d k , i j + ε i j
where the dependent variable ( Y i j ) is regressed on the province-specific livestock units ( L U i j ), and utilised agricultural area ( U A A i j ). We also controlled for K size classes of livestock ( h e a d k , i j ). β , γ , and δ k are the parameters to be estimated; α is a constant and ε i j an i.i.d. error term.
Equation (1) is estimated through a Probit model to address the research question on the decision to activate the Measure, and through a Tobit model to address the decision on budget allocation. We use the Probit model to identify the drivers affecting the probability of implementing measures of animal welfare (i.e., extensive margins of Measure 215). In addition, the Tobit model allowed us to investigate which factors influenced the magnitude of the budget allocated to animal welfare in regions where the measure was implemented (i.e., intensive margins of Measure 215).
In other words, the Probit model allowed us to understand which factors influence the probability that the measure of animal welfare is adopted (or not) in a certain region; given the adoption of the measure of animal welfare, the Tobit model helps in analysing how the budget for measure of animal welfare is allocated across regions (Figure 1).
The dependent variable ( Y i j ) is a dummy variable (Measure active or not) in the Probit model and a continuous left-censored variable (relative budget for the Measure, compared to the budget for the regional Rural Development Program) in the Tobit model. The dummy variable equals 1 if Measure 215 was implemented in the j-th region, and 0 otherwise. The dependent variable of the Tobit model equals the incidence of financial resources allocated for Measure 215 on the total budget of the European Agricultural Fund for Rural Development (EAFRD) in the j-th region.
The Probit model is estimated controlling for the work intensity for livestock, expressed as the ratio between livestock unit (LU) and annual working unit (AWU), and the number of farms that adopted organic production methods. The rationale is that the greater the work intensity for livestock, the more the attention to animal welfare. Similarly, provinces that attach more attention to organic production methods tend to be open to animal welfare issues.
We did not introduce these two control factors in the Tobit model: They are likely to be correlated to the probability that Measure 215 was adopted (or not) in a certain region, but they were not able to influence the relative budget for Measure 215.
In order to refine our models, we estimate five specifications using as independent variables different statistics of the distributions of LUs and UAA. The model using total LUs and UAA allowed us to have an overall assessment of factors affecting the adoption and the magnitude of the budget for Measure 215. Minimum, maximum, and average LUs and UAA, as well as the difference between maximum and minimum LUs and UAA help the understanding of the influence of province-specific characteristics in the definition of the political line at a regional level. It should be noted that the use of extreme statistics is necessary in that while dependent variables are regional-specific, the variability is provided by different values at the provincial level. Put differently, the model must capture the “within” variation (where the term “within” is specific of panel data econometric models). Table 2 lists and describes the dependent and independent variables.
We used cross-sectional data referring to 2010, due to the limited availability of data at regional and provincial levels. We collected information on 20 Italian regions and 107 provinces. Data were from the Italian database of the livestock registry (BDN) for LUs and size classes of livestock, from the 6th General Agricultural Census [26] for UAA, LU/AWU, and the number of farms with organic production methods. The official website of Rete Rurale Nazionale provides information on regional Rural Development Programmes (RDPs) from 2007–2013, on measures of animal welfare and the relative budget.

2.2. A Quantification of the Environmental Impacts

The livestock sector exerts a large influence on global greenhouse gas (GHG) emissions [25]: Livestock-related emissions mainly concern methane (CH4) and nitrous oxide (N2O) and, to a lower extent, carbon dioxide (CO2). CH4 emissions are a by-product of enteric fermentation and of manure management; N2O emissions come from manure management, and from manure applied to soil or left on pasture [29].
The higher the intensity of livestock units (LUs) per hectare of utilised agricultural area (UAA), the greater the environmental impacts in terms of CH4 and N2O emissions:
E I i j z = α ( L U i j U A A i j 1 ) E F z
where z indexes alternatively emissions of CH4 and N2O; the environmental impacts ( E I i j z ) depend on the livestock intensity ( L U i j U A A i j 1 ) in the i-th province in the j-th region, and on the implied emission factor ( E F z ) specific for CH4 and N2O; α is a constant measuring the degree of improvement of livestock intensity (in percentage) due to the adoption of Measure 215.
Data on E F z values depend on the region and the country average annual temperature. They are country-specific, refer to 2010, and are expressed in kg CH4 head−1 for CH4 and in kg N2O-N kg N−1 for N2O. Data were collected from the Faostat database, which uses Tier 1 default Intergovernmental Panel on Climate Change (IPCC) emission factors combined with country average annual temperatures.
Animal-based policies affecting livestock intensity are likely to influence both the levels of animal welfare and of GHG emissions. In fact, an improvement in livestock intensity may be achieved through a reduction of the number of LUs, being equal the UAA. Such a strategy is in line with the European Convention for the Protection of Animals kept for Farming Purposes, which outlines general principles intended to avoid unnecessary pain, suffering or injury due to unsustainable housing, environmental, and feeding conditions. But an approach based on the reduction of livestock numbers may also be beneficial for the sustainability of the environment. In fact, as suggested in Garnett [23], the lower the intensity of livestock, the higher the GHG saving: The trade-off consists in outweighing high emissions per unit through a significant reduction in numbers of units.
Accordingly, we assume that the environmental impacts ( E I i j z ) depend on the degree of improvement of livestock intensity, achievable through a progressive, linear decrease ( α ) in the ratio L U i j U A A i j 1 . We quantified these effects by measuring how the environmental impacts vary according to different levels of improvement in livestock intensity. In particular, we considered five scenarios and assessed the environmental impacts at a national level related to a progressive decrease of the livestock intensity, with α ranging between −10% and −50%.

3. Results

3.1. Regression Results

The results of Probit and Tobit estimations are in Table 3 and Table 4 respectively. Each model considers five specifications according to the type of independent variables: total livestock units (LUs) and utilised agricultural area (UAA) (columns A), minimum (columns B), maximum (columns C), and average (columns D) LUs and UAA for each region, difference between maximum and minimum LUs and UAA in each region (columns E).
Considering the drivers for the adoption of measures of animal welfare at a regional level (Table 3), we found a positive significant coefficient for ‘LU (min)’ (0.0487) and negative significant coefficients for ‘UAA’ (−0.0047), ‘UAA (max)’ (−0.0035), and ‘UAA (max-min)’ (−0.0049). Similarly, negative significant coefficients were estimated for ‘More than 500 heads’.
The results suggest that the higher the LUs in the province with the minimum LUs in a certain region, the higher the likelihood of adopting a measure of animal welfare in that region. In addition, it was more likely that a measure of animal welfare was adopted in regions where UAA in the province, with the maximum UAA in a certain region, or the region-specific difference between the provinces with the minimum and maximum UAA tended to be low. The minimum LUs and maximum UAA are proxies of the intensity of LUs per hectare of UAA in a region: If LUs are high in the province with the minimum LUs in a region, or UAA was low in the province with the maximum UAA in a region, the intensity of LUs per hectare of UAA was more relevant for that region.
The rationale is that the problem of animal welfare is highly perceived in regions with great numbers of LUs or with limited UAA. In other words, a measure of animal welfare tends to be adopted in regions with high intensity of LUs per hectare of UAA.
In addition, a positive relation links the adoption of measures of animal welfare with both ‘LU/AWU’ and ‘Organic’. Provinces that attached more attention to organic production methods tended to be open to animal welfare issues. The results also reveal that the greater the work intensity for livestock (LU/AWU), the more the attention to animal welfare.
As for the analysis of factors affecting the magnitude of the budget allocated to measures of animal welfare (Measure 215) by regional Rural Development Programmes 2007–2013 (Table 4), positive significant coefficients were estimated for ‘UAA’ (0.00059), ‘UAA (min)’ (0.00108), and ‘UAA (mean)’ (0.00142). Similarly we found a positive significant coefficient for ‘LU (min)’ (0.00715). As for size classes of livestock, positive (negative) significant coefficients were estimated for ‘100–499 heads’ (‘More than 500 heads’) in one out of five model specifications (Table 4, column B).
Given the adoption of the measure of animal welfare, more budget tended to be allocated in regions where LUs were particularly high, that is, LUs were relevant in the province with the minimum LUs in a certain region. It is not surprising that regions where the problem of animal welfare is emphasised (i.e., high intensity of LUs) need more financial resources to face the problem.
Similarly, having a great UAA contributed to increasing the budget allocated for animal welfare. This was particularly true in regions where UAA was high in the province with the minimum UAA. This evidence highlights the bargaining position of regions with higher propensity to the agricultural sector.

3.2. Environmental Impacts Assessment

The assessment of environmental impacts, in terms of methane (CH4) and nitrous oxide (N2O) emissions, related to cattle in each Italian region is in Table 5. In 2010, cattle livestock in Italy produced emissions equal to 68.205 kg CH4 ha−1 and 0.022 kg N2O-N kg N−1 * head ha−1.
The top 5 most impacting regions were Lombardy (218.426 kg CH4 ha−1 and 0.071 kg N2O-N kg N−1 * head ha−1), Veneto (144.081 kg CH4 ha−1 and 0.047 kg N2O-N kg N−1 * head ha−1), Campania (117.294 kg CH4 ha−1 and 0.038 kg N2O-N kg N−1 * head ha−1), Piedmont (116.865 kg CH4 ha−1 and 0.038 kg N2O-N kg N−1 * head ha−1), and Aosta Valley (93.371 kg CH4 ha−1 and 0.030 kg N2O-N kg N−1 * head ha−1). Differently from Lombardy region, however, Veneto, Campania, Piedmont, and Aosta Valley adopted Measure 215 on animal welfare under their Rural Development Programmes (RDPs) 2007–2013 [28].
In order to examine the extent to which animal-based policies were able to affect the environment, we quantified the impacts, in terms of CH4 and N2O emissions, associated with different improved levels of animal welfare (Table 6). For the sake of argument, we considered five scenarios and assessed the environmental impacts at a national level related to a progressive decrease of the livestock intensity, with α ranging between −10% and −50%. Accordingly, and on the basis of equation (2), the reduction of livestock units (LUs) being equal the utilised agricultural area (UAA) reduced CH4 and N2O emissions: The greater the improvement of livestock intensity, the higher the greenhouse gas (GHG) saving.
However, the environmental impacts were larger with lower improvements of livestock intensity: For instance, the impacts were twice lower moving from −10% to −20% of livestock intensity, but only 1.3 times lower from −30% to −40% or from −40% to −50% (Table 6). Consider a livestock intensity equal to 0.1 head ha−1 (say 10 heads per 100 hectares of UAA), a 10% reduction in livestock intensity (say 9 heads per 100 hectares of UAA) would reduce methane emissions by 6.821 kg CH4 ha−1 and nitrous oxide emissions by 0.002 kg N2O-N kg N per head ha−1.

4. Discussion and Conclusions

Our analysis is an ex post assessment of animal-based policies, such as Measure 215 of the Rural Development Programmes (RDP) 2007–2013, intended to ensure higher levels of animal welfare.
The results highlighted that the problem of animal welfare is highly perceived in regions with high density of livestock: thus it is more likely that animal-based policies are adopted in regions with greater environmental impacts.
We also found that, once Measure 215 had been adopted, financial resources tended to be allocated in regions where the problem of animal welfare is emphasised or where the high propensity to the agricultural sector drives the bargaining position of those regions.
It is worth mentioning that, in our sample, Measure 215 tended to be adopted by regions with particularly relevant environmental impacts, such as Veneto, Campania, Piedmont, and Aosta Valley. Our results are in line with Pereira and Martinho [31], who argued that the emission performance of policies is highly differentiated and site-specific. Information on agricultural emissions at the regional level may be important indicators to assess whether the demands for emissions reduction targets, set by government, are likely to be met [25,32].
Measure 215 is thought to ensure higher levels of animal welfare preserving efficiency and quality of animal-based production. In particular, the measure gives specific attention to the development in housing conditions: Iif implemented, Measure 215 aims to ensure higher housing areas. At the farm level, a potential strategy to improve the housing areas is to reduce the number of heads, leaving farm sizes unchanged. However, such a strategy has implications on the environment that should not be neglected: In fact, livestock are major contributors of methane and nitrous oxide emissions [7].
A policy measure, that aims to increase the housing areas by reducing the number of heads while keeping constant the size of the farms, allows a reduction of environmental impacts in terms of methane and nitrous oxide emissions. In fact, our analysis shows the reduction of livestock numbers lead to genuine GHG benefits, as also suggested in Garnett [20]. We found coherence between animal-based policies and other greening requirements of the Common Agricultural Policy (CAP). As suggested in Solazzo and Pierangeli [33], greening measures have limited environmental impacts. In particular, in line with previous literature, we found that Measure 215 contributed to reduce nitrogen [34] and greenhouse gas emissions [35].
Given the increasing environmental and ethical concerns related to the livestock sector, policymakers should enable regional-scale strategies and include specific voluntary measures in their national planning context to contribute to the improvement of animal welfare, as well as to the reduction of GHG emissions.

Author Contributions

Conceptualization, F.G.S. and L.D.G.; Methodology, F.G.S., E.L. and M.T.; Data Curation, M.T.; Software, Writing—Original Draft Preparation, E.L.; Supervision, F.G.S. and L.D.G.

Funding

This research received no external funding.

Acknowledgments

The authors would like to thank the anonymous referees and the editor for their suggestions that contributed to a substantial improvement of this article.

Conflicts of Interest

The authors declare no conflict of interest.

References

  1. Tricase, C.; Lamonaca, E.; Ingrao, C.; Bacenetti, J.; Lo Giudice, A. A comparative Life Cycle Assessment between organic and conventional barley cultivation for sustainable agriculture pathways. J. Clean. Prod. 2018, 172, 3747–3759. [Google Scholar]
  2. Harchaoui, S.; Chatzimpiros, P. Reconstructing production efficiency, land use and trade for livestock systems in historical perspective. The case of France, 1961–2010. Land Use Policy 2017, 67, 378–386. [Google Scholar]
  3. Gaudino, S.; Reidsma, P.; Kanellopoulos, A.; Sacco, D.; van Ittersum, M. Integrated Assessment of the EU’s Greening Reform and Feed Self-Sufficiency Scenarios on Dairy Farms in Piemonte, Italy. Agriculture 2018, 8, 137. [Google Scholar]
  4. Pelletier, N.; Doyon, M.; Muirhead, B.; Widowski, T.; Nurse-Gupta, J.; Hunniford, M. Sustainability in the Canadian Egg Industry—Learning from the Past, Navigating the Present, Planning for the Future. Sustainability 2018, 10, 3524. [Google Scholar]
  5. Vitousek, P.M.; Naylor, R.; Crews, T.; David, M.B.; Drinkwater, L.E.; Holland, E.; Johnes, P.J.; Katzenberger, J.; Martinelli, L.A.; Matson, P.A.; et al. Nutrient imbalances in agricultural development. Science 2009, 324, 1519–1520. [Google Scholar]
  6. UESPA. Global Anthropogenic Non-CO2 Greenhouse Gas Emissions: 1990–2020; EPA: Washington, DC, USA, 2006.
  7. Steinfeld, H.; Gerber, P.; Wassenaar, T.; Castel, V.; de Haan, C. Livestock’s Long Shadow: Environmental Issues and Options; Food and Agriculture Organization of the United Nations: Rome, Italy, 2006. [Google Scholar]
  8. FAO. World Livestock 2011-Livestock in Food Security; Food and Agriculture Organization of the United Nations: Rome, Italy, 2011. [Google Scholar]
  9. da Silva, J.G.; Ruviaro, C.F.; de Souza Ferreira Filho, J.B. Livestock intensification as a climate policy: Lessons from the Brazilian case. Land Use Policy 2017, 62, 232–245. [Google Scholar]
  10. Broom, D.M. Indicators of poor welfare. Br. Vet. J. 1986, 142, 524–526. [Google Scholar] [PubMed]
  11. Mellor, D.J. Updating animal welfare thinking: Moving beyond the “Five Freedoms” to “A Life worth Living”. Animals 2016, 6, 21. [Google Scholar]
  12. Webster, J. Animal Welfare: Freedoms, Dominions and “A Life Worth Living”. Animals 2016, 6, 35. [Google Scholar]
  13. Schulte, H.D.; Armbrecht, L.; Bürger, R.; Gauly, M.; Musshoff, O.; Hüttel, S. Let the cows graze: An empirical investigation on the trade-off between efficiency and farm animal welfare in milk production. Land Use Policy 2018, 79, 375–385. [Google Scholar]
  14. Cederberg, C.; Stadig, M. System expansion and allocation in life cycle assessment of milk and beef production. Int. J. Life Cycle Assess. 2003, 8, 350–356. [Google Scholar]
  15. Casey, J.W.; Holden, N.M. Quantification of GHG emissions from sucker-beef production in Ireland. Agric. Syst. 2006, 90, 79–98. [Google Scholar]
  16. Lovett, D.K.; Shalloo, L.; Dillon, P.; O’Mara, F.P. A systems approach to quantify greenhouse gas fluxes from pastoral dairy production as affected by management regime. Agric. Syst. 2006, 88, 156–179. [Google Scholar]
  17. Edwards-Jones, G.; Plassmann, K.; York, E.H.; Hounsome, B.; Jones, D.L.; Canals, L.M. Vulnerability of exporting nations to the development of a carbon label in the United Kingdom. Environ. Sci. Policy 2009, 12, 479–490. [Google Scholar]
  18. Pelletier, N.; Ibarburu, M.; Xin, H. Comparison of the environmental footprint of the egg industry in the United States in 1960 and 2010. Poult. Sci. 2014, 93, 241–255. [Google Scholar]
  19. Tallentire, C.W.; Leinonen, I.; Kyriazakis, I. Breeding for efficiency in the broiler chicken. A review. Agron. Sustain. Dev. 2016, 36, 66. [Google Scholar]
  20. Tallentire, C.W.; Leinonen, I.; Kyriazakis, I. Artificial selection for improved energy efficiency is reaching its limits in broiler chickens. Sci. Rep. 2018, 8, 116. [Google Scholar]
  21. Nieto, M.; Barrantes, O.; Privitello, L.; Reiné, R. Greenhouse Gas Emissions from Beef Grazing Systems in Semi-Arid Rangelands of Central Argentina. Sustainability 2018, 10, 4228. [Google Scholar]
  22. Place, S.E.; Mitloehner, F.M. The nexus of environmental quality and livestock welfare. Annu. Rev. Anim. Biosci. 2014, 2, 555–569. [Google Scholar]
  23. Garnett, T. Livestock-related greenhouse gas emissions: impacts and options for policy makers. Environ. Sci. Policy 2009, 12, 491–503. [Google Scholar]
  24. Havlík, P.; Valin, H.; Mosnier, A.; Obersteiner, M.; Baker, J.S.; Herrero, M.; Rufino, M.C.; Schmid, E. Crop productivity and the global livestock sector: Implications for land use change and greenhouse gas emissions. Am. J. Agric. Econ. 2012, 95, 442–448. [Google Scholar]
  25. Feliciano, D.; Slee, B.; Hunter, C.; Smith, P. Estimating the contribution of rural land uses to greenhouse gas emissions: A case study of North East Scotland. Environ. Sci. Policy 2013, 25, 36–49. [Google Scholar]
  26. ISTAT. 6° Censimento Generale dell’Agricoltura. ATLANTE DELL’AGRICOLTURA ITALIANA. Available online: www.istat.it/ (accessed on 23 September 2018).
  27. BDN. Banca Dati Nazionale dell’Anagrafe Zootecnica. Available online: http://statistiche.izs.it/portal/page?_pageid=73,12918&_dad=portal (accessed on 23 September 2018).
  28. Rete Rurale Nazionale. Available online: www.reterurale.it/ (accessed on 5 March 2019).
  29. Llonch, P.; Haskell, M.J.; Dewhurst, R.J.; Turner, S.P. Current available strategies to mitigate greenhouse gas emissions in livestock systems: An animal welfare perspective. Animal 2017, 11, 274–284. [Google Scholar] [PubMed]
  30. Faostat. Emissions data. Available online: www.fao.org/faostat/en/#data (accessed on 9 January 2019).
  31. Pereira, V.J.; Martinho, D. Insights from over 30 years of common agricultural policy in Portugal. Outlook Agric. 2017, 46, 223–229. [Google Scholar]
  32. Santeramo, F.G.; Searle, S. Linking soy oil demand from the US Renewable Fuel Standard to palm oil expansion through an analysis on vegetable oil price elasticities. Energy Policy 2019, 127, 19–23. [Google Scholar]
  33. Solazzo, R.; Pierangeli, F. How does greening affect farm behaviour? Trade-off between commitments and sanctions in the northern Italy. Agric. Syst. 2016, 149, 88–98. [Google Scholar]
  34. Cortignani, R.; Dono, G. Agricultural policy and climate change: an integrated assessment of the impacts on an agricultural area of Southern Italy. Environ. Sci. Policy 2018, 81, 26–35. [Google Scholar]
  35. Solazzo, R.; Donati, M.; Tomasi, L.; Arfini, F. How effective is greening policy in reducing GHG emissions from agriculture? Evidence from Italy. Sci. Total Environ. 2016, 573, 1115–1124. [Google Scholar] [PubMed]
Figure 1. The rational of the empirical specifications.
Sustainability 11 02316 g001
Table 1. A synthetic outline of the literature on the environmental and social issues related to the livestock sector.
ReferencesTopicSubject
Gaudino et al. [3]Livestock sector as relevant contributor of GHG emissionsCattle, Italy
Pelletier et al. [4]Methods to improve environmental/social sustainability of livestockPoultry, Canada
Vitousek et al. [5]Correlation between livestock density and GHG emissionsLivestock
Steinfeld et al. [7]Livestock sector as relevant contributor of GHG emissionsLivestock
da Silva et al. [9]Livestock intensification and environmental/social concernsLivestock, Brazil
Cederberg and Stadig [14]GHG emissions of livestock higher than other agricultural sectorsCattle, Sweden
Casey and Holden [15]GHG emissions of livestock higher than other agricultural sectorsCattle, Ireland
Lovett et al. [16]GHG emissions of livestock higher than other agricultural sectorsCattle, Ireland
Pelletier et al. [18]Methods to improve environmental sustainability of livestockPoultry, United States
Tallentire et al. [19]Methods to improve environmental sustainability of livestockPoultry
Tallentire et al. [20]Methods to improve environmental sustainability of livestockPoultry
Nieto et al. [21]Correlation between animal welfare and environmental impactsCattle, Argentina
Garnett [23]Correlation between livestock density and GHG emissionsLivestock
Havlík et al. [24]Livestock sector as relevant contributor of GHG emissionsLivestock
Feliciano et al. [25]Livestock sector as relevant contributor of GHG emissionsLivestock, United Kingdom
Table 2. List of dependent and independent variables: descriptive statistics.
VariableDescriptionUnitMeanStd. dev.MinMax
Dependent variables
Adoption of measure of animal welfareMeasure of animal welfare in force in 20100/10.6070.4910.0001.000
Budget for animal welfareIncidence of budget for measure of animal welfare on EAFRD budget 2007–2013mln €0.0610.1670.0000.800
Independents variables
LULivestock units of cattlemln head0.0580.0810.0010.447
LU (min)Minimum LUs by regionmln head0.0110.0100.0010.045
LU (max)Maximum LUs by regionmln head0.1520.1510.0050.447
LU (mean)Average LUs by regionmln head0.0580.0410.0040.126
LU (max-min)Difference between maximum and minimum LUs by regionmln head0.1410.1520.0000.439
UAAUtilised agricultural areamln ha0.1200.0830.0020.495
UAA (min)Minimum UAA by regionmln ha0.0520.0480.0020.210
UAA (max)Maximum UAA by regionmln ha0.2180.0940.0130.495
UAA (mean)Average UAA by regionmln ha0.1200.0520.0110.260
UAA (max-min)Difference between maximum and minimum UAA by regionmln ha0.1660.0780.0000.389
1–19 headsNumber of farms with 1–19 headsnumber864.505893.27929.0006159.000
20–99 headsNumber of farms with 20–99 headsnumber373.953408.6327.0002407.000
100–499 headsNumber of farms with 100–499 headsnumber117.065218.6580.0001386.000
More than 500 headsNumber of farms with more than 500 headsnumber10.23425.5870.000165.000
LU/AWUWork intensity for livestocknumber32.36525.7214.800120.000
OrganicNumber of farms with organic production methodsnumber77.84995.9811.000609.000
Source: elaboration on Istat [26], BDN [27], and Rete Rurale Nazionale [28]. Notes: descriptive statistics refer to the Italian provinces in 2010.
Table 3. Results of the Probit estimation.
Adoption of Measure of Animal Welfare
VARIABLESABCDE
LU0.0136
(0.0171)
UAA−0.0047*
(0.0024)
LU (min) 0.0487**
(0.0213)
UAA (min) −0.0071
(0.0045)
LU (max) 0.0005
(0.0010)
UAA (max) −0.0035**
(0.0017)
LU (mean) 0.0048
(0.0038)
UAA (mean) −0.0031
(0.0030)
LU (max-min) 0.0009
(0.0011)
UAA (max-min) −0.0049**
(0.0021)
1–19 heads0.1620 0.0338 0.1590 0.2150 0.1410
(0.3130) (0.3070) (0.2840) (0.2830) (0.2840)
20–99 heads−1.0100 −0.7440 −0.3810 −0.6530 −0.3950
(1.1000) (0.8750) (0.8610) (0.8480) (0.8590)
100–499 heads−0.1920 3.1900 2.3100 2.3300 2.5600
(4.0600) (2.2700) (2.1500) (2.1500) (2.1100)
More than 500 heads−45.3000**−37.3000**−32.4000**−33.6000**−34.2000**
(23.1000) (18.3000) (16.5000) (16.9000) (16.7000)
LU/AWU18.1000**13.4000) 14.6000*14.3000*13.9000*
(8.4900) (8.3100) (8.1600) (8.1500) (8.2000)
Organic7.4500**5.8700**5.5900**6.2000**4.2200*
(2.9400) (2.8600) (2.5900) (2.8300) (2.3800)
Constant−308.0000 −463.0000 164.0000 −401.0000 298.0000
(314.0000) (318.0000) (450.0000) (407.0000) (463.0000)
Observations106 106 106 106 106
Robust standard errors are in parentheses. ***, **, and * indicate statistical significance at 1%, 5%, and 10%. Notes: Coefficients are on the order of 10−3. Acronyms are livestock unit (LU), utilised agricultural area (UAA), annual working unit (AWU).
Table 4. Results of the Tobit estimation.
Budget for Animal Welfare
VariablesABCDE
LU0.00003
0.00111
UAA0.00059*
0.00035
LU (min) 0.00715**
0.00298
UAA (min) 0.00108*
0.00061
LU (max) −0.00023
0.00019
UAA (max) 0.00008
0.00028
LU (mean) −0.00025
0.00065
UAA (mean) 0.00142***
0.00046
LU (max-min) −0.00013
0.00021
UAA (max-min) −0.00053
0.00038
1–19 heads0.03320 0.00143 0.03260 0.04270 0.01810
0.04340 0.04070 0.04360 0.04030 0.04350
20–99 heads−0.07100 −0.12700 −0.00369 −0.10500 0.02480
0.14600 0.12400 0.13400 0.12700 0.13000
100–499 heads0.16100 0.45900*0.19300 0.27300 0.22000
0.35400 0.27500 0.29700 0.27600 0.29900
More than 500 heads−2.82000 −4.14000*−2.30000 −2.55000 −2.89000
2.57000 2.29000 2.30000 2.19000 2.38000
Constant−73.90000*−102.00000***−19.70000 −163.00000***71.50000
43.20000 35.70000 65.40000 60.60000 63.80000
Sigma217.00000***193.00000***221.00000***205.00000***220.00000***
19.80000 17.80000 20.20000 18.80000 20.00000
Observations107 107 107 107 107
Robust standard errors are in parentheses. ***, **, and * indicate statistical significance at 1%, 5%, and 10%. Notes: Coefficients are of the order of 10−3. Acronyms are livestock unit (LU), utilised agricultural area (UAA).
Table 5. Environmental impacts related to cattle in Italy: detail by regions.
RegionMeasure of Animal WelfareEnvironmental Impacts
Methane EmissionsNitrous Oxide Emissions
(kg CH4 ha−1)(kg N2O-N kg N−1 per head ha−1)
AbruzzoNo22.7040.007
BasilicataNo26.0100.008
CalabriaYes30.1510.010
CampaniaYes117.2940.038
Emilia-RomagnaYes75.0550.024
Friuli-Venezia GiuliaNo61.3510.020
LazioYes66.6570.022
LiguriaYes48.2550.016
LombardyNo218.4260.071
MarcheYes18.4360.006
MoliseNo34.8380.011
PiedmontYes116.8650.038
ApuliaNo20.3450.007
SardiniaYes32.8720.011
SicilyNo36.3610.012
TuscanyYes17.5620.006
Trentino Alto AdigeNo68.9210.022
UmbriaYes27.2510.009
Aosta ValleyYes93.3710.030
VenetoYes144.0810.047
Italy 68.2050.022
Source: elaboration on Istat [26], BDN [27], Rete Rurale Nazionale [28], and Faostat [30]. Notes: elaborations refer to 2010.
Table 6. Environmental impacts related to cattle in Italy.
Degree of Improvement of Livestock IntensityEnvironmental Impacts
Methane EmissionsNitrous Oxide Emissions
(kg CH4 ha−1)(kg N2O-N kg N−1 per head ha−1)
−10%−6.821−0.002
−20%−13.641−0.004
−30%−20.462−0.007
−40%−27.282−0.009
−50%−34.103−0.011
Source: elaboration on Istat [26], BDN [27], and Faostat [30]. Notes: Elaborations refer to 2010.

