Evaluation of Vegetation Restoration along an Expressway in a Cold, Arid, and Desertified Area of China

Abstract
:1. Introduction
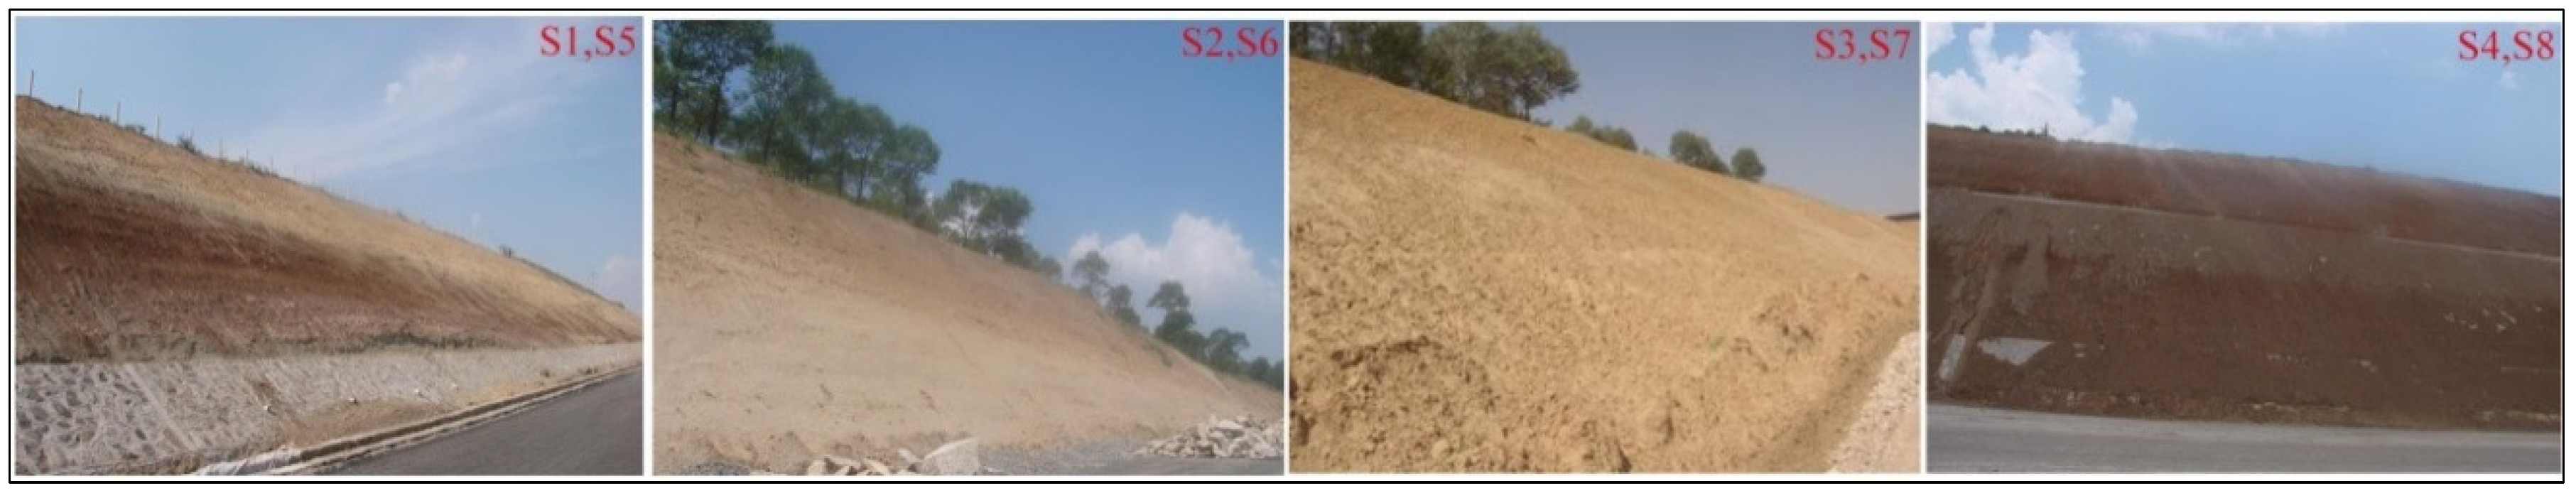
2. Study Sites
3. Materials and Methods
3.1. Experimental Design
3.2. Soil Sample Collection
3.3. Determination of Soil Physical Properties
3.3.1. Total Soil Porosity
3.3.2. Volume Weight of The Soil
3.3.3. Soil Organic Matter
3.3.4. Soil Erosion
3.3.5. Evaluation of Benefits of Soil and Water Conservation of Different Treatments by the GCM
3.4. Statistical Analysis
4. Results and Discussion
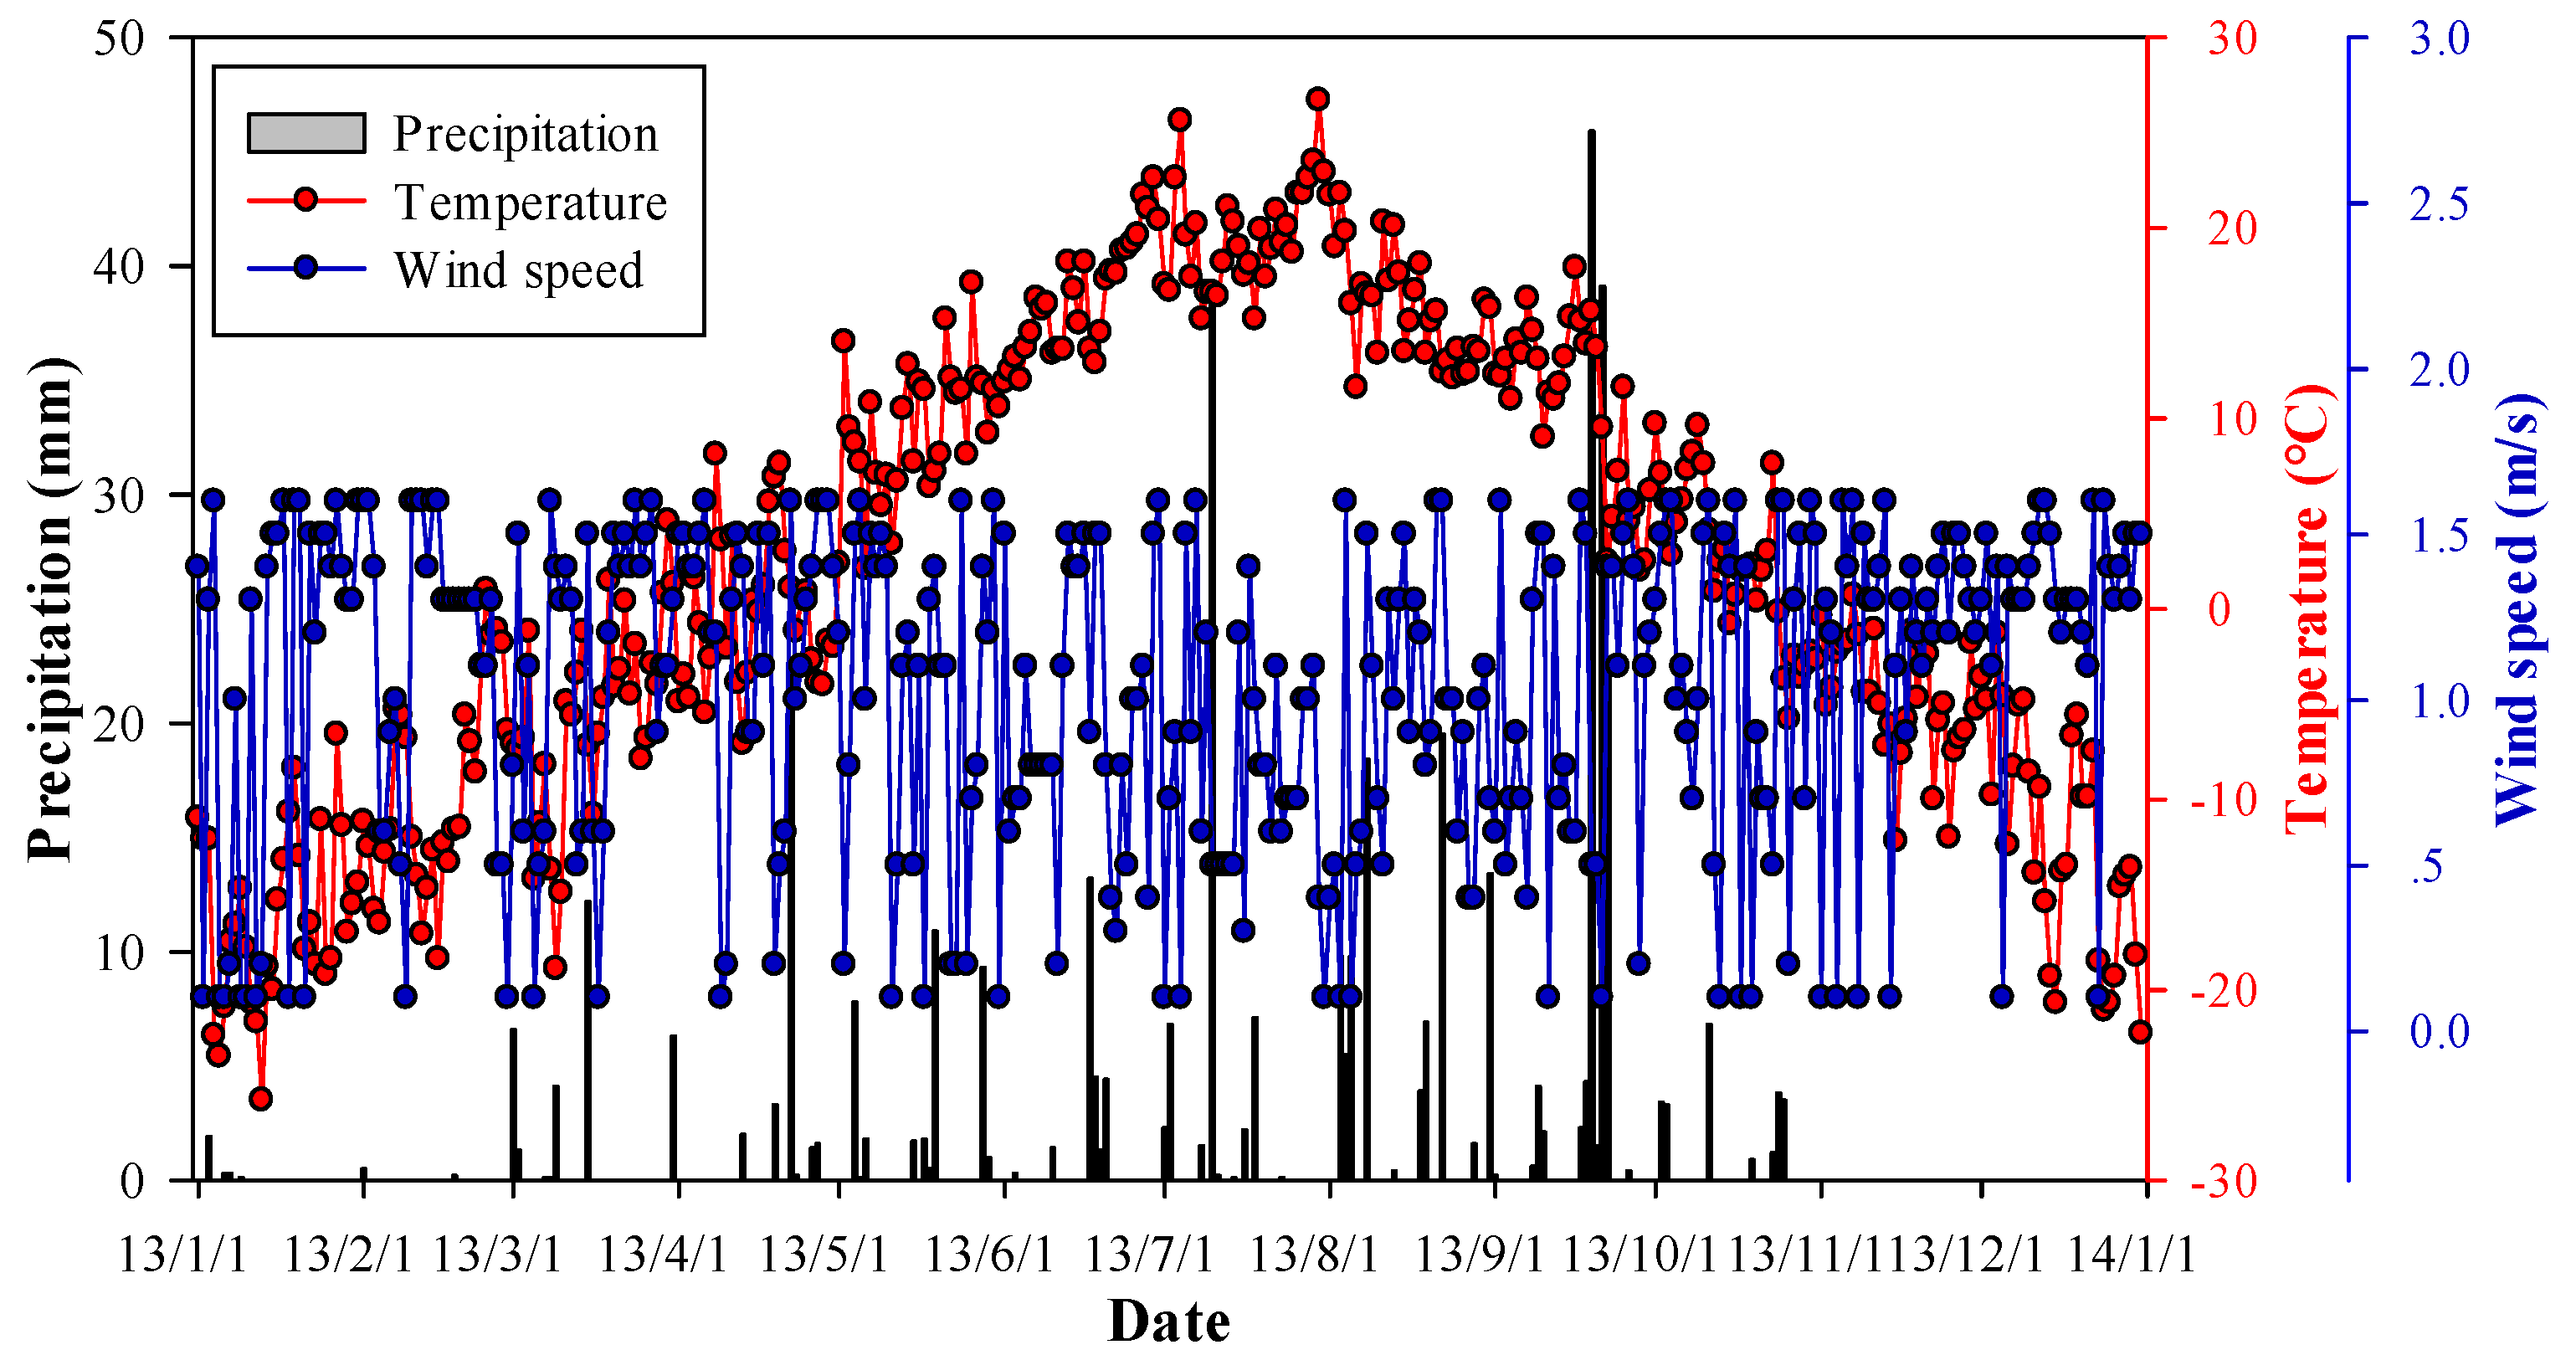
4.1. Basic Meteorological Characteristics
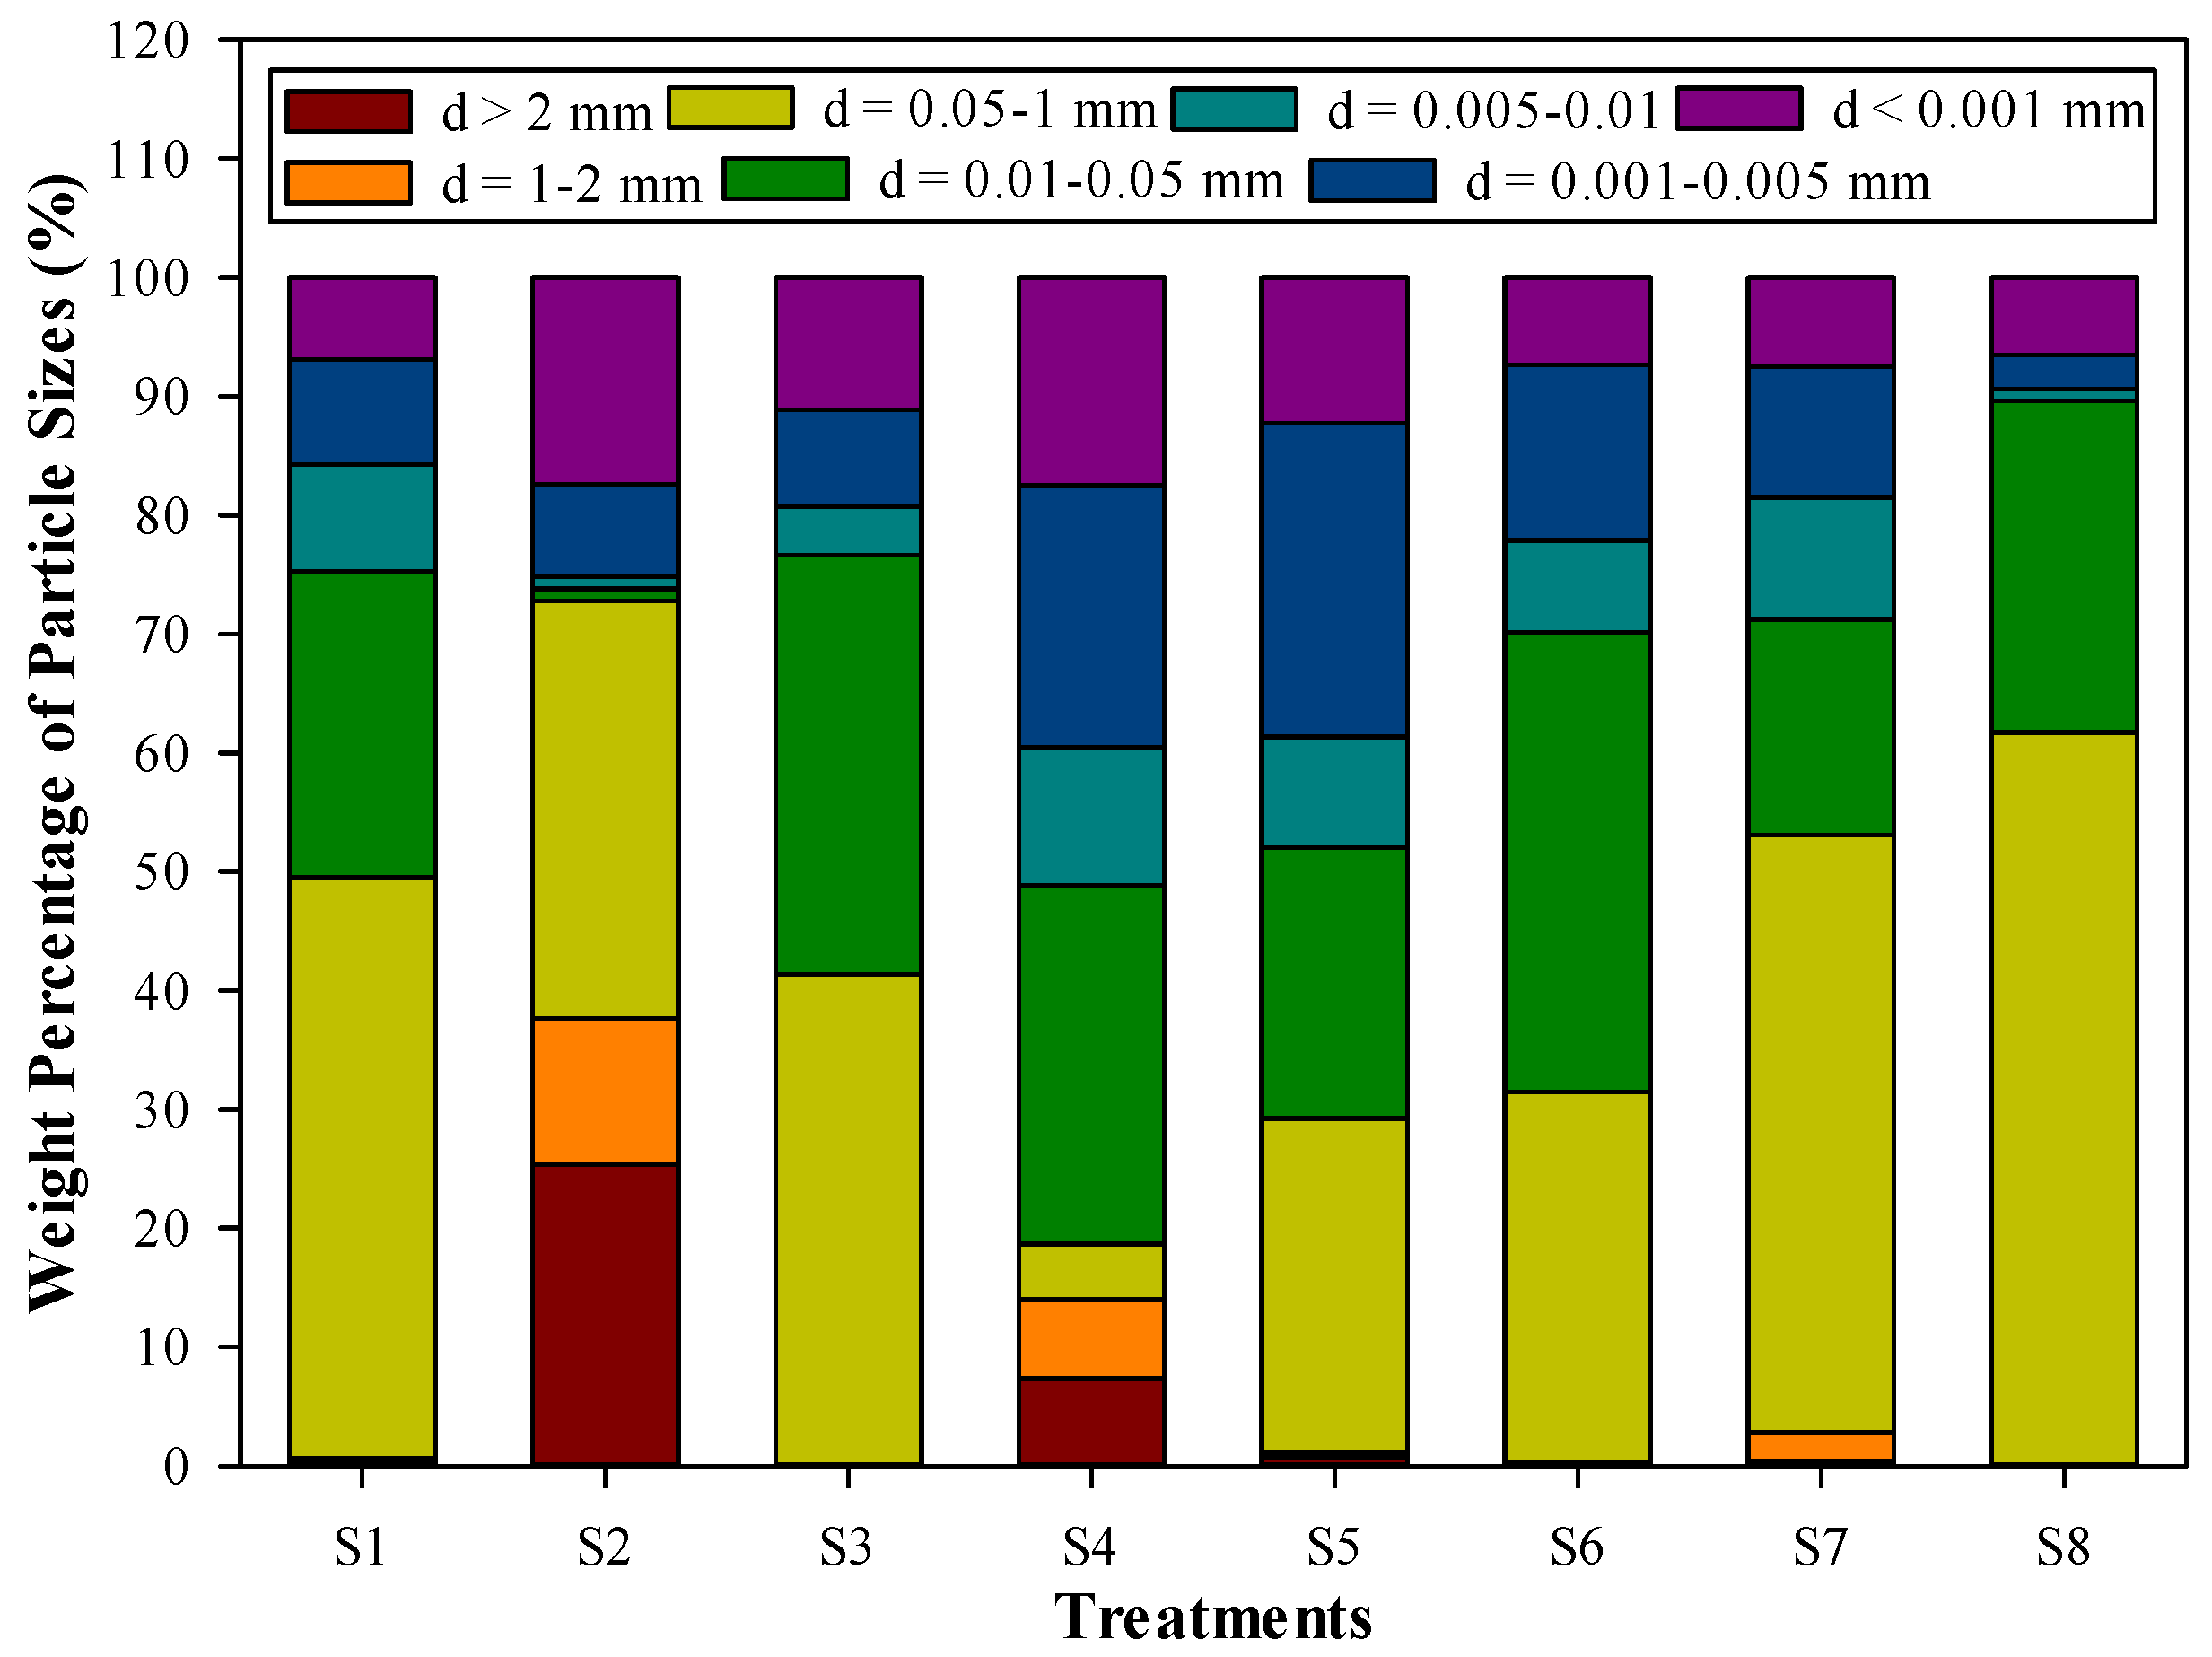
4.2. Weight Percentage of Soil Particle Size Under Different Treatments
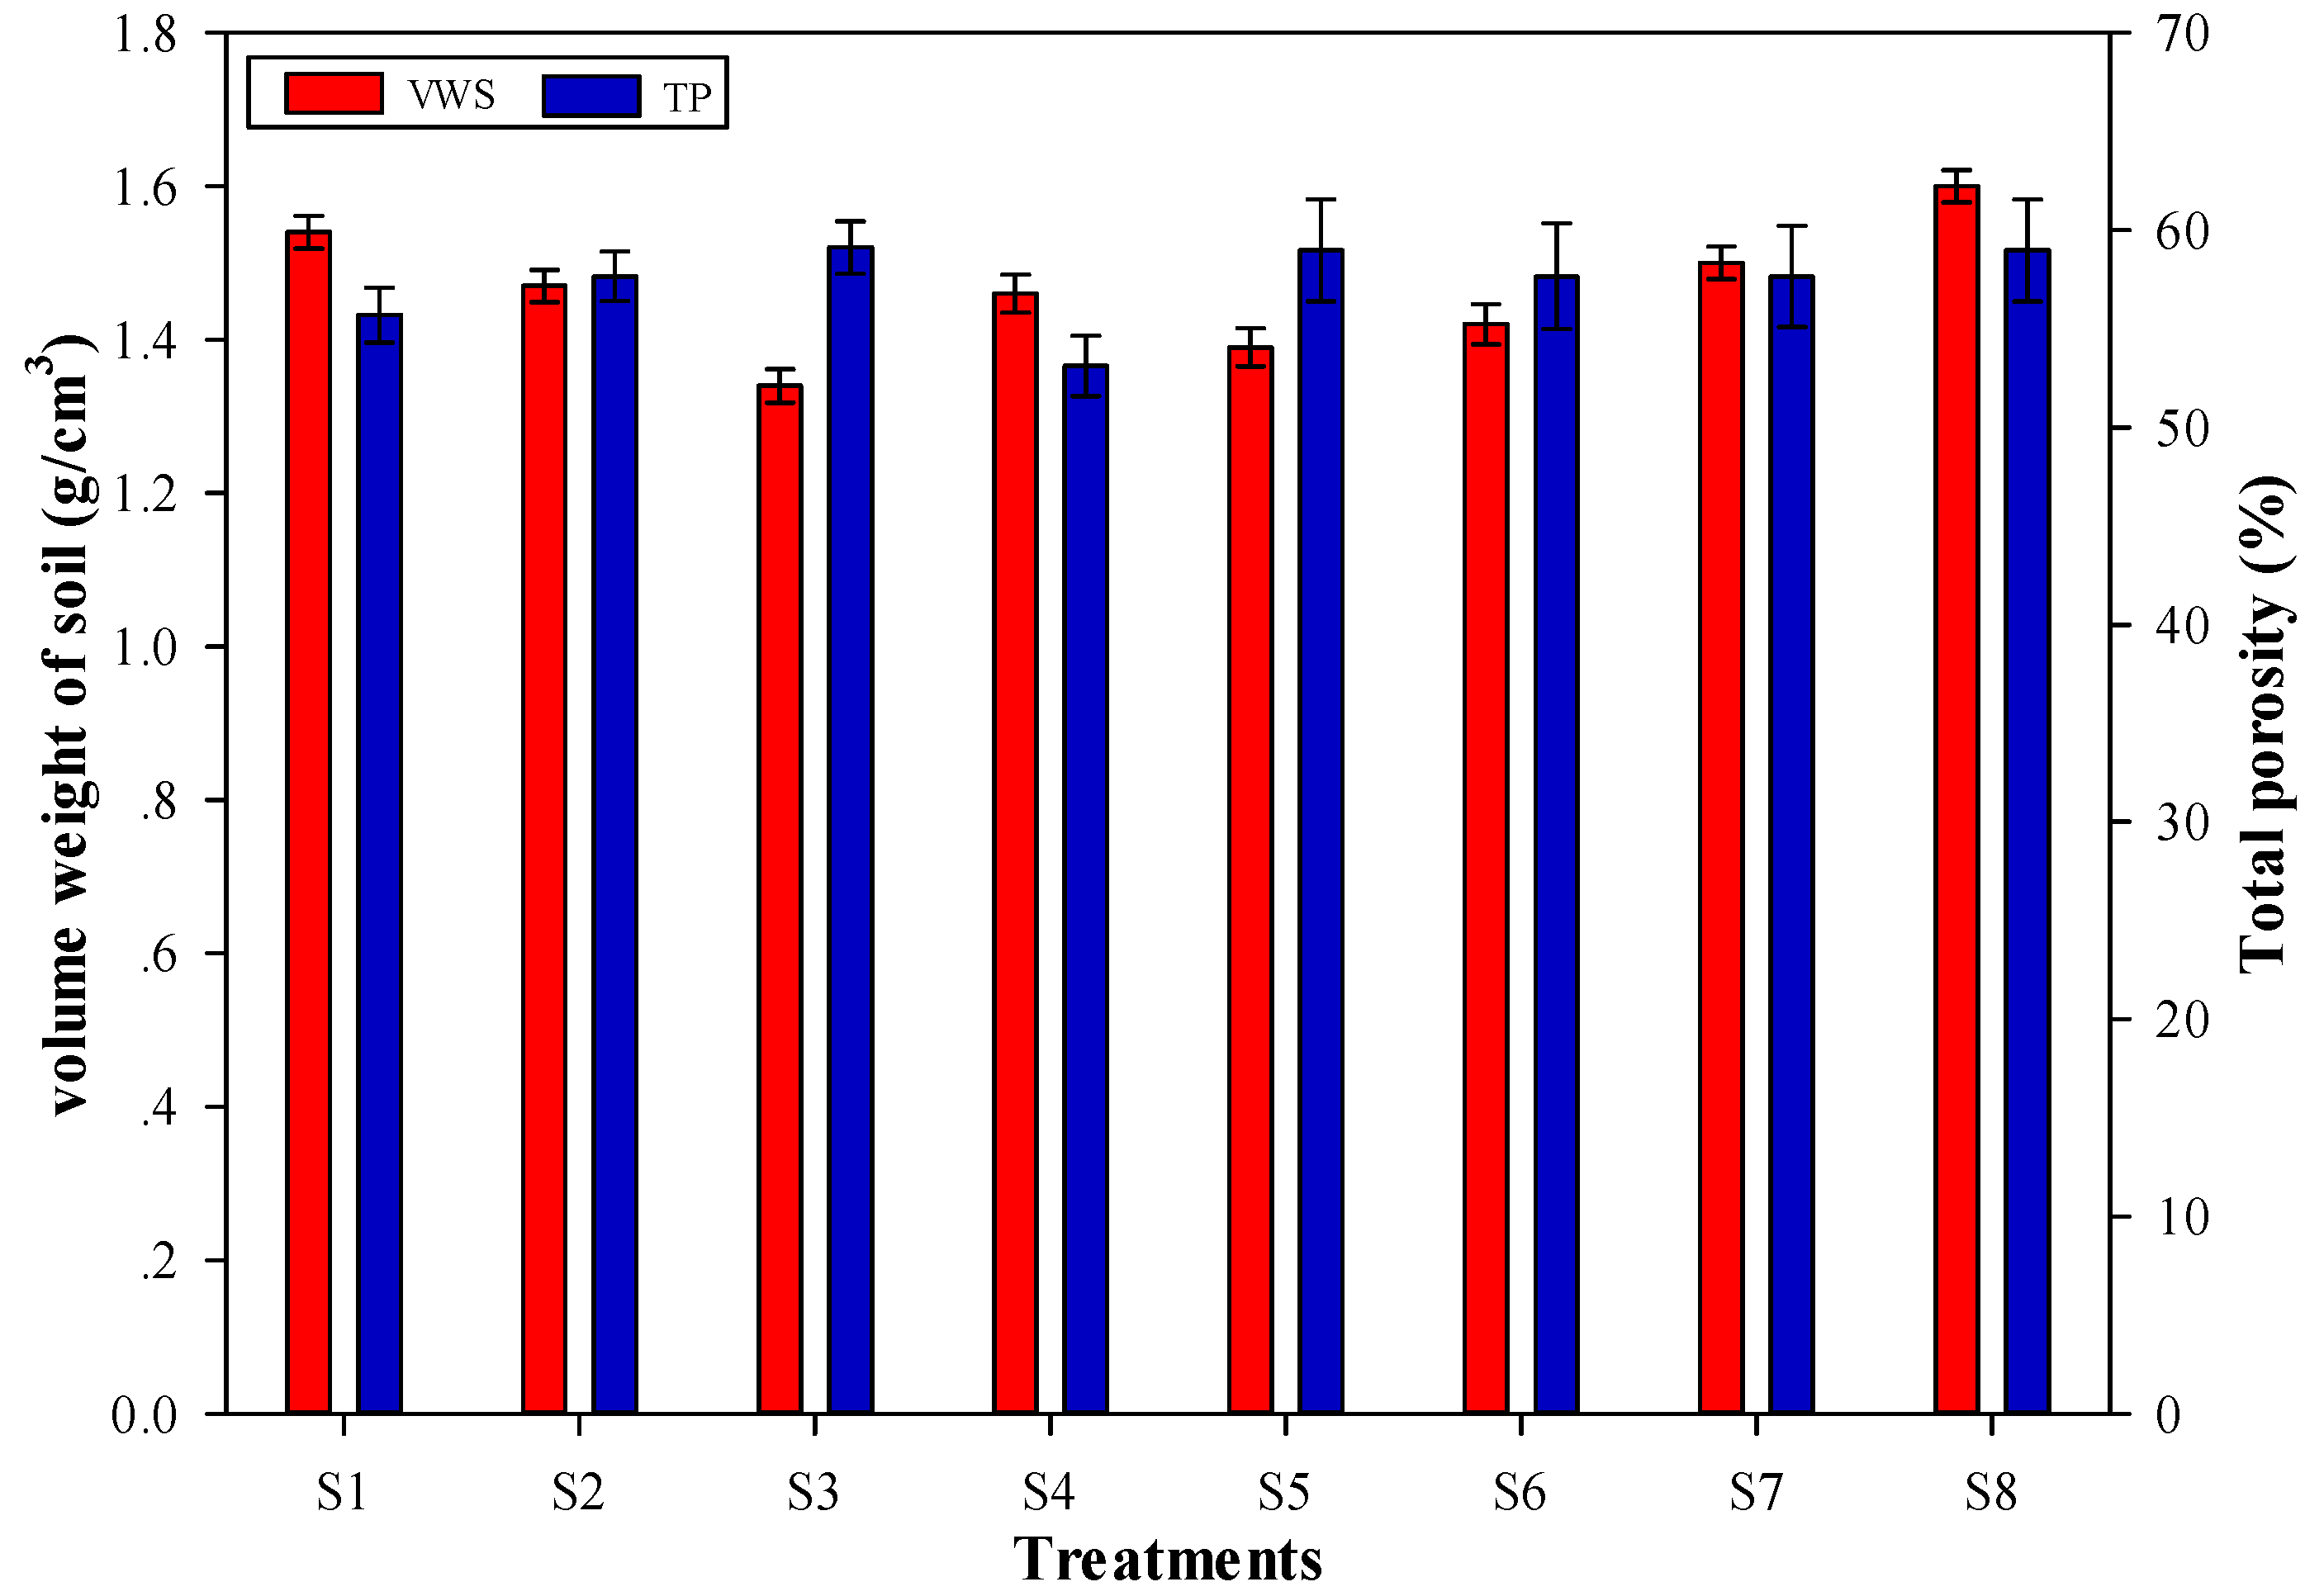
4.3. Variations in Volume Weight of the Soil and Total Porosity under Different Treatments
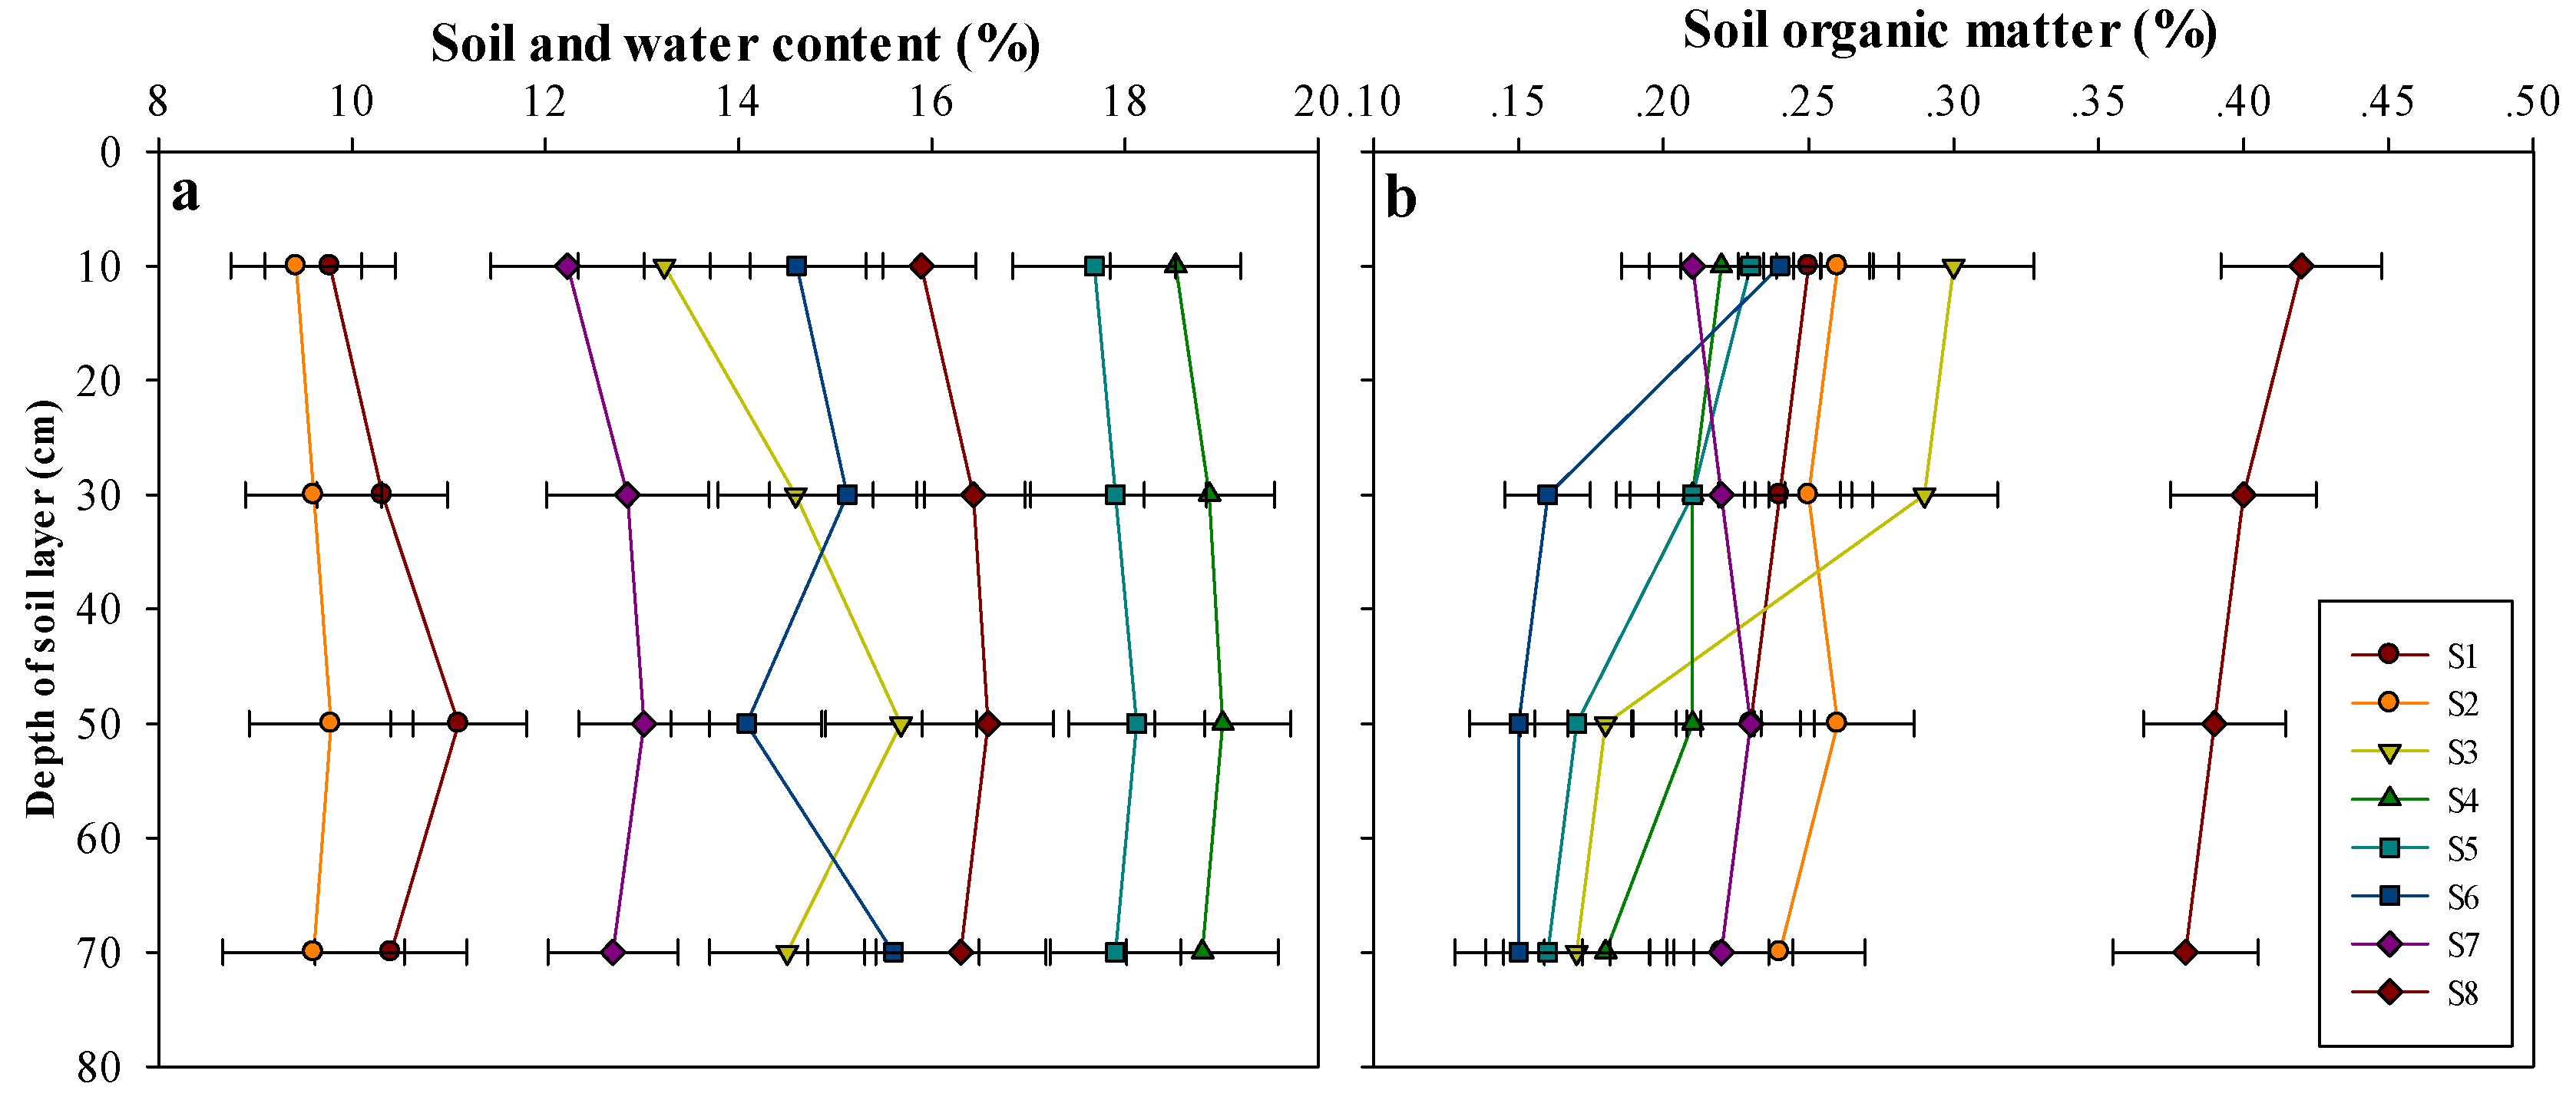
4.4. Variations in Soil and Water Content and Soil Organic Matter under Different Treatments
4.5. Variation in Soil Erosion under Different Treatments
4.6. Evaluation of Different Soil and Water Conservation Measures Using the GCM
5. Conclusions
Author Contributions
Acknowledgments
Conflicts of Interest
References
- Yang, J.; Liu, S.; Dong, S.; Zhao, Q.; Zhang, Z.M. Spatial analysis of three vegetation types in xishuangbanna on a road network using the network k-function. Procedia Environ. Sci. 2010, 2, 1534–1539. [Google Scholar] [CrossRef]
- Zhang, L.T.; Gao, Z.L.; Yang, S.W.; Li, Y.H.; Tian, H.W. Dynamic processes of soil erosion by runoff on engineered landforms derived from expressway construction: A case study of typical steep spoil heap. Catena 2015, 128, 108–121. [Google Scholar] [CrossRef]
- Nikomborirak, D. Private sector participation in infrastructure: The case of Thailand. J. Organ. Chem. 2015, 45. [Google Scholar] [CrossRef]
- Roovers, P.; Bossuyt, B.; Igodt, B.; Hermy, M. May seed banks contribute to vegetation restoration on paths in temperate deciduous forest? Plant Ecol. 2006, 187, 25–38. [Google Scholar] [CrossRef]
- Tian, H.; Cao, C.; Wei, C.; Bao, S.; Yang, B.; Myneni, R.B. Response of vegetation activity dynamic to climatic change and ecological restoration programs in inner mongolia from 2000 to 2012. Ecol. Eng. 2015, 82, 276–289. [Google Scholar] [CrossRef]
- Azhari, A. Polycyclic aromatic hydrocarbons (pahs) in air and vegetation: Case study at three selected toll stations along north south expressway in Johor, Malaysia. Eur. J. Cancer 2012, 29, 1252–1256. [Google Scholar] [CrossRef]
- Simões, M.D.S.; Rocha, J.V.; Lamparelli, R.A.C. Orbital spectral variables, growth analysis and sugarcane yield variáveis espectrais orbitais, indicadoras de desenvolvimento e produtividade da cana-de-açúcar. Sci. Agricola 2009, 66, 451–461. [Google Scholar] [CrossRef]
- Normaniza, O.; Barakbah, S.S. Parameters to predict slope stability-soil water and root profiles. Ecol. Eng. 2006, 28, 90–95. [Google Scholar] [CrossRef]
- Sangode, S.J.; Vhatkar, K.; Patil, S.K.; Meshram, D.C.; Pawar, N.J.; Gudadhe, S.S.; Badekar, A.G.; Kumaravel, V. Magnetic susceptibility distribution in the soils of pune metropolitan region: Implications to soil magnetometry of anthropogenic loading. Curr. Sci. 2010, 98, 516–527. [Google Scholar] [CrossRef]
- Yang, Y.; Yang, J.; Zhao, T.; Huang, X.; Ping, Z. Ecological restoration of highway slope by covering with straw-mat and seeding with grass–legume mixture. Ecol. Eng. 2016, 90, 68–76. [Google Scholar] [CrossRef]
- Wei, Z.; Wang, J.G.; Ling, W.; Jin, L. Stability analysis and supporting system design of a high-steep cut soil slope on an ancient l andslide during highway construction of tehran–chalus. Environ. Earth Sci. 2012, 67, 1651–1662. [Google Scholar] [CrossRef]
- Burt, J.W. Developing restoration planting mixes for active ski slopes: A multi-site reference community approach. Environ. Manag. 2012, 49, 636–648. [Google Scholar] [CrossRef] [PubMed]
- Wei, H.; Shao, L.; Zhang, Z. Shrubs increase soil resources heterogeneity along semiarid grass slopes in the loess plateau. J. Arid Environ. 2013, 88, 175–183. [Google Scholar] [CrossRef]
- Maiti, S.K.; Maiti, D. Ecological restoration of waste dumps by topsoil blanketing, coir-matting and seeding with grass–legume mixture. Ecol. Eng. 2015, 77, 74–84. [Google Scholar] [CrossRef]
- Farnhill, T. Union renewal and workplace greening—three case studies. Br. J. Ind. Relat. 2017. [Google Scholar] [CrossRef]
- Li, C.; Pan, C. The relative importance of different grass components in controlling runoff and erosion on a hillslope under simulated rainfall. J. Hydrol. 2018, 558, 76. [Google Scholar] [CrossRef]
- Fore, S.; Mbohwa, C. Greening manufacturing practices in a continuous process industry. J. Eng. Des. Technol. 2015, 13, 94–122. [Google Scholar] [CrossRef]
- Hüne, M.; González-Wevar, C.; Poulin, E.; Mansilla, A.; Fernández, D.A.; Barrera-Oro, E. Low level of genetic divergence between harpagifer fish species (perciformes: Notothenioidei) suggests a quaternary colonization of patagonia from the antarctic peninsula. Polar Biol. 2015, 38, 607–617. [Google Scholar] [CrossRef]
- Graber, H.L.; Al, A.R.; Xu, Y.; Asarian, A.P.; Pappas, P.J.; Dresner, L.; Patel, N.; Jagarlamundi, K.; Solomon, W.B.; Barbour, R.L. Enhanced resting-state dynamics of the hemoglobin signal as a novel biomarker for detection of breast cancer. Med. Phys. 2015, 42, 6406. [Google Scholar] [CrossRef]
- Androff, D.; Fike, C.; Rorke, J. Greening social work education: Teaching environmental rights and sustainability in community practice. J. Soc. Work Educ. 2017, 53, 1–15. [Google Scholar] [CrossRef]
- Wardle, G.M.; Pavey, C.R.; Dickman, C.R. Greening of arid australia: New insights from extreme years. Austral Ecol. 2013, 38, 731–740. [Google Scholar] [CrossRef]
- Lorenz, A.J. Resource allocation for maximizing prediction accuracy and genetic gain of genomic selection in plant breeding: A simulation experiment. G3 Genes Genomes Genet. 2013, 3, 481–491. [Google Scholar] [CrossRef]
- Zuo, Q.; Zhang, D.; Jiaqiang, E.; Gong, J. Comprehensive analysis on influencing factors of composite regeneration performance of a diesel particulate filter. Environ. Progress Sustain. Energy 2016, 35, 882–890. [Google Scholar] [CrossRef]
- Shigeno, T.; Brock, M.; Shigeno, S.; Fritschka, E.; Cervósnavarro, J. The determination of brain water content: Microgravimetry versus drying-weighing method. J. Neurosurg. 1982, 57, 99–107. [Google Scholar] [CrossRef]
- Walinga, I.; Kithome, M.; Novozamsky, I.; Houba, V.J.G.; Lee, J.J.V.D. Spectrophotometric determination of organic carbon in soil. Commun. Soil Sci. Plant Anal. 1992, 23, 10. [Google Scholar] [CrossRef]
- Hacisalihoglu, S. Determination of soil erosion in a steep hill slope with different land-use types: A case study in Mertesdorf (Ruwertal/Germany). J. Environ. Biol. 2007, 28, 433–438. [Google Scholar]
- Visser, S.M.; Sterk, G.; Ribolzi, O. Techniques for simultaneous quantification of wind and water erosion in semi-arid regions. J. Arid Environ. 2004, 59, 699–717. [Google Scholar] [CrossRef]
- Sarkar, U.K.; Deepak, P.K.; Negi, R.S. Length–weight relationship of clown knifefish chitala chitala (hamilton 1822) from the river ganga basin, India. J. Appl. Ichthyol. 2009, 25, 232–233. [Google Scholar] [CrossRef]
- Xia, X.; Yu, S.; Kai, W.; Jiang, Q. Optimization of a straw ring-die briquetting process combined analytic hierarchy process and grey correlation analysis method. Fuel Process. Technol. 2016, 152, 303–309. [Google Scholar] [CrossRef]
- Martin, C.M.; Randolph, M.F. Upper-bound analysis of lateral pile capacity in cohesive soil. Geotechnique 2006, 56, 141–146. [Google Scholar] [CrossRef]
- Biscontin, G.; Pestana, J.M.; Nadim, F. Seismic triggering of submarine slides in soft cohesive soil deposits. Marine Geol. 2004, 203, 341–354. [Google Scholar] [CrossRef]
- Alaoui, A.; Lipiec, J.; Gerke, H.H. A review of the changes in the soil pore system due to soil deformation: A hydrodynamic perspective. Soil Till. Res. 2011, 115, 1–15. [Google Scholar] [CrossRef]
- Lu, Q.; Wang, E.; Chen, X. Effect of mechanical compaction on soil micro-aggregate composition and stability of black soil. Trans. Chin. Soc. Agric. Eng. 2015, 31, 54–59. [Google Scholar] [CrossRef]
- Yahya, Z.; Mohammed, A.T.; Harun, M.H.; Shuib, A.R. Oil palm adaptation to compacted alluvial soil (typic endoaquepts) in malaysia. J. Oil Palm Res. 2013, 24, 1533–1541. [Google Scholar] [CrossRef]
- Tang, A.M.; Cui, Y.J.; Richard, G.; Défossez, P. A study on the air permeability as affected by compression of three french soils. Geoderma 2011, 162, 171–181. [Google Scholar] [CrossRef]
- Creamer, R.E.; Brennan, F.; Fenton, O.; Healy, M.G.; Lalor, S.T.J.; Lanigan, G.J.; Regan, J.T.; Griffiths, B.S. Implications of the proposed soil framework directive on agricultural systems in atlantic europe—A review. Soil Use Manag. 2010, 26, 198–211. [Google Scholar] [CrossRef]
- Abdu, H.; Robinson, D.A.; Seyfried, M.; Jones, S.B. Geophysical imaging of watershed subsurface patterns and prediction of soil texture and water holding capacity. Water Resour. Res. 2008, 44, 5121–5127. [Google Scholar] [CrossRef]
- Ashraf, M.A.; Maah, M.J.; Yusoff, I. Chemical speciation and potential mobility of heavy metals in the soil of former tin mining catchment. Sci. World J. 2012, 2012, 125608. [Google Scholar] [CrossRef]
- Ross, D.S.; Bailey, S.W.; Lawrence, G.B.; Shanley, J.B.; Fredriksen, G.; Jamison, A.E.; Brousseau, P.A. Near-surface soil carbon, carbon/nitrogen ratio, and tree species are tightly linked across northeastern united states watersheds. For. Sci. 2011, 57, 460–469. [Google Scholar] [CrossRef]
- Shirani, H.; Rizabandi, E.; Mosaddeghi, M.R.; Dashti, H. Impact of pistachio residues on compactibility, and permeability for water and air of two aridic soils from southeast of Iran. Arid Soil Res. Rehabil. 2010, 24, 20. [Google Scholar] [CrossRef]
- Wei, J.; Knoche, H.R.; Kunstmann, H. Contribution of transpiration and evaporation to precipitation: An et-tagging study for the poyang lake region in southeast China. J. Geophys. Res. Atmos. 2015, 120, 6845–6864. [Google Scholar] [CrossRef]
- Zhen, L. The national census for soil erosion and dynamic analysis in china. Int. Soil Water Conserv. Res. 2013, 1, 12–18. [Google Scholar] [CrossRef]
- Nunes, A.N.; Lourenço, L.; Vieira, A.; Bento-Gonçalves, A. Precipitation and erosivity in southern portugal: Seasonal variability and trends (1950–2008). Land Degrad. Dev. 2016, 27, 211–222. [Google Scholar] [CrossRef]
- Valinski, N.A.; Chandler, D.G. Infiltration performance of engineered surfaces commonly used for distributed stormwater management. J. Environ. Manag. 2015. [Google Scholar] [CrossRef]
- Jouquet, P.; Bottinelli, N.; Kerneis, G.; Henry-des-Tureaux, T.; Doan, T.T.; Planchon, O.; Tran, T.D. Surface casting of the tropical metaphire posthuma increases soil erosion and nitrate leaching in a laboratory experiment. Geoderma 2013, 204–205, 10–14. [Google Scholar] [CrossRef]


| Number | Treatments | Specification (m) | Soil Type | Soil Thickness (cm) | Plant Species | Slope Ratio |
|---|---|---|---|---|---|---|
| 1 | S1 | 10 × 20 | Weathered rock soil | 43 | C. korshinskii | 1:1.5 |
| 2 | S2 | 10 × 20 | Coarse silty soil | 40 | ||
| 3 | S3 | 10 × 20 | Collapsible loess | 45 | ||
| 4 | S4 | 10 × 20 | Liquefaction soil of saline soil with sandy soil | 39 | ||
| 5 | S5 | 10 × 20 | Weathered rock soil | 43 | H. rhamnoides Linn. | |
| 6 | S6 | 10 × 20 | Coarse silty soil | 40 | ||
| 7 | S7 | 10 × 20 | Collapsible loess | 45 | ||
| 8 | S8 | 10 × 20 | Liquefaction soil of saline soil with sandy soil | 39 |
| Treatments | SPZ | VWS | TP | SWC | SOMC | WrE | WdE | G (k) |
|---|---|---|---|---|---|---|---|---|
| S1 | 0.7489 | 0.8513 | 0.8321 | 0.5286 | 0.3427 | 0.3388 | 0.341 | 0.7593 |
| S2 | 0.5475 | 0.7981 | 0.6162 | 0.5955 | 0.3414 | 0.3538 | 0.336 | 0.6385 |
| S3 | 0.8005 | 0.8142 | 0.784 | 0.5115 | 0.3576 | 0.4026 | 0.3492 | 0.6656 |
| S4 | 0.6653 | 0.6316 | 0.7106 | 0.8678 | 0.5932 | 0.6929 | 0.3376 | 0.6377 |
| S5 | 0.6872 | 0.7469 | 0.7106 | 0.8714 | 0.6494 | 0.4797 | 0.3347 | 0.6485 |
| S6 | 0.6872 | 0.6498 | 0.7106 | 0.5496 | 0.5772 | 0.487 | 0.4074 | 0.6194 |
| S7 | 0.8595 | 0.6427 | 0.7251 | 0.555 | 0.6653 | 0.3745 | 0.7557 | 0.6995 |
| S8 | 0.8477 | 0.8864 | 0.7988 | 0.5079 | 0.6818 | 0.3576 | 0.7233 | 0.6516 |
| ri | 0.7233 | 0.7376 | 0.7284 | 0.5777 | 0.466 | 0.4294 | 0.369 | 0.5768 |
| Wi | 0.1975 | 0.1014 | 0.1389 | 0.1577 | 0.1272 | 0.1173 | 0.16 | 0.5661 |
© 2019 by the authors. Licensee MDPI, Basel, Switzerland. This article is an open access article distributed under the terms and conditions of the Creative Commons Attribution (CC BY) license (http://creativecommons.org/licenses/by/4.0/).
Share and Cite
Jia, C.; Sun, B.-p.; Yu, X.; Yang, X. Evaluation of Vegetation Restoration along an Expressway in a Cold, Arid, and Desertified Area of China. Sustainability 2019, 11, 2313. https://doi.org/10.3390/su11082313
Jia C, Sun B-p, Yu X, Yang X. Evaluation of Vegetation Restoration along an Expressway in a Cold, Arid, and Desertified Area of China. Sustainability. 2019; 11(8):2313. https://doi.org/10.3390/su11082313
Chicago/Turabian StyleJia, Chunfeng, Bao-ping Sun, Xinxiao Yu, and Xiaohui Yang. 2019. "Evaluation of Vegetation Restoration along an Expressway in a Cold, Arid, and Desertified Area of China" Sustainability 11, no. 8: 2313. https://doi.org/10.3390/su11082313
APA StyleJia, C., Sun, B.-p., Yu, X., & Yang, X. (2019). Evaluation of Vegetation Restoration along an Expressway in a Cold, Arid, and Desertified Area of China. Sustainability, 11(8), 2313. https://doi.org/10.3390/su11082313