Spatial Monitoring of Urban Expansion Using Satellite Remote Sensing Images: A Case Study of Amman City, Jordan

Abstract
:1. Introduction
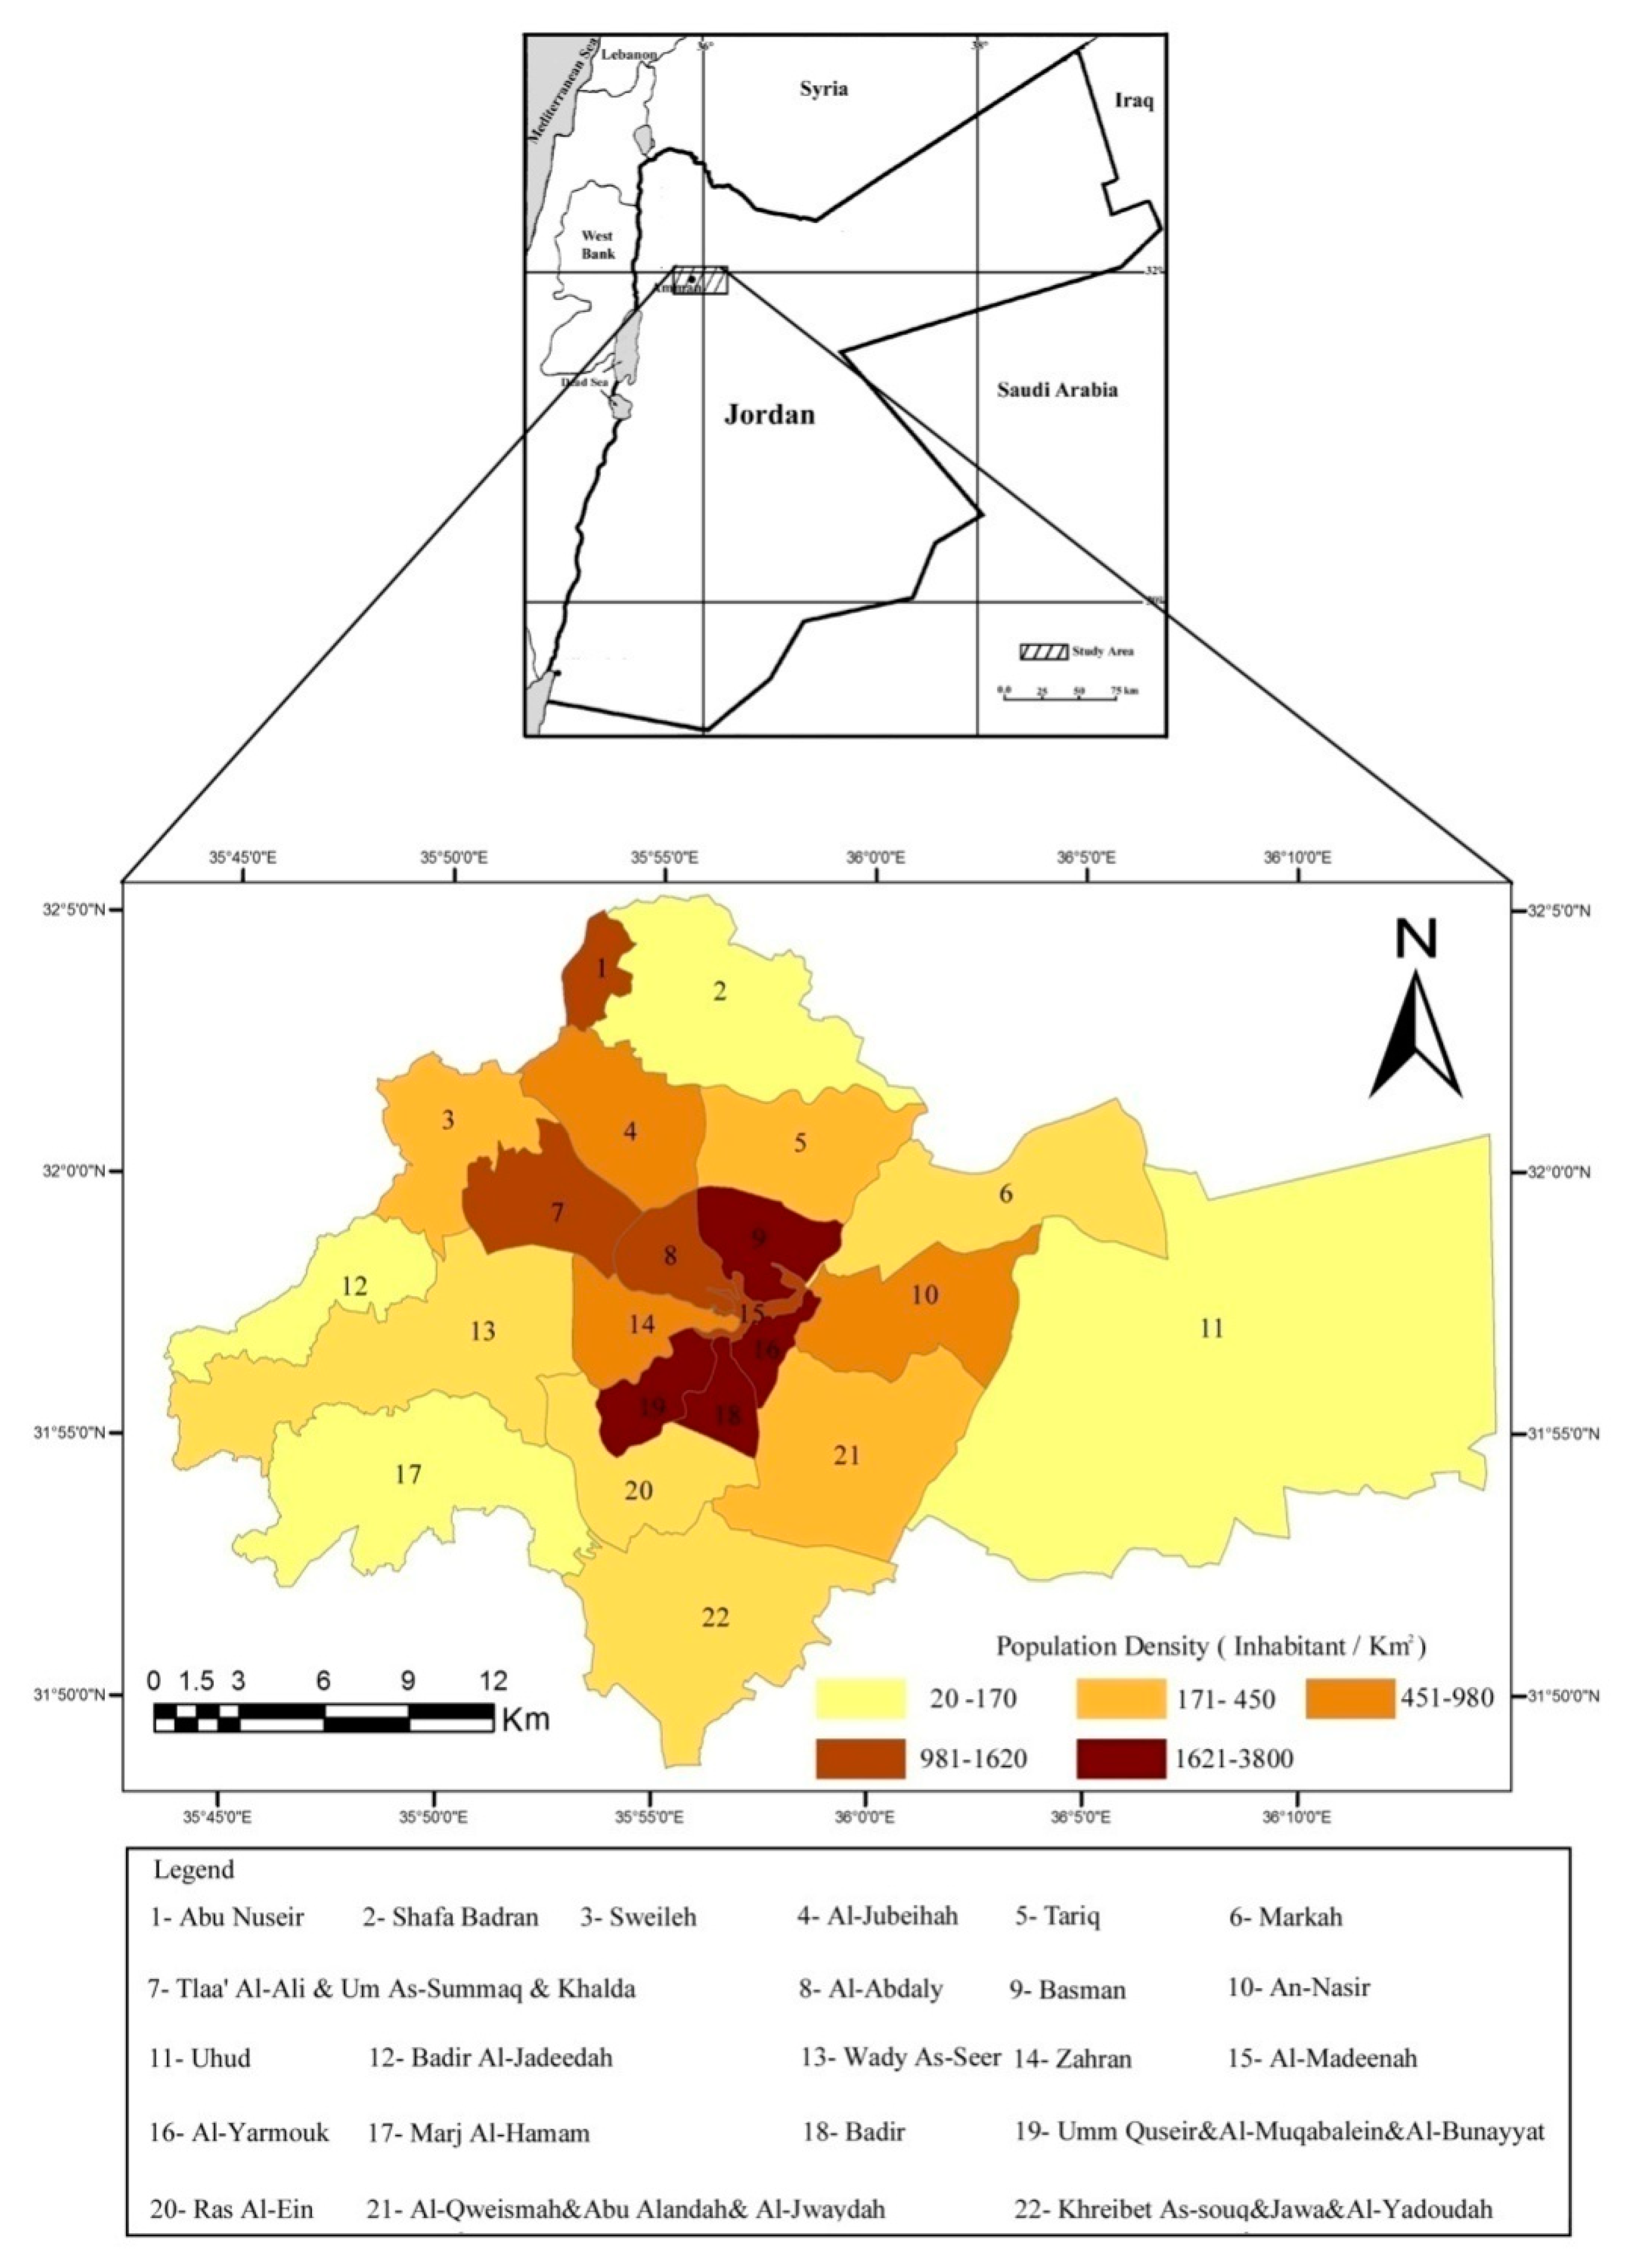
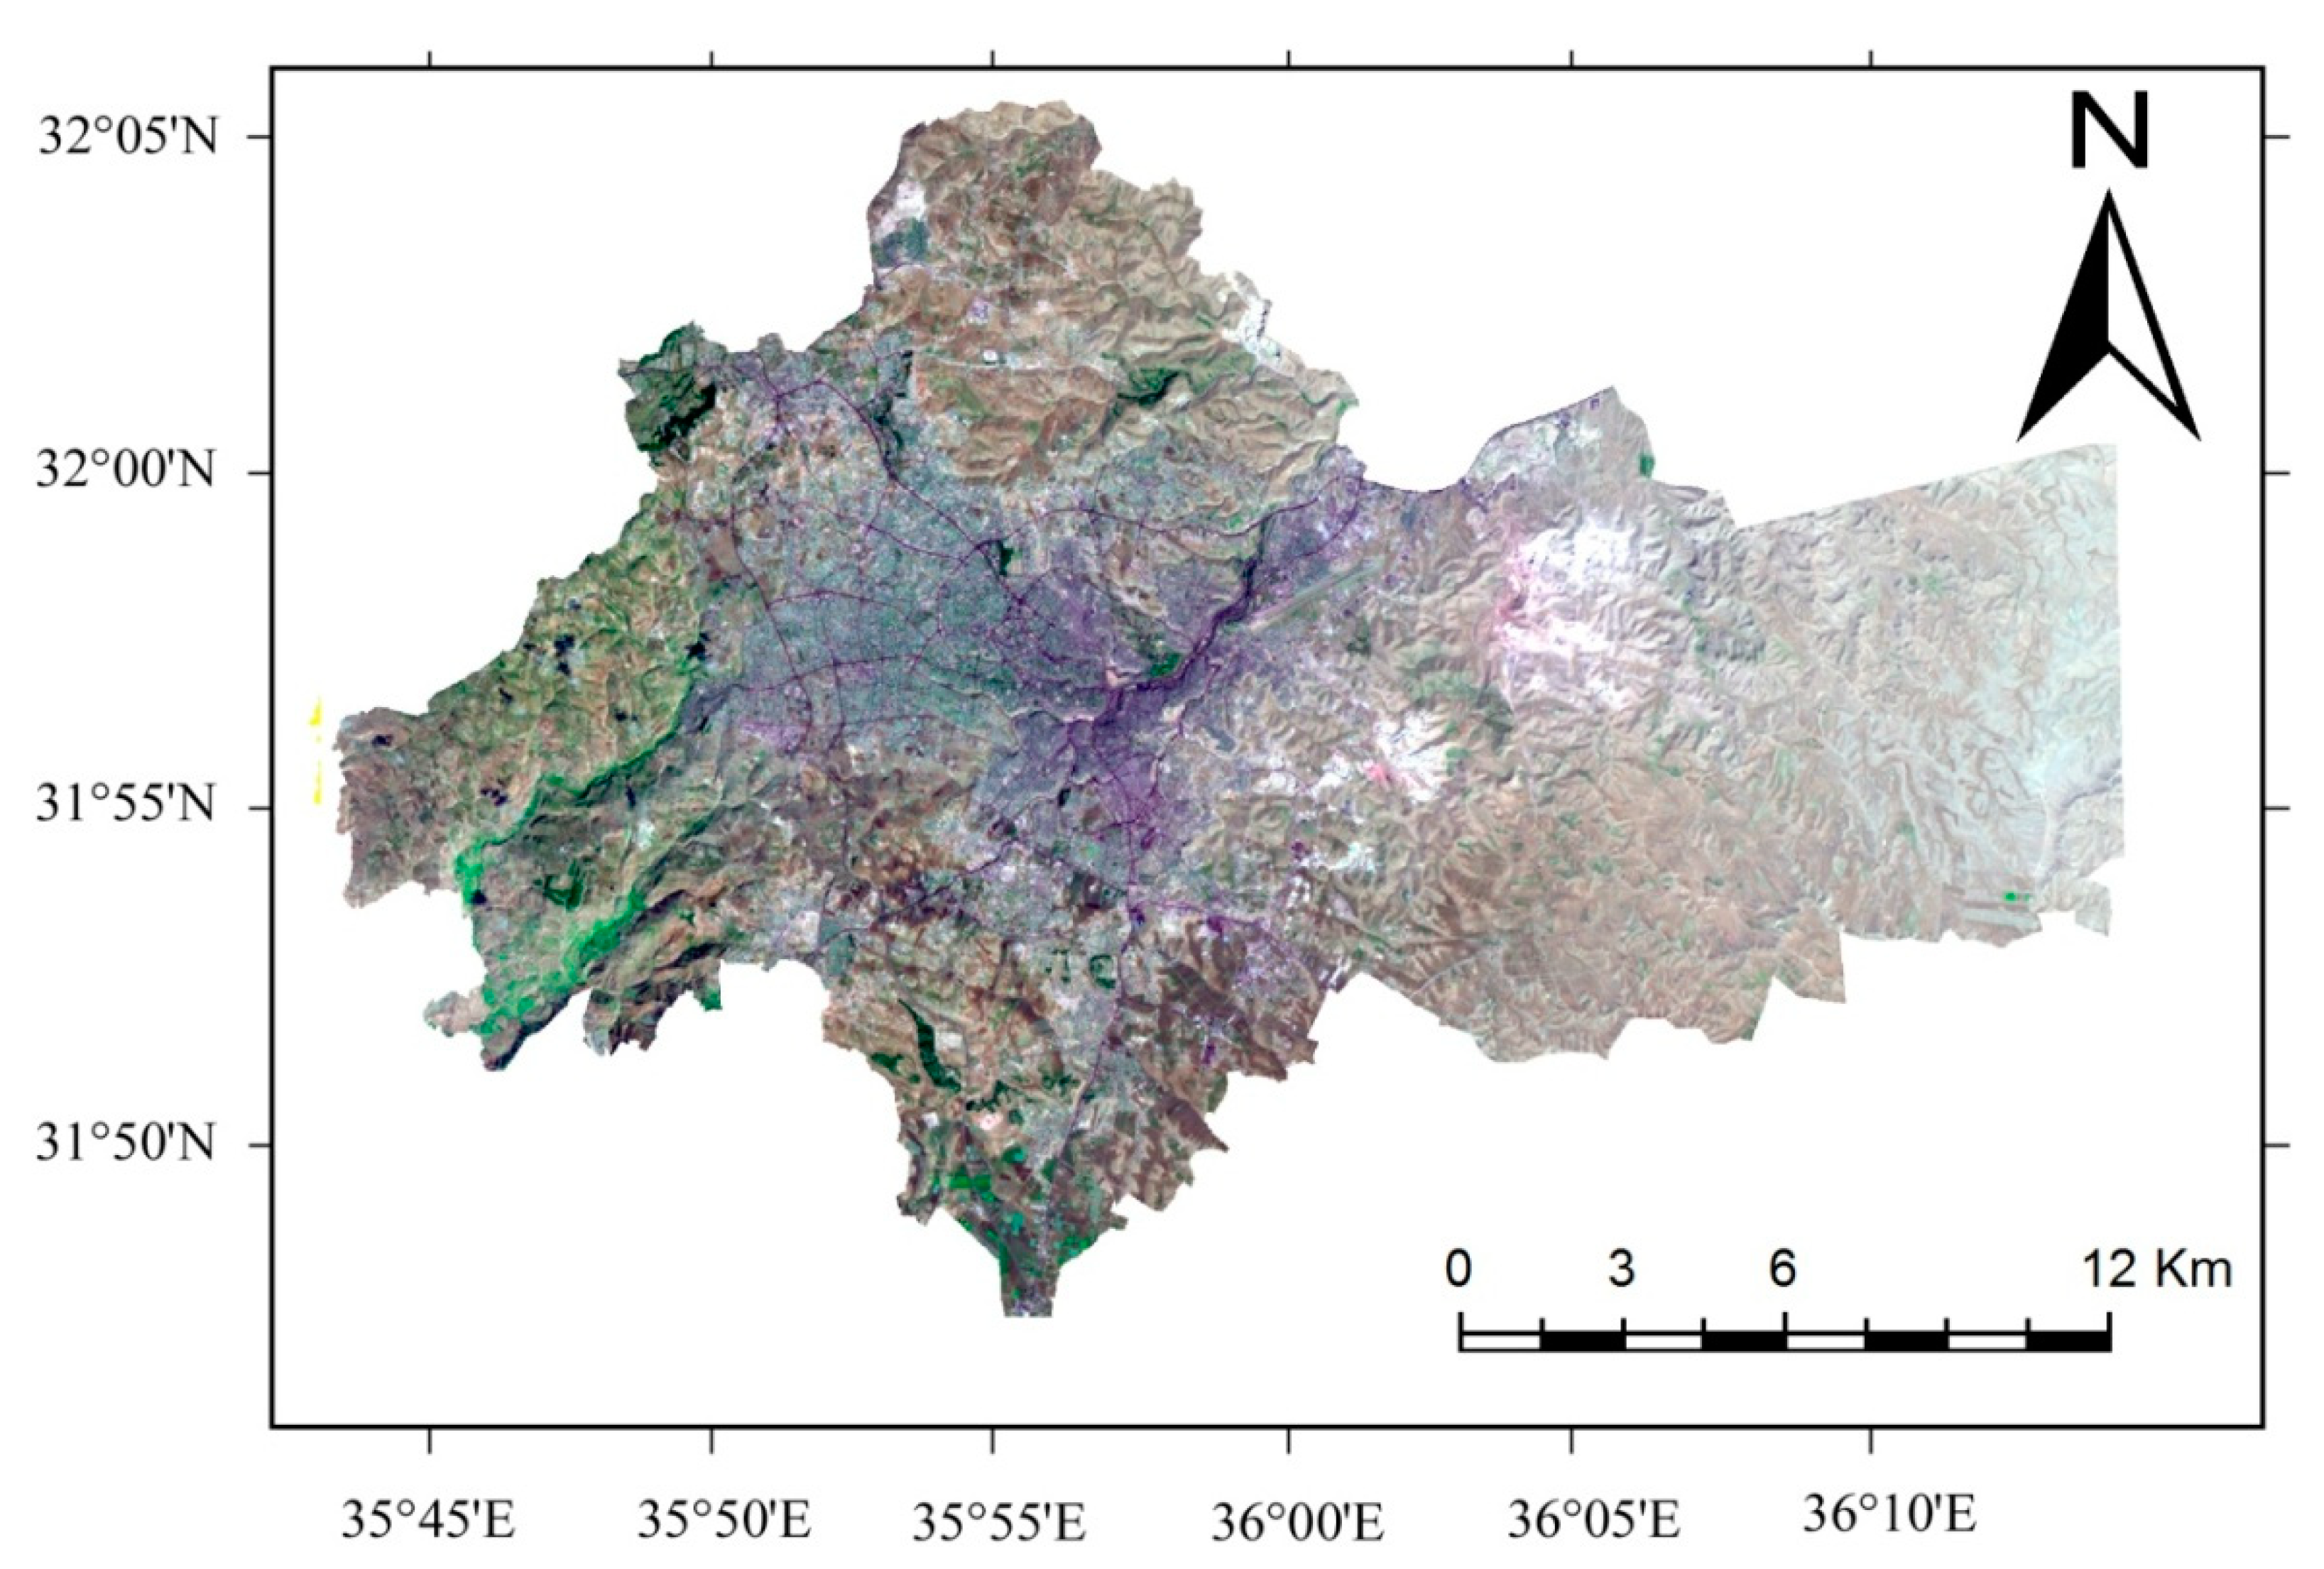
2. The Study Area
3. Materials and Methods
3.1. Geometric Rectification and Radiometric Calibration
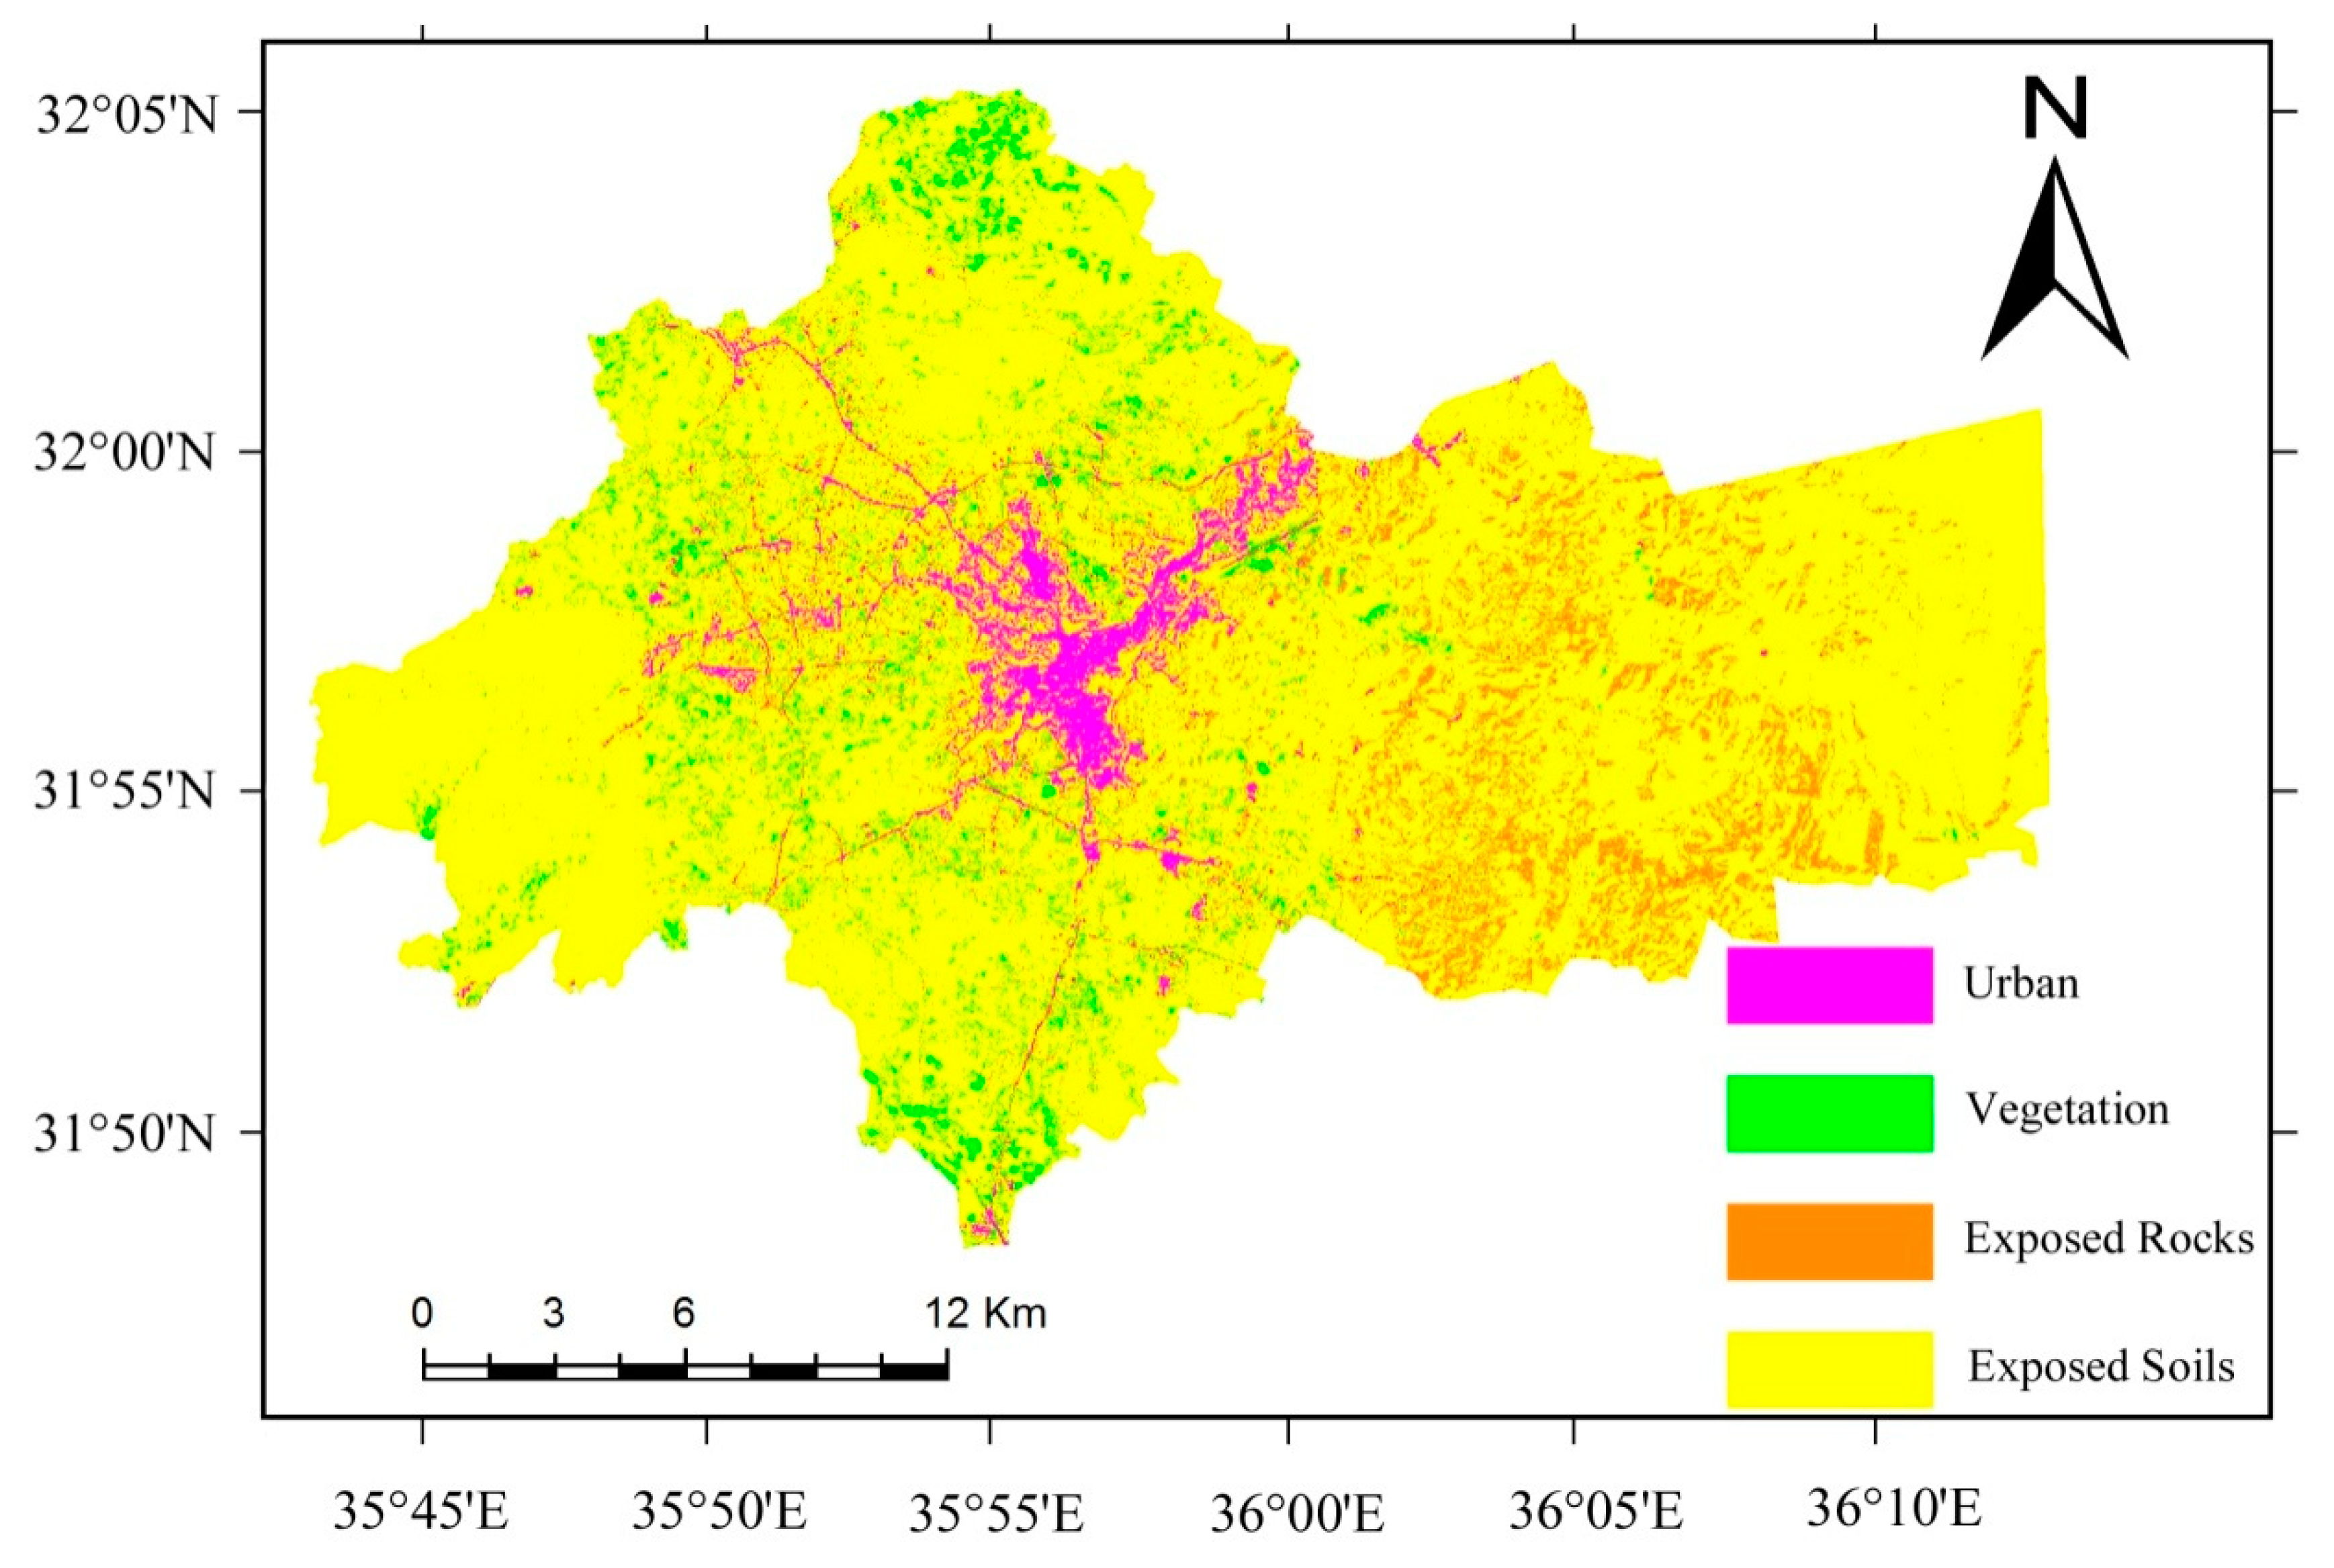
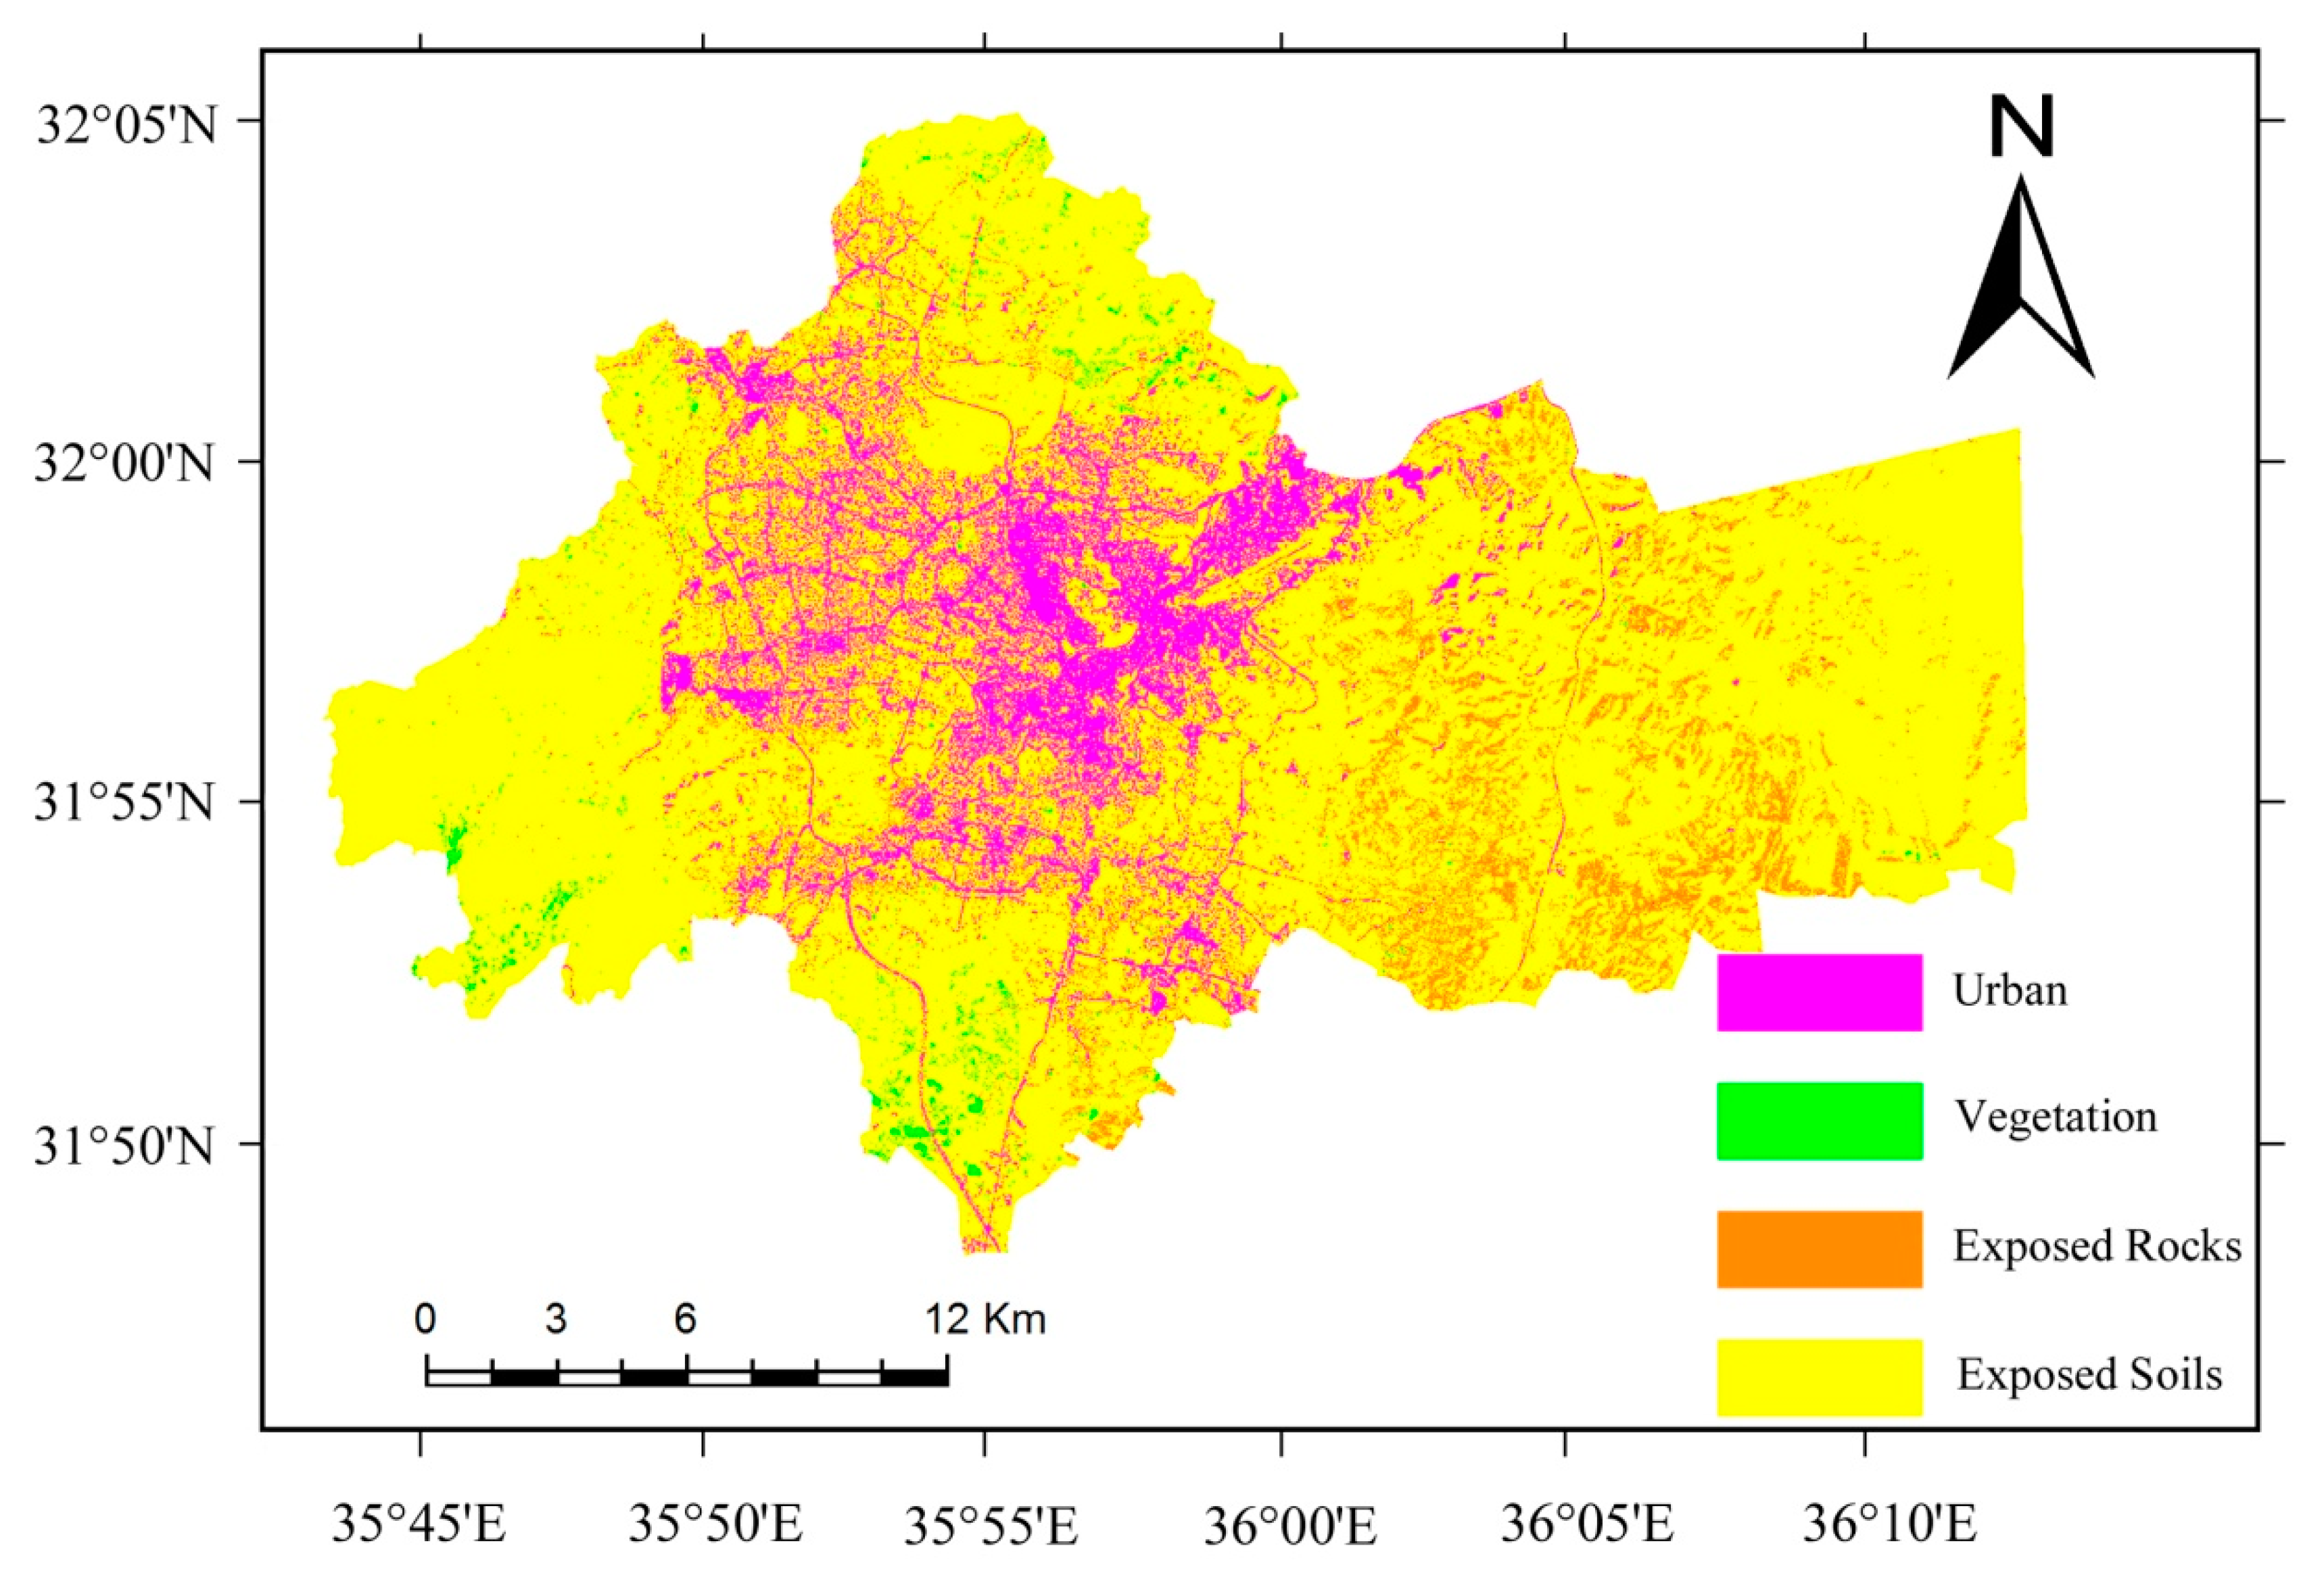
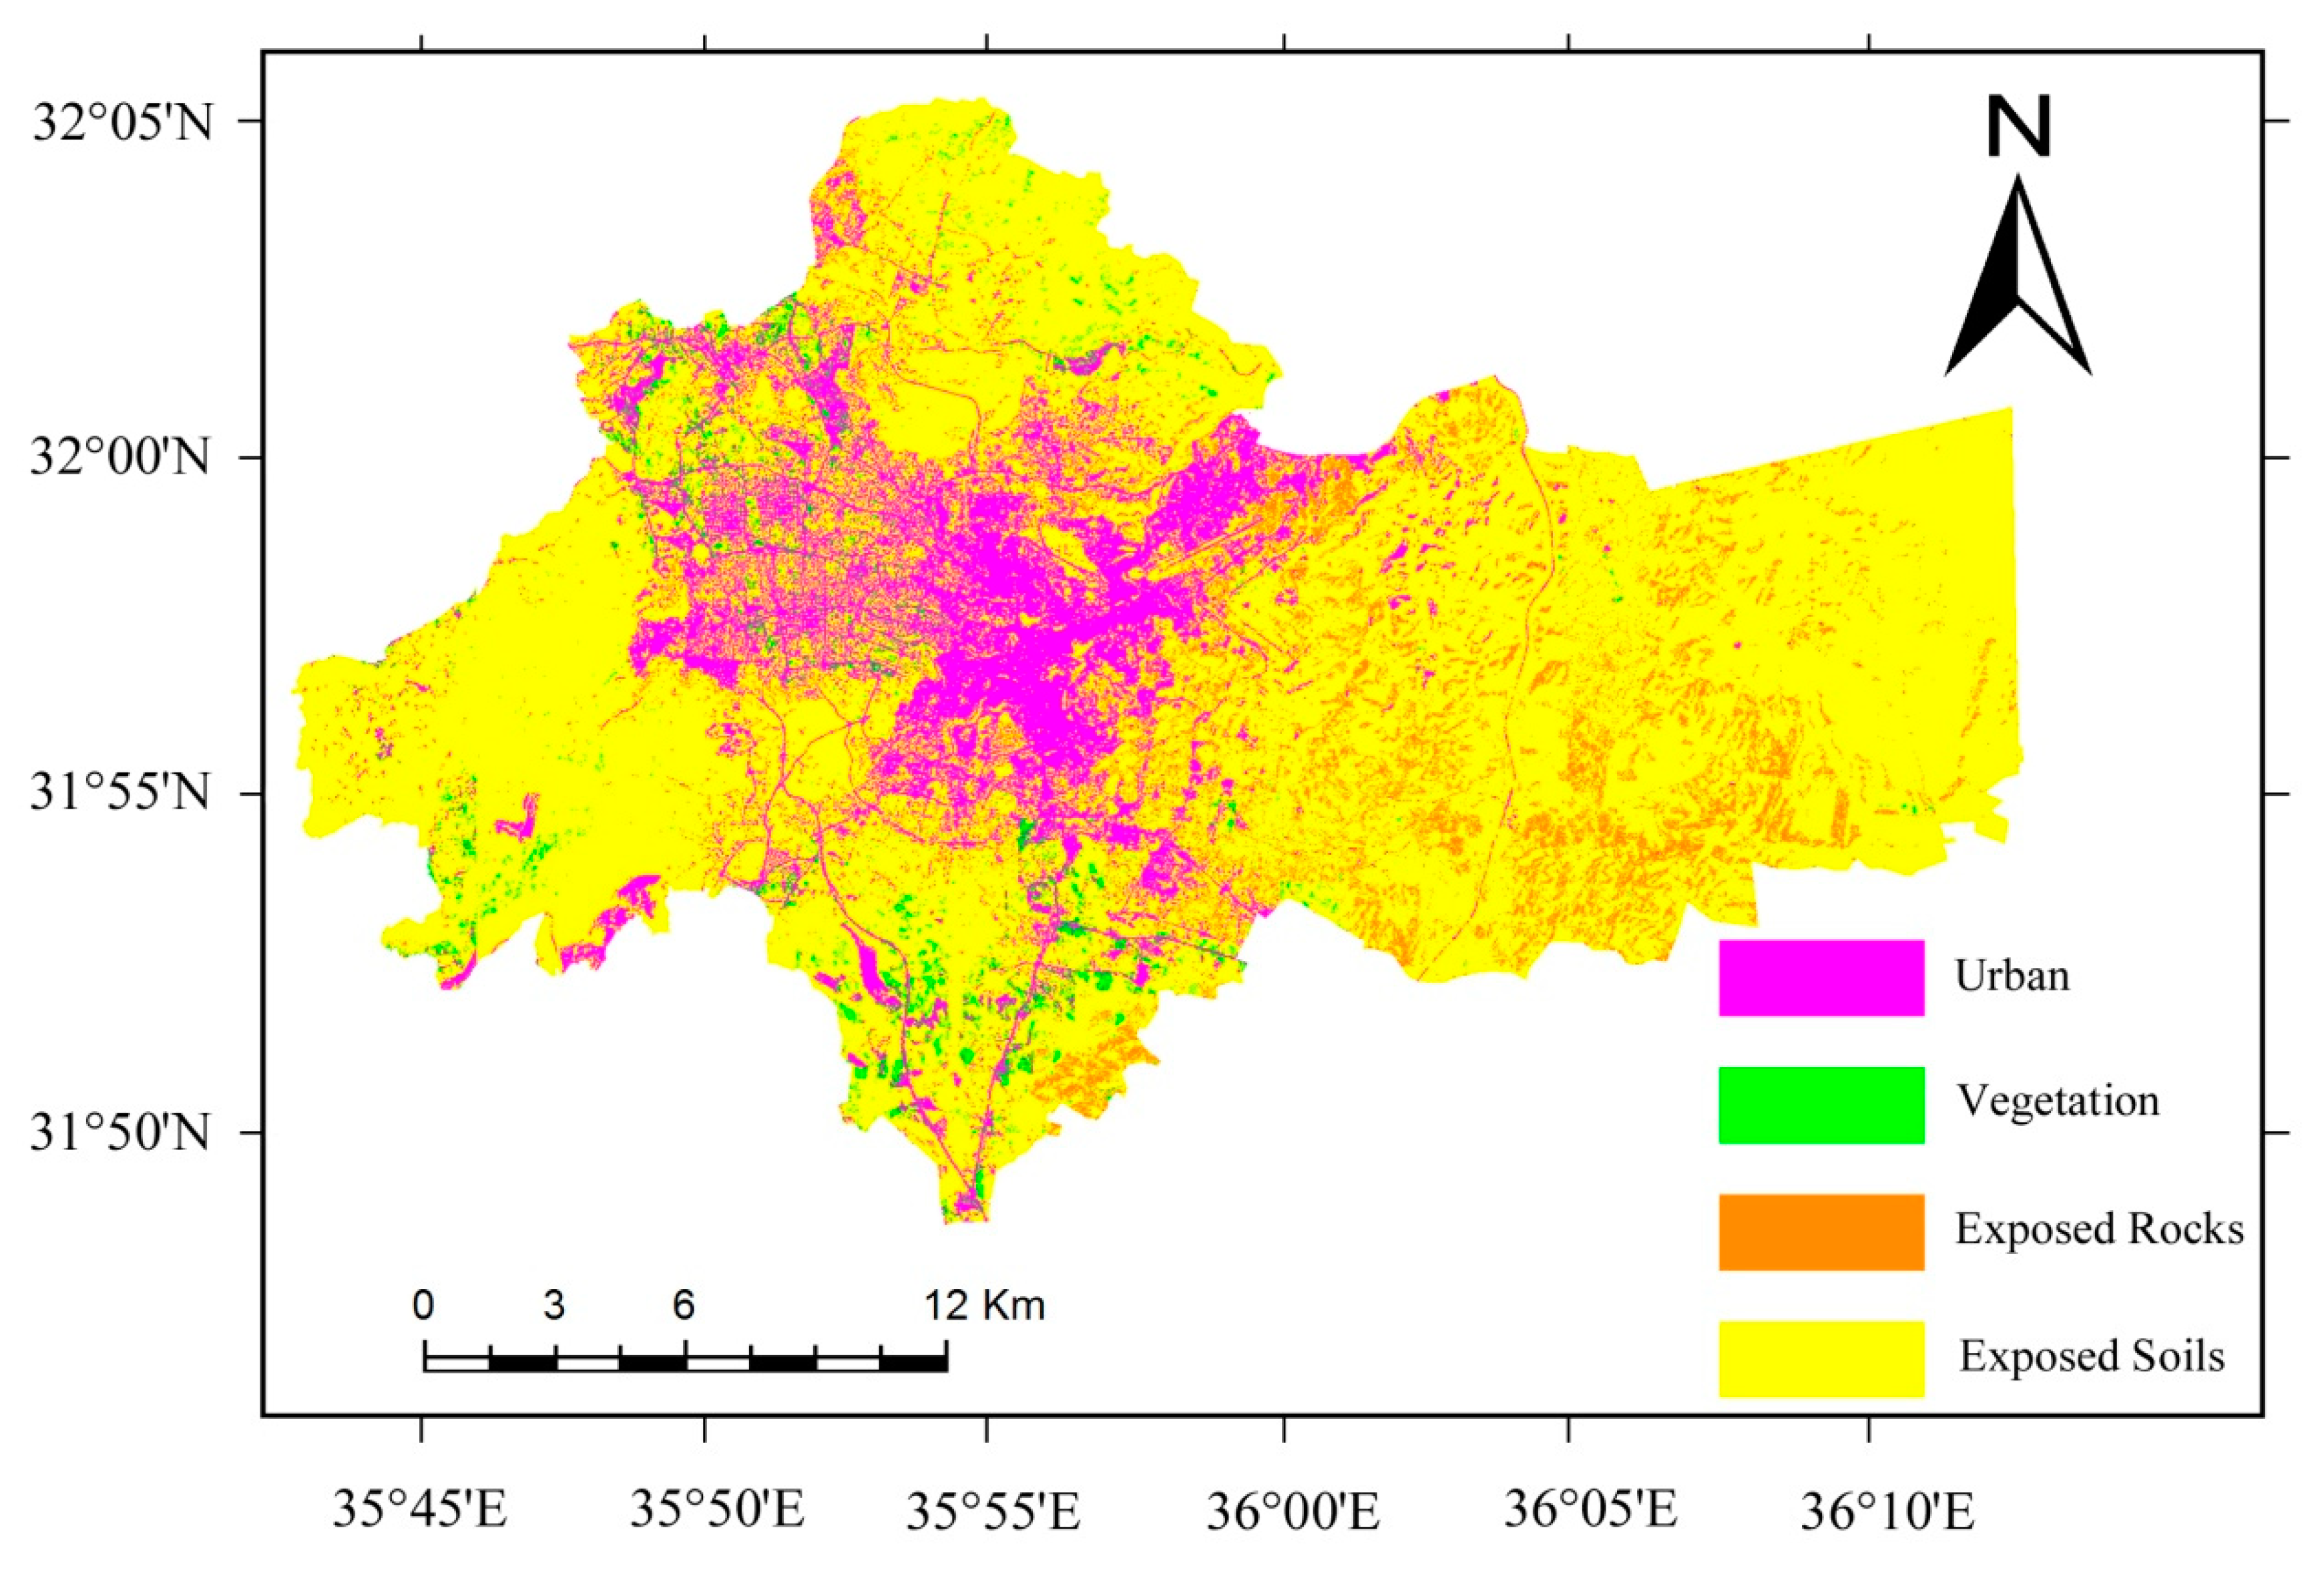
3.2. Image Processing and Classification
4. Results and Discussion
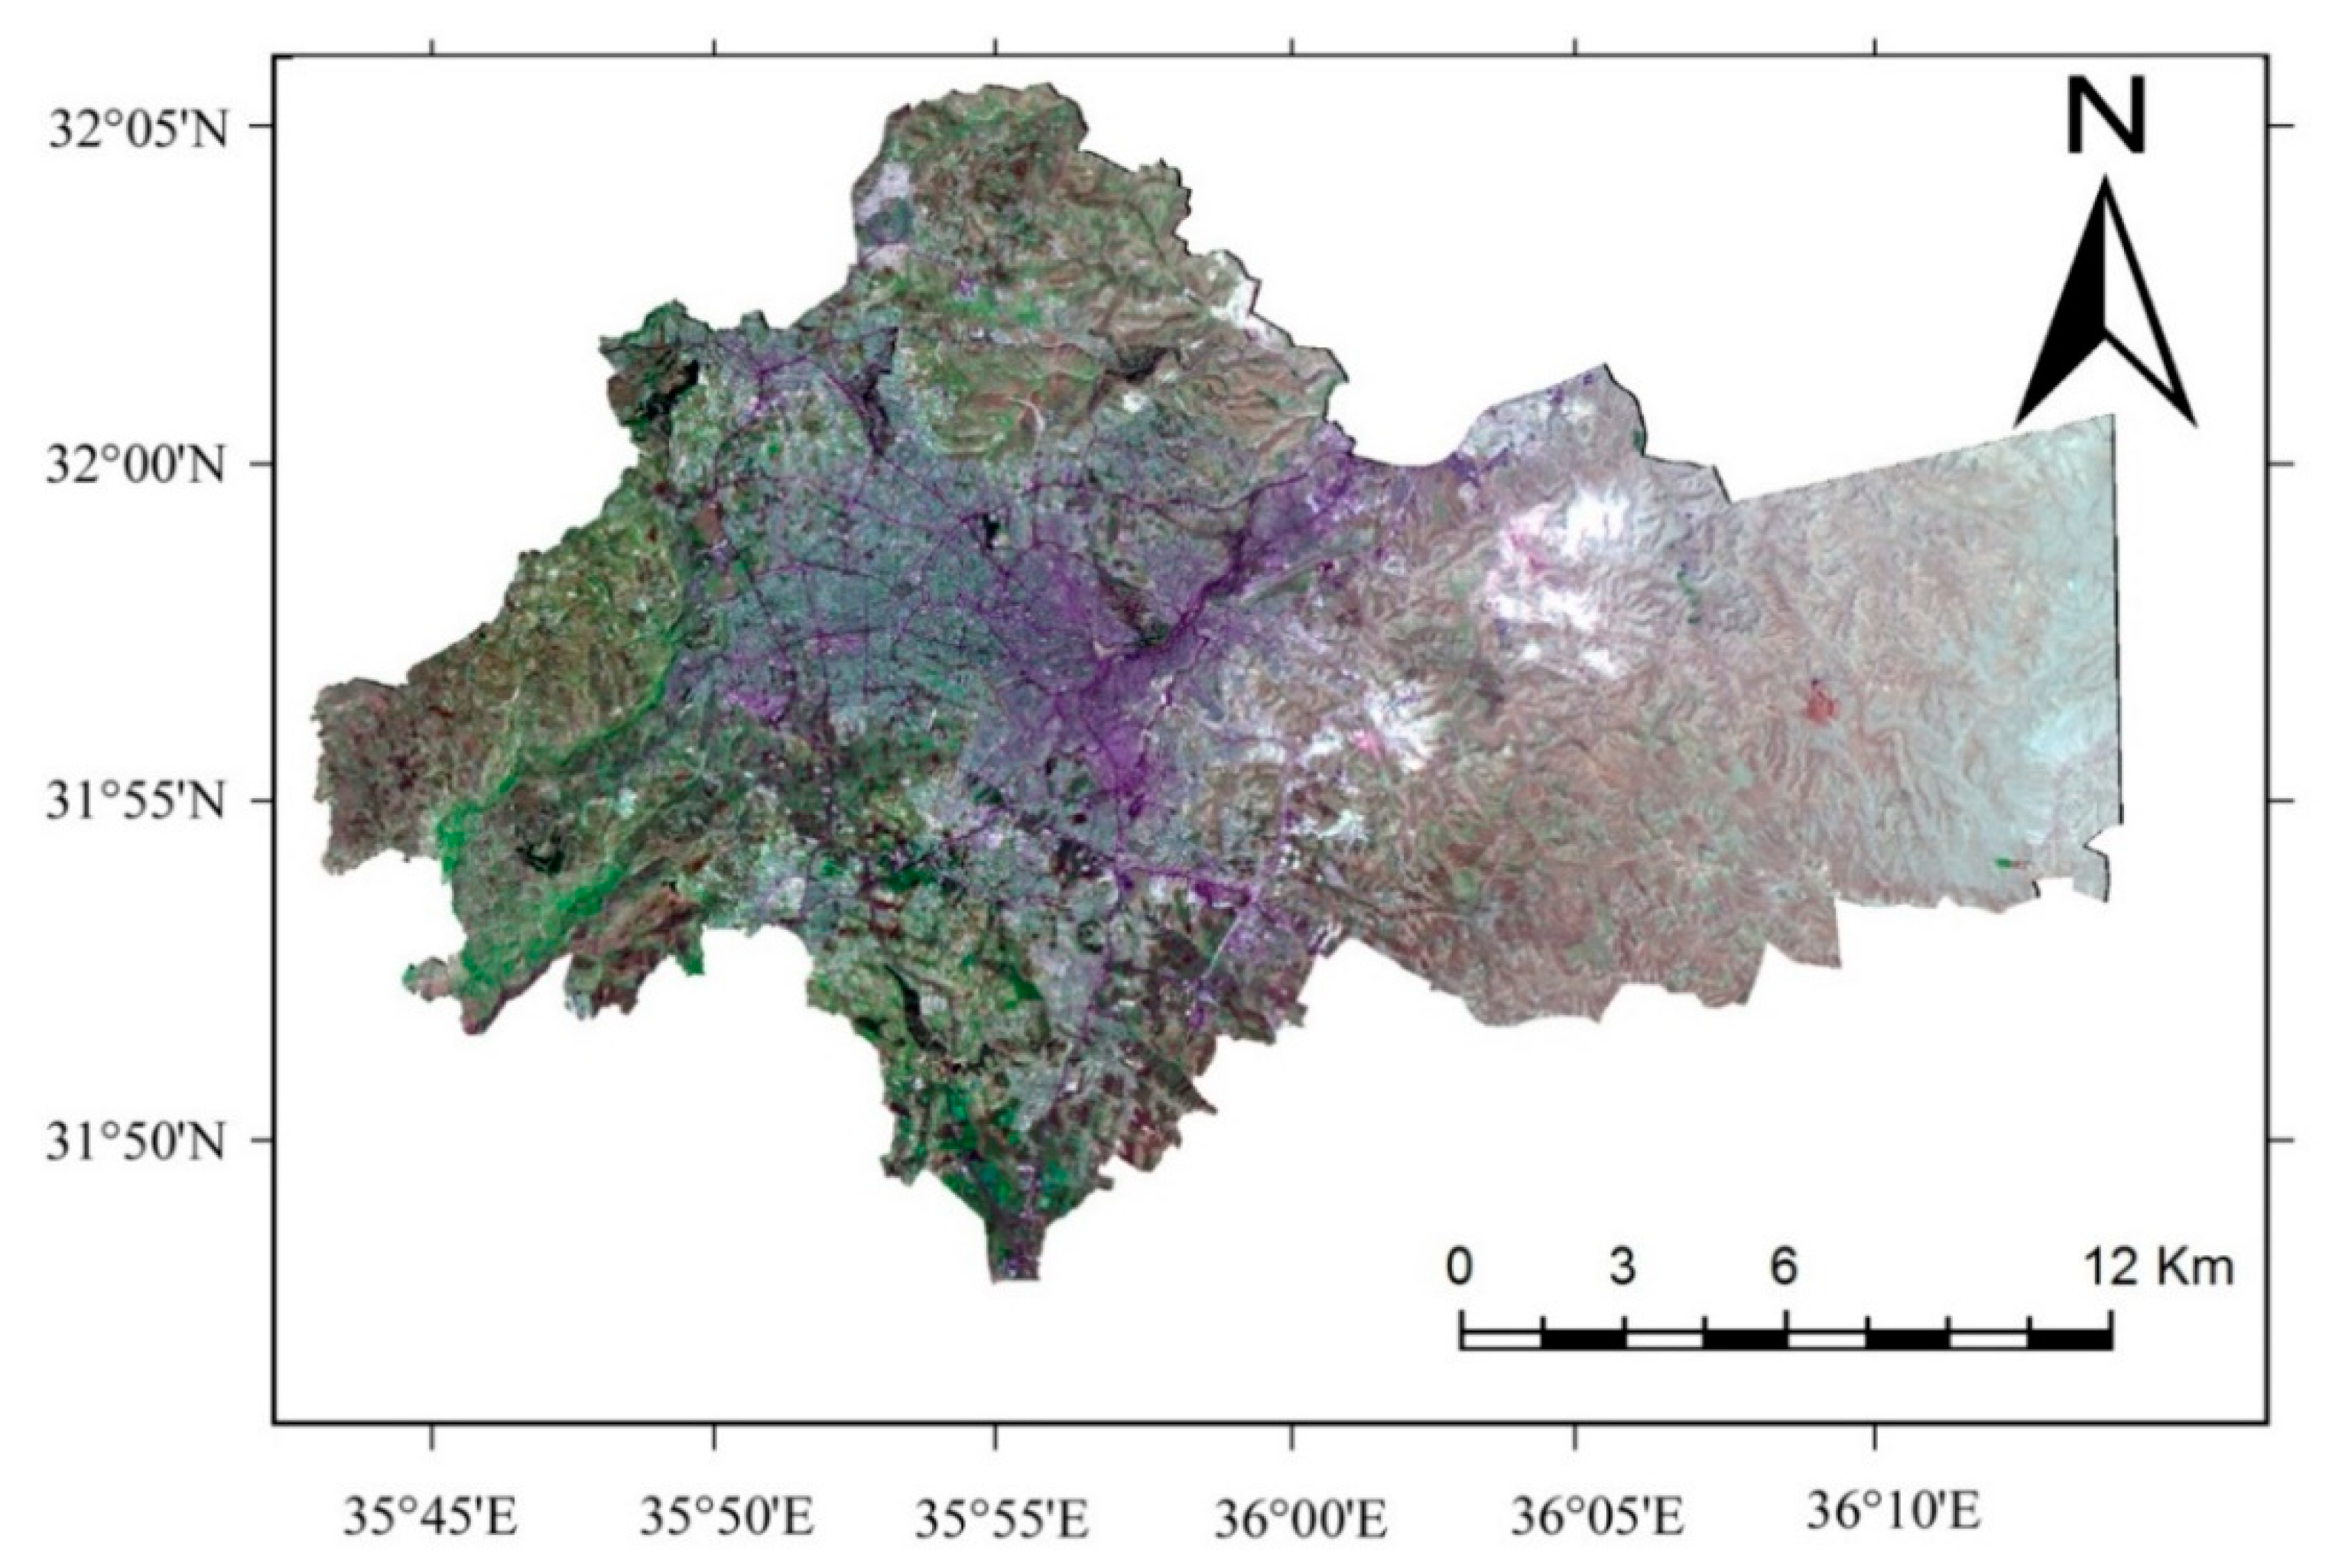
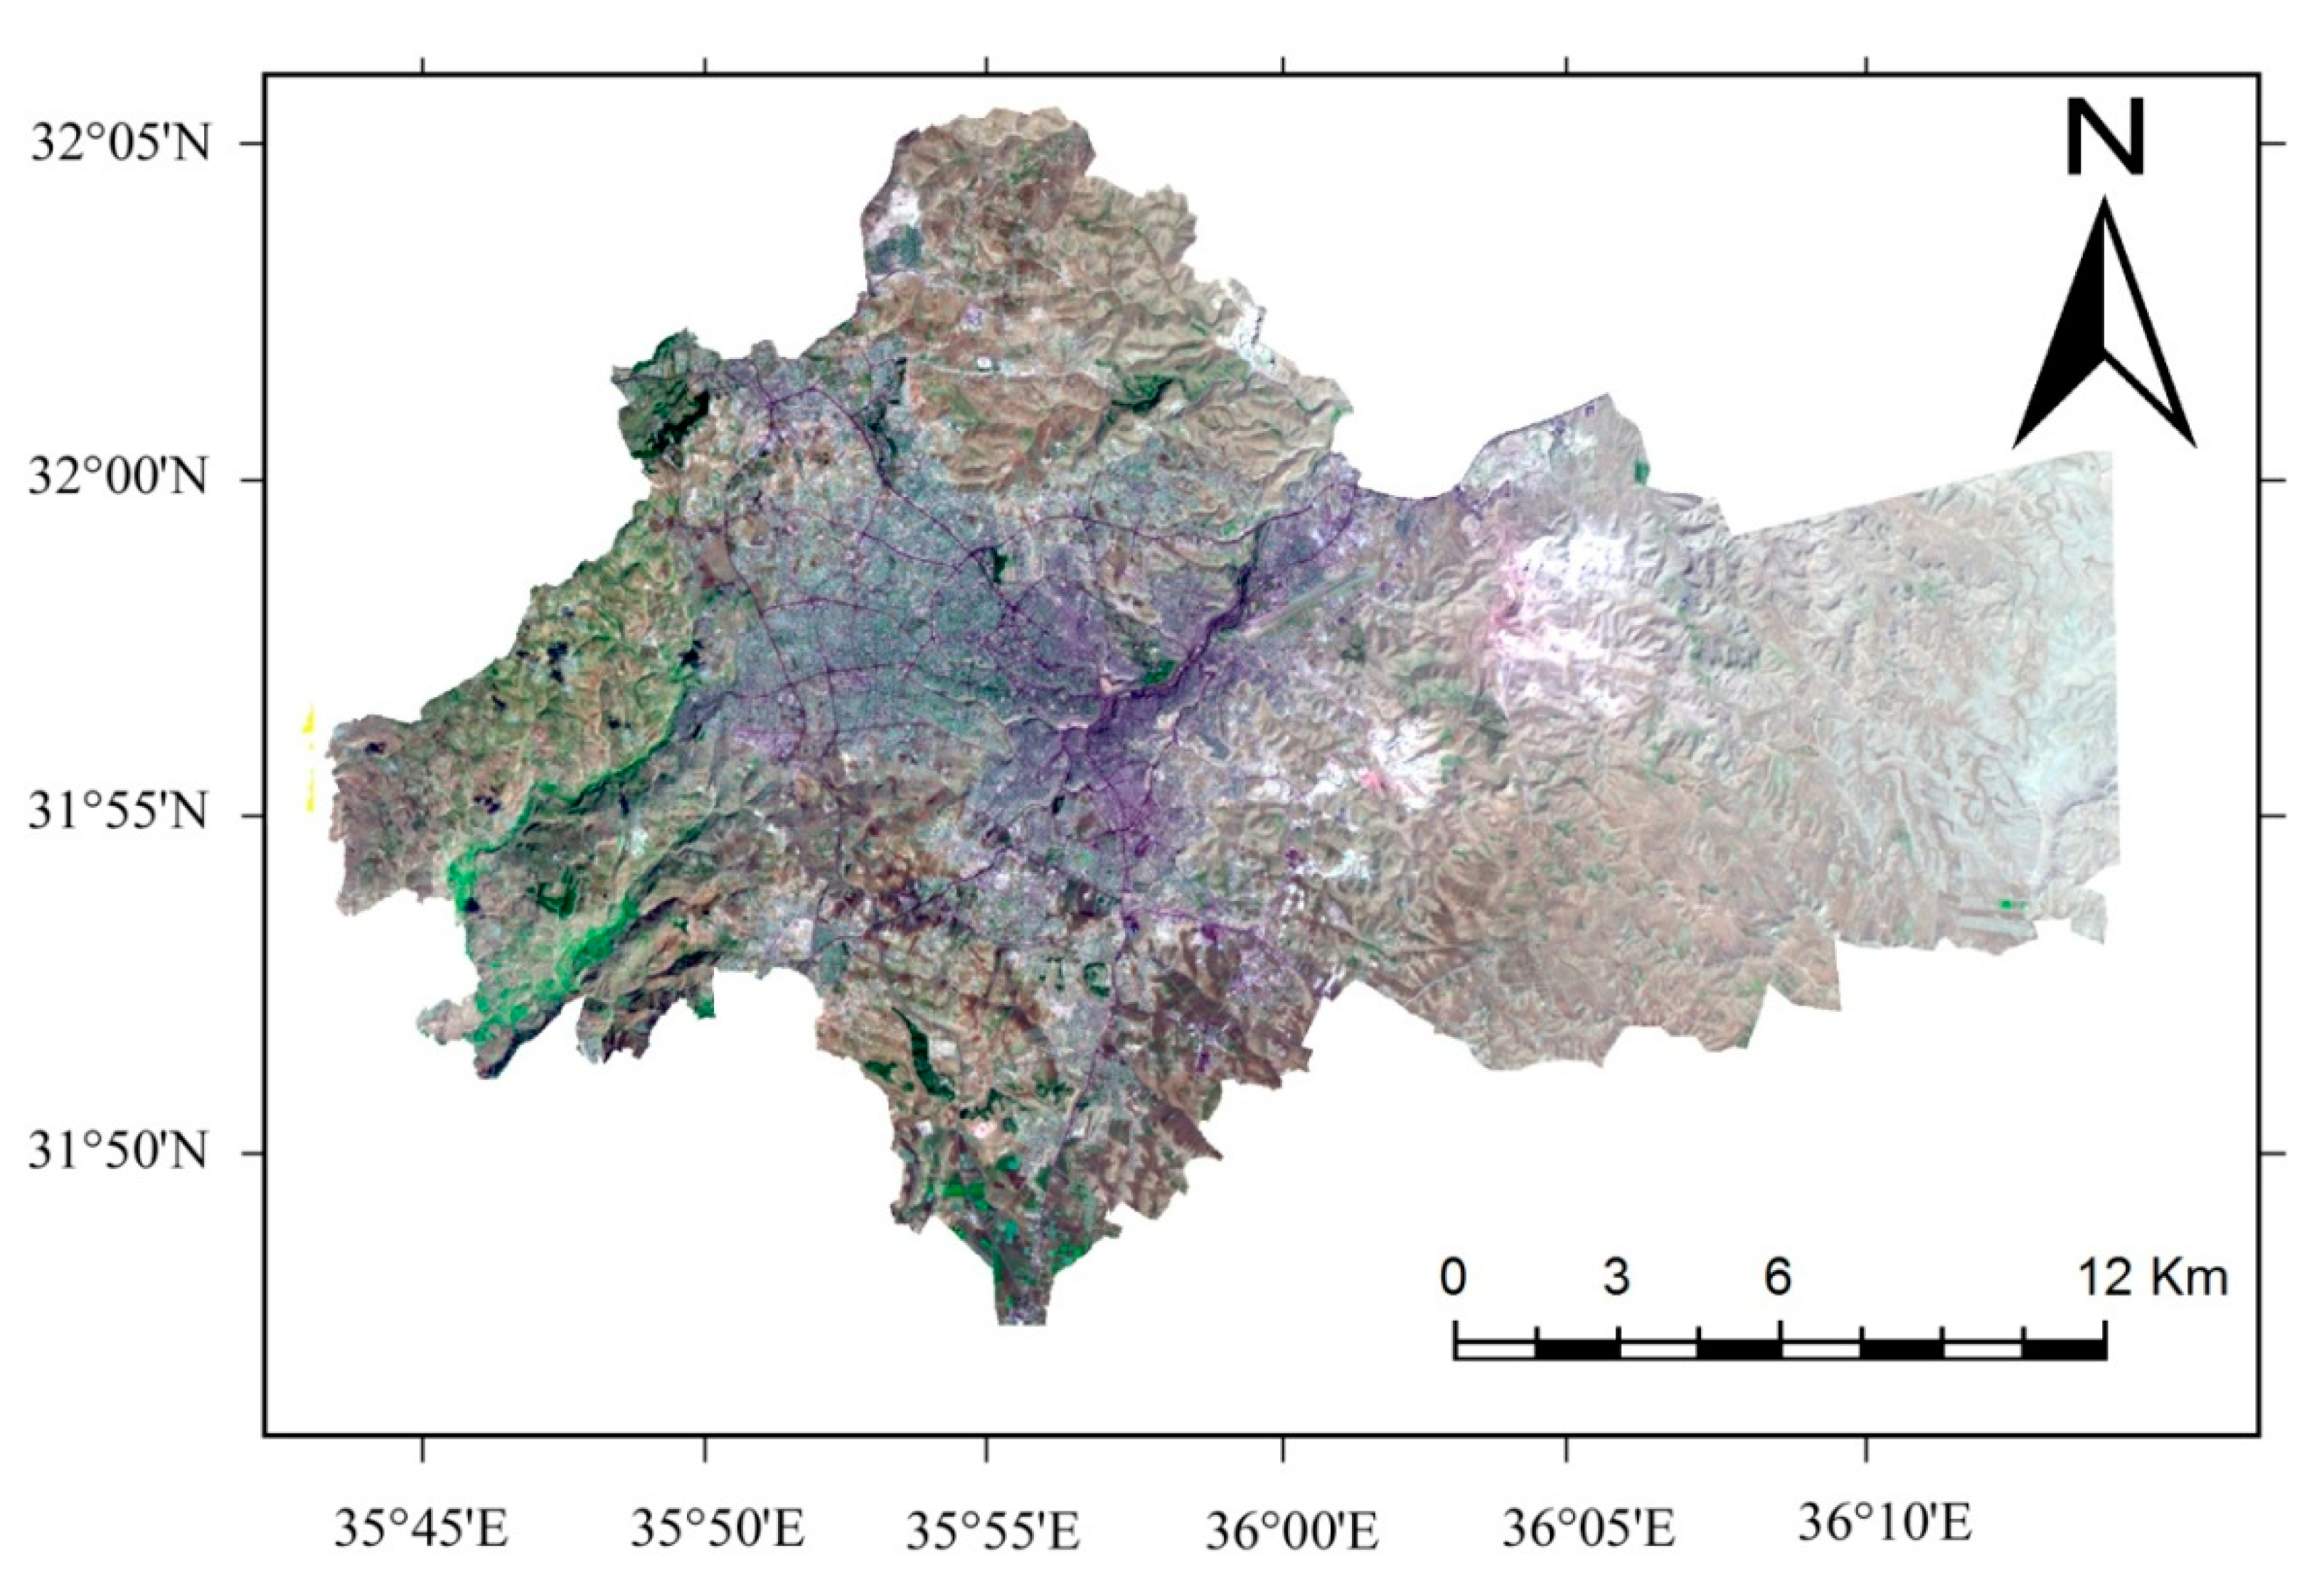
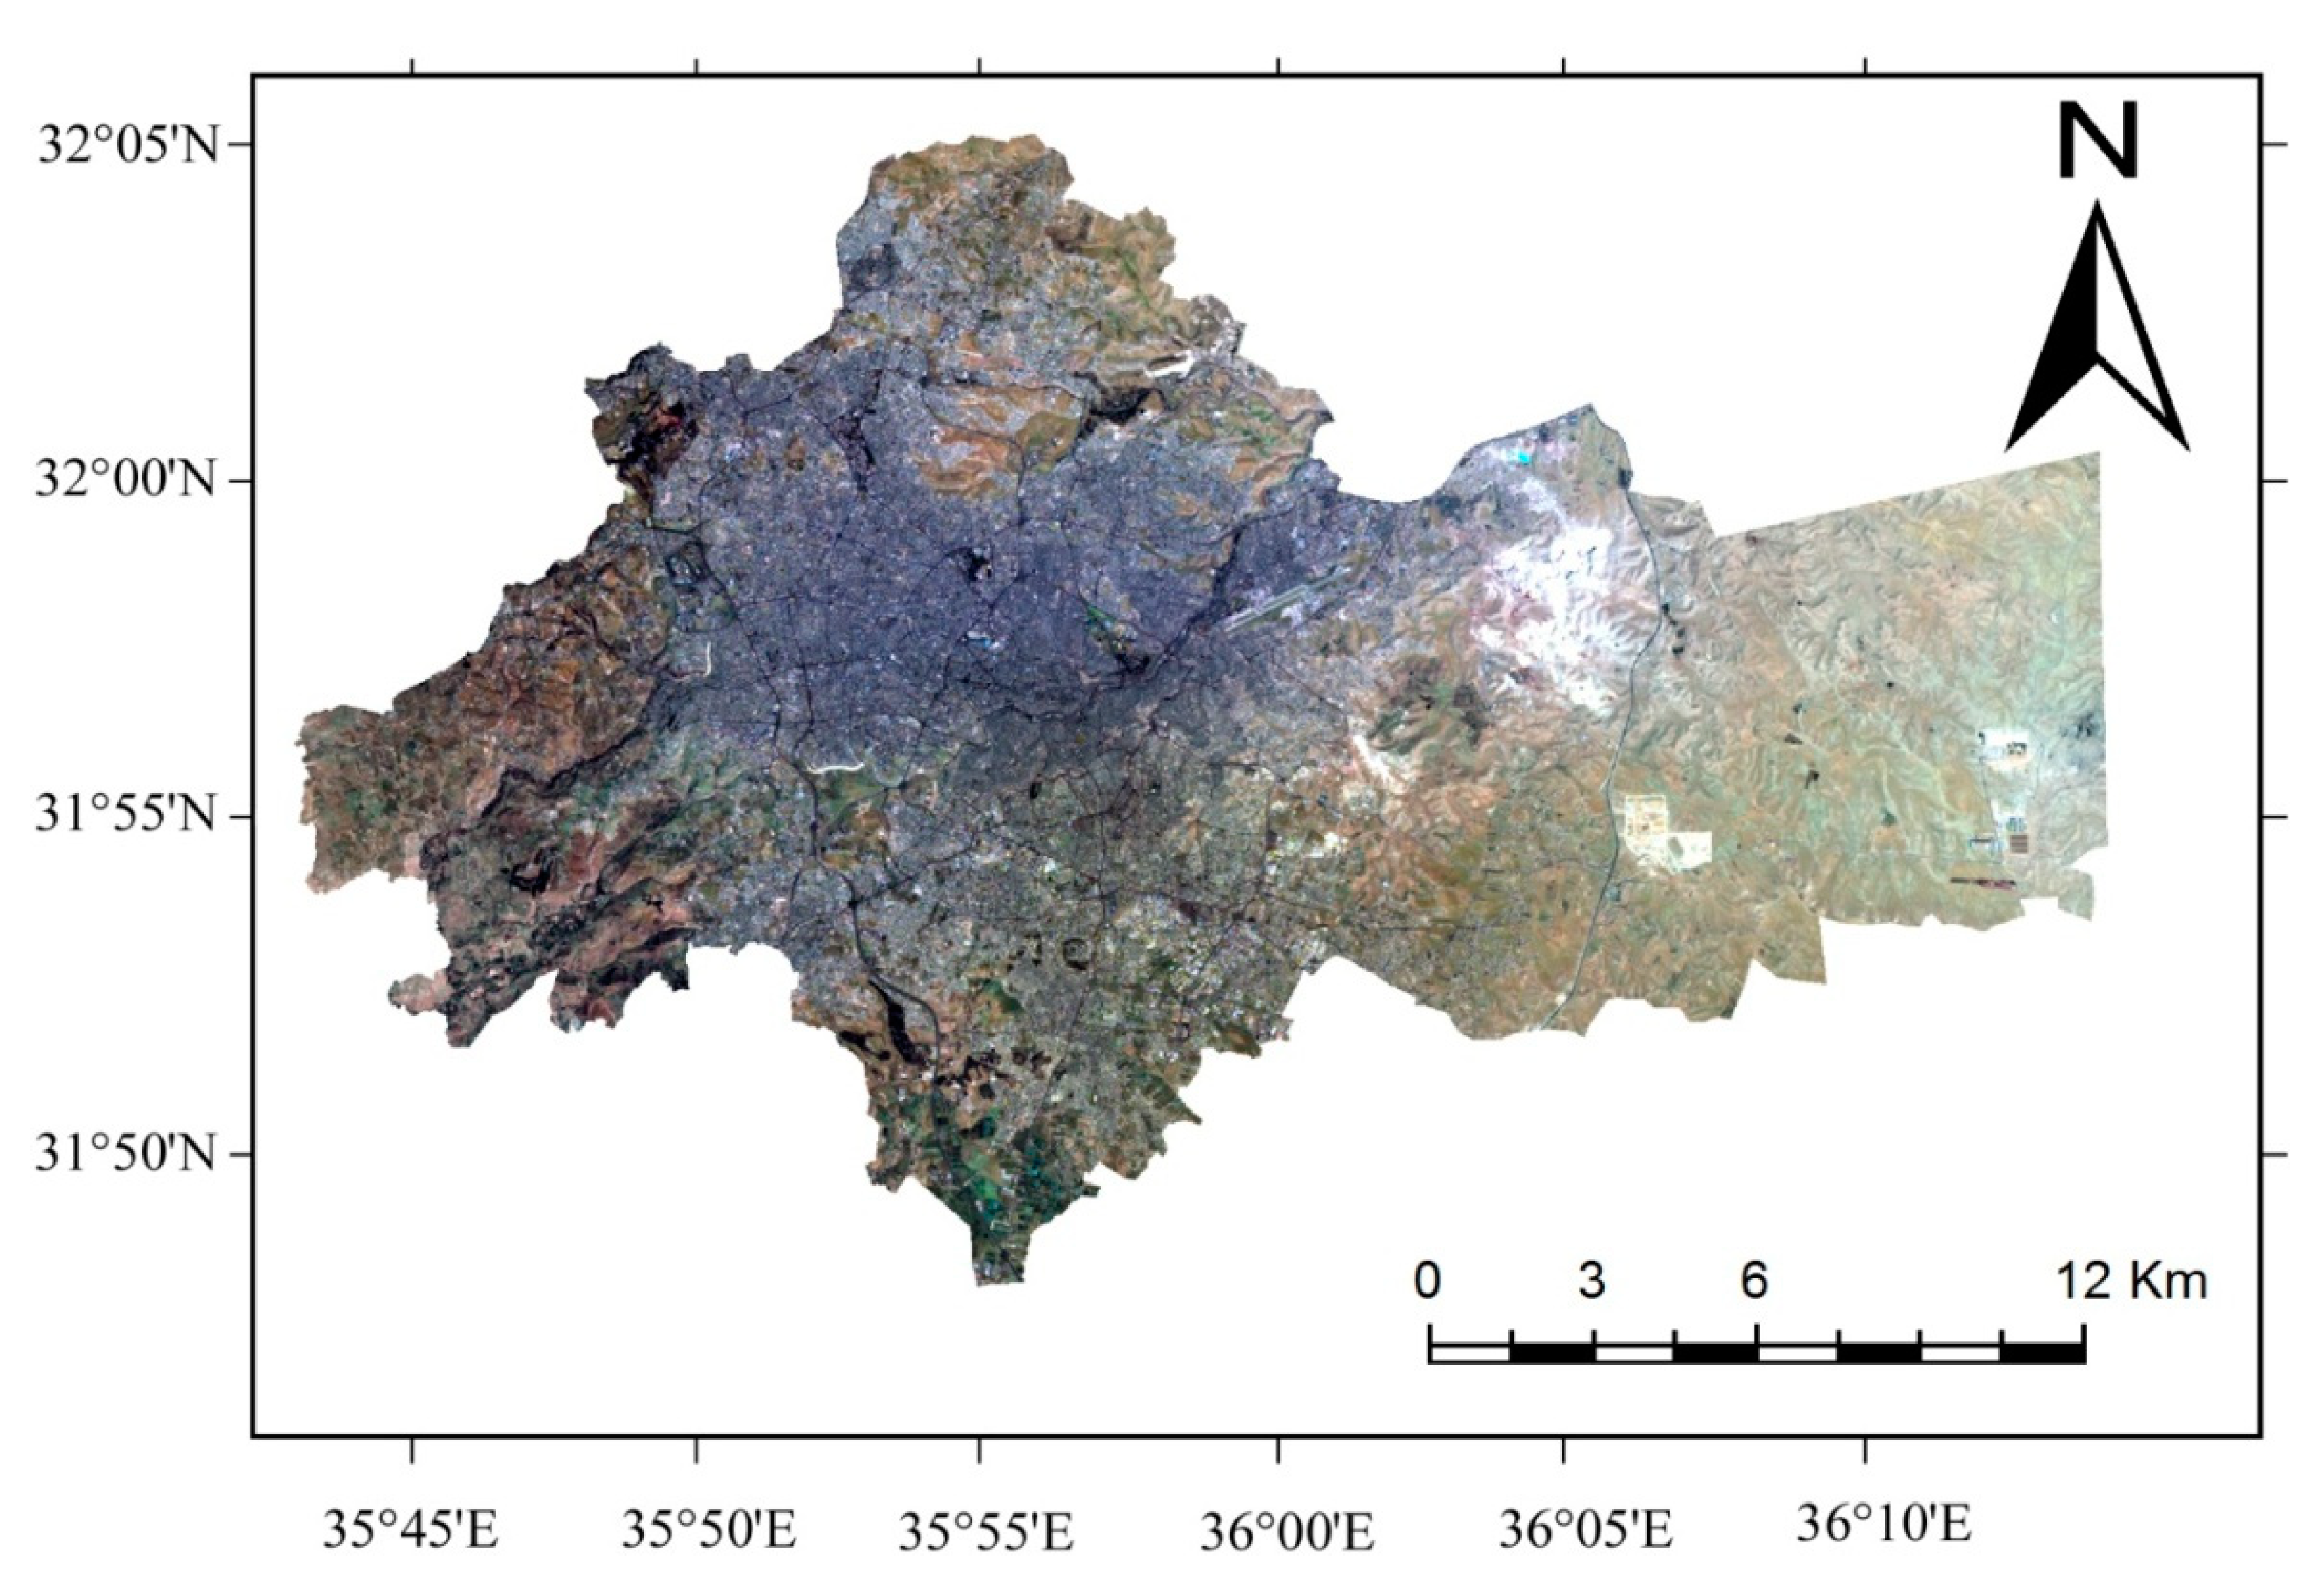
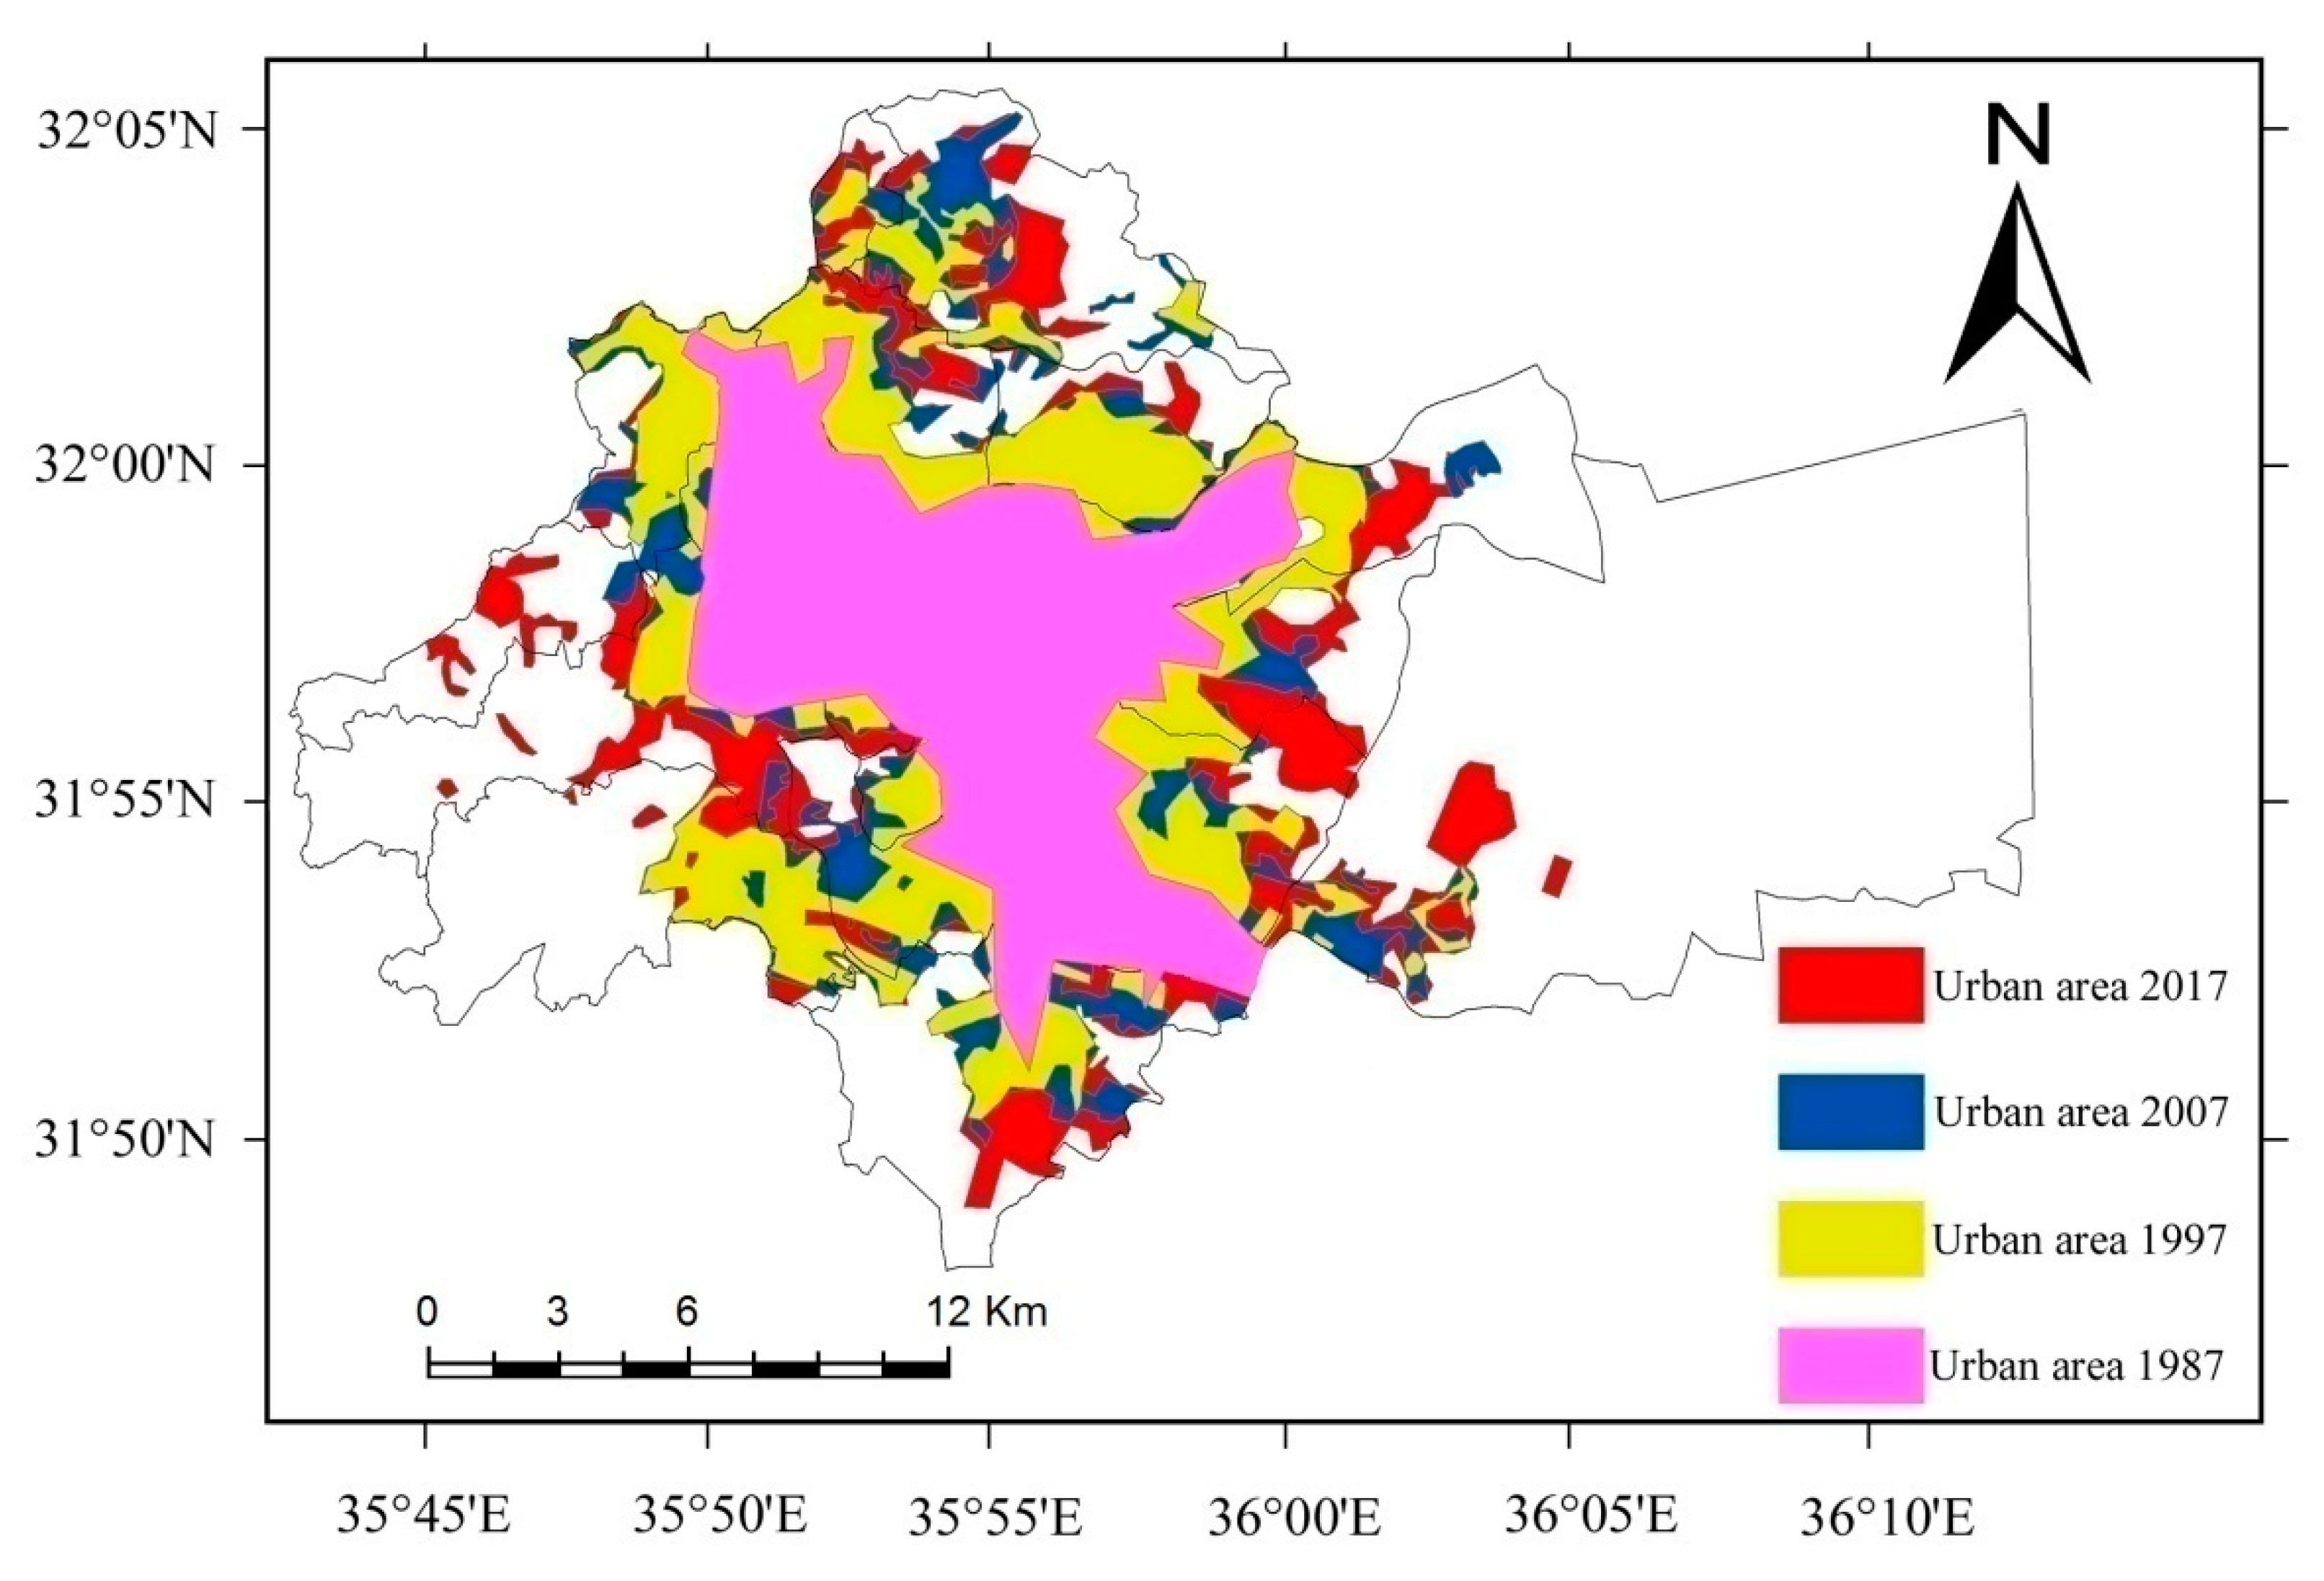
4.1. Urban Expansion Monitoring and Change Detection
4.2. Urban Growth Analysis (1987–2017)
5. Conclusions
Funding
Conflicts of Interest
References
- Wu, Y.; Li, S.; Yu, S. Monitoring urban expansion and its effects on land use and land cover changes in Guangzhou city, China. Environ. Monit. Assess. 2016, 188, 54. [Google Scholar] [CrossRef]
- Lambin, E.F.; Turner, B.L.; Geist, H.J.; Agbola, S.B.; Angelsen, A.; Bruce, J.W.; Coomes, O.T.; Dirzo, R.; Fischer, G.; Folke, C.; et al. The cause of land cover change moving beyond the myths. Glob. Environ. Chang. 2001, 11, 261–269. [Google Scholar] [CrossRef]
- Katyambo, M.M.; Ngigi, M.M. Spatial monitoring of urban growth using GIS and remote sensing: A case study of Nairobi metropolitan area, Kenya. Am. J. Geogr. Inf. Syst. 2017, 6, 64–82. [Google Scholar]
- Karanam, H.K.; Neela, V.B. Study of normalized difference built-up (NDBI) index in automatically mapping urban areas from Landsat TN imagery. Int. J. Eng. Sci. Math. 2017, 8, 239–248. [Google Scholar]
- Dewan, A.M.; Kabir, M.H.; Nahar, K.; Rahman, M.Z. Urbanization and environmental degradation in Dhaka metropolitan area of Bangladesh. Int. J. Environ. Sustain. Dev. 2012, 11, 118–147. [Google Scholar] [CrossRef]
- Li, X.; Yeh, A.G.O. Analyzing spatial restructuring of land use patterns in a fast growing region using remote sensing and GIS. Landsc. Urban Plane J. 2004, 64, 67–76. [Google Scholar] [CrossRef]
- Chen, S.; Zeng, S.; Xie, C. Remote sensing and GIS for urban growth analysis in China. Photogramm. Eng. Remote Sens.J. 2000, 66, 593–598. [Google Scholar]
- Liu, H.; Weng, Q. Scaling-up effect on the relationship between landscape pattern and land surface temperature. Photogramm. Eng. Remote Sens. J. 2009, 75, 291–304. [Google Scholar] [CrossRef]
- Adersson, E. Urban landscapeand sustainable cities. Ecol. Soc. 2006, 11, 34. [Google Scholar] [CrossRef]
- Zhou, N.; Zhao, S. Urbanization process and induced environmental geological hazards in China. Nat. Hazard 2013, 67, 797–810. [Google Scholar] [CrossRef]
- Bhatta, B. Analysis of urban growth pattern using remote sensing and GIS: A case study of Kolkata, India. Int. J. Remote Sens. 2009, 30, 4733–4746. [Google Scholar] [CrossRef]
- Zhou, D.; Shi, P.; Wu, X.; Ma, J.; Yu, J. Effects of urbanization expansion on landscape pattern and region ecological risk in Chinese coastal city: A case study of Yantai city. Sci. World J. 2014, 2014, 821781. [Google Scholar] [CrossRef]
- Batisani, N.; Yarnal, B. Urban expansion in Centre County, Pennsylvania: Spatial dynamics and landscape transformations. Appl. Geogr. 2009, 29, 235–249. [Google Scholar] [CrossRef]
- Pirnazar, M.; Ali-Askari, K.; Eslamian, S.; Singh, V.; Dalezios, N.; Ghane, M.; Qasemi, Z. Change detection of urban land use and erban expansion using GIS and RS, case study: Zanjan Province, Iran. Int. J. Constr. Civ. Eng. IJCRCE 2018, 4, 23–38. [Google Scholar]
- Al-Bilbisi, H.H. Land use/cover change detection in arid and semi-arid areas of Northeastern Jordan using Landsat images. Jordan J. Soc. Sci. 2017, 10, 265–275. [Google Scholar]
- Soffianian, A.; Ahmadiadoushan, M.; Yaghmael, L.; Falahatkar, S. Mapping and analyzing urban expansion using remotely sensed imagery in Isfahan, Iran. World Appl. Sci. J. 2010, 9, 1370–1378. [Google Scholar]
- Al-Bilbisi, H.; Tateishi, R. Using satellite remote sensing data to detect land use/cover changes and to monitor land degradation in central Jordan. J. Jpn. Soc. Photogramm. Remote Sens. 2003, 42, 4–18. [Google Scholar] [CrossRef]
- Weng, Q. Land use change analysis in Zhujiang Delta of China using satellite remote sensing, GIS and stochastic modeling. J. Environ. Manag. 2002, 64, 273–284. [Google Scholar] [CrossRef]
- Al-Bilbisi, H. A two decades land use/cover change detection and land degradation monitoring in central Jordan using satellite images. Jordan J. Soc. Sci. 2012, 5, 133–149. [Google Scholar]
- Department of Statistics (DOS) of Jordan. Jordan in Figures Book; Department of Statistics of Jordan: Amman, Jordan, 2018.
- Bender, F. Geology of Jordan; Gebrider Borntraeger: Berlin, Germany, 1974. [Google Scholar]
- Potter, R.B.; Darmame, K.; Barham, N.; Nortcliff, S. Ever-growing Amman, Jordan: Urban expansion, social polarisation and contemporary urban planning issues. Habitate Int. 2008, 33, 81–92. [Google Scholar] [CrossRef]
- Ministry of Municipal and Environment of Jordan. National strategy for Jordan; Ministry of Municipal and Environment of Jordan: Amman, Jordan, 1991.
- Al-Bakri, J.; Duggah, M.; Brewer, T. Application of remote sensing and GIS for modeling and assessment of landuse/cover change in Amman/Jordan. J. Geogr. Inf. Syst. 2013, 5, 509–519. [Google Scholar]
- Jordan Meteorological Department (JMD). Climatic Data Report; Jordan Meteorological Department: Amman, Jordan, 2017.
- Jensen, J.R. Introductory Digital Image Processing: A Remote Sensing Perspective, 3rd ed.; Prentice Hall: Upper Saddle River, NJ, USA, 2005. [Google Scholar]
- Schowengerdt, R.A. Remote Sensing: Models and Methods for Image Processing, 3rd ed.; Academic Press: London, UK, 2006. [Google Scholar]
- Sato, H.; Tateishi, R. Proposal for global land cover guideline legend based on FAO’s LCCS. Asian J. Geoinf. 2002, 3, 35–46. [Google Scholar]
- Campbell, J.B. Introduction to Remote Sensing; Guilford Press: New York, NY, USA, 2006. [Google Scholar]
- Lillesand, T.M.; Kiefer, R.W. Remote Sensing and Image Interpretation, 3rd ed.; John Wiley & Sons, Inc.: New York, NY, USA, 2003. [Google Scholar]
- Yang, X.; Lo, C.P. Using a time series of satellite imagery to detect land use and land cover changes in the Atlanta, Georgia metropolitan area. Int. J. Remote Sens. 2002, 23, 1775–1798. [Google Scholar] [CrossRef]
- Singh, A. Digital change detection techniques using remotely-sensed data. Int. J. Remote Sens. 1989, 10, 989–1003. [Google Scholar] [CrossRef]
- Xiao, J.Y.; Shen, Y.J.; Ge, J.F.; Tateishi, R.; Tang, C.Y.; Liang, Y.Q. Evaluating urban expansion and land use change in Shijiazhuang, China, by using GIS and remote sensing. Landsc. Urban Plan. J. 2006, 75, 69–80. [Google Scholar] [CrossRef]


| No | Class | Definitions |
|---|---|---|
| 1 | Urban Area | Construction materials (e.g., asphalt, concrete, etc.), typically commercial and industrial buildings, residential developments including mostly single/multiple houses, and transportation facilities (e.g., airports, parking lots, highways, local roads). |
| 2 | Vegetation | Field crops, trees (mainly olives and fruit trees), deciduous and evergreen oaks and coniferous trees including both protected and open forests, and open shrub and herbaceous rangelands. |
| 3 | Exposed Rocks | Consolidated lands (bare rock areas, gravels, stones, and boulders). |
| 4 | Exposed Soils | Unconsolidated lands (bare soil areas). |
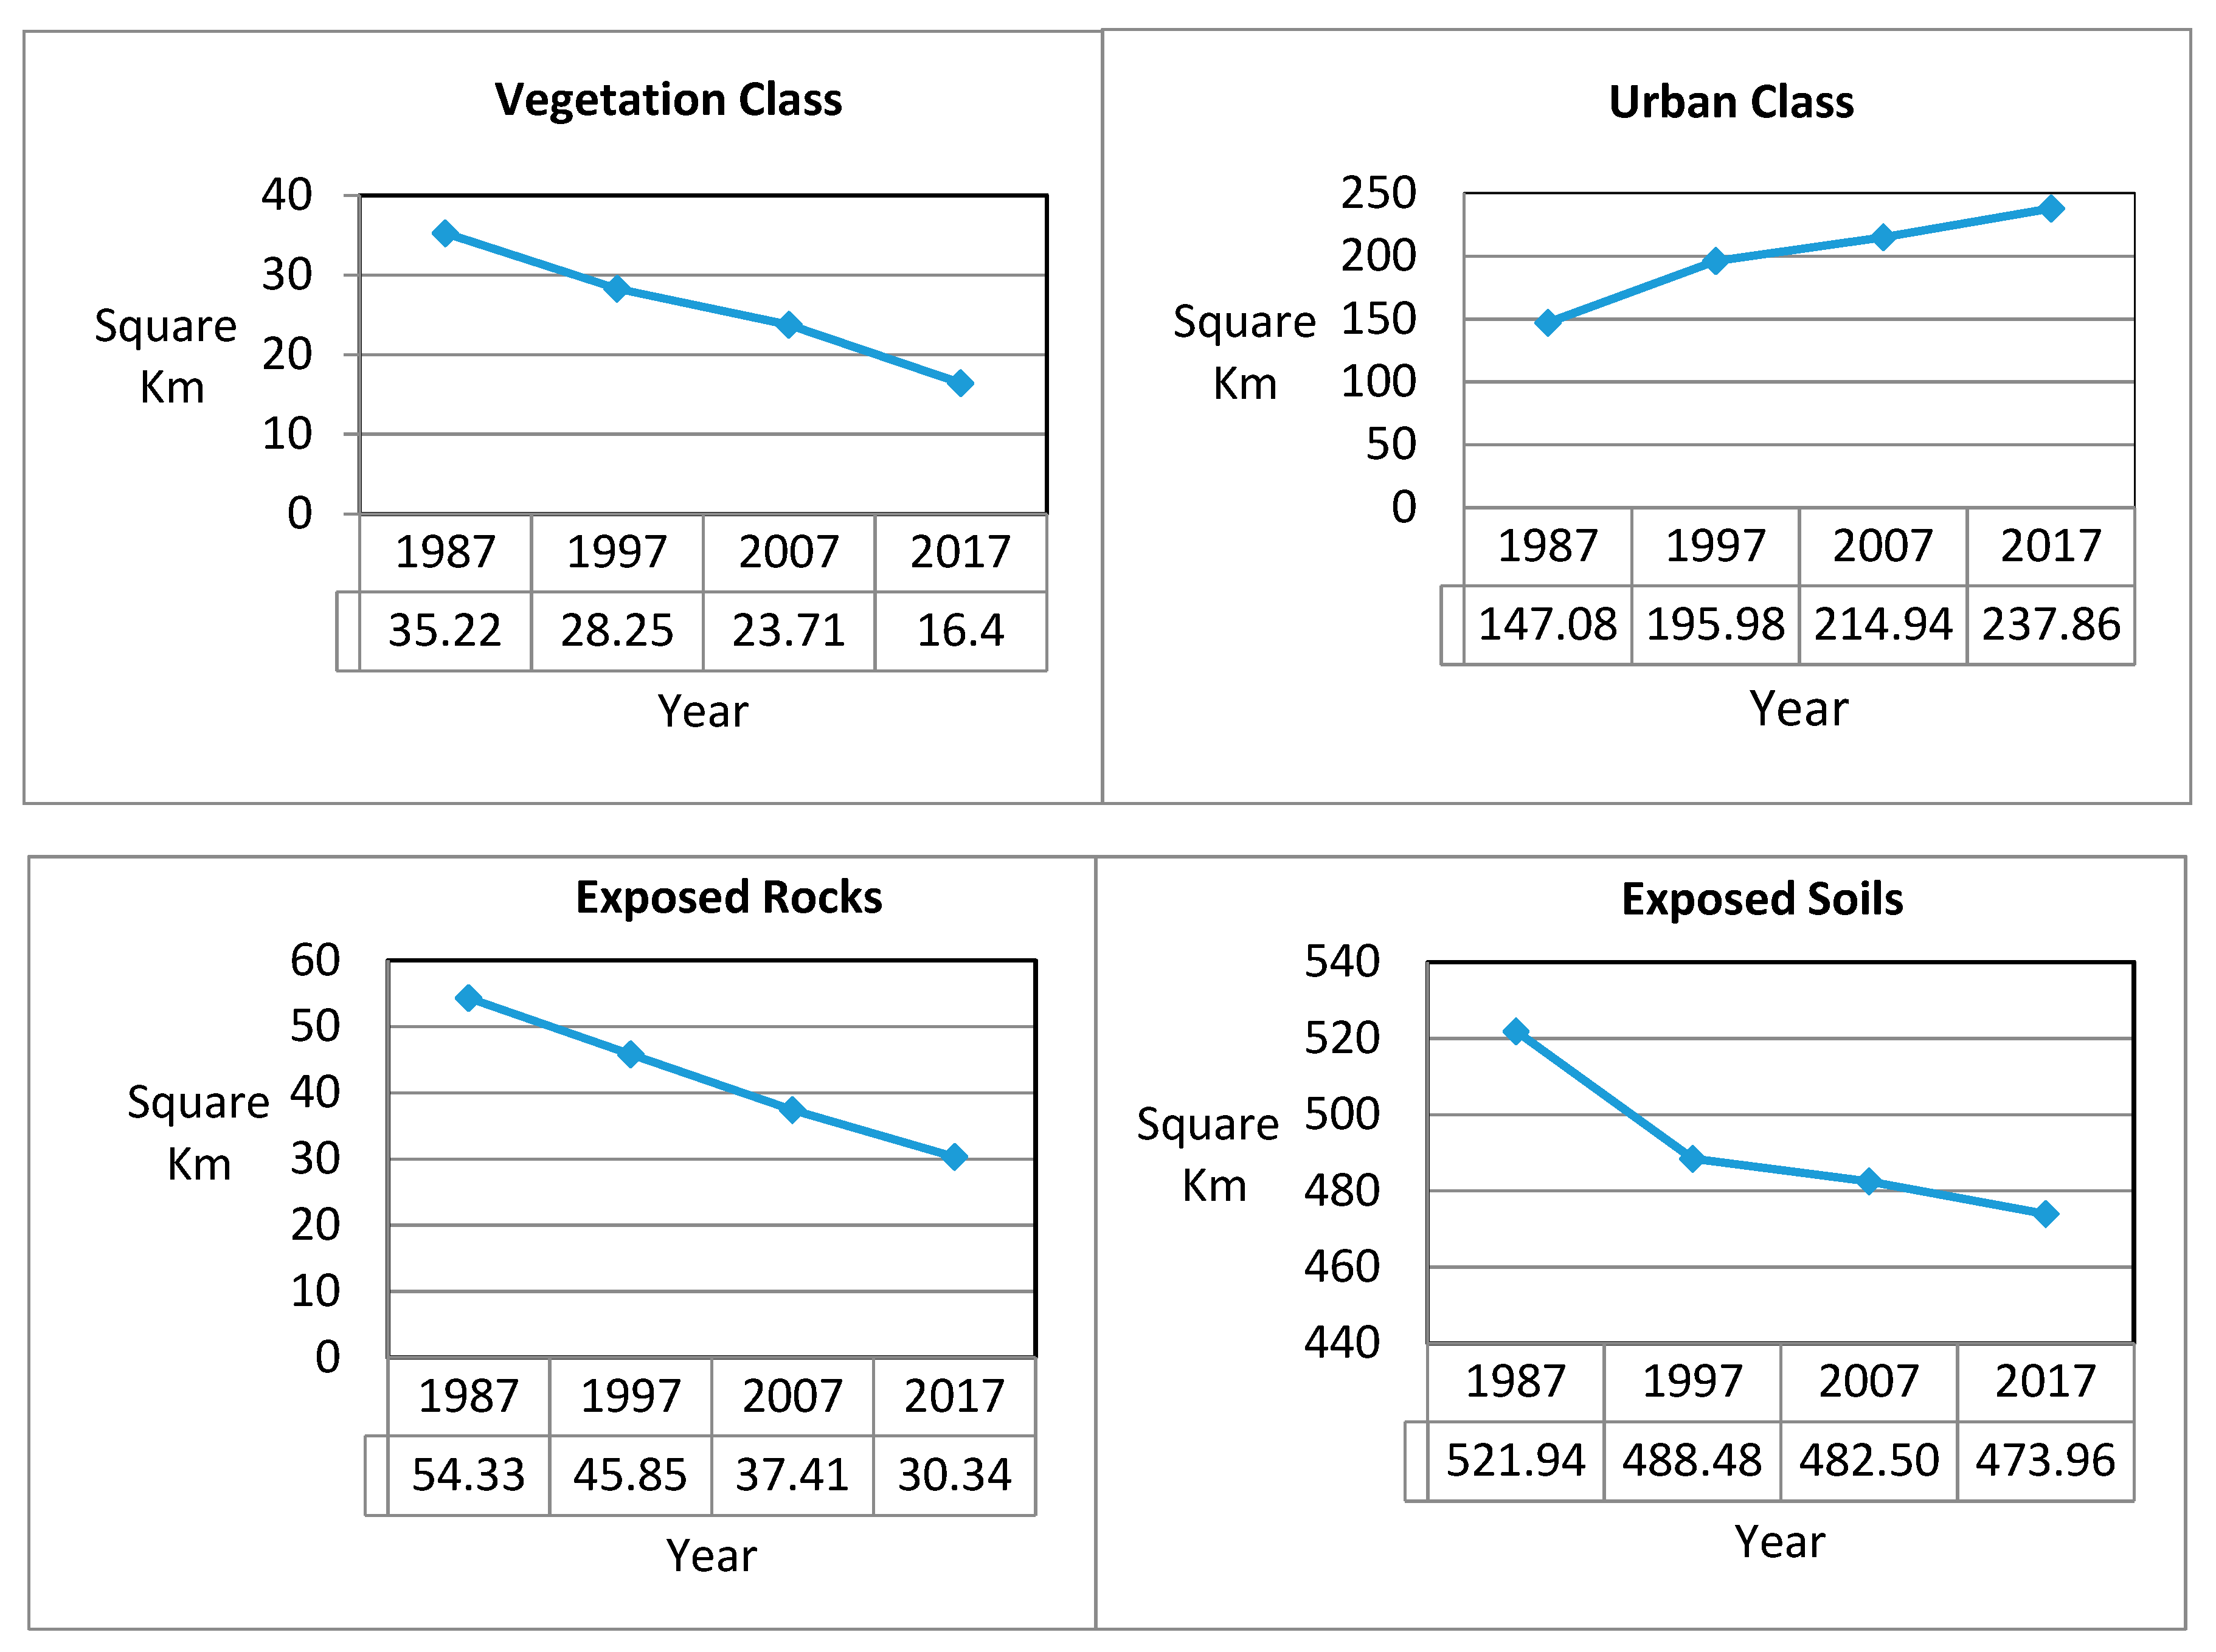
| Class Name | 1987Area (km2)/(%) | 1997Area (km2)/(%) | 2007Area (km2)/(%) | 2017Area (km2)/(%) | % of Increase or Decrease Since 1987 | ||||
|---|---|---|---|---|---|---|---|---|---|
| Urban Area | 147.08 | 19.39 | 195.98 | 25.84 | 214.94 | 28.34 | 237.86 | 31.36 | +61.73% |
| Vegetation | 35.22 | 4.64 | 28.25 | 3.72 | 23.71 | 3.13 | 16.40 | 2.16 | −53.54% |
| Exposed Rocks | 54.32 | 7.16 | 45.85 | 6.04 | 37.41 | 4.93 | 30.34 | 4.00 | −44.13% |
| Exposed Soils | 521.94 | 68.81 | 488.48 | 64.40 | 482.50 | 63.60 | 473.96 | 62.48 | −9.23% |
| Year | Urban Area (km2) | Annual Growth(%) |
|---|---|---|
| 1987 | 147.08 | ----- |
| 1997 | 195.98 | 3.33 |
| 2007 | 214.94 | 0.97 |
| 2017 | 237.86 | 1.07 |
© 2019 by the author. Licensee MDPI, Basel, Switzerland. This article is an open access article distributed under the terms and conditions of the Creative Commons Attribution (CC BY) license (http://creativecommons.org/licenses/by/4.0/).
Share and Cite
Al-Bilbisi, H. Spatial Monitoring of Urban Expansion Using Satellite Remote Sensing Images: A Case Study of Amman City, Jordan. Sustainability 2019, 11, 2260. https://doi.org/10.3390/su11082260
Al-Bilbisi H. Spatial Monitoring of Urban Expansion Using Satellite Remote Sensing Images: A Case Study of Amman City, Jordan. Sustainability. 2019; 11(8):2260. https://doi.org/10.3390/su11082260
Chicago/Turabian StyleAl-Bilbisi, Hussam. 2019. "Spatial Monitoring of Urban Expansion Using Satellite Remote Sensing Images: A Case Study of Amman City, Jordan" Sustainability 11, no. 8: 2260. https://doi.org/10.3390/su11082260
APA StyleAl-Bilbisi, H. (2019). Spatial Monitoring of Urban Expansion Using Satellite Remote Sensing Images: A Case Study of Amman City, Jordan. Sustainability, 11(8), 2260. https://doi.org/10.3390/su11082260