1. Introduction
Traffic crashes cause property loss, casualties, and have a high financial cost every year. Reducing accident rates and injury severities has long been a major attention for highway departments [
1]. Crashes on curves lead to more severe injuries owing to the complicated linear roadway conditions, unstable traffic speed, and dangerous driving conditions on curved sections. Poorly constructed road curves and relevant infrastructures would cause an extremely high accident rate and severe accident severities on curves [
2]. In the latter half of 2007, 1392 fatalities occurred as a result of traffic crashes in Florida. Among these, 176 fatalities occurred on curved sections of road, accounting for 12.6% of all fatalities according to the crash data in Florida. The percentage is higher than the 4.4% crashes on horizontal curves among all accidents. Therefore, an in-depth study on determining the influencing factors that can largely affect the accident severity on curves is highly necessary. Exploring the mechanisms that affect accident severities in a specific situation is also an important part of sustainable transportation. After grasping the critical factors, corresponding countermeasures in terms of the construction on curves, vehicle design, policy-making, etc. can be proposed in the future.
Many studies have found that some attributing factors like vehicle characteristics, accident locations, environmental conditions and driver behavior can significantly influence accident severities. Variations in vehicle incompatibility can largely influence the accident severity when a crash occurs [
3]. Crash locations and drivers with alcohol/drugs impairment, are also critical factors associated with injury severity [
4]. Edwards [
5] suggested a correlation between accident severities and weather conditions, and the finding indicated that injury severity decreases in rainy days.
However, these studies failed to consider factors such as road geometric characteristics, vehicle factors, location factors, and driver factors together in accident severities on horizontal curves.
This paper aims to conduct Bayesian networks to analyze traffic accident injury severities and influencing factors for crashes on horizontal curves using traffic crash data collected in the latter half of 2007 in Florida. The essence of Bayesian network modelling provides an effective method to solve problems, changing increments to influence probabilities [
6]. In this paper, a model based on Bayesian networks is developed to establish reliable relationships between accident severities and significant factors. The results can be applied in the prediction of crash likelihood to help enhance curved road safety through the implementation of proper countermeasures in dangerous situations.
2. Literature Review
Launching traffic crash analysis requires a comprehensive understanding of related literature in traffic safety field. The effective method to traffic crash analysis emphasizes on discovering the critical factors of traffic accidents.
2.1. Safety Analysis on Roadways
Mujalli and de Oña [
7] summarized 19 modelling techniques applied to the accident severity analysis, and the performance of these models was compared according to seven principles. Yannis et al. [
8] performed an integrate literature review on road safety in terms of theoretical methods, model implementations, data sources and obtained results. Although various models may be utilized for studies of various purposes, most modelling involves discovering relationships between factors, and predicting outcomes. A framework was proposed to improve the road safety system and to reduce crashes with the aid of crash data involving a series of variables (collision mode, road category, etc.) in Romania from 2012–2016 [
9]. Statistic-descriptive method was used to investigate accidents involving good vehicles in European countries. The study discovered that the road junctions are the critical accident-prone areas [
10]. Cheng, Zu and Lu [
11] conducted a comprehensive spatiotemporal model for investigating the traffic crash evolution characteristics and labelling crash hot spots in Wujiang, Suzhou, China. Seven factors (crash occurrence at night, the existence of three or fewer traffic lanes in a freeway section, etc.) were identified to be statistically significant in contributing to non-recurrent congestion motived by crashes [
12].
Regression analysis has been broadly popularized to capture the associations between significant variables and accident severities [
13]. Most regression models are gained from the generalized linear modelling (GLM) because of its explicit theoretical foundations and its ability to explain each variable included in the model [
14]. Jiang et al. [
15] investigated hit-and-run crashes in Shanghai urban river-crossing road tunnels and proposed some countermeasures for preventing this kind of crashes employing a binary logistic regression model. Some more complicated regression models, such as the logistic regression models have been used more commonly in accident analysis over the past decade [
16,
17,
18,
19]. Oh [
20] established ordered probit regression models to determine the probabilities of injury severity degrees for all types of crashes. A zero-inflated hierarchical ordered probit approach was proposed to forecast accuracy improvements in terms of accident severities [
21]. Jang et al. [
22] developed a multi-level Poisson regression model to capture the association between external environment and crashes. However, the majority of regression methods applied for discovering injury severity have some pre-defined associations between variables. If these assumed relationships do not exist, the models mentioned above could produce erroneous outcomes.
Over the past few years, Bayesian networks have gained increasing popularity among safety analysts, and have become one of the most effective ways to determine relationships between accident severities and influencing factors [
23,
24]. Zhao, Wang, and Qian [
25] discussed the elements that influence hazardous transport crashes by establishing a Bayesian network model with the aid of expert knowledge. Chen et al. [
26] developed a hybrid approach based on multinomial logit models to comprehensively explore accident severities in the cases of rear-end accidents. Mbakwe et al. [
27] combined Delphi method with Bayesian networks for discovering the characteristics of highway road accidents and predicting accident occurring frequencies. Theofilatos [
28] found traffic variations exert a dramatic effect on accident occurrence in urban arterials using Bayesian logistic regression.
2.2. Safety Analysis on Curves
These studies provided a detailed view of applications in safety analysis on roadways. However, the curved roadways are more risky because of the complicated linear roadway conditions, vehicle performances, driver expectations, and other reasons. The research area for safety analysis of curves consists of geometric design consistency, accident surrogates, spatial relationships, risk assessment, etc. Fink and Krammes [
29] established the relationship between accident rates and operating-speed consistency considering tangent length and sight distance effects at horizontal curves on highways using regression models. Speed reduction is an effective measure to explain accident experience on curves. Horizontal curves requiring speed reductions have higher accident rates than curves that do not require speed reductions [
30]. Findley et al. [
31] incorporated spatial considerations into the safety modelling of horizontal curves using a crash modification factor. Karaduman et al. [
32] predicted the factors related to rural roadway curves exploiting major geometric characteristics such as curvature, direction, and slope type based on the Bayesian belief theory via rear and front car cameras.
Many studies have proven that horizontal curvature has significant safety influence on roadways [
33]. A summary of the literature on traffic safety analysis for curves in terms of research areas and methods is shown in
Table 1.
The majority of previous literature focuses on an individual attribute’s effect on horizontal curve safety, not considerations in various factors that could jointly influence safety. This study develops a Bayesian network model to discover the influence of significant contributing risks on accident severity outcomes for crashes on curves comprehensively. The paper also puts forward some recommendations regarding the design of vehicles, the construction and improvements of curved roadways.
3. Methodology
3.1. Bayesian Networks
Bayesian network approaches have been broadly applied for developing models across many domains, including medical diagnosis and transport severity precaution. They provide a directional graphical representation of the probabilistic relationships that apply to the expression and analysis of uncertainties and probabilities, as well as decisions that are conditionally dependent on multiple control factors. Bayesian networks are among the most effective theoretical modes that can achieve logical reasoning from incomplete, uncertain knowledge or information [
38].
The basic framework of a Bayesian network consists of nodes and arcs, with a list of probability distributions related to each node representing the probabilistic impact of its parents on the node. The nodes are associated with attributes in a certain field, and the arcs are related to a straight effect between variables. A directed arc from X to Y means that X is conditional on Y in the factorization of the joint distribution. Nodes not actually linked indicate variables that are conditionally independent.
3.2. Bayesian Theorem
Bayesian networks are based on Bayes’ theorem, which describes the decrease in uncertainty with increasing knowledge. It combines probability distributions of different parameters and revises their probabilities when a new condition is obtained [
39].
Usually, the theorem is used for the happening probabilities of events, in which case the equation is:
P(Y|X) indicates the posterior occurrence probability of event Y under the circumstance that event X happens; P(Y) represents the prior occurrence probability of event Y; P(X) represents the marginal occurrence probability of event X, which is determined given the provided information; P(X|Y) means the conditional occurrence probability of event X when event Y happens.
When
X is (
), the posterior occurrence probability of
Y is expressed as [
40]:
In this work, Y represents the accident severity of crashes, and X is the set of influencing factors.
3.3. Mutual Information
The mutual information is a quantitative tolerance between variables. More specifically, entropy is used to quantify the uncertainty manifested in the probability distribution of variables. In this work, the uncertainty relates to the to-be-predicted variables. Correlation coefficients only solve linear dependence, while mutual information can determine both linear and non-linear associations between variables [
41,
42,
43].
Entropy for a discrete distribution representing the uncertainty of
X is defined by:
The mutual information between
X and
Y is expressed by:
which is equivalent to:
In this case,
P(
x,
y) denotes the joint probability mass function of
X and
Y.
P(
x) and
P(
y) represent the marginal probability mass functions of
X and
Y, respectively. The mutual information between
X and
Y represents the information of
Y after surveying
X [
44]. If the value of one node is obtained already, information about the other node dependent to the former one will be obtained. Then the mutual information between two nodes can reflect how close the relationship between them.
In this work, the contributing factors to accident severity are all discrete random variables. Take X as the POI, Y as the accident severity. H(Y) denotes the unpredictability of the accident severity, and H(Y|X) denotes the unpredictability about accident severity when the POI is known. P(x,y) describes the joint probability mass function of the POI and accident severity. P(x) and P(y) represent the marginal probability mass functions of POI and accident severity, respectively. Then the value of I(X;Y) represents the expected information obtained about accident severity after observing the level of POI. If POI has a strong correlation with accident severity, the value of I(X;Y) will be higher than those less influencing factors. Take another example of weather condition and road surface condition. As is known to all that there is a great correlation between road surface and weather condition. On rainy days, the ground will be humid. The value of mutual information between these two variables is surely high.
Mutual information is then computed between a target variable and any possible predictors. In this way, we can determine which parameter provides the maximum information gain and, thus, has the greatest predictive importance [
45].
4. Modelling
This section models the influencing factors to accident severities on curves and straight roadways using a Bayesian network method, based on the crash database from the Florida Department of Highway Safety and Motor Vehicles (DHSMV). The data generally contains all the information recorded in the crash report. For each record, more than 300 variables are used to describe the crash. Two main data sets are involved in the study: accident data and vehicle data. The database contains descriptions of the crash, including time of accident, crash location, crash type, injury severity, roadway geometric characteristics, and weather conditions. Under each variable, there are several situations which are coded using a sequence of Arabic numerals. The injury severity model is developed and the data analysis is revealed in the following sections.
4.1. Data Preparation
This research employs rear-end crash data records collected in Florida in the latter half-year of 2007. Records with incomplete information were removed from the study dataset to ensure credibility. And only a small amount of data is missing, which accounts for 0.17% of total records on crashes happened on curves.
A total of 7035 records of crashes on curves in 2007 from the Florida DHSMV database were used. Data for 137,157 crashes on straight roadways were also included in the research. To discover the interaction of significant factors influencing accident severities on curves, crashes on straight roadways are used for comparison and to highlight the characteristics of crashes on curved ones. Further information on the variables of crashes on curves is listed in
Table 2.
Regarding POI, the crash data provided 21 different locations in a car. According to the existing classifications [
46], the locations are divided into four separate levels according to injury severities. Nine POIs constitute level 1: front end, right front corner, right rear door, right rear quarter panel, right rear corner, left rear corner, left rear quarter panel, left front corner, and trailer. Most of these are the farthest points from drivers [
3]. Five POIs (right front quarter panel, rear end, left rear door, hood, and trunk) constitute level 2. They are closer to the drivers’ seat. Level 3 POIs (right front door, left front door, left front quarter panel, undercarriage, and windshield) are even closer to the driver’s seat of the vehicle. Level 4 comprises two POIs (roof, overturn), which are related to the highest injury severity risk.
Regarding vehicle movements (VEHMOVE), three conditions constitute level 1: straight ahead, slowing/stopped, and properly parked. Level 2 comprises left/right turn, backing, and changing lanes. Level 3 comprises entering/leaving parking space, improperly parked, U-turn, passing, and driverless or runaway. Unknown and other factors constitute level 4.
4.2. Bayesian Networks Structure Learning
In this work, modeling of accident severities for curved and straight roadways is carried out with the aid of the BayesiaLab software [
45]. The aim is to discover the associations between attributing factors influencing accident severities for curved roadways compared with straight ones. The framework of the Bayesian network presented in
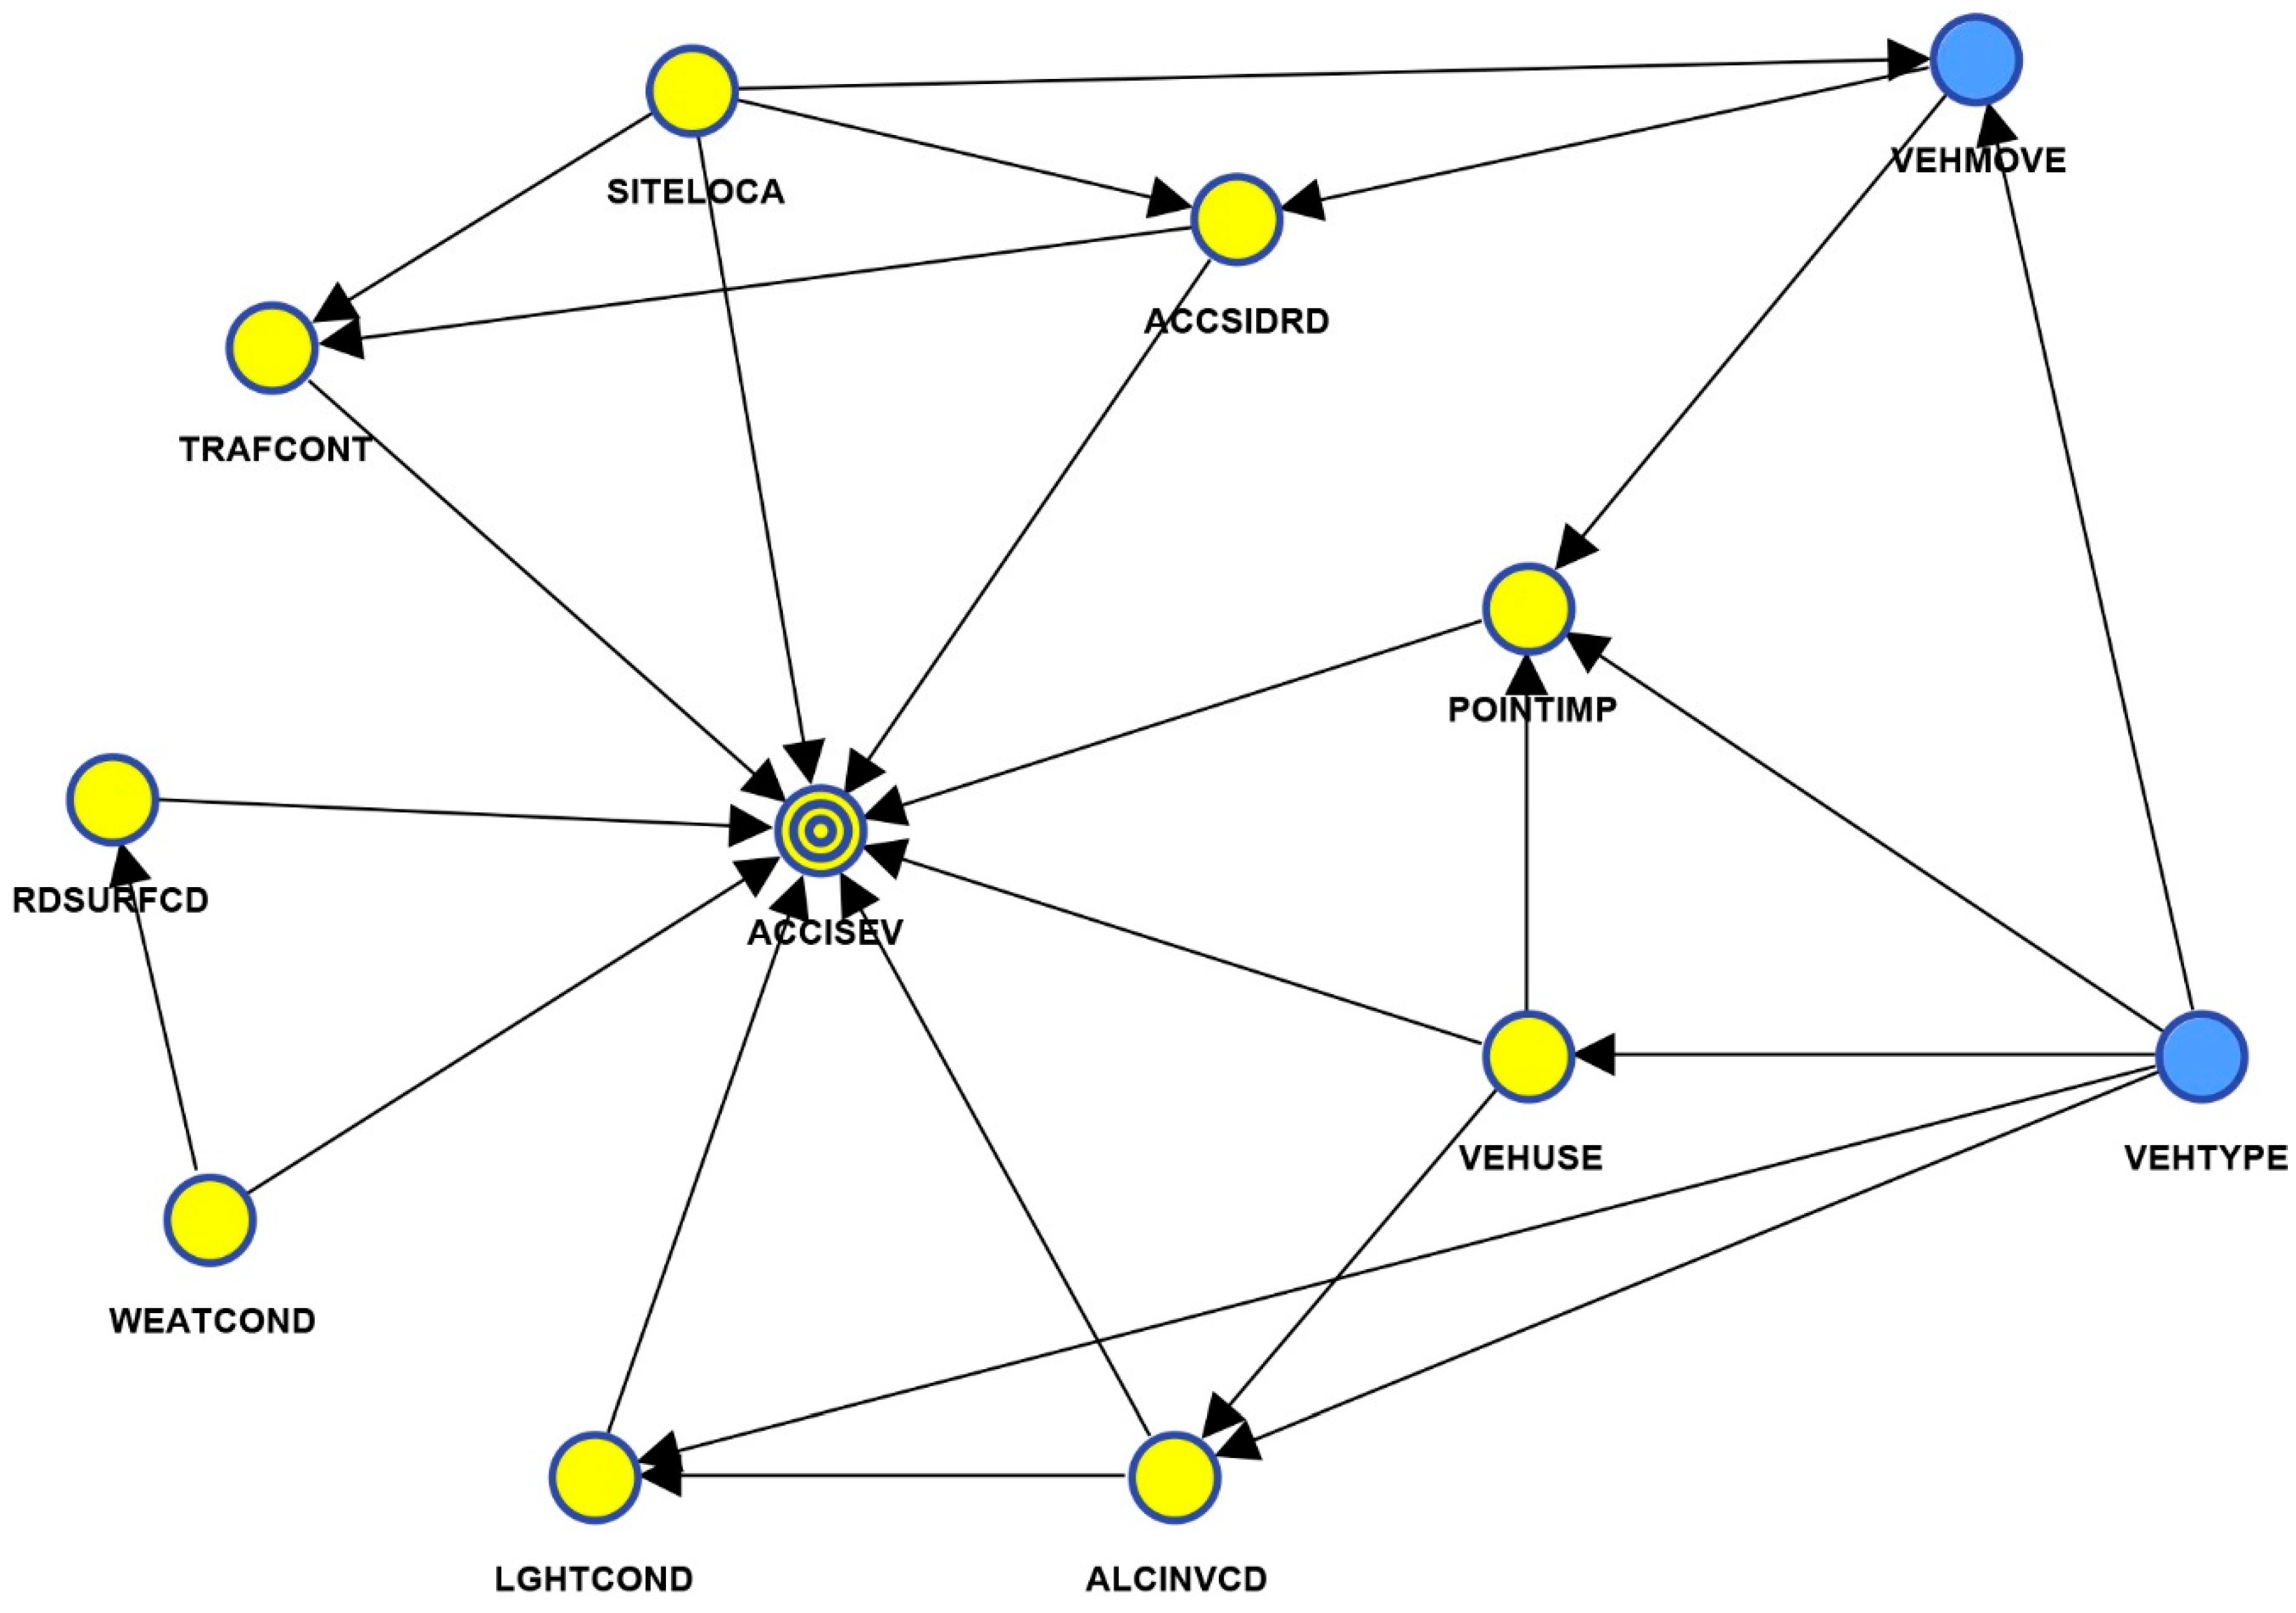
Figure 1, obtained via various complex and esoteric algorithms, was based on both curved roadways (7035 records) and straight ones (137,157 records). Additional knowledge in the traffic safety field provided a theoretical basis for the Bayesian network model of injury severity.
In
Figure 1, each circle represents a node. Accident severity (ACCISEV) denotes the target node. Yellow nodes represent the variables (POINTIMP, SITELOCA, ACCSIDRD, LIGHTCOND, TRAFCONT, ALCINVCD, VEHUSE, WEATCOND, and RDSURFCD) directly affecting the accident severity. Blue nodes stand for the variables (VEHMOVE and VEHTYPE) that have an indirect influence on the target node. An arc is related to the conditional dependencies between variables.
The hypothesis was based on relevant literature mentioned in
Section 2 and experience. Variations in vehicle incompatibility, vehicle type, crash locations, weather conditions and drivers with alcohol/drugs impairment have a prominent impact on the injury severities.
Also, another assumption was put forward that the proportion of drinking drivers is greater for crashes happening at night than those occurring in the daytime. The vehicle type may influence the vehicle use, and the location can influence the side of road on which the accident occurs. Vehicle use may also determine the drivers’ behavior to some extent. For example, truck drivers carrying goods usually do not drink at work, whereas drivers of private cars may have been drinking during a party or while having dinner.
4.3. Principle of Validation and Prediction
Validation is of great importance to the methodology as it provides supports to the model. For Bayesian networks, sensitivity analysis is applied for demonstrating the impacts of inaccuracies in the parameters on the model’s output to some extent [
47]. Following are several axioms that must be satisfied [
6]. A slight increase/decrease in the prior probabilities of parent node surely lead to the impact of a relevant increase/decrease in the posterior probabilities of the child node. The magnitude of its effect on the child node probability must be accordance with the change in the probability distributions of each parent node. Also, the overall impact magnitudes of the probability changes from the value of variables should be always stronger than the one from the subset of variables (sub-evidence).
Cross-validation is a method applied for validating the overall accuracy of the predictive model. The basic principle is to group the data, one part as a training dataset and the other one as a testing dataset. In this research, the cross-validation results are illustrated by the Receiver Operating Characteristic (ROC) curve [
48]. The ROC curve constitutes false positive rate and true positive rate to visualize a classifier’s performance. Area under the ROC curve (AUC) values between 0.5 and 1.0, with a larger value representing better performance.
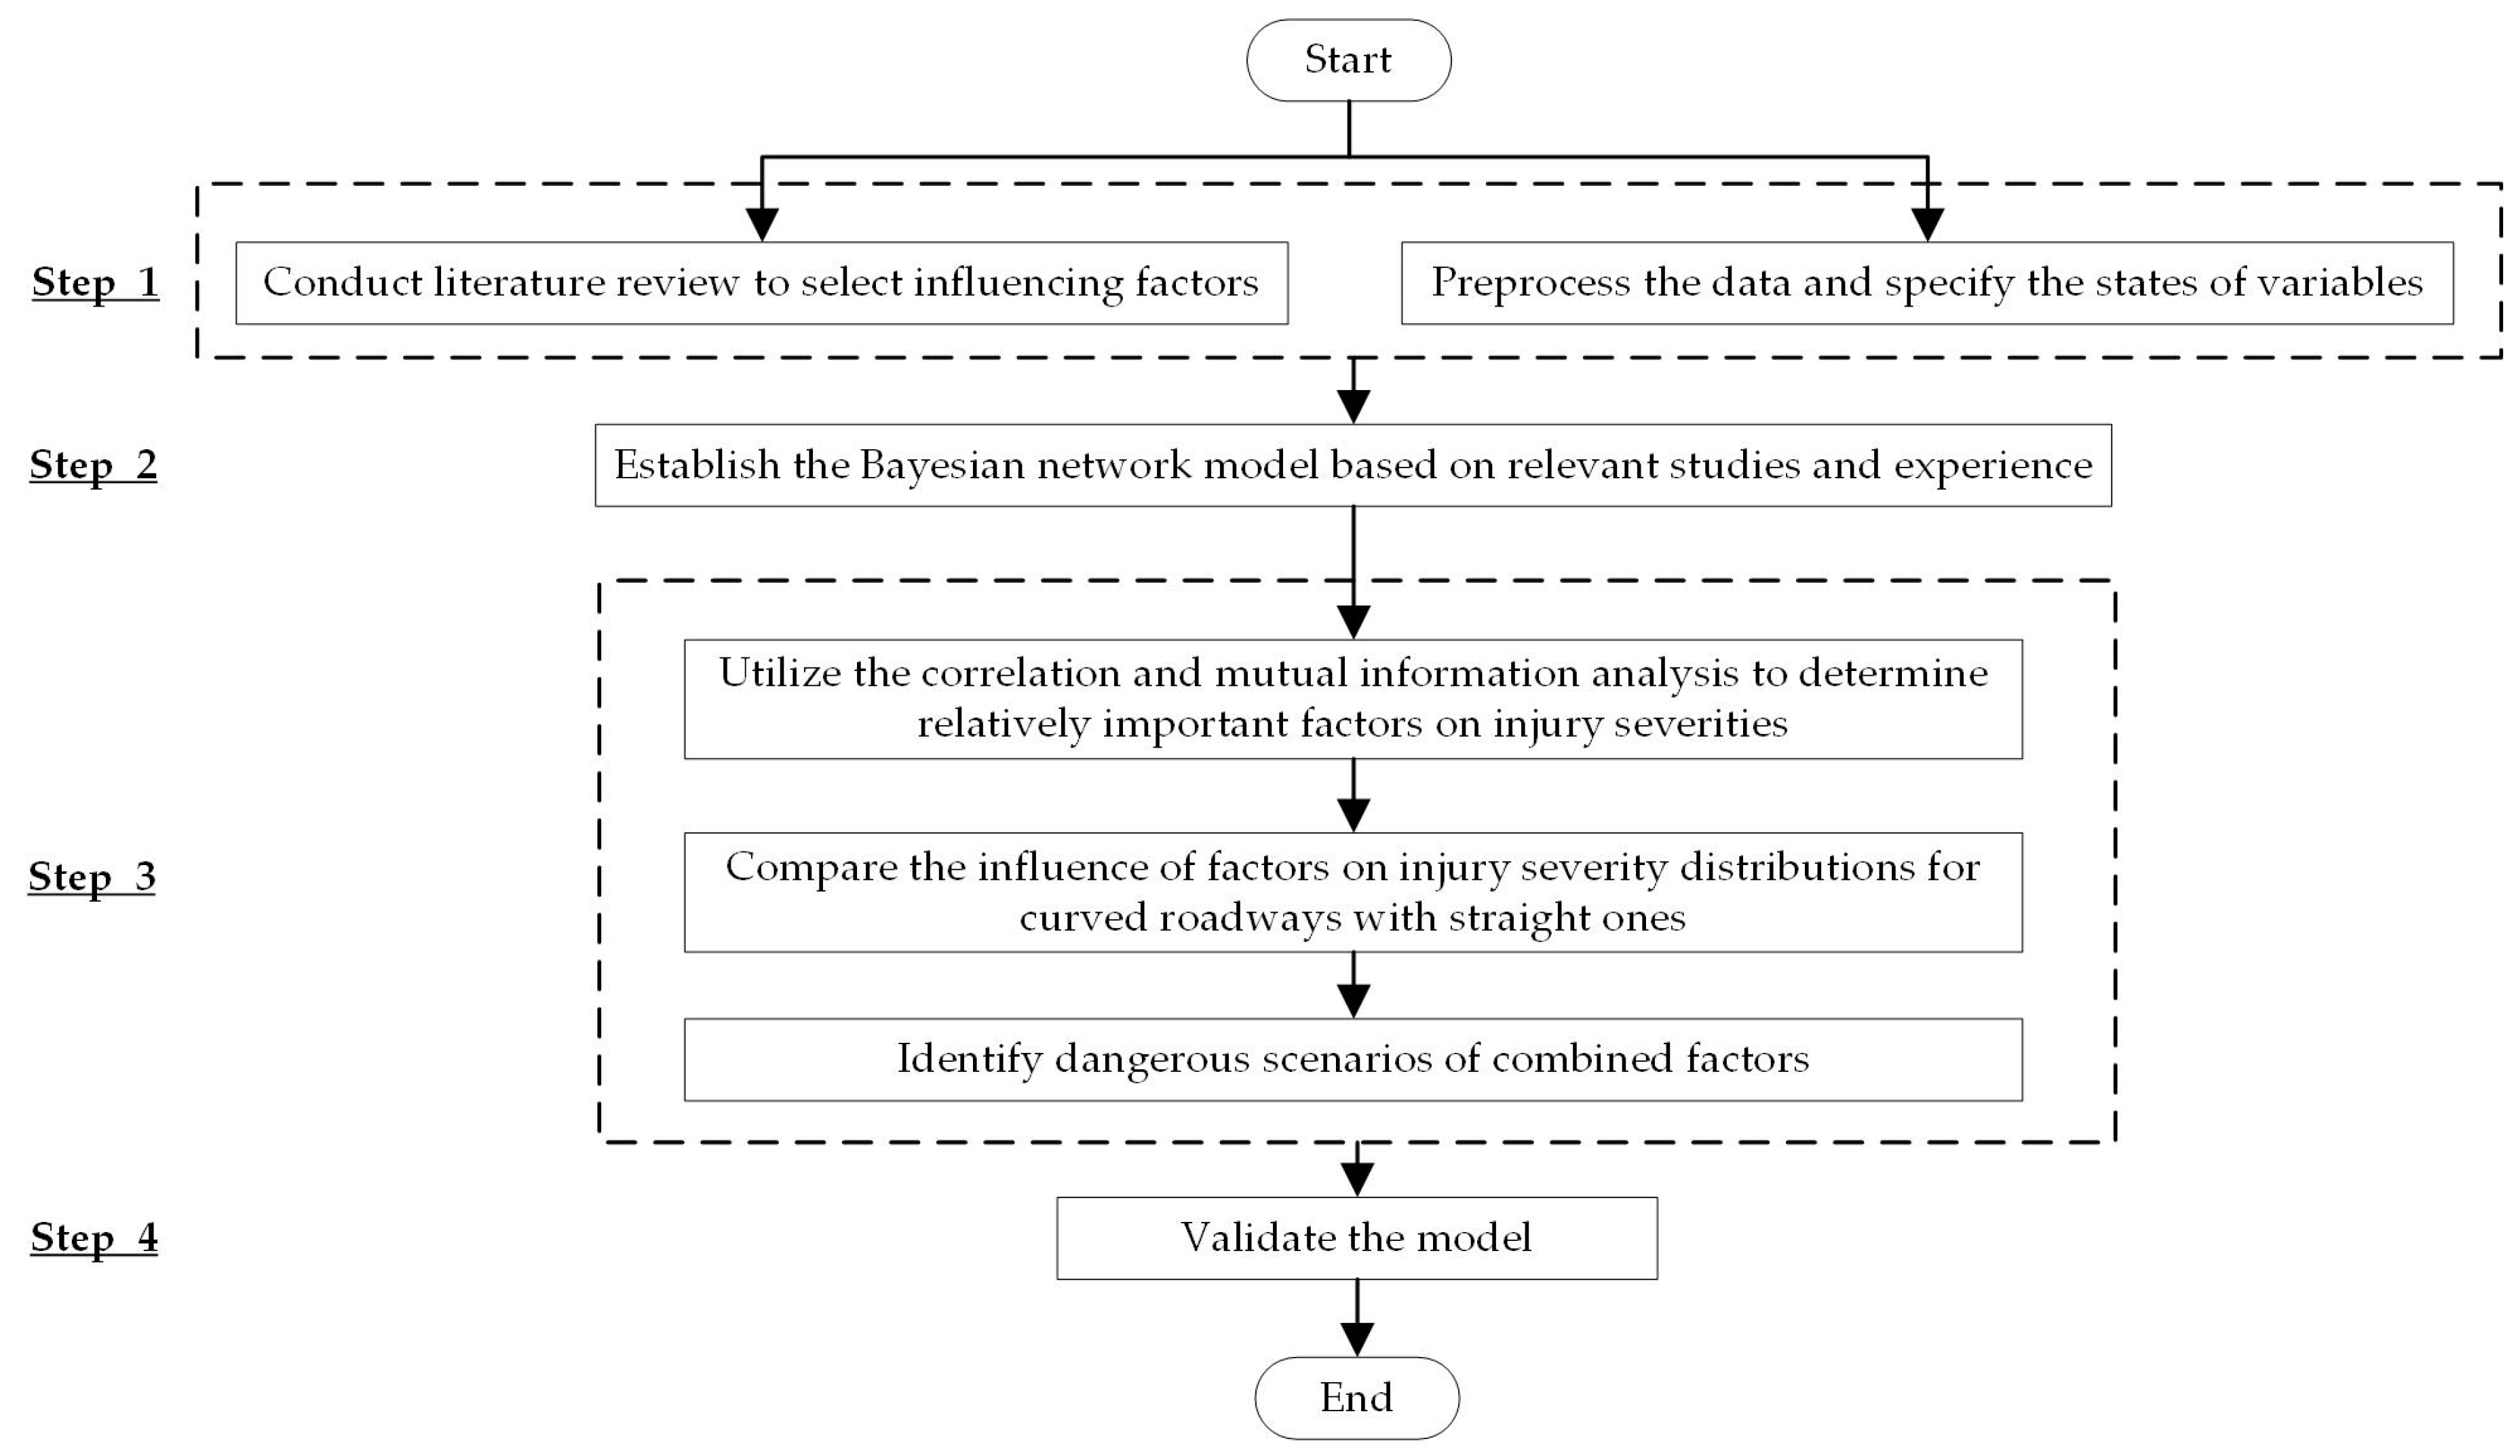
The process of model implementation is succinctly presented in
Figure 2 and exhibited in a stepwise order as follows:
- Step 1.
Conduct literature review to select influencing factors. Meanwhile, preprocess the data and specify the states of variables.
- Step 2.
Establish the Bayesian network model based on relevant studies and experience.
- Step 3.
Determine relatively important factors on injury severities, compare the influence of factors on injury severity distributions for curved roadways with straight ones, and identify dangerous scenarios of combined factors.
- Step 4.
Validate the model using sensitivity analysis and cross-validation.
5. Data Analysis and Results
Data were analyzed based on the Bayesian network model for injury severity on curved roadways introduced in
Section 4 with the aid of BayesiaLab 7.0.
5.1. Correlation and Mutual Information Analysis
In a traditional statistical analysis, correlation and covariance between the variables are examined to represent their relative importance, especially with regard to the target variable. Arc force indicates the strength of two variables’ joint probability distribution; it is a powerful measure from the correlation and covariance perspective, as it takes into account the network’s joint probability distribution [
45]. Instead of computing the correlation coefficient, the effect on the uncertainty of the states of a to-be-predicted variable is determined by observing the predictor variable. The value of mutual information is then computed. Arc force and mutual information values are represented in
Table 3.
Considering arc force and mutual information analysis synthetically, factors including POI, location, and side of road of accident are relatively important for target node (accident severity) on both curved and straight roadways. In the case of curved roadways, alcohol and drugs, lighting conditions, and vehicle use (i.e., factors relating to drivers) have a greater influence on accident severity, whereas in the case of straight roadways, traffic control, vehicle use, vehicle movements, and vehicle type (i.e., factors relating to roadways and vehicles) have a greater impact on the target node.
5.2. Influence Analysis
The impact of different factors on accident severity distribution on curves and straight roadways are present in
Table 4 and
Table 5. Accident severity is generally more serious in crashes on curves, compared with crashes on straight roadways. Under all circumstances, the probability of “accident severity = no injury” in crashes on curved roadways is about 10% lower than in crashes on straight ones, while the probability of “accident severity = fatal/incapacitating injury” in crashes on curves is approximately 10% higher. Accident severity increases when crashes occur on bridges. As a result, the design, construction and management of bridges should be strengthened to optimize the environment for traffic safety. When POI is at level 3 or 4, the driver injury severity is more serious. Drivers having consumed alcohol/drugs are more prone to crashes on curved roadways than on straight ones.
5.3. Sensitivity Analysis
The study has performed sensitivity analysis to validate the model, and the analysis must satisfy the axioms mentioned in
Section 4.3. The significant aspect of sensitivity analysis is to consider how parameters vary in the condition that the value of prior probabilities varies.
In this case, accident severity is based on the worst case fatal/incapacitating injury.
Table 6 shows single-factor sensitivity analysis for each of the six major attributes that influence accident severity on curved roadways.
The total magnitude of the influence of a combination of attributing factors is always greater than those of one factor [
49].
Table 7 shows scenarios of combined variations for crashes on curves; situations that cause a high probability of fatal/incapacitating injury should be highlighted when driving.
Results show that all bad conditions combined contribute to a fatal/incapacitating injury probability as high as 56.28%. Under all circumstances, adding “POI = level 3&4” causes the greatest increase in accident severity, followed by “ALCINVCD = yes”. As a result, in the design of vehicles, more attention should be paid to protective measures in positions that are dangerous and relatively close to the driver’s seat, such as left front door and undercarriage. Also, electric and hydrogen fuel vehicles are preferred from an environmental perspective. What needs special attention is that the design of vehicles should come up with multiple tasks [
50]. Driving after drinking or drugs is strictly banned, and more stringent regulations on this could be promulgated to improve the situation. Nowadays, many companies and university laboratories have made significant progress in autonomous driving which can avoid many crashes caused by human factors such as drunk driving and can mitigate accident severities. When POI is “level 3&4” and ALCINVCD is “yes”, the variable ACCSIDRD has a larger influence on accident severity than other factors. The situation is exacerbated when POI is “level 3&4”, ALCINVCD is “yes”, and ACCSIDRD is “right”; at this time, traffic control plays a vital role in determining injury severity. Dynamic traffic control systems can be an effective method to improve traffic conditions on curves. They vary to express dynamic speed limits, changeable weather conditions, warning, etc., which can certainly reduce accident rates and severities.
5.4. Precision of the Model
The overall precision of the Bayesian network for accident severity on horizontal curves is 73.25% out of 100%, and the value of AUC is 0.742 which indicates a good performance in prediction.
6. Conclusions
Curved segments are more dangerous to drivers because of complicated geometry conditions, vehicle performances, unstable traffic speed, etc. To address the problem, this paper used Bayesian networks to establish the accident injury severity model for curves. According to the analysis, the critical conclusions regarding crashes on curves are as follows. (1) Factors including POI, site of location, accident side of road, lighting conditions, vehicle use, and traffic control are relatively important in crashes on curves. (2). Accident severity increases when crashes occur on bridges. (3) The sensitivity of accident severity to vehicle use, traffic control, POI, and alcohol/drug use is relatively high compared with other factors. (4) A combination of unfavorable scenarios such as “POI = level 3&4” will aggravate the severity of the accident. Based on the above conclusions, the following suggestions can be made. (1) More attention should be paid to the positions that are dangerous and relatively close to the driver’s seat. (2) To enhance the safety of vehicles and drivers on curved roads, the lighting condition in curved roadways as well as bridges should be bright enough to allow drivers to see clearly. (3) More severe penalties should be given for intoxicated driving and other violations of traffic regulations. (4) The site of locations and side of roads at curved roads should be checked to ensure they are in line with standards. (5) Dynamic traffic control devices can be utilized to maximize the performance at curved segments on roadways.
In summary, the paper provides a deeper understanding of how the interrelations between different variables influence injury severity in accidents on curved roadways. A Bayesian network was successfully established for analysis of crash injury severity in different situations, demonstrating the advantages of its complex method where system variables are interdependent, as well as its perfect visualization. This kind of method can also be applied to other problems in the field of traffic, such as parking [
51]. The results also proposed some suggestions regarding the design of vehicles, the construction and improvement of curved roadway facilities, and suitable penalties for traffic violations, especially for intoxicated driving. Sustainable transportation develops on the basis of safety. Therefore, seeking countermeasures to improve road safety also contributes to sustainable transportation.
The limitation of this paper is that the study was based on crash data more than ten years ago, and the research will be more reliable if there are more updated data available.
Author Contributions
Data curation, W.Z. and Y.Z.; Formal analysis, L.Z., W.Z. and Y.Z.; Methodology, L.Z., L.L. and M.S.; Software, L.Z. and Y.Z.; Writing—original draft, L.Z., L.L., W.Z. and M.S.
Funding
This research was funded by the National Natural Science Foundation of China, grant number E080701/51508325.
Acknowledgments
The authors are grateful to the University of South Florida for their data supports. In addition, the authors would like to thank three anonymous reviewers for their excellent comments on the paper.
Conflicts of Interest
The authors declare no conflict of interest.
References
- Savolainen, P.T.; Mannering, F.L.; Lord, D.; Quddus, M.A. The statistical analysis of highway crash-injury severities: A review and assessment of methodological alternatives. Accid. Anal. Prev. 2011, 43, 1666–1676. [Google Scholar] [CrossRef] [PubMed]
- Shi, L.; Huseynova, N.; Yang, B.; Li, C.; Gao, L. A Cask Evaluation Model to Assess Safety in Chinese Rural Roads. Sustainability 2018, 10, 3864. [Google Scholar] [CrossRef]
- Zeng, Q.; Wen, H.; Huang, H. The interactive effect on injury severity of driver-vehicle units in two-vehicle crashes. J. Saf. Res. 2016, 59, 105–111. [Google Scholar] [CrossRef]
- Chen, C.; Zhang, G.; Huang, H.; Wang, J.; Tarefder, R.A. Examining driver injury severity outcomes in rural non-interstate roadway crashes using a hierarchical ordered logit model. Accid. Anal. Prev. 2016, 96, 79–87. [Google Scholar] [CrossRef]
- Edwards, J.B. The Relationship Between Road Accident Severity and Recorded Weather. J. Saf. Res. 1998, 29, 249–262. [Google Scholar] [CrossRef]
- Jones, B.; Jenkinson, I.; Yang, Z.; Wang, J. The use of Bayesian network modelling for maintenance planning in a manufacturing industry. Reliab. Eng. Syst. Saf. 2010, 95, 267–277. [Google Scholar] [CrossRef]
- Mujalli, R.O.; de Oña, J. Injury severity models for motor vehicle accidents: A review. Proc. Inst. Civil Eng. Trans. 2013, 166, 255–270. [Google Scholar] [CrossRef]
- Yannis, G.; Dragomanovits, A.; Laiou, A.; Torre, F.L.; Domenichini, L.; Richter, T.; Ruhl, S.; Graham, D.; Karathodorou, N. Road traffic accident prediction modelling: A literature review. Proc. Inst. Civil Eng. Trans. 2017, 170, 245–254. [Google Scholar] [CrossRef]
- Cioca, L.-I.; Ivascu, L. Risk Indicators and Road Accident Analysis for the Period 2012–2016. Sustainability 2017, 9, 1530. [Google Scholar] [CrossRef]
- Russo, F.; Comi, A. From the analysis of European accident data to safety assessment for planning: The role of good vehicles in urban area. Eur. Trans. Res. Rev. 2017, 9, 9. [Google Scholar] [CrossRef]
- Cheng, Z.; Zu, Z.; Lu, J. Traffic Crash Evolution Characteristic Analysis and Spatiotemporal Hotspot Identification of Urban Road Intersections. Sustainability 2018, 11, 160. [Google Scholar] [CrossRef]
- Chung, Y. Identification of Critical Factors for Non-Recurrent Congestion Induced by Urban Freeway Crashes and Its Mitigating Strategies. Sustainability 2017, 9, 2331. [Google Scholar] [CrossRef]
- De Oña, J.; Mujalli, R.O.; Calvo, F.J. Analysis of traffic accident injury severity on Spanish rural highways using Bayesian networks. Accid. Anal. Prev. 2011, 43, 402–411. [Google Scholar] [CrossRef] [PubMed]
- Xie, Y.; Lord, D.; Zhang, Y. Predicting motor vehicle collisions using Bayesian neural network models: An empirical analysis. Accid. Anal. Prev. 2007, 39, 922–933. [Google Scholar] [CrossRef] [PubMed]
- Jiang, C.; Lu, L.; Chen, S.; Lu, J.J. Hit-and-run crashes in urban river-crossing road tunnels. Accid. Anal. Prev. 2016, 95, 373–380. [Google Scholar] [CrossRef] [PubMed]
- Al-Ghamdi, A.S. Using logistic regression to estimate the influence of accident factors on accident severity. Accid. Anal. Prev. 2002, 34, 729–741. [Google Scholar] [CrossRef]
- Bédard, M.; Guyatt, G.H.; Stones, M.J.; Hirdes, J.P. The independent contribution of driver, crash, and vehicle characteristics to driver fatalities. Accid. Anal. Prev. 2002, 34, 717–727. [Google Scholar] [CrossRef]
- Milton, J.C.; Shankar, V.N.; Mannering, F.L. Highway accident severities and the mixed logit model: An exploratory empirical analysis. Accid. Anal. Prev. 2008, 40, 260–266. [Google Scholar] [CrossRef] [PubMed]
- Yau, K.K.W.; Lo, H.P.; Fung, S.H.H. Multiple-vehicle traffic accidents in Hong Kong. Accid. Anal. Prev. 2006, 38, 1157–1161. [Google Scholar] [CrossRef] [PubMed]
- Oh, J.T. Development of severity models for vehicle accident injuries for signalized intersections in rural areas. KSCE J. Civil Eng. 2006, 10, 219–225. [Google Scholar] [CrossRef]
- Fountas, G.; Anastasopoulos, P.C. Analysis of accident injury-severity outcomes: The zero-inflated hierarchical ordered probit model with correlated disturbances. Anal. Methods Accid. Res. 2018, 20, 30–45. [Google Scholar] [CrossRef]
- Jang, K.; Kim, K.; Kim, H.Y.; Kang, S. A Multi-level Analysis of the Relationship Between Urban Built Environment and Severe Injury Traffic Crashes. KSCE J. Civ. Eng. 2018, 22, 1427–1435. [Google Scholar] [CrossRef]
- Gregoriades, A.; Mouskos, K.C. Black spots identification through a Bayesian Networks quantification of accident risk index. Trans. Res. Part Emerg. Technol. 2013, 28, 28–43. [Google Scholar] [CrossRef]
- Mujalli, R.O.; de Oña, J. A method for simplifying the analysis of traffic accidents injury severity on two-lane highways using Bayesian networks. J. Saf. Res. 2011, 42, 317–326. [Google Scholar] [CrossRef]
- Zhao, L.; Wang, X.; Qian, Y. Analysis of factors that influence hazardous material transportation accidents based on Bayesian networks: A case study in China. Saf. Sci. 2012, 50, 1049–1055. [Google Scholar] [CrossRef]
- Chen, C.; Zhang, G.; Tarefder, R.; Ma, J.; Wei, H.; Guan, H. A multinomial logit model-Bayesian network hybrid approach for driver injury severity analyses in rear-end crashes. Accid. Anal. Prev. 2015, 80, 76–88. [Google Scholar] [CrossRef] [PubMed]
- Mbakwe, A.C.; Saka, A.A.; Choi, K.; Lee, Y.-J. Alternative method of highway traffic safety analysis for developing countries using delphi technique and Bayesian network. Accid. Anal. Prev. 2016, 93, 135–146. [Google Scholar] [CrossRef] [PubMed]
- Theofilatos, A. Incorporating real-time traffic and weather data to explore road accident likelihood and severity in urban arterials. J. Saf. Res. 2017, 61, 9–21. [Google Scholar] [CrossRef] [PubMed]
- Fink, K.L.; Krammes, R.A. Tangent Length and Sight Distance Effects on Accident Rates at Horizontal Curves on rural Two-Lane Highways; Issue Number 1500; Transportation Research Board: Washington, DC, USA, 1995. [Google Scholar]
- Anderson, I.B.; Krammes, R.A. Speed Reduction as a Surrogate for Accident Experience at Horizontal Curves on Rural Two-Lane Highways. Trans. Res. Record 2000, 1701, 86–94. [Google Scholar] [CrossRef]
- Findley, D.J.; Hummer, J.E.; Rasdorf, W.; Zegeer, C.V.; Fowler, T.J. Modeling the impact of spatial relationships on horizontal curve safety. Accid. Anal. Prev. 2012, 45, 296–304. [Google Scholar] [CrossRef] [PubMed]
- Karaduman, O.; Eren, H.; Kurum, H.; Celenk, M. Probabilistic risk assessment using major features of rural road curves via rear and front car cameras. In Proceedings of the 2014 International Conference on Connected Vehicles and Expo (ICCVE), Vienna, Austria, 3–7 November 2014; pp. 953–958. [Google Scholar]
- Banihashemi, M. Effect of horizontal curves on urban arterial crashes. Accid. Anal. Prev. 2016, 95, 20–26. [Google Scholar] [CrossRef] [PubMed]
- Elvik, R. International transferability of accident modification functions for horizontal curves. Accid. Anal. Prev. 2013, 59, 487–496. [Google Scholar] [CrossRef] [PubMed]
- Bauer, K.M.; Harwood, D.W. Safety Effects of Horizontal Curve and Grade Combinations on Rural Two-Lane Highways. Trans. Res. Record 2013, 2398, 37–49. [Google Scholar] [CrossRef]
- Russo, J.-N.; Sproesser, T.; Drouhin, F.; Basset, M. Risks Level Assessments for Automotive Application. IFAC PapersOnLine 2016, 49, 163–168. [Google Scholar] [CrossRef]
- Russo, J.-N.; Sproesser, T.; Drouhin, F.; Basset, M. Risk Level Assessment for Rear-End Collision with Bayesian Network. IFAC PapersOnLine 2017, 50, 12514–12519. [Google Scholar] [CrossRef]
- Jensen, F.V. Bayesian networks basics. AISB Q. 1996, 94, 9–22. [Google Scholar]
- Pillay, A.; Wang, J. Technology and Safety of Marine Systems; Elsevier: Oxford, UK, 2003; Volume 7. [Google Scholar]
- Zhang, D.; Yan, X.P.; Yang, Z.L.; Wall, A.; Wang, J. Incorporation of formal safety assessment and Bayesian network in navigational risk estimation of the Yangtze River. Reliab. Eng. Syst. Saf. 2013, 118, 93–105. [Google Scholar] [CrossRef]
- Battiti, R. Using mutual information for selecting features in supervised neural net learning. IEEE Trans. Neural Netw. 1994, 5, 537–550. [Google Scholar] [CrossRef]
- Doquire, G.; Verleysen, M. Feature Selection with Mutual Information for Uncertain Data. In Proceedings of the International Conference on Data Warehousing and Knowledge Discovery, Toulouse, France, 29 August–2 September 2011; pp. 330–341. [Google Scholar]
- Peng, H.; Long, F.; Ding, C. Feature selection based on mutual information: Criteria of max-dependency, max-relevance, and min-redundancy. IEEE Trans. Pattern Anal. Mach. Intell. 2005, 27, 1226–1238. [Google Scholar] [CrossRef] [PubMed]
- Cheng, J.; Greiner, R.; Kelly, J.; Bell, D.; Liu, W. Learning Bayesian networks from data: An information-theory based approach. Artif. Intell. 2002, 137, 43–90. [Google Scholar] [CrossRef]
- Conrady, S.; Jouffe, L. Bayesian Networks and BayesiaLab: A Practical Introduction for Researchers; Bayesia: Franklin, TN, USA, 2015. [Google Scholar]
- Huang, H.; Hu, S.; Abdel-Aty, M. Indexing crash worthiness and crash aggressivity by major car brands. Saf. Sci. 2014, 62, 339–347. [Google Scholar] [CrossRef]
- Ren, J.; Jenkinson, I.; Wang, J.; Xu, D.L.; Yang, J.B. An Offshore Risk Analysis Method Using Fuzzy Bayesian Network. J. Offshore Mech. Arct. Eng. 2009, 131, 041101. [Google Scholar] [CrossRef]
- Fukunaga, K. Introduction to Statistical Pattern Recognition, 2nd ed.; Academic Press: San Diego, CA, USA, 2013. [Google Scholar] [CrossRef]
- Alyami, H.; Lee, P.T.-W.; Yang, Z.; Riahi, R.; Bonsall, S.; Wang, J. An advanced risk analysis approach for container port safety evaluation. Marit. Policy Manag. 2014, 41, 634–650. [Google Scholar] [CrossRef]
- Kostrzewski, M. One Design Issue—Many Solutions. Different Perspectives of Design Thinking—Case Study. In Knowledge Management in Organizations; Uden, L., Hadzima, B., Ting, I.H., Eds.; Springer: Cham, Germany, 2018. [Google Scholar]
- Kostrzewski, M.; Varjan, P. The Issue of Parking Areas Conditions in Surrounding of Logistics and Production Facilities in Slovakia and Poland. In Proceedings of the 22nd International Scientific Conference, Transport Means 2018, Part II, Trakai, Lithuania, 3–5 October 2018; pp. 791–796. [Google Scholar]
© 2019 by the authors. Licensee MDPI, Basel, Switzerland. This article is an open access article distributed under the terms and conditions of the Creative Commons Attribution (CC BY) license (http://creativecommons.org/licenses/by/4.0/).


