Defying the Footprint Oracle: Implications of Country Resource Trends


Abstract
1. Introduction: Identifying a Gap in Current National Metrics
1.1. The Role of Measuring Countries’ Performances
1.2. The Case for Analyzing Countries’ Material Metabolism from a Biological Perspective
2. Methodology Used: Biocapacity Accounting
2.1. Options for Measuring Human Demand on Biocapacity
- Kilograms can be used to measure mass flows. Describing mass flows of resources in kilograms seems precise, but the demand on nature per kilogram is vastly different between materials, and sometimes even for the same material. Consider the difference in the demand on nature of removing 1 tonne of water in a relatively wet country like Finland to 1 tonne of water in a relatively dry country like Jordan. Further, when comparing biomass, there can be confusion between wet or dry weight. Material Footprint accounts exclude air and water flows, but even without those flows, considering the killing of one kg of birds equivalent to moving one kg of rocks distorts reality. Also, there are no clear upper limits for mass flows, reducing this approach’s utility for measuring environmental limits. Some publications claim that 8 tonnes of material Footprint per person and per year is a sustainable level [30,31], but this number is based on a declaration, not scientific deduction. For these reasons, assessments based on mass flow are not well suited to compare human demand against regeneration.
- CO2 emissions include carbon dioxide released from burning fossil fuel, producing cement or changing land-use patterns. CO2 equivalents aggregate all gases, including CO2, on the basis of their global warming potential. Human induced emissions of carbon and other greenhouse gases are increasingly tracked given the growing climate impact of these gases given that the concentrations of these gases in the atmosphere is rising. Emissions can be compared to the upper emission limit, which in turn is a function of what temperature increase humanity is willing to tolerate. But even with a temperature limit set by the Paris Agreement of ”holding the increase in the global average temperature to well below 2°C above pre-industrial levels and pursuing efforts to limit the temperature increase to 1.5°C above pre-industrial levels” [13], there is great discrepancy in the literature about how much carbon is left to emit. Some, like NOAA, conclude that humanity is facing a negative budget if humanity wants to achieve the Paris goal [22]. Others, like Figueres et al. [32], estimate a remaining CO2 budget of between 150 and 1050 Gigatons. Given this uncertainty, and the fact that greenhouse gas emissions are not the complete set of competing demands on the biosphere, emissions of CO2 or CO2 equivalents are also not fit to fully answer this question.
- Monetary currencies, such as US dollars or Euros, are useful as an accounting unit for comparing human activities but cannot link human demand to biological regeneration. As the value of dollars can change from year to year due to inflation, accounts can also be expressed in constant dollars. Further, the same financial amount represents dissimilar values to different people. This is recognized by UNDP / United Nation Development Programme’s Human Development Index (HDI): there, the income dimension, one of the index’s three pillars, is therefore measured as the logarithm of people’s financial income. (The other two pillars are longevity and access to basic education [33,34]). Also, the same monetary unit can purchase different amounts of goods in different markets. Monetary amounts can be made comparable by adjusting them according to their purchasing power. This translation is called purchasing power parity [ppp]. Or any currency can be converted into other countries’ local currency, with conversion rates changing daily. Still, with all this variance, monetary units, in local currencies or expressed in US Dollars, can be a useful measure of comparison at the micro scale. For instance, it can reveal social preferences (such as pursued by The Economics of Ecosystems and Biodiversity (TEEB) when comparing project options in their effort to ‘mainstream the values of biodiversity and ecosystem services into decision-making’). However, financial assessments do not compare resource use against regeneration. Moreover, at the macro level, financial metrics become problematic, as dollars reflect market preferences, not ecological necessities or regeneration. The two leading studies that financially value natural capital at a macro scale vastly underestimate the significance of natural capital vis-à-vis other capital assets. They are Changing Wealth of Nations by the World Bank (2011/2018), and Inclusive Wealth Report by UNU (2012/2018). The former study concludes that the value of the planet, as a percentage of humanity’s total assets, only accounts for 9% of humanity’s total wealth. This number is implausibly low given that all wealth depends on natural capital, and there is wide recognition that the planet’s natural capital is overused [35]. These financial valuations do not, therefore, recognize the importance of ecosystem regeneration in meeting humanity’s material demands.
- Energy units can be defined precisely and measured in a lab but are highly ambiguous for describing flows through ecosystems or societies because of entropy cascades. For instance, the sun’s 175,000 TW (or Terawatt) of solar radiation onto Earth generates approximately 70 TW of Net Primary Productivity (NPP) on the land and more if including the NPP of the oceans. Of the land-based NPP, 1/3 or more is used for generating about 1 TW of food calories for people [36]. This energy cascade illustrates the stark difference of 1 TW solar radiation and 1 TW of food. Thus, energy, as common denominator, can lead to confusion. The closest to a consistent energy accounting approach that includes the quality of energy is Odum’s eMergy calculation [37,38]. However, the commonly published conversion factors (‘transformaties’) that translate final use back into solar input are not robust.
- Biomass balances (whether expressed in tonnes of carbon, dry matter, or energy content) as used in Net Primary Production (NPP) assessments, and the complementary Human Appropriation of NPP (HANPP) is very closely related to the question of human demand and regeneration [36]. The challenge is that demand as measured by HANPP cannot be compared with clarity and sharpness to available regeneration, nor can a sustainable level of NPP extraction be clearly defined, let alone measured. Studies that compare the two come up with wide ranges of answers, for definitional reasons, as well as measurement challenges [39]. While NPP assessments are undoubtedly an important tool, particularly to evaluate intensity of biological uses, they have limited power to robustly track demand against regeneration.
- Hectares can be used to compare human demand for productive hectares, to hectares available. Unfortunately, not every hectare represents the same biological productivity: just consider the biological productivity of one hectare of a rocky mountain slope, of a tundra forest, of a tropical rain forest, or of a highly fertile cropland in river basin.
- Global hectares are productivity adjusted hectares. Each unit represents a biologically productive hectare with world average productivity. This equivalence makes the unit convenient for biocapacity accounting [24]. Biocapacity is the biologically productive area that provides ecological services. All human demands on those surfaces that compete for space can therefore be added up. This more agriculturally-based metric is straightforward. It builds on established agronomical practices to measure harvested crops and yields. As productivity changes annually (because of technological innovations, climate change, shifts in management practices, etc.), the global hectare changes accordingly. The sum-total of productivity-adjusted areas representing all of people’s competing demands on nature, then, can be compared against available areas (also expressed in productivity adjusted hectares).
- Stable climate
- Intact biodiversity
- Sufficient nutrients (but no overload)
- Protective ozone layer
- Absence of pollutants
- Clean and sufficient fresh water
- Stable and fertile soils
- Absence of acidification in both water and soils
2.2. How to Measure Human Demand on Biocapacity with Ecological Footprint Accounting
- Additivity: Given that human life competes for biologically productive surfaces, these surface areas can be added up. The Ecological Footprint (or Footprint), therefore, adds up all human demands on nature that compete for biologically productive space. This means these spaces mutually exclude each other as they provide for biological resources, accommodate urban infrastructure, or absorb excess carbon from fossil fuel burning. (Surfaces that serve multiple human demands are counted only once.) The Footprint then becomes comparable to the available biologically productive space (biocapacity).
- Equivalence: Since not every biologically productive surface area is of equal productivity, areas are scaled proportionally to their biological productivity (for more detail see Wackernagel et al. [24]). Therefore, the measurement unit for Ecological Footprint accounting, global hectares, are biologically productive hectares with world average productivity.
2.3. Key Concepts of Biocapacity Accounting at the National Scale
- Net-importing biocapacity from elsewhere (this means that the Ecological Footprint embodied in imports exceeds the Ecological Footprint embodied in exports);
- Using the global commons (such as in the case of fishing international waters or emitting greenhouse into the global atmosphere); and
- Overusing one’s own territorial biocapacity (overharvesting forests or fish stocks, etc.).
- Catch more fish than fishing grounds can regenerate, leading fisheries to eventually collapse;
- Harvest more timber than forests can re-grow, and causing deforestation;
- Emit more CO2 than the biosphere can absorb, such that CO2 accumulates in the atmosphere, and then contributes to global warming; or,
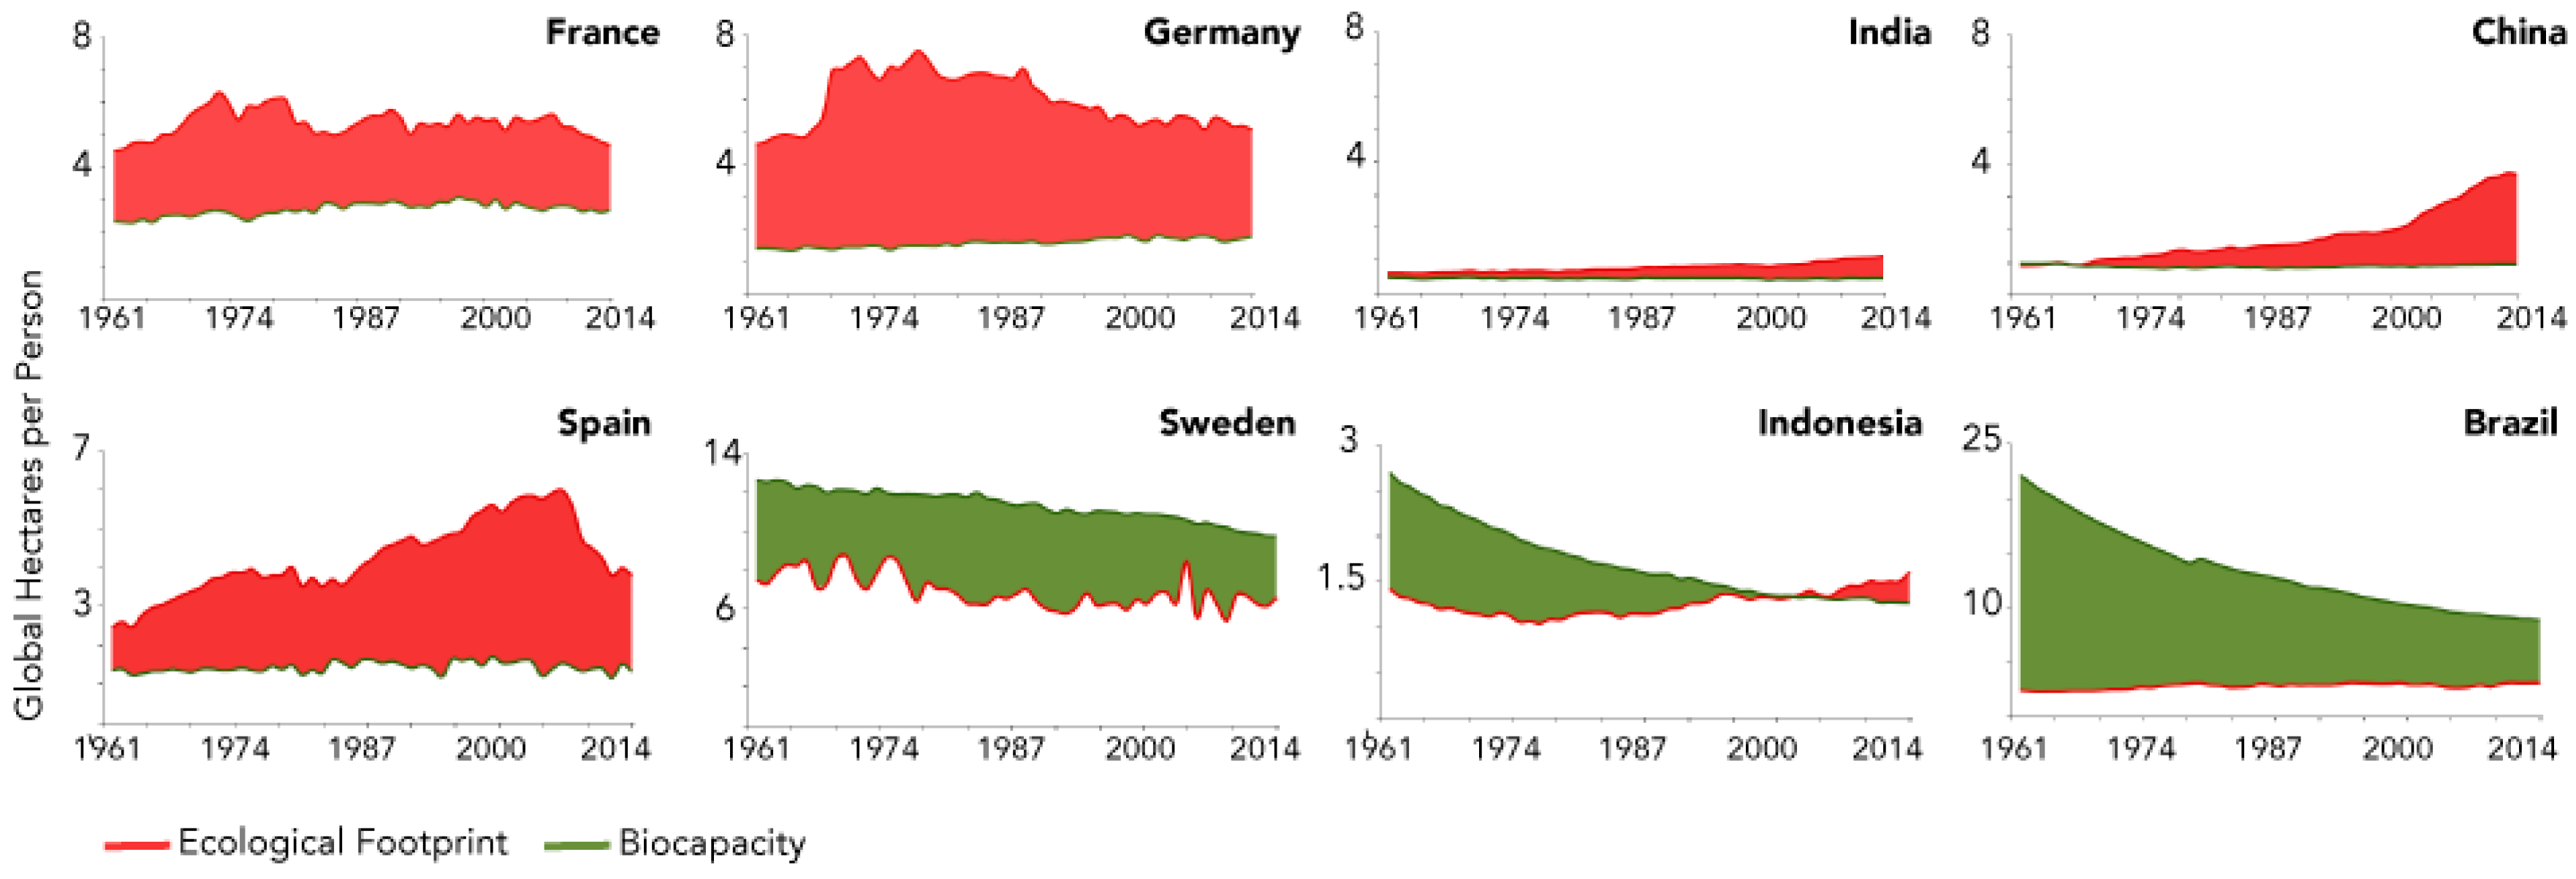
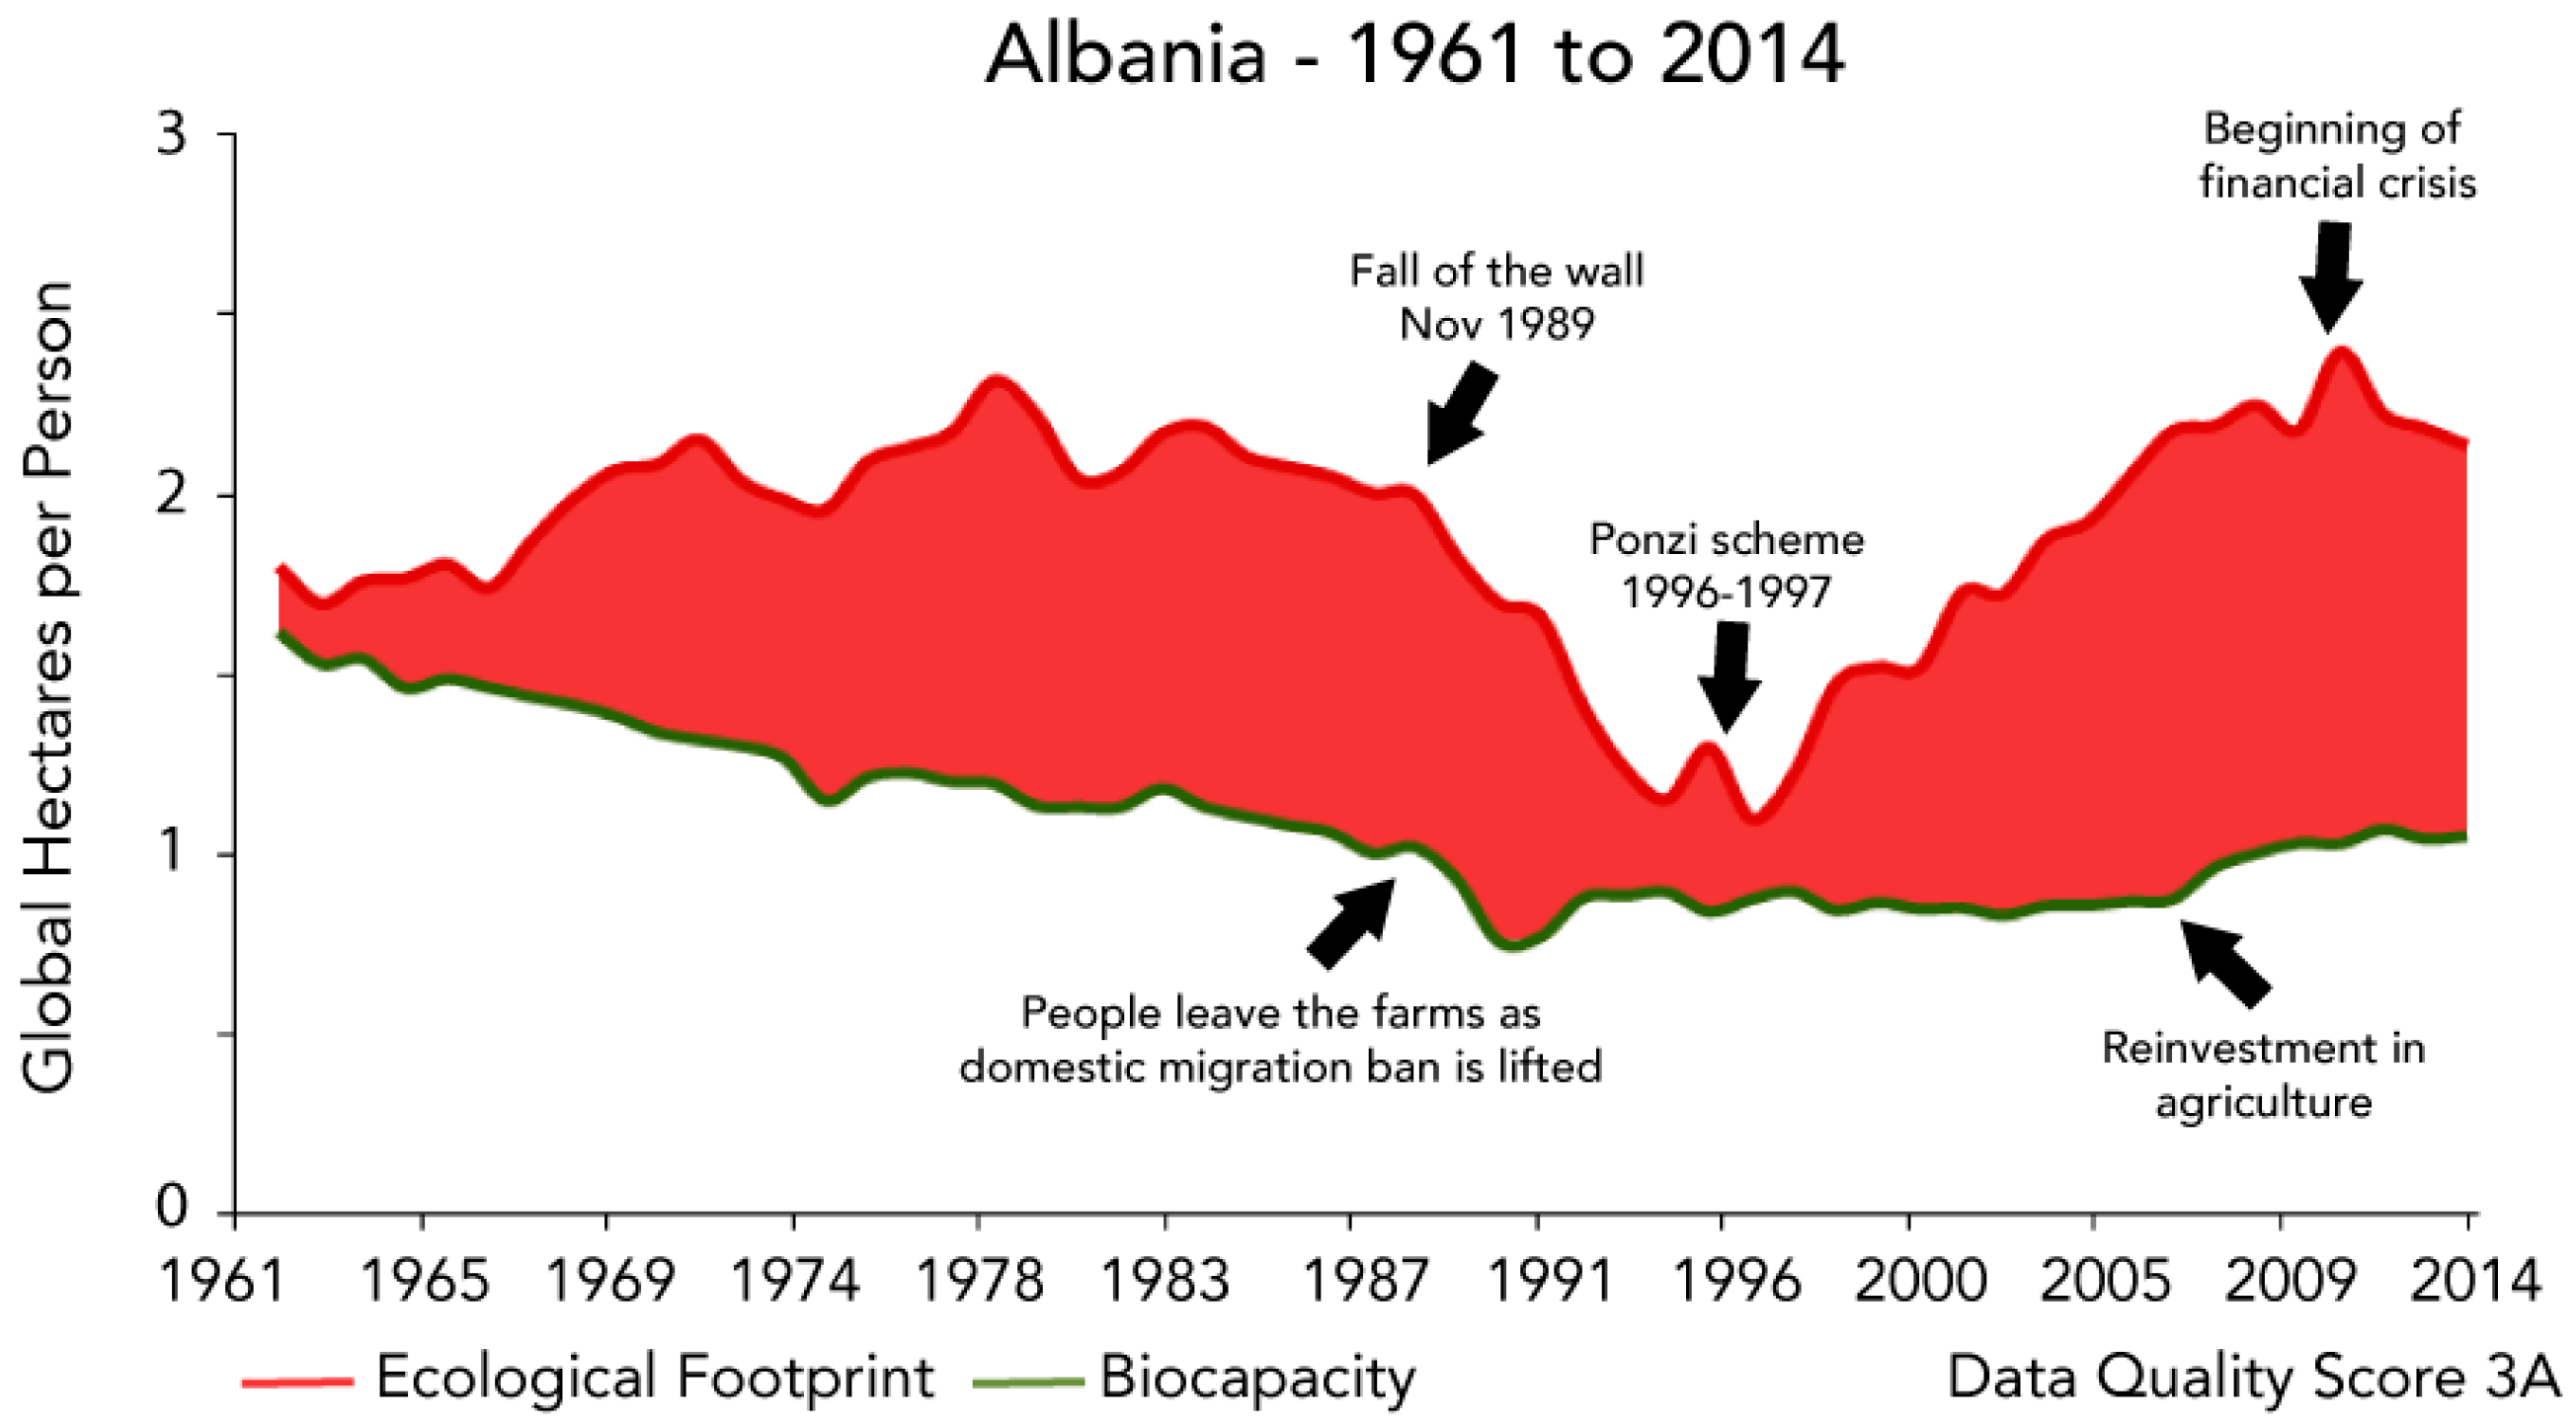
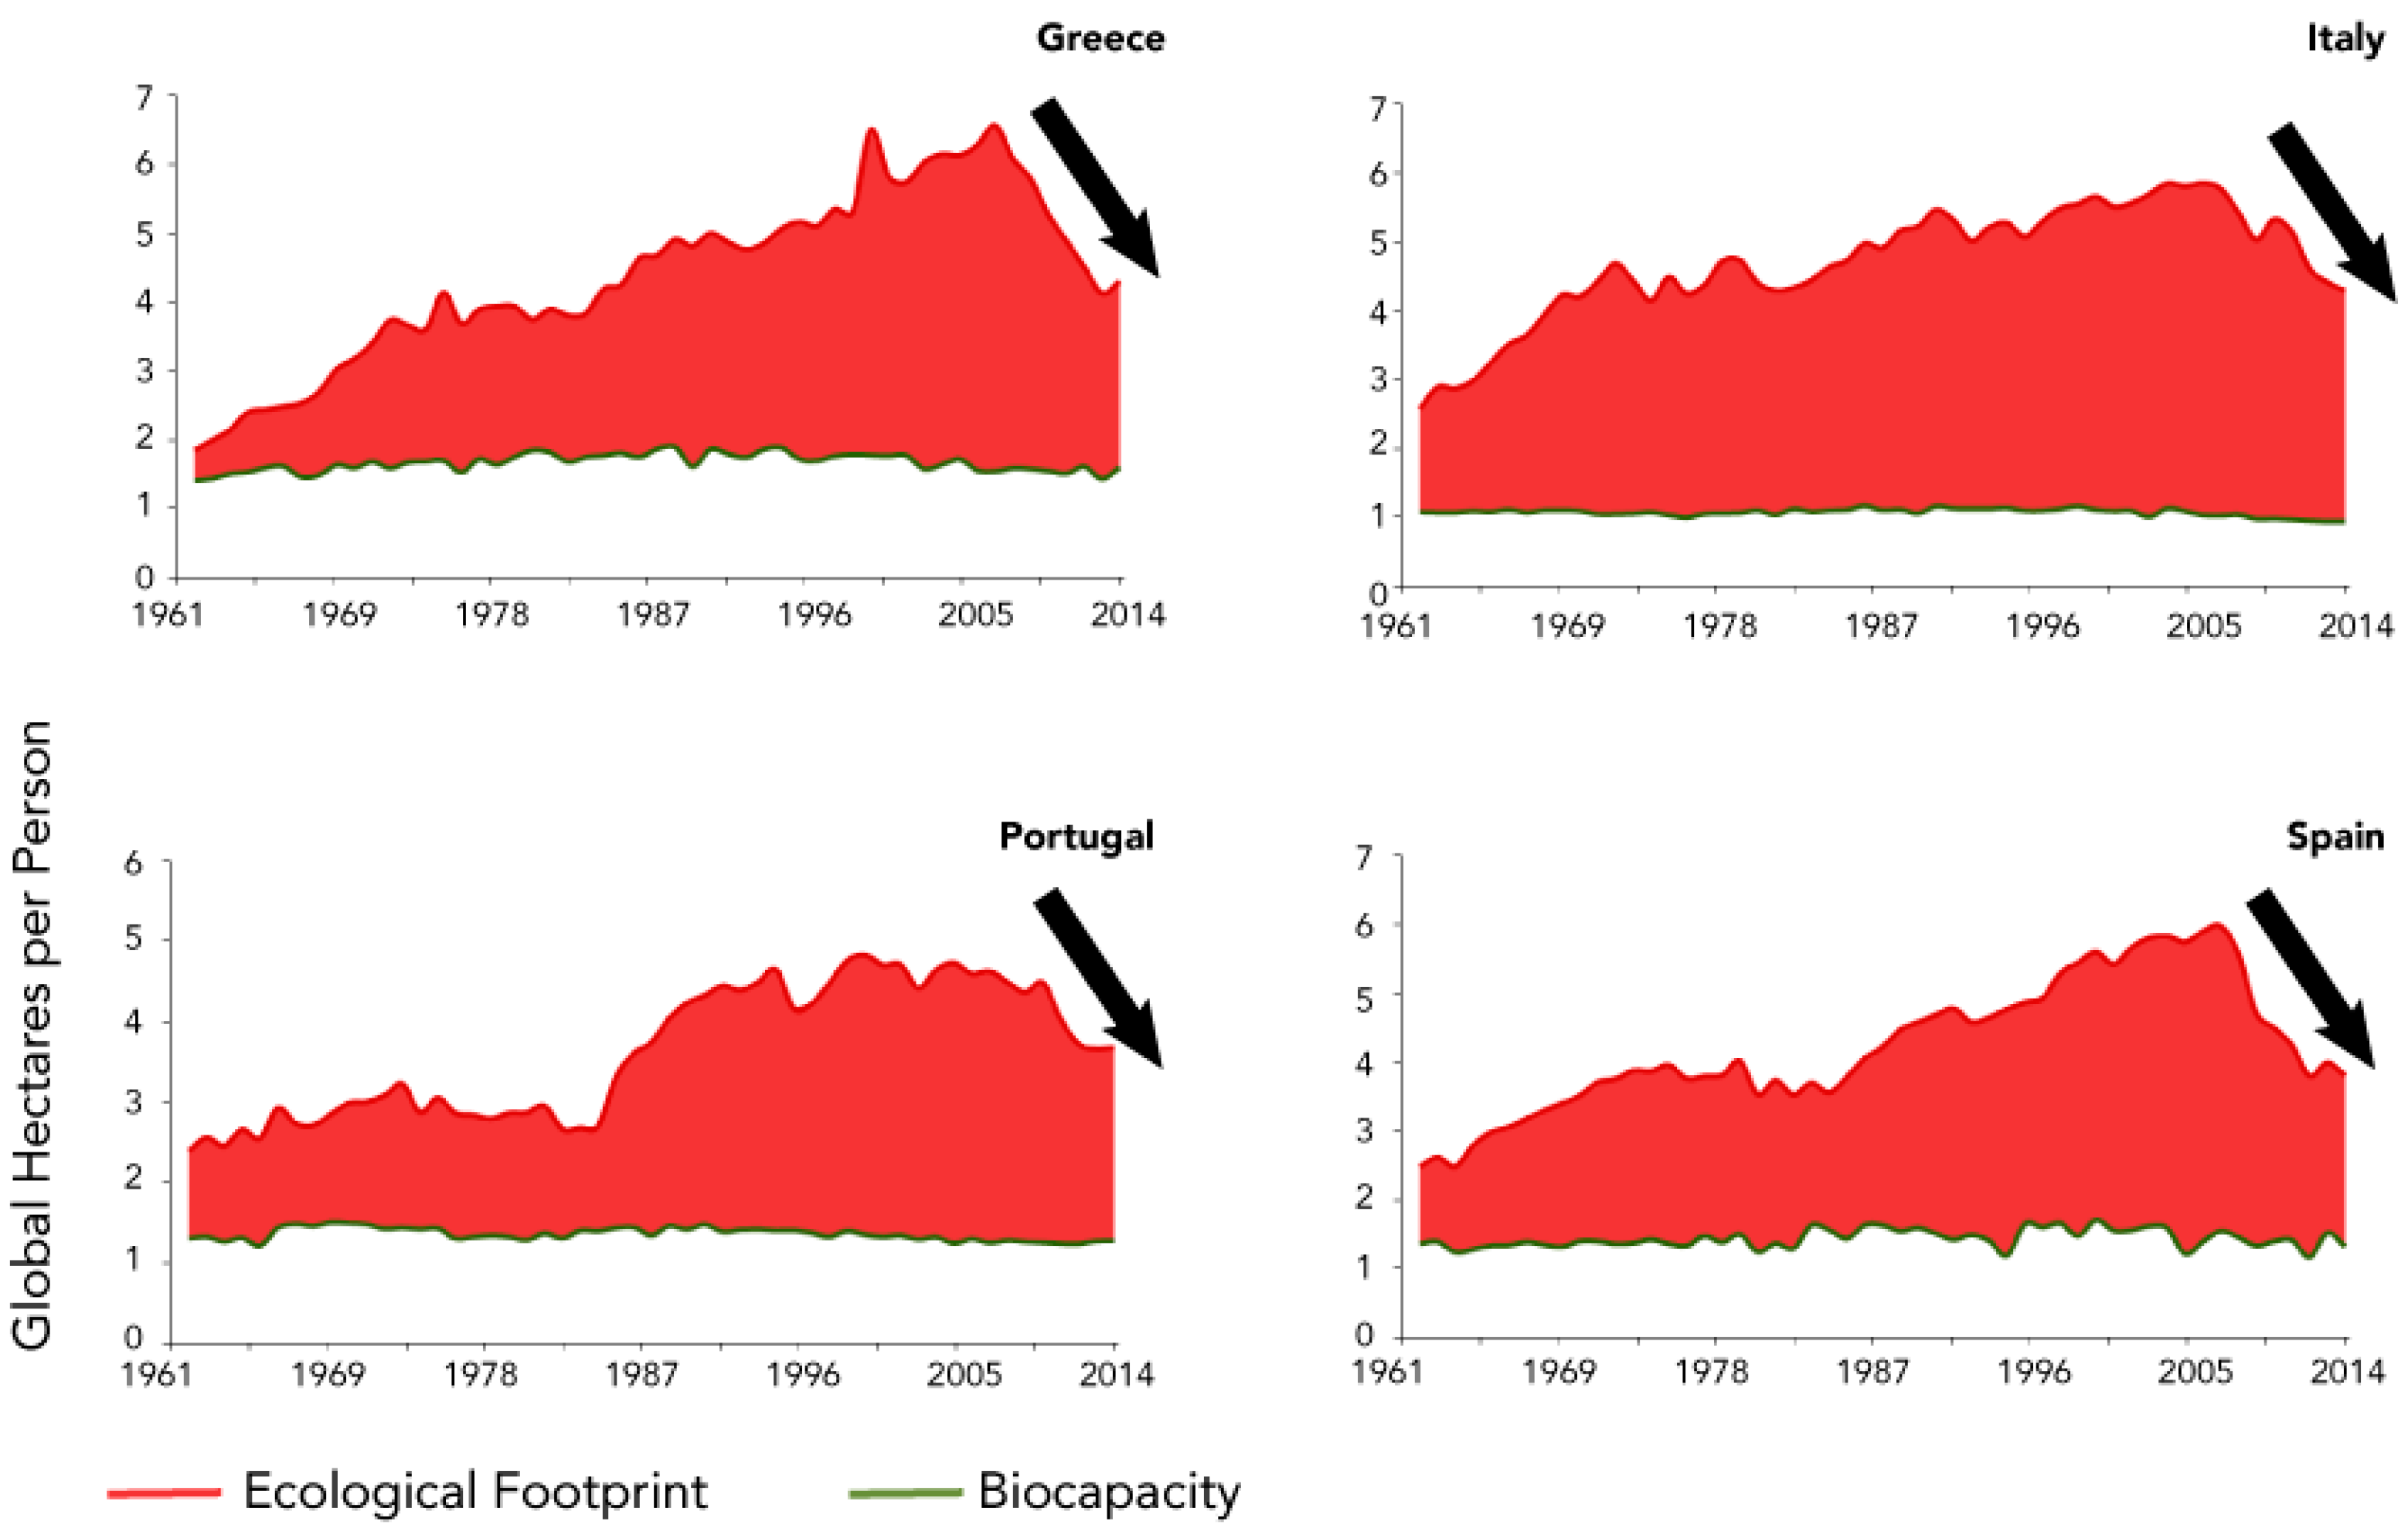
2.4. Reading Time Trends: The Example of Albania and the Countries Hit by the Euro Crisis
3. Results: The Countries Most Affected by Resource Insecurity
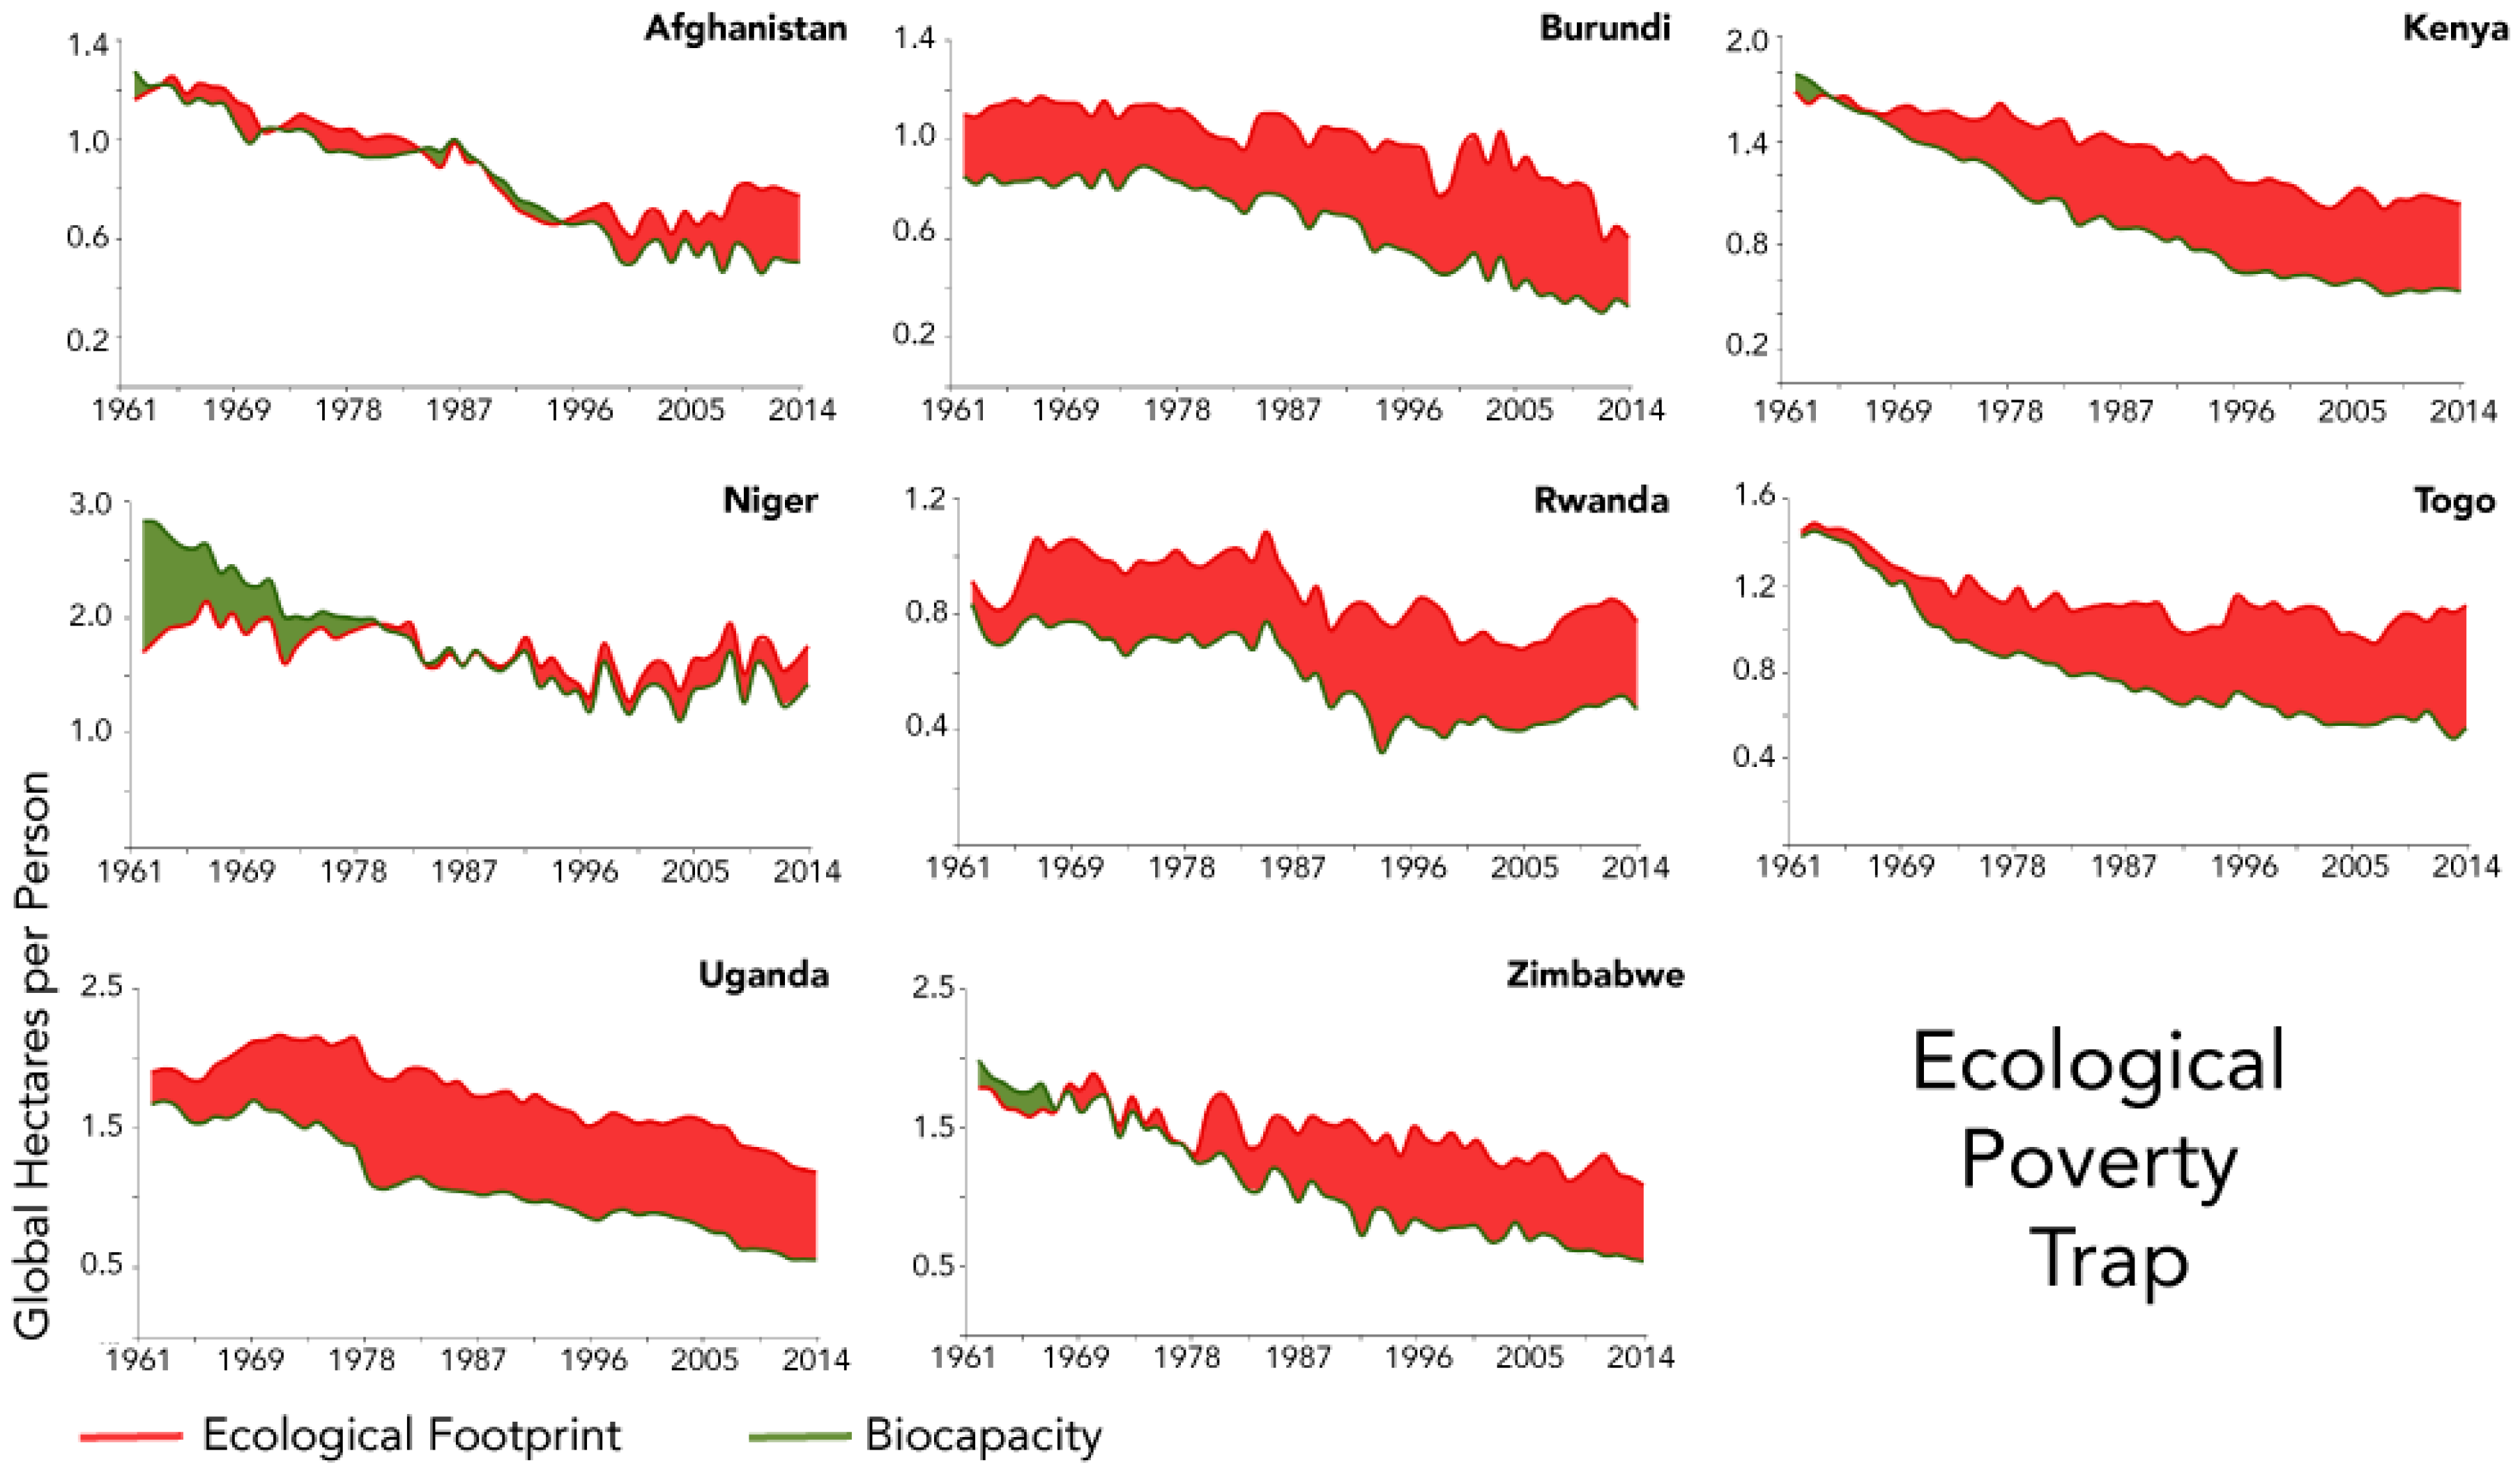
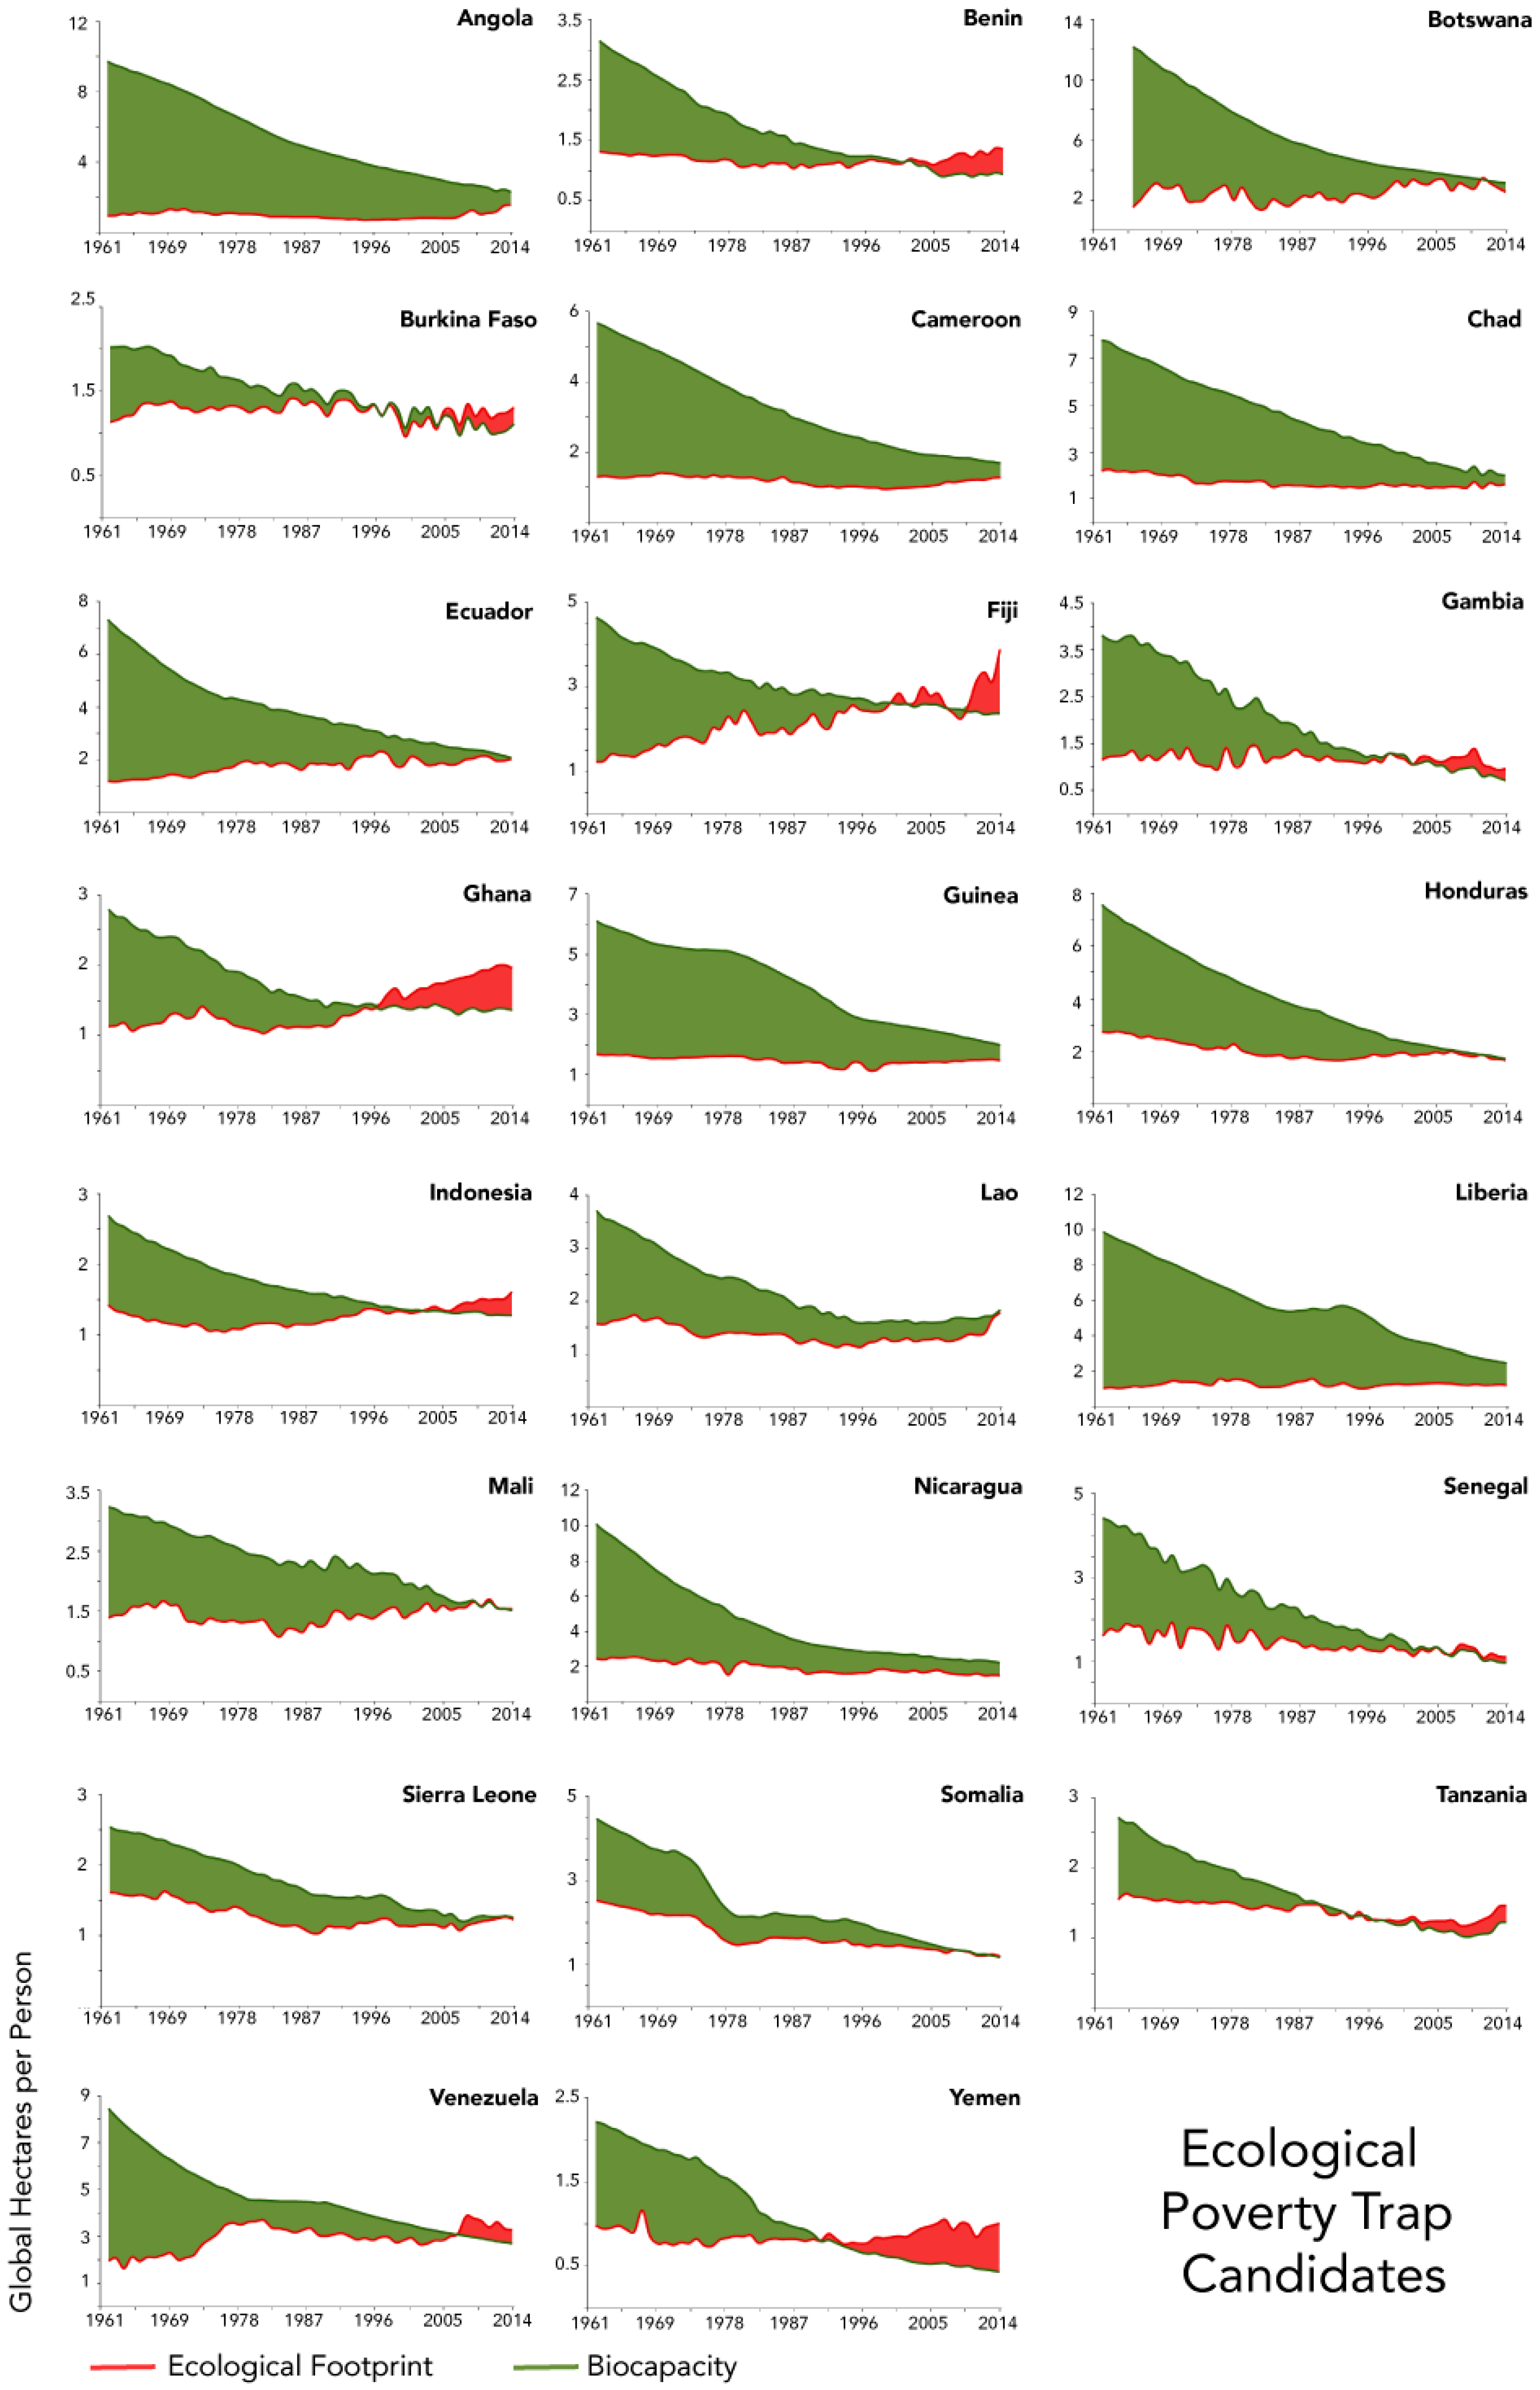
3.1. Countries in the Ecological Poverty Trap
3.2. Countries at Risk
4. Discussion: The Stunning Paradox
- On the one hand, human material demand is ever increasing and now significantly exceeds what the planet can renew. Economies are physical occurrences; to operate, they need to be fed with resource inputs and provided with absorptive capacities for their wastes. Without being able to feed their physical metabolism, economies will not be able to produce adequately. Any life, including human life, inescapably depends on biocapacity.
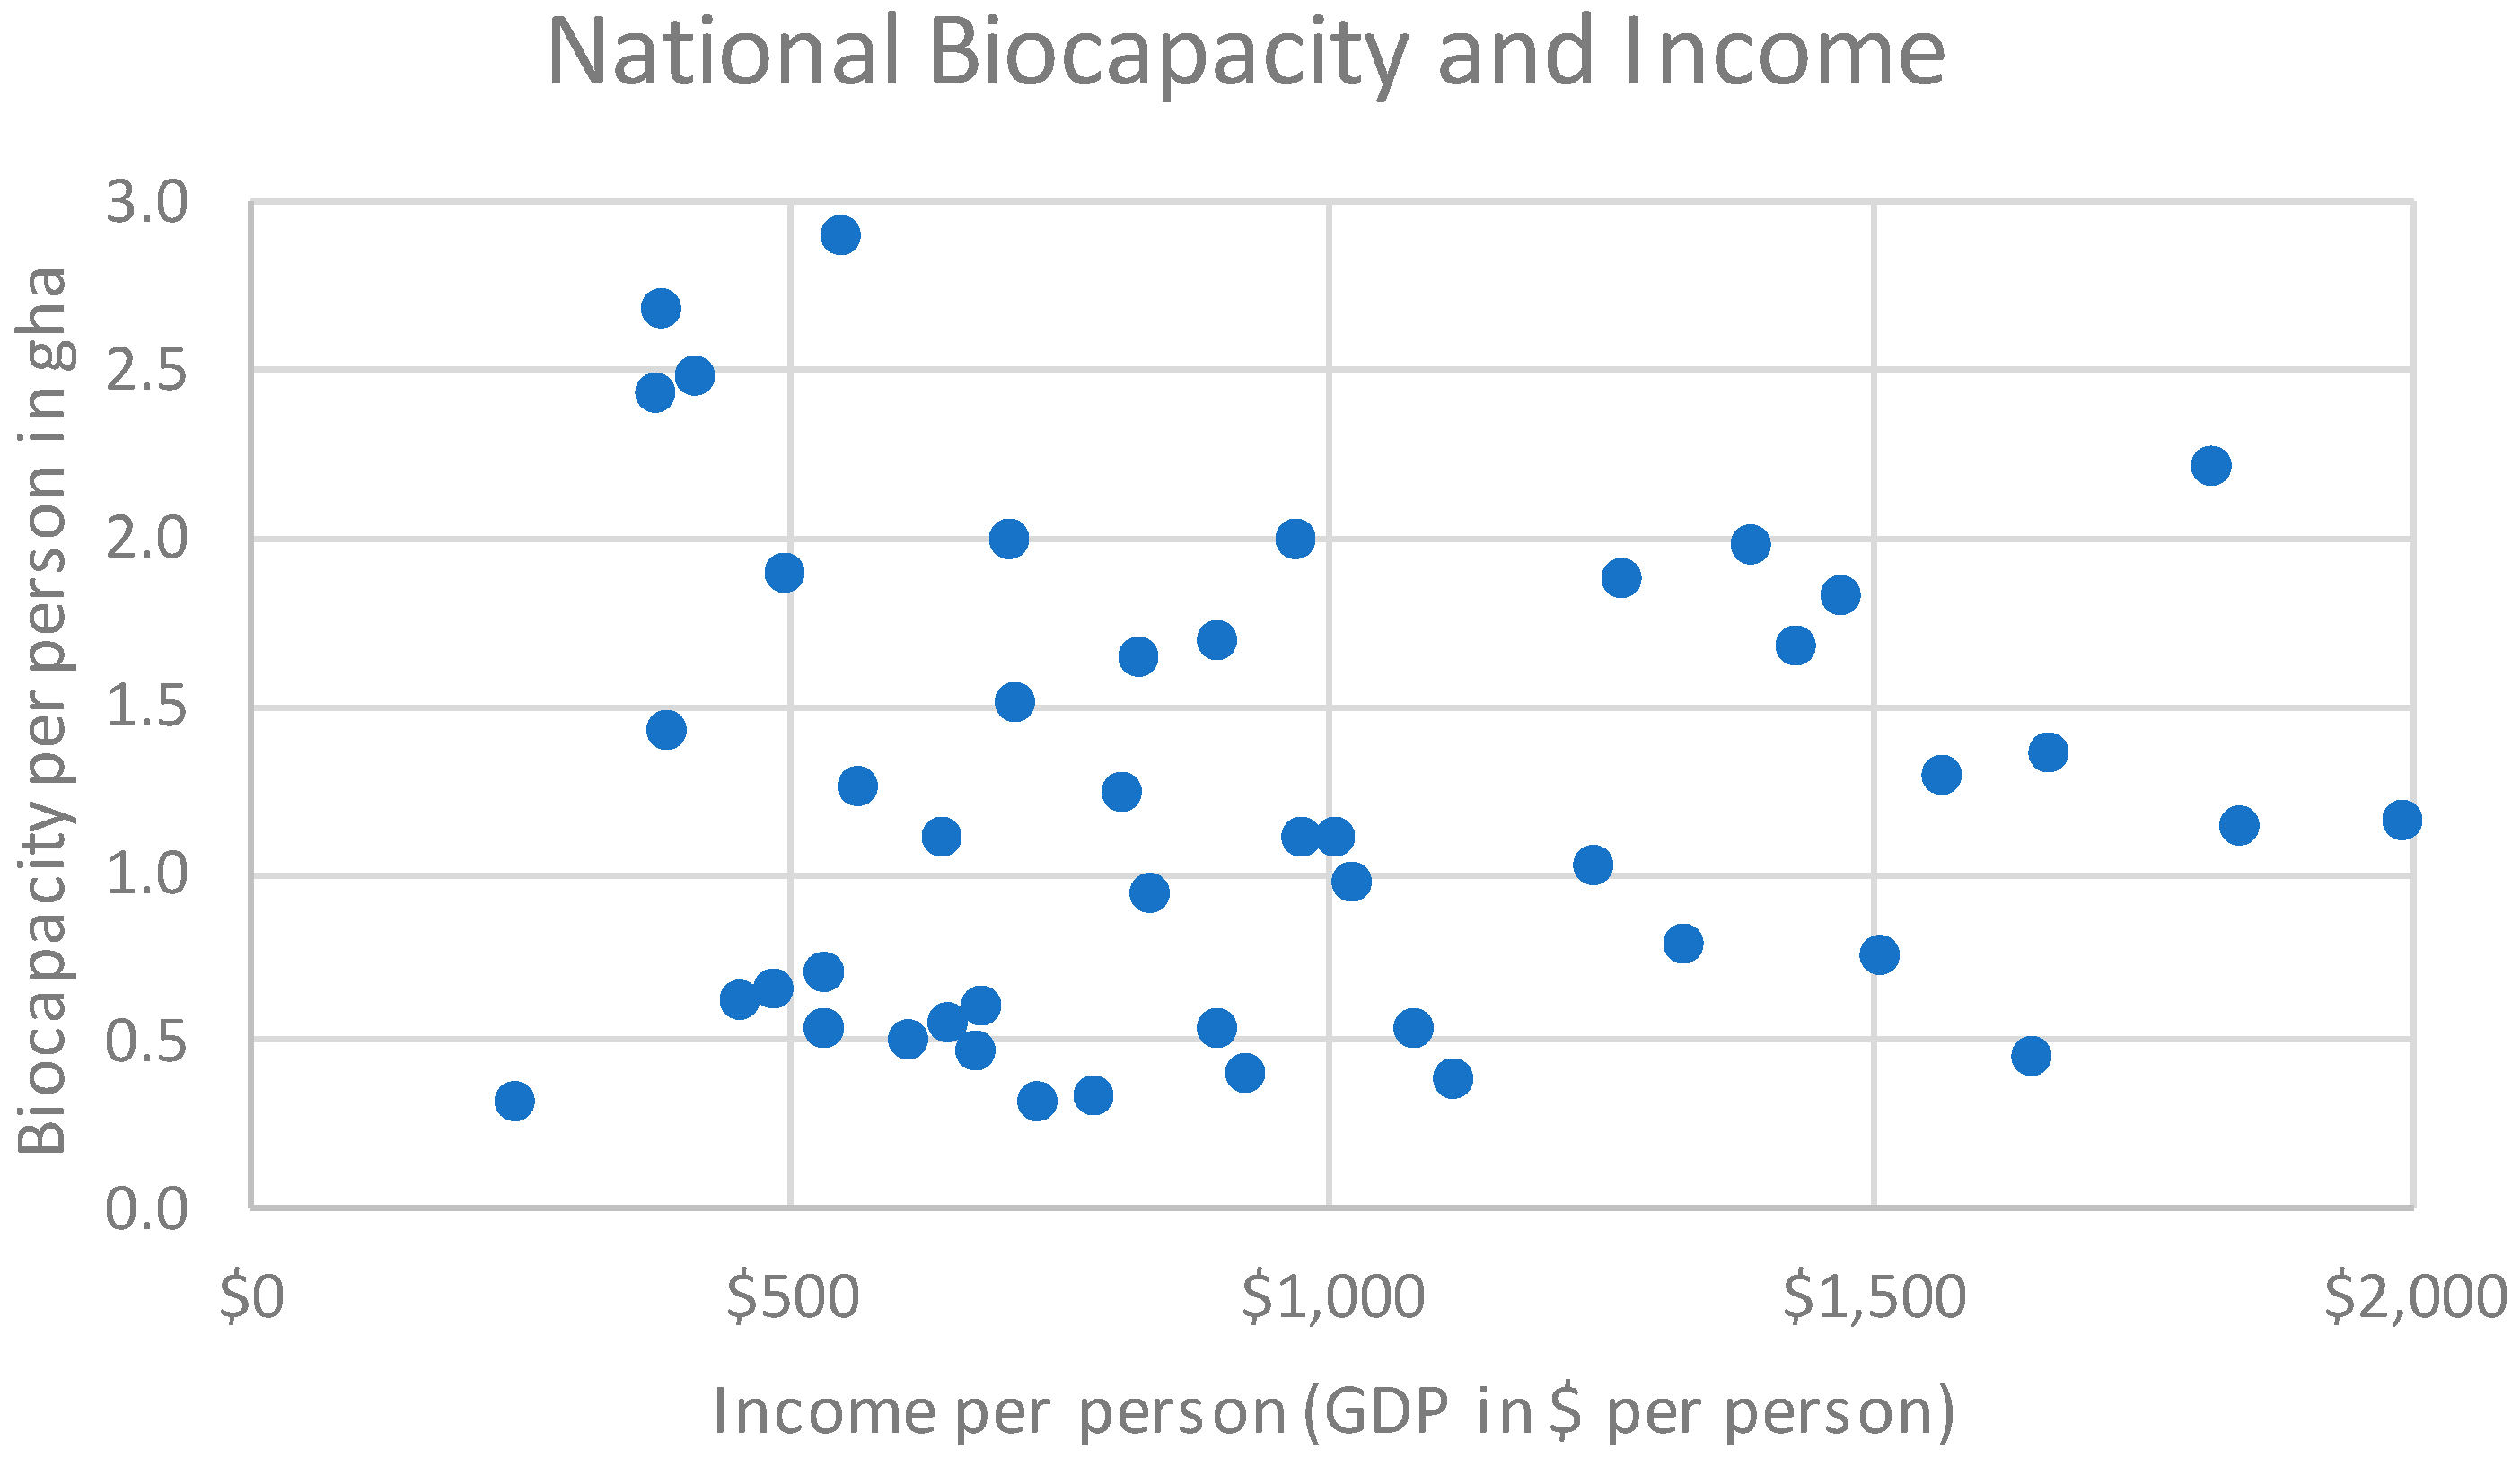
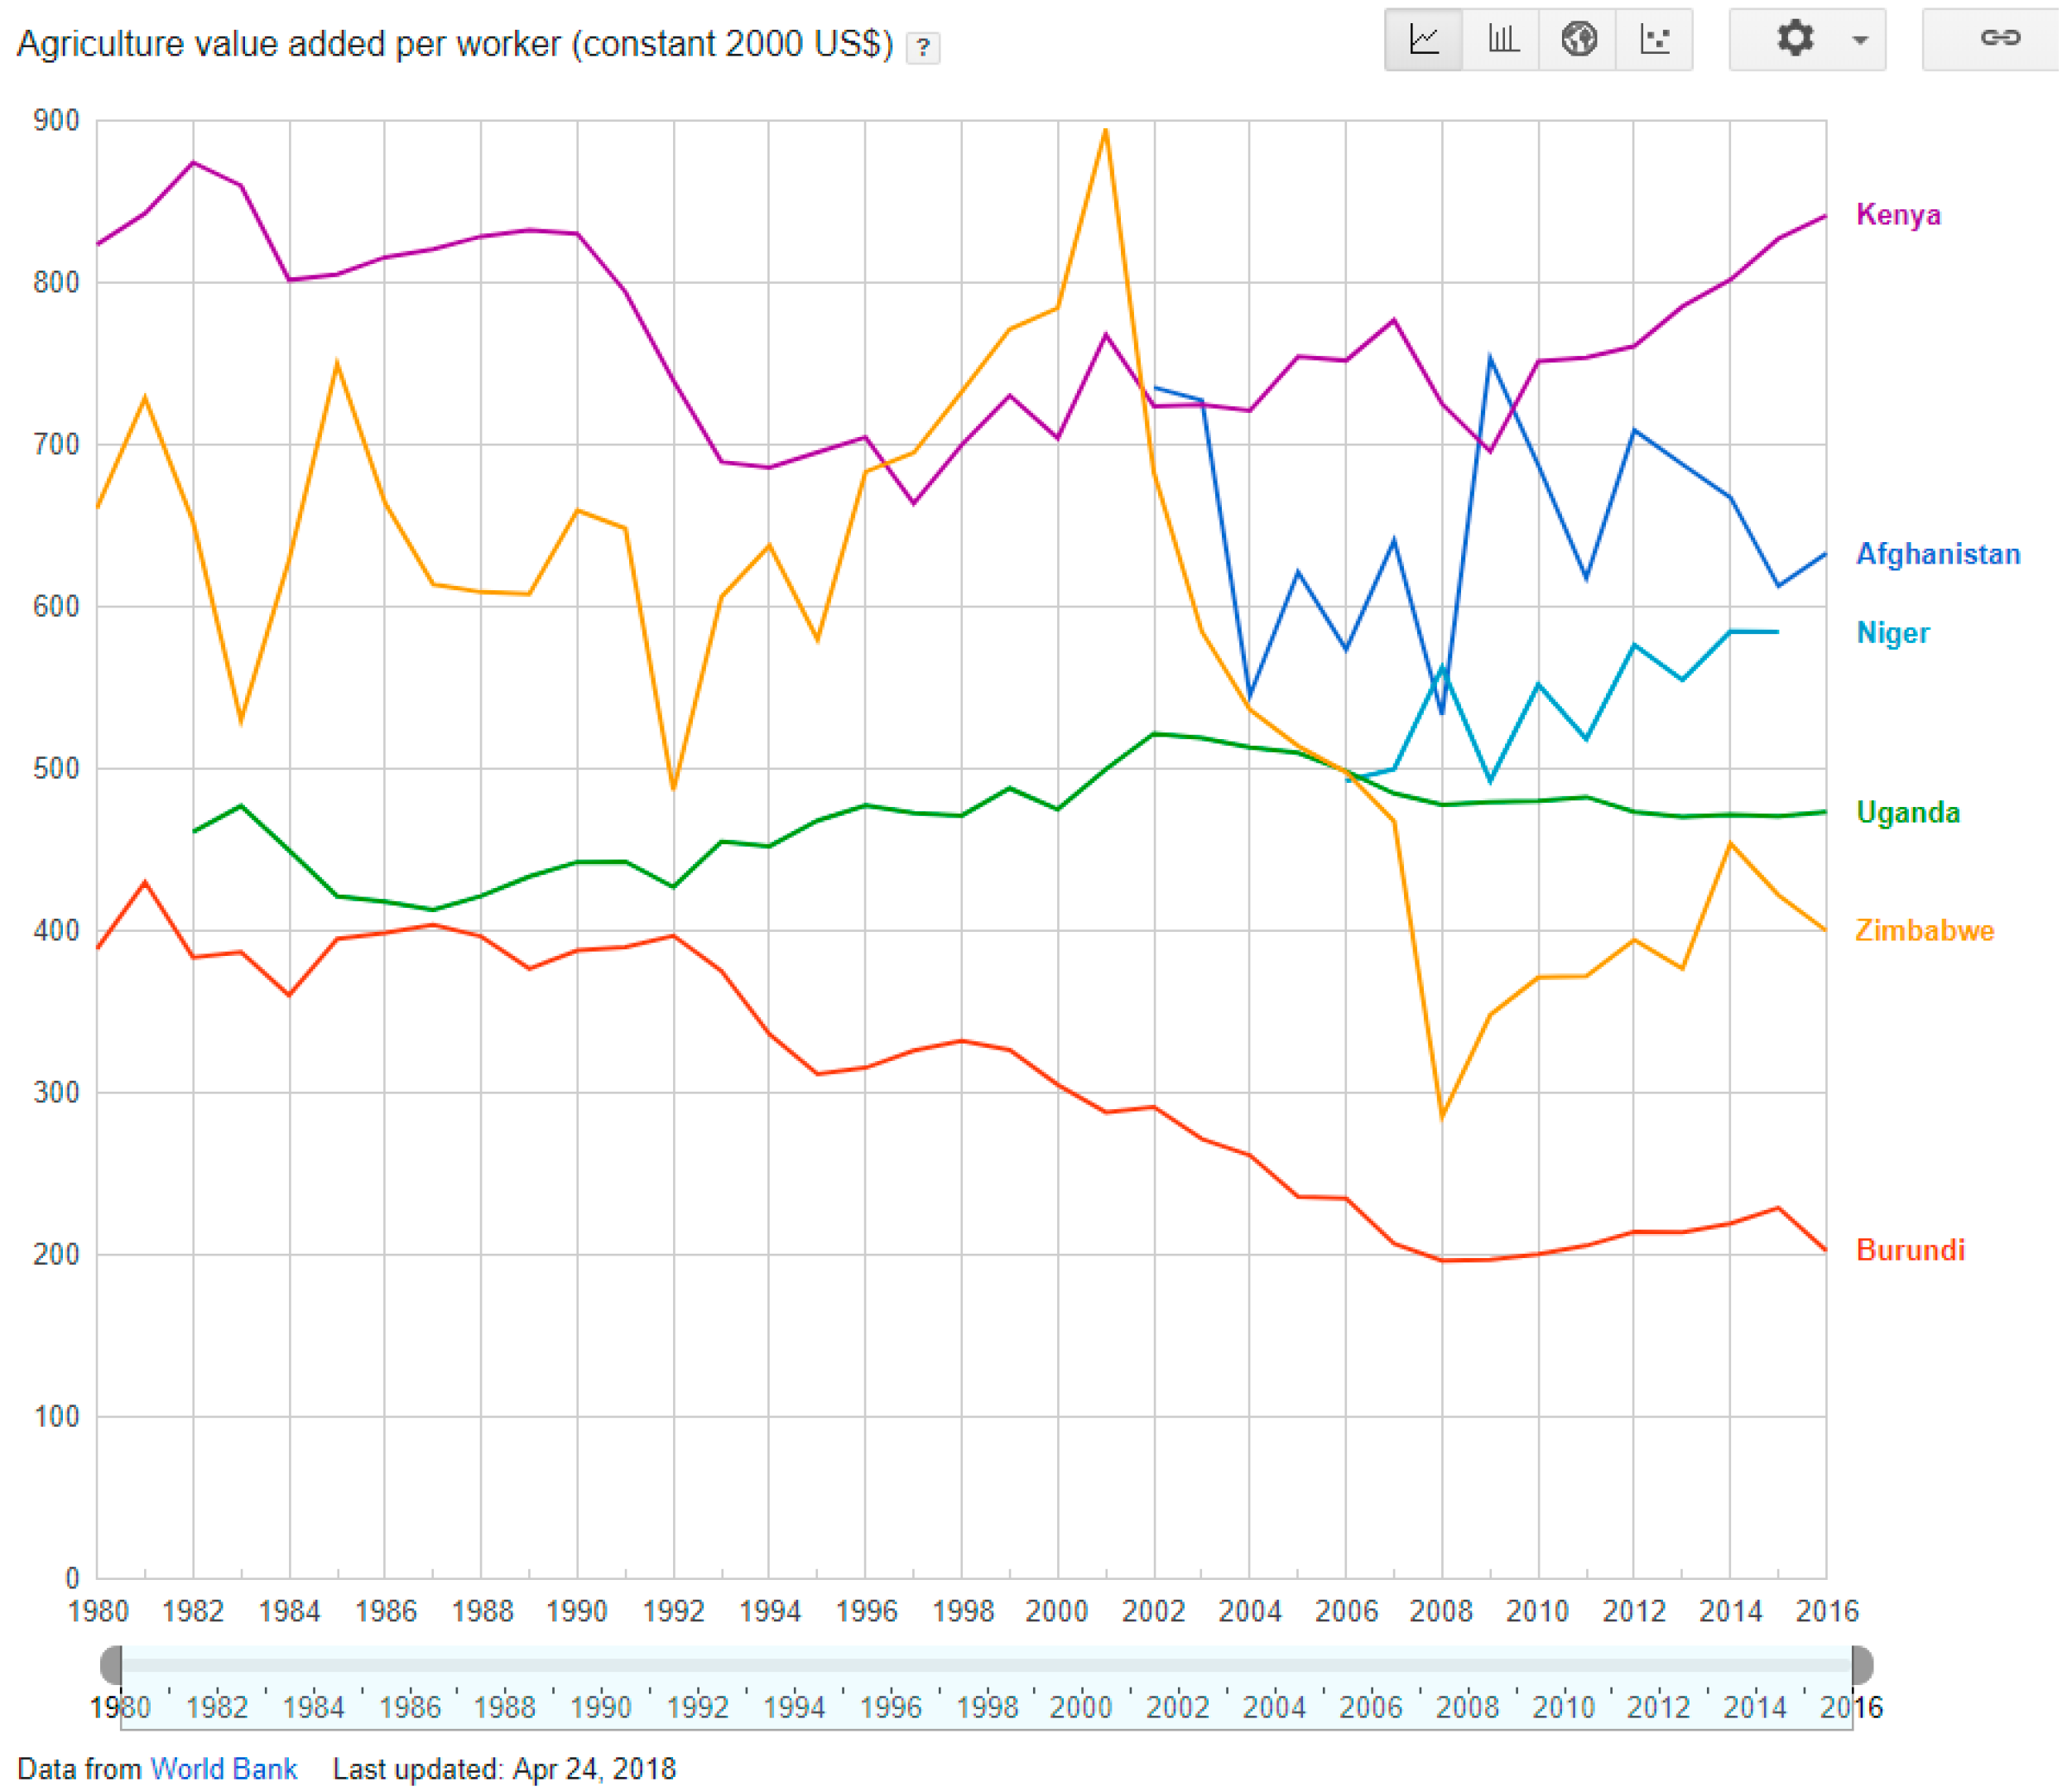
- On the other hand, over the last decades, biocapacity availability (the most fundamental resource on which the human enterprise depends, as explained above) has not been a determinant of economic success. This holds true even today, when the world community has contractually recognized the overuse of the planet’s biosphere (as evident through the Paris Agreement, the commitments to the SDGs, or the Aichi Targets). And in countries with low per person income and with very large portions of their populations engaged in agricultural activities, biocapacity access has not discernably stimulated income generation.
- (a)
- Either we assume that market forces and prices can, with sufficient accuracy, predict the future importance of natural capital and, in response, economic activities will react quickly enough to new resource contexts.
- (b)
- Or, we assume that people (and their economies) are biological beings that are inextricably dependent on natural capital to operate, even if prices seem to indicate a very small dependence on the “production factor” natural capital. The implication of the physical nature of the human enterprise, including the large time-lags inherent in many physical systems to adjust in size (road, energy, and housing infrastructure, and human populations), is that corrections need to be made early, even in absence of price signals.
5. Conclusions: Ways out
- Cities—How people design and manage cities: Compact, integrated cities are far more efficient than sprawling, segregated settlements. The way our cities are shaped determines heating and cooling needs, transportation, and other key resource consumption drivers. Cities are shifting rapidly. Eighty percent of an even larger world population is expected to live in cities by 2050. This amount translates into a near doubling of urban populations by then. Consequently, city planning and urban development strategies are instrumental to keep society’s overall material demand within what natural capital can renew. Mobility needs and the energy efficiency of housing shapes cities’ long-term resource dependence.
- Energy—How we power ourselves: renewables can replace fossil fuels. Carbon emissions currently make up the biggest share of humanity’s Footprint. Decarbonizing the economy is humanity’s best possible chance to address climate change as it would lower humanity’s Ecological Footprint dramatically.
- Food—How societies produce, distribute, and consume food: local, vegetable-based diets versus industrial animal-based diets. How humanity meets one of everybody’s most basic needs—food—is a powerful way to influence sustainability. Avoiding food waste, sustainable agriculture, and eating lower on the food chain lowers the Ecological Footprint. Currently, food production uses over half of our planet’s biocapacity.
- Population—How many people we are: smaller families with better health and educational outcomes. Being committed to everyone living secure lives in a world of finite resources requires addressing population size and population growth. We owe it to our children. Empowering women, establishing equal rights for all, and providing reliable access to family planning significantly reduces family size and is, therefore, essential for global sustainability. Not only does it lead to smaller families, but also better health and educational outcomes. Maybe, for a full demographic transition, it may also require building at least basic old-age security that lowers the risk of old age impoverishment for those who chose small families. In the lowest income countries, focusing on transforming demographic trends while enabling opportunities by accelerating zero-carbon energy access everywhere, and boosting agricultural productivities among small holders, may be among the most promising core strategies for snowballing human development.
Author Contributions
Funding
Conflicts of Interest
References
- Malthus, T.R. An Essay on the Principle of Population: Or, A View of Its Past and Present Effects on Human Happiness, 4th ed.; J. Johnson: London, UK, 1807; Volume 1. [Google Scholar]
- Meadows, D.H.; Meadows, D.L.; Randers, J.; Behrens, W.W., III. The Limits to Growth: A Report for the Club of Rome’s Project on the Predicament of Mankind; Universe Books: New York, NY, USA, 1972; ISBN 978-0-87663-165-0. [Google Scholar]
- André, C.; Platteau, J.-P. Land relations under unbearable stress: Rwanda caught in the Malthusian trap. J. Econ. Behav. Organ. 1998, 34, 1–47. [Google Scholar] [CrossRef]
- Galor, O.; Weil, D.N. Population, Technology, and Growth: From Malthusian Stagnation to the Demographic Transition and beyond. Am. Econ. Rev. 2000, 90, 806–828. [Google Scholar] [CrossRef]
- Kochanek, K.D.; Murphy, S.L.; Xu, J.; Arias, E. Mortality in the United States, 2016. DHHS Publication; 2017; p. 8. Available online: https://www.cdc.gov/nchs/products/databriefs/db293.htm (accessed on 10 April 2019).
- Murphy, S.L.; Xu, J.; Kochanek, K.D.; Arias, E. Mortality in the United States, 2017. DHHS Publication; 2018; p. 8. Available online: https://www.cdc.gov/nchs/products/databriefs/db328.htm (accessed on 10 April 2019).
- Schwab, K. The Global Competitiveness Report 2017–2018; World Economic Forum: Geneva, Switzerland, 2017; p. 393. [Google Scholar]
- World Economic Forum. The Global Risks Report 2018, 13th ed.; World Economic Forum: Geneva, Switzerland, 2018; p. 80. [Google Scholar]
- Rockström, J.; Steffen, W.; Noone, K.; Persson, Å.; Chapin, F.S., III; Lambin, E.F.; Lenton, T.M.; Scheffer, M.; Folke, C.; Schellnhuber, H.J.; et al. A safe operating space for humanity. Nature 2009, 461, 472–475. [Google Scholar] [CrossRef] [PubMed]
- Steffen, W.; Richardson, K.; Rockström, J.; Cornell, S.E.; Fetzer, I.; Bennett, E.M.; Biggs, R.; Carpenter, S.R.; de Vries, W.; de Wit, C.A.; et al. Planetary boundaries: Guiding human development on a changing planet. Science 2015, 347, 1259855. [Google Scholar] [CrossRef] [PubMed]
- Millennium Ecosystem Assessment. Ecosystems and Human Well-being: Synthesis; Island Press: Washington, DC, USA, 2005. [Google Scholar]
- Intergovernmental Panel on Climate Change. Climate Change 2014: Synthesis Report. Contribution of Working Groups I, II and III to the Fifth Assessment Report of the Intergovernmental Panel on Climate Change; Intergovernmental Panel on Climate Change: Geneva, Switzerland, 2014; p. 151. [Google Scholar]
- UNFCCC Paris Agreement 2015. Available online: https://unfccc.int/sites/default/files/english_paris_agreement.pdf (accessed on 10 April 2019).
- Parties to the Convention on Biological Diversity Indicators for the Strategic Plan for Biodiversity 2011–2020 and the Aichi Biodiversity Targets, Cancun, Mexico, 4–17 December 2016. p. 24. Available online: https://www.cbd.int/sp/targets/ or https://www.cbd.int/doc/decisions/cop-13/cop-13-dec-28-en.pdf (accessed on 10 April 2019).
- United Nations Transforming Our World: The 2030 Agenda for Sustainable Development. 2015. Available online: https://sustainabledevelopment.un.org/post2015/transformingourworld (accessed on 10 April 2019).
- Leaf, A. Potential Health Effects of Global Climatic and Environmental Changes. N. Engl. J. Med. 1989, 321, 1577–1583. [Google Scholar] [CrossRef] [PubMed]
- Raudsepp-Hearne, C.; Peterson, G.D.; Tengö, M.; Bennett, E.M.; Holland, T.; Benessaiah, K.; MacDonald, G.K.; Pfeifer, L. Untangling the Environmentalist’s Paradox: Why Is Human Well-being Increasing as Ecosystem Services Degrade? BioScience 2010, 60, 576–589. [Google Scholar] [CrossRef]
- Robinson, J.A.; Torvik, R.; Verdier, T. Political foundations of the resource curse. J. Dev. Econ. 2006, 79, 447–468. [Google Scholar] [CrossRef]
- Sachs, J.; Warner, A.M. Natural Resources and Economic Development: The curse of natural resources. Eur. Econ. Rev. 2001, 45, 827–838. [Google Scholar] [CrossRef]
- Gylfason, T. Natural resources, education, and economic development. Eur. Econ. Rev. 2001, 45, 847–859. [Google Scholar] [CrossRef]
- BP. BP Statistical Review of World Energy 2018, 67th ed.; BP p.l.c.: London, UK, 2018; p. 56. [Google Scholar]
- Butler, J.H.; Montzka, S.A. The NOAA Annual Greenhouse Gas Index (AGGI); NOAA Earth System Research Laboratory: Boulder, CO, USA, 2018. [Google Scholar]
- Tukker, A. Rare Earth Elements Supply Restrictions: Market Failures, Not Scarcity, Hamper Their Current Use in High-Tech Applications. Environ. Sci. Technol. 2014, 48, 9973–9974. [Google Scholar] [CrossRef] [PubMed]
- Wackernagel, M.; Galli, A.; Hanscom, L.; Lin, D.; Mailhes, L.; Drummond, T. Chapter 16: Ecological Footprint Accounts: Principles. In Routledge Handbook of Sustainability Indictors; Bell, S., Morse, S., Eds.; Routledge International Handbooks; Routledge: Abingdon, UK, 2018; pp. 244–264. [Google Scholar]
- Bar-On, Y.M.; Phillips, R.; Milo, R. The biomass distribution on Earth. Proc. Natl. Acad. Sci. USA 2018, 115, 6506–6511. [Google Scholar] [CrossRef] [PubMed]
- Esty, D.C.; Emerson, J.W. Chapter 5: From crises and gurus to science and metrics: Yale’s Environmental Performance Index and the rise of data-driven policymaking. In Routledge Handbook of Sustainability Indicators; Bell, S., Morse, S., Eds.; Routledge: New York, NY, USA, 2018; pp. 93–102. ISBN 978-1-138-67476-9. [Google Scholar]
- Sachs, J.; Schmidt-Traub, G.; Kroll, C.; Lafortune, G.; Fuller, G. SDG Index and Dashboards Report 2018; Bertelsmann Stiftung and Sustainable Development Solutions Network (SDSN): New York, NY, USA, 2018; p. 476. [Google Scholar]
- Sanderson, E.W.; Jaiteh, M.; Levy, M.A.; Redford, K.H.; Wannebo, A.V.; Woolmer, G. The Human Footprint and the Last of the WildThe human footprint is a global map of human influence on the land surface, which suggests that human beings are stewards of nature, whether we like it or not. BioScience 2002, 52, 891–904. [Google Scholar] [CrossRef]
- Purvis, A.; Newbold, T.; De Palma, A.; Contu, S.; Hill, S.L.L.; Sanchez-Ortiz, K.; Phillips, H.R.P.; Hudson, L.N.; Lysenko, I.; Börger, L.; et al. Chapter Five-Modelling and Projecting the Response of Local Terrestrial Biodiversity Worldwide to Land Use and Related Pressures: The PREDICTS Project. In Advances in Ecological Research; Bohan, D.A., Dumbrell, A.J., Woodward, G., Jackson, M., Eds.; Next Generation Biomonitoring: Part 1; Academic Press: Cambridge, MA, USA, 2018; Volume 58, pp. 201–241. [Google Scholar]
- Lettenmeier, M.; Liedtke, C.; Rohn, H. Eight Tons of Material Footprint—Suggestion for a Resource Cap for Household Consumption in Finland. Resources 2014, 3, 488–515. [Google Scholar] [CrossRef]
- Bringezu, S. Visions of a sustainable resource use. In Sustainable Resource Management: Global Trends, Visions and Policies; Bringezu, S., Bleischwitz, R., Eds.; Routledge: New York, NY, USA, 2017; pp. 155–215. ISBN 978-1-906093-26-6. [Google Scholar]
- Figueres, C.; Schellnhuber, H.J.; Whiteman, G.; Rockström, J.; Hobley, A.; Rahmstorf, S. Three years to safeguard our climate. Nature 2017, 546, 593–595. [Google Scholar] [CrossRef] [PubMed]
- United Nations Development Programme. 2016 Human Development Report: Human Development for Everyone; United Nations Development Programme: New York, NY, USA, 2016. [Google Scholar]
- United Nations Development Programme. Human Development Indices and Indicators: 2018 Statistical Update; United Nations Development Programme: New York, NY, USA, 2018; p. 123. [Google Scholar]
- Lin, D.; Hanscom, L.; Murthy, A.; Galli, A.; Evans, M.; Neill, E.; Mancini, M.S.; Martindill, J.; Medouar, F.-Z.; Huang, S.; et al. Ecological Footprint Accounting for Countries: Updates and Results of the National Footprint Accounts, 2012–2018. Resources 2018, 7, 58. [Google Scholar] [CrossRef]
- Haberl, H.; Erb, K.-H.; Krausmann, F. Global human appropriation of net primary production (HANPP). Encycl. Earth 2013. Available online: https://editors.eol.org/eoearth/wiki/Global_human_appropriation_of_net_primary_production_(HANPP) (accessed on 10 April 2019).
- Odum, H.T. Environmental Accounting: Emergy and Environmental Decision Making; Wiley: Hoboken, NJ, USA, 1996; ISBN 978-0-471-11442-0. [Google Scholar]
- Brown, M.T.; Ulgiati, S. Emergy and Environmental Accounting. In Encyclopedia of Energy; Cleveland, C., Ed.; Elsevier: New York, NY, USA, 2004. [Google Scholar]
- Rojstaczer, S.; Sterling, S.M.; Moore, N.J. Human Appropriation of Photosynthesis Products. Science 2001, 294, 2549–2552. [Google Scholar] [CrossRef] [PubMed]
- Wackernagel, M.; Rees, W. Our Ecological Footprint: Reducing Human Impact on the Earth; New Society Publishers: Gabriola Island, BC, Canada, 1996; ISBN 978-0-86571-312-3. [Google Scholar]
- Wackernagel, M.; Schulz, N.B.; Deumling, D.; Linares, A.C.; Jenkins, M.; Kapos, V.; Monfreda, C.; Loh, J.; Myers, N.; Norgaard, R. Tracking the ecological overshoot of the human economy. Proc. Natl. Acad. Sci. USA 2002, 99, 9266–9271. [Google Scholar] [CrossRef] [PubMed]
- Borucke, M.; Moore, D.; Cranston, G.; Gracey, K.; Iha, K.; Larson, J.; Lazarus, E.; Morales, J.C.; Wackernagel, M.; Galli, A. Accounting for demand and supply of the biosphere’s regenerative capacity: The National Footprint Accounts’ underlying methodology and framework. Ecol. Indic. 2013, 24, 518–533. [Google Scholar] [CrossRef]
- Wackernagel, M.; Galli, A.; Hanscom, L.; Lin, D.; Mailhes, L.; Drummond, T. Chapter 33: Ecological Footprint Accounts: Criticisms and Applications. In Routledge Handbook of Sustainability Indictors; Bell, S., Morse, S., Eds.; Routledge International Handbooks; Routledge: Abingdon, UK, 2018; pp. 521–539. [Google Scholar]
- Wackernagel, M.; Cranston, G.; Morales, J.C.; Galli, A. Ecological Footprint Accounts. In Handbook of Sustainable Development: Second Edition; Atkinson, G., Dietz, S., Neumayer, E., Agarwala, M., Eds.; Edward Elgar Publisher: Cheltenham, UK, 2014; pp. 371–398. ISBN 978-1-78254-469-2. [Google Scholar]
- Global Footprint Network. National Footprint Accounts, 2018 Edition; 2018; Available online: http://data.footprintnetwork.org (accessed on 10 April 2019).
- Victor, P.A. Managing Without Growth: Slower by Design, Not Disaster; Edward Elgar Publishing: Northampton, MA, USA, 2008; ISBN 978-1-84844-299-3. [Google Scholar]
- Central Intelligence Agency Africa: Botswana. Available online: https://www.cia.gov/library/publications/the-world-factbook/geos/bc.html (accessed on 4 January 2019).
- Transparency International Corruption Perceptions Index 2017. Available online: https://www.transparency.org/news/feature/corruption_perceptions_index_2017 (accessed on 4 January 2019).
- World Bank Agriculture, Forestry, and Fishing, Value Added (% of GDP). Available online: https://data.worldbank.org/indicator/NV.AGR.TOTL.ZS (accessed on 1 January 2019).
- World Bank World Development Indicators. Available online: https://datacatalog.worldbank.org/dataset/world-development-indicators (accessed on 2 January 2019).
- Google Public Data Explorer World Development Indicators. Available online: https://www.google.com/publicdata/explore?ds=d5bncppjof8f9_&met_y=ny_gdp_mktp_cd&hl=en&dl=en#!ctype=l&strail=false&bcs=d&nselm=h&met_y=labor_participation_rate&scale_y=lin&ind_y=false&rdim=region&idim=country:BDI:ZWE:UGA:AFG:HTI:KEN:NER&ifdim=region&hl=en_US&dl=en&ind=false (accessed on 4 January 2019).
- Weinzettel, J.; Steen-Olsen, K.; Hertwich, E.G.; Borucke, M.; Galli, A. Ecological footprint of nations: Comparison of process analysis, and standard and hybrid multiregional input–output analysis. Ecol. Econ. 2014, 101, 115–126. [Google Scholar] [CrossRef]
- Anzilotti, E. Food Waste is Going to Take Over the Fashion Industry. Available online: https://www.fastcompany.com/40584274/food-waste-is-going-to-take-over-the-fashion-industry (accessed on 4 January 2019).
- De Janvry, A.; Sadoulet, E. Development Economics: Theory and Practice; Routledge: New York, NY, USA, 2016; ISBN 978-1-317-50425-2. [Google Scholar]
- Roland, G. Development Economics; Pearson Education, Inc.: New York, NY, USA, 2014; ISBN 978-0-321-46448-4. [Google Scholar]
- Taylor, J.E.; Lybbert, T.J. Essentials of Development Economics, 2nd ed.; University of California Press: Oakland, CA, USA, 2015; ISBN 978-0-520-95905-7. [Google Scholar]
- Giugale, M.M. Economic Development: What Everyone Needs to Know, 2nd ed.; Oxford University Press: New York, NY, USA, 2017; ISBN 978-0-19-068841-7. [Google Scholar]
- Collier, P. The Bottom Billion: Why the Poorest Countries are Failing and What Can Be Done About It; Oxford University Press: New York, NY, USA, 2007; ISBN 978-0-19-804254-9. [Google Scholar]


| Country | 2000 | 2005 | 2010 | 2015 | HDI Rank (2015) out of 188 Countries |
|---|---|---|---|---|---|
| Afghanistan | 0.34 | 0.405 | 0.454 | 0.479 | 169 |
| Burundi | 0.268 | 0.290 | 0.385 | 0.404 | 184 |
| Haiti | 0.443 | 0.455 | 0.470 | 0.493 | 163 |
| Kenya | 0.447 | 0.483 | 0.530 | 0.555 | 146 |
| Niger | 0.255 | 0.286 | 0.323 | 0.353 | 187 |
| Rwanda | 0.332 | 0.404 | 0.464 | 0.498 | 159 |
| Uganda | 0.396 | 0.434 | 0.477 | 0.493 | 163 |
| Zimbabwe | 0.427 | 0.408 | 0.452 | 0.516 | 154 |
© 2019 by the authors. Licensee MDPI, Basel, Switzerland. This article is an open access article distributed under the terms and conditions of the Creative Commons Attribution (CC BY) license (http://creativecommons.org/licenses/by/4.0/).
Share and Cite
Wackernagel, M.; Lin, D.; Evans, M.; Hanscom, L.; Raven, P. Defying the Footprint Oracle: Implications of Country Resource Trends. Sustainability 2019, 11, 2164. https://doi.org/10.3390/su11072164
Wackernagel M, Lin D, Evans M, Hanscom L, Raven P. Defying the Footprint Oracle: Implications of Country Resource Trends. Sustainability. 2019; 11(7):2164. https://doi.org/10.3390/su11072164
Chicago/Turabian StyleWackernagel, Mathis, David Lin, Mikel Evans, Laurel Hanscom, and Peter Raven. 2019. "Defying the Footprint Oracle: Implications of Country Resource Trends" Sustainability 11, no. 7: 2164. https://doi.org/10.3390/su11072164
APA StyleWackernagel, M., Lin, D., Evans, M., Hanscom, L., & Raven, P. (2019). Defying the Footprint Oracle: Implications of Country Resource Trends. Sustainability, 11(7), 2164. https://doi.org/10.3390/su11072164