Article

Land Use Change in Coastal Cities during the Rapid Urbanization Period from 1990 to 2016: A Case Study in Ningbo City, China

1
Institute of Geographic Sciences and Natural Resources Research, Chinese Academy of Sciences, Beijing 100101, China
2
University of Chinese Academy of Sciences, Beijing 100049, China
3
Chinese Research Academy of Environmental Sciences, Beijing 100012, China
*
Author to whom correspondence should be addressed.
Sustainability 2019, 11(7), 2122; https://doi.org/10.3390/su11072122
Submission received: 19 February 2019 / Revised: 28 March 2019 / Accepted: 5 April 2019 / Published: 10 April 2019
(This article belongs to the Section Sustainable Urban and Rural Development)

Abstract

:
Coastal cities have been experiencing tremendous land use changes worldwide. Studies on the consequences of land use change in coastal cities have provided helpful information for spatial regulations and have attracted increased attention. Changes in forests and water bodies, however, have rarely been investigated, challenging the formation of a holistic pattern of land use change. In this study, we selected Ningbo, China, as a case study area and analyzed its land use change from 1990 to 2016. Random forest (RF) classification was employed to derive land use information from Landsat images. Transition matrices and a distribution index (DI) were applied to identify the major types of land use transitions and their spatial variations by site-specific attributes. The results showed that the entire time period could be divided into two stages, based on the manifestations of land use change in Ningbo: 1990–2005 and 2005–2016. During 1990–2005, construction land expanded rapidly, mainly through the occupation of agricultural land and forest, while during 2005–2016, the main change trajectory turned out to be a small net change in construction land and a net increase in agricultural land sourced from construction land, forests, and water bodies. In terms of land use change by site-specific attributes, the rapid expansion of construction land around the municipal city center during 1990–2005 was restrained, and similar amounts of land conversion between construction and agricultural use occurred during 2005–2016. During the study period, areas undergoing land use change also showed trends of moving outward from the municipal city center and the county centers located adjacent to roads and the coastline and of moving up to hilly areas with steeper slopes and higher elevations. Protecting reclaimed agricultural land, improving the efficiency of construction land, and controlling forest conversion in hilly areas are suggested as spatial regulations in Ningbo city.

1. Introduction

Land use change is regarded as one of the most important consequences of unprecedented human alterations of the earth’s land surface [1]. These changes significantly impact ecosystems, climate, and human vulnerability, and are also related to land degradation, soil erosion, biodiversity loss, and environment pollution [2,3,4,5,6]. Land use change has been selected as a core research project of the International Geosphere Biosphere Programme (IGBP), the International Human Dimensions Programme on Global Environmental Change (IHDP), and the World Climate Research Programme (WCRP) [7]. Many studies have analyzed the dynamics and patterns of land use change at different levels (i.e., at the global, continent, country, or city level) and in different time periods, concluding that although agricultural land expansion, urban sprawl, and forest loss have been major manifestations of global land use change, significant variations have been observed at continental, national, and regional levels due to differences in the underlying drivers, including demographic, economic, sociocultural, institutional, technological, and biophysical indicators [8,9,10,11,12].
Coastal cities, occupied by approximately 70% of the global population, are the areas most affected by land use change, which mainly manifests through urban expansion and changes induced in other land use types, including agricultural land, forests, and water bodies [13]. Land use change in coastal cities is regarded as one of the major causes of many ecological and environmental problems, especially those related to water, which usually substantially impact hydrological alternations and can also threaten urban sustainability [14]. Coastal cities have been identified as vulnerable regions in terms of climatic shifts [15,16]. Coupled land use and climate changes usually lead to amplified hydrological responses and aggravated flood risks in these cities [17]. The management of land and water are increasingly being recognized as inextricably linked [14,18]. In this context, understanding the processes of land use change and its spatial patterns in coastal cities is instructive for policy decision-making on optimal land use planning and management. These policies can provide feasible strategies for the sustainability of coastal cities, especially for water and flood management practices.
In China, land use has significantly changed due to rapid urbanization and population growth, which can be characterized by an expansion in construction land and a decrease in agricultural land [19,20,21,22,23]. China’s construction land increased nearly five-fold during 1992–2015, almost 2.5 times more rapidly than the global average [24]. More than 10% of cultivated land has been converted to other land use types, and the per capita area of cultivated land decreased from 0.11 ha in 1996 to 0.09 ha in 2008 [25]. This has aggravated the problem of a “large population with relatively little arable land” and has increased the risk of food shortage in China [26]. To guarantee food security, central and local governments in China have implemented a series of policies since the mid-1980s, and enhanced the strictness of these policies after 2004 via agricultural taxes, land premiums, and an arable land minimum (12 million ha) to curb the occupation of agricultural land by construction land: These policies have been judged to be almost effective in restricting agricultural land loss [27,28]. Currently, spatial regulations are highly appreciated by the central government of China, aiming at enhancing efficiencies and realizing the sustainable development of national or regional land spaces through a comprehensive arrangement of land space development, resource and environmental protection, the improvement of land consolidation, and security systems [29,30].
With a rapid urbanization process, coastal cities in China have experienced faster development and attracted more people than other cities [31]. In 2016, more than 40% of the urban population and 52% of the gross domestic product (GDP) were concentrated in the coastal regions of China. As a consequence, land use changes in these regions have attracted the attention of many researchers: Their topics focused on the rapid urban expansion and conversion of agricultural land belonging to first-tier coastal cities such as Shanghai, Guangzhou, and Shenzhen [32,33,34,35,36]. In contrast, changes in other land use types (e.g., forests and water bodies) have rarely been investigated, adding to the difficulty of forming a holistic pattern of land use change, especially in second- and third-tier coastal cities. The expansion of coastal cities involves the occupation of agricultural land and forests, as well as water bodies, which has adverse impacts on ecosystems, increases flood probability, and creates a series of obstacles for urban regulations. Additionally, conflicts among different land use types and their negative impacts on socioeconomic development in rapidly urbanized coastal cities may be emerging sequentially in less-developed cities in China [37]. Therefore, more effective analyses and monitoring of land use changes are required for better spatial regulations in coastal cities, especially with regard to those that have become some of the most dynamic places in China (posing a risk for water and flood management).
Remote sensing images can contribute to providing spatially and temporally consistent monitoring information for land use change analyses with time and efficiency requirements [38]. Machine learning algorithms, such as artificial neural networks (ANNs), support vector machines (SVMs), and random forest (RF), have been widely used in land use classification with remote sensing images, as they can capture the nonparametric signature of land use types and do not rely on data belonging to any particular statistical distribution [39]. Their high accuracy separates them from traditional unsupervised and supervised algorithms, such as IsoData, K-means, and maximum likelihood (ML) [40]. Among these machine learning algorithms, the results of RF classification have been proven to be more accurate and robust, especially when the feature space is complex and the data present different statistical distributions [41,42].
In this study, we investigated the spatiotemporal patterns of land use change in Ningbo, China, a coastal city that is one of the most typical and important coastal cities in the Coastal Economic Belt and is undergoing a rapid urbanization process. An integrated approach incorporating geographic information system (GIS), remote sensing images, RF classification, a land use transition matrix (LUTM), and a distribution index (DI) was applied. We introduced RF classification, LUTM, and DI to extract land use information from Landsat images to detect major types of land use transitions and to analyze their spatial variations by site-specific attributes. The research objectives were: (1) To determine the temporal changing trends of each land use type in Ningbo city during 1990–2016; (2) to identify the major types of land use transitions, with a focus on the characteristics of urbanization; and (3) to examine the differences in the spatial patterns of the major types of land use transitions on the basis of site-specific attributes. The approach and findings of this study are a valuable reference to support the creation and implementation of spatial regulations for policymakers, urban planners, and resource (especially water resource) managers in coastal cities, as well as in cities with diverse and dynamic changes in land use types.

2. Materials and Methods

2.1. Study Area

Ningbo city is located within the intersection of the national “golden waterway” of the Yangtze River and the north–south sea transportation route in China (Figure 1). It is a prefectural-level city and contains 11 county-level administrative regions: Haishu, Jiangbei, Jiangdong, Beilun, Zhenhai, Yinzhou, Fenghua, Yuyao, Cixi, Xiangshan, and Ninghai. It has a subtropical climate with hot and humid summers and relatively dry winters. The mean annual temperature is about 16.5 °C, and the mean annual rainfall is about 1440 mm. The plum rain of the Asian monsoon in June and the typhoons that occur annually between August and October are the main sources of water for the city, and fluctuations in these events may lead to flooding or droughts [43]. Topographically, the average elevation of this region is very low, with more than 50% of its on-land territory being less than 50 m above sea level.
Ningbo is also known as a rapidly developing port city. In 1987, it became a separate planning city and was granted the same authority as the provincial governments for financial administration. Subsequently, both its economy and urbanization developed rapidly. In 1990, the GDP of Ningbo was 14.1 billion RMB, and the urbanization rate was 38.5%. In contrast, in 2016, its GDP reached 854.1 billion RMB, an almost 60-fold increase, and the urbanization rate increased to 71.9%, 33.4% higher than in 1990. The population in Ningbo has also continuously increased from 4,577,000 in 1990 to 5,910,000 in 2016 [44]. The Ningbo-Zhoushan port, which has become the largest port in the world in terms of cargo tonnage (since 2012), is regarded as having considerably contributed to the development of Ningbo city [45]. Concurrently, construction land expansion has become one of the major land use change trajectories in Ningbo city, and has mainly been achieved through the conversion of agricultural land and forests. However, the implementation of farmland protection policies have proven to be effective in controlling the expansion of construction land and in protecting agricultural land from being occupied by non-agricultural use [46], so manifestations of land use change may be different in Ningbo city over time.

2.2. Data

Landsat thematic mapper (TM), enhanced TM plus (ETM+), and operational land imager (OLI) images with 30-m resolution were used to draw land use maps for the years 1990, 1995, 2000, 2005, 2010, and 2016. All Landsat images were downloaded from the United States Geological Survey (USGS). To produce high-quality land use maps, images with cloud cover below 10% that were acquired in the summer were selected. If these images were missing, images from other seasons or adjacent years were supplemented. Finally, a total of 14 images were selected (Table 1). They were first radiometrically and atmospherically corrected using radiometric calibration and FLASSH modules in ENVI 5.3 (Exelis Visual Information Solutions, Inc., Boulder, CO, USA), and second, scan gaps of the Landsat 7 images after 2003 (caused by a shutdown of the Landsat 7 scan-line corrector (SLC) on 31 May 2003) were repaired using a patch named “landsat_gapfill.sav”. After, these images were joined and clipped according to the Ningbo city boundary.
In addition to Landsat images, a digital elevation model (DEM) with 30-m resolution was downloaded from the Geospatial Data Cloud (Figure 1). Slope in Ningbo city could be calculated using the DEM data. Seats of urban or county governments were used as socioeconomic centers of Ningbo city, which were derived from the Municipal Bureau of Land Resources of Ningbo [47]. The main roads in 1990 and 2005 were revised based on roads derived from OpenStreetMap (OpenStreetMap Foundation, London, UK), according to traffic maps and high-resolution Google Earth maps (Google Inc., Santa Clara county, CA, USA). The coastline was extracted from land use data. All these data were used to illustrate the spatial characteristics of land use change in Ningbo city.

2.3. Random Forest (RF) Classification

A detailed flowchart of land use mapping is presented in Figure 2. RF classification is an efficient tool for land use mapping [41,48], and was used to map land use in Ningbo.
EnMAP-box 2.2 (Humboldt University, Berlin, Germany) was used to run the RF classification. Two parameters needed to be set, the number of decision trees to be generated (Ntree) and the number of variables to be randomly sampled at each tree (mtry). Belgiu et al. [49] have suggested that a default value of 500 for Ntree is acceptable, because the errors stabilize before this number of classification trees is achieved. RF classification is not sensitive to mtry, and mtry is usually set to be the square root of the number of input variables. In this study, we assigned 500 and the square root of the number of input variables for Ntree and mtry, respectively.
To improve classification performance, DEM, slope, textures, and spectral indices were employed in the RF classification. Textures were calculated using co-occurrence measures with a 3 × 3 window size, including mean, variance, homogeneity, contrast, dissimilarity, entropy, second moment, and correlation. Spectral indices were calculated using the band math of the Landsat images. Six indices were calculated: Normalized difference vegetation index (NDVI), normalized difference water index (NDWI), modified normalized difference water index (MNDWI), revised normalized difference water index (RNDWI), urban index (UI), and normalized difference built-up index (NDBI) [50,51,52,53,54]. All these calculations were completed using ENVI 5.3 software.
Five land use types were extracted: Construction land, agricultural land, forests, water bodies, and other land (Table 2). Majority statistical filtering with 3 × 3 filtering was used to reduce salt and pepper effects. To avoid the influence of changes in the sensors, images from each sensor in each year were classified separately.
Training and validation samples of each land use type were extracted from Google Earth images and Landsat images by visual interpretation for each year, each including 500 randomly selected points for each year. Overall accuracy (OA) and kappa coefficient methods were applied for accuracy assessments [37], where larger OA and kappa coefficients correspond to more accurate RF classification results.

2.4. Land Use Transition Matrix (LUTM)

LUTM has been widely used in quantitative descriptions of land use changes [2,55]. LUTM was applied in this study to describe the quantities of land use changes. According to the LUTM, the gain, loss, and net change of each land use type can be determined, and the major types of land use transition can be summarized. LUTM can be calculated using raster calculators in ArcGIS 10.4 software (Environmental Systems Research Institute, Inc., Redlands, CA, USA).

2.5. Spatial Variation Analysis

To analyze the spatial variations in a specific type of land use transition, an indicator named the distribution index (DI) was introduced in this study. The DI equals the ratio between the area of a type of land use transition within a spatial attribute group and the total area of this type of land use transition in Ningbo city. The formula is as follows:
D I i j k = C A i j k C A i × 100 %
where DI refers to the distribution index, i refers to the ith type of land use transition, j refers to the jth group for spatial attribute k, CAijk refers to the area of the ith type of land use transition within the kth group of spatial attribute j, and CAi refers to the total area of the ith type of land use transition in Ningbo city.
For the spatial attributes affecting land use change, previous studies have mostly focused on four attributes: Physical factors, socioeconomic factors, neighborhood factors, and land use policy factors [56,57]. In this study, we emphasized the spatial patterns of land use change by physical and socioeconomic attributes. Two topographic attributes (i.e., slope and elevation) were selected that have mostly been considered physical factors in previous studies [57]. Proximity attributes were regarded as good representations of socioeconomic factors [57,58,59], and in this study, we selected four proximity attributes: Distance to urban center (DUC), distance to county centers (DCC), distance to main roads (DMR), and distance to coastline (DCL). Specifically, DCL was considered together with other attributes (DCL has seldomly been included in previous studies) because there is a series of ports along the coastline that may also play a significant role in land use change.
With respect to the divisions of groups for spatial attributes, the DUC, DCC, and DCL groups were divided using an interval of 10 km. The DMR group was divided with an interval of 1 km. Slopes with values of 2, 6, 15, and 25 were used as dividing points according to the technical specifications of Chinese land use surveys. As most land use change activities have occurred in areas with elevations less than 100 m, we emphasized the spatial variations of land use change in these areas, with an interval of 10 m (Figure 3).

3. Results

3.1. Accuracy Assessment of RF-Derived Land Use Data

The OA and kappa coefficients were calculated using randomly selected validation samples for the years 1990, 2000, 2005, 2010, and 2016, as shown in Table 3. The values of the OA were 87.8%, 91.6%, 92.8%, 85.5%, 88.8%, and 86.8%, and the kappa coefficients were 0.83, 0.88, 0.90, 0.81, 0.85, and 0.83 for 1990, 1995, 2000, 2005, 2010, and 2016, respectively. All of the OA values were above 80%, and all of the kappa coefficients were greater than 0.8.
Visual interpretation is regarded as more accurate but more time-consuming than most other methods in land use classification using medium- to high-resolution images [60,61,62]. You adopted the visual interpretation method and obtained land use data of Ningbo mainly from Landsat images for 1985–2013 [37]. The values of OA and the kappa coefficients found in this study were roughly close to those of You (Table 3), and the values in 2000 were even larger than their counterparts in You’s study, implying that the results of the RF classification were satisfactory in analyzing land use change in Ningbo city.

3.2. An Overall Sketch of Land Use Change

According to Table 4 and Figure 4, forest and agricultural land were the two major land use types in Ningbo city in 1990, accounting for 84.48% of the total area. However, the total proportions of forest and agricultural land roughly decreased during the 1990–2016 period and accounted for 73.52% of the total area in 2016. Specifically, forest area continually decreased during the study period, and the proportions decreased from 57.5% in 1990 to 48.9% in 2016. Agricultural land experienced a significant shrinkage during 1990–2005, from 2515.91 km2 in 1990 to 2074.25 km2 in 2005: However, it recovered during 2005–2016 and reached 2289.27 km2 in 2016, which was still 226.64 km2 less than in 1990. Besides the two major land use types, construction land area continually increased, from 531.51 km2 in 1990 to 1543.87 km2 in 2005, and then remained roughly stable during 2005–2016. Since 2005, construction land has been the third-largest land use type, accounting for more than 16% of the total area in Ningbo city. With respect to water bodies and other land use types, the former expanded on a smaller scale (1.6 km2) in the first 10 years of the study period (1990–2000) and then shrunk to 8.66 km2 in 2016, 1.04 km2 less than in 1990. Other land use types roughly expanded during the study period, but only accounted for a small percentage of the total area (less than 1.5%).
Based on the above analyses, a significant difference was observed in land use change before and after 2005 in Ningbo city, as identified in Figure 5. This difference was mainly attributed to changes in construction land, agricultural land, and water bodies. Construction land expanded rapidly before 2005, whereas the annual net changes in construction land were small after 2005 and even became negative during 2005–2010. In comparison, agricultural land continually shrunk during 1990–2005, and then transitioned to expansion after 2005. The annual net change in water bodies was roughly positive during 1990 to 2005: However, it became negative after 2005.

3.3. Major Types of Land Use Transitions

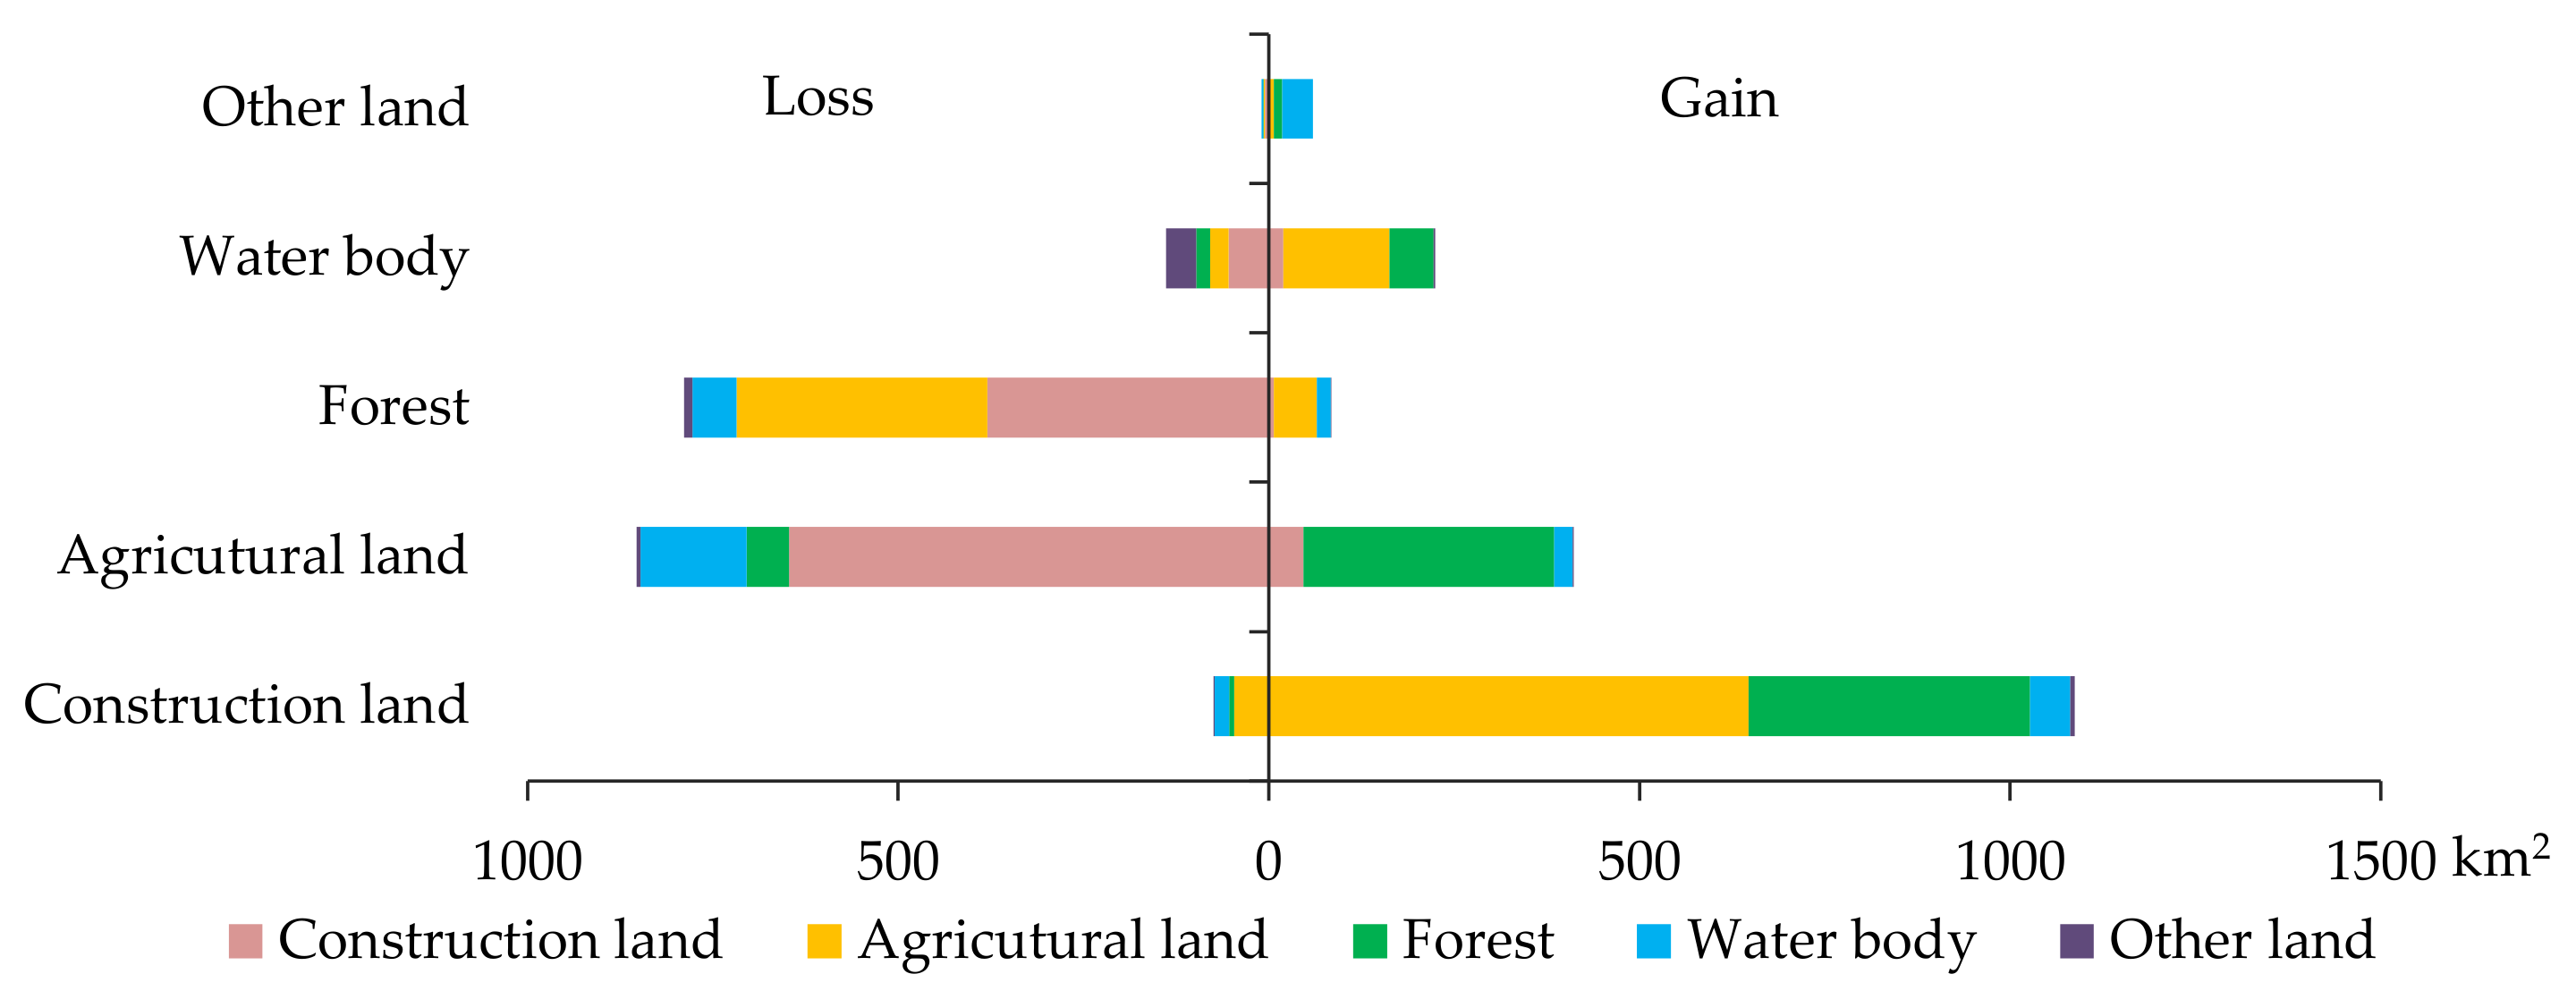
Given the significant difference in land use in Ningbo city before and after 2005, the land use transitions of the two time periods (1990–2005 and 2005–2016) were analyzed using land use transition matrices. During 1990–2005, land use transitions occurred in about 20% of the total area (1865.11 km2) of Ningbo. Land gains were mainly attributed to the expansion of construction land, followed by expansions of agricultural land and water bodies (Figure 6). New construction land was mainly reclaimed from agricultural land and forest, new agricultural land was mainly reclaimed from forest, and new water bodies were mainly reclaimed from agricultural land and forest (Figure 5). Land losses were mainly attributed to decreases in agricultural land and forest (Figure 6). About one-third (33.9%) of agricultural land and about one-seventh (14.7%) of forests were converted to other land use types. Agricultural land converted to construction land occupied 73.9% of the total area experiencing agricultural land loss. In comparison, 48.1% and 42.9% of lost forest was converted to construction land and agricultural land, respectively. Overall, construction land expansion from occupying agricultural land was the major feature of land use change; and transitions from agricultural land to construction land, from forest to construction land, and from forest to agricultural land were three major types of land use changes, accounting for 73.2% (1365.01 km2) of the total changed area during 1990–2005.
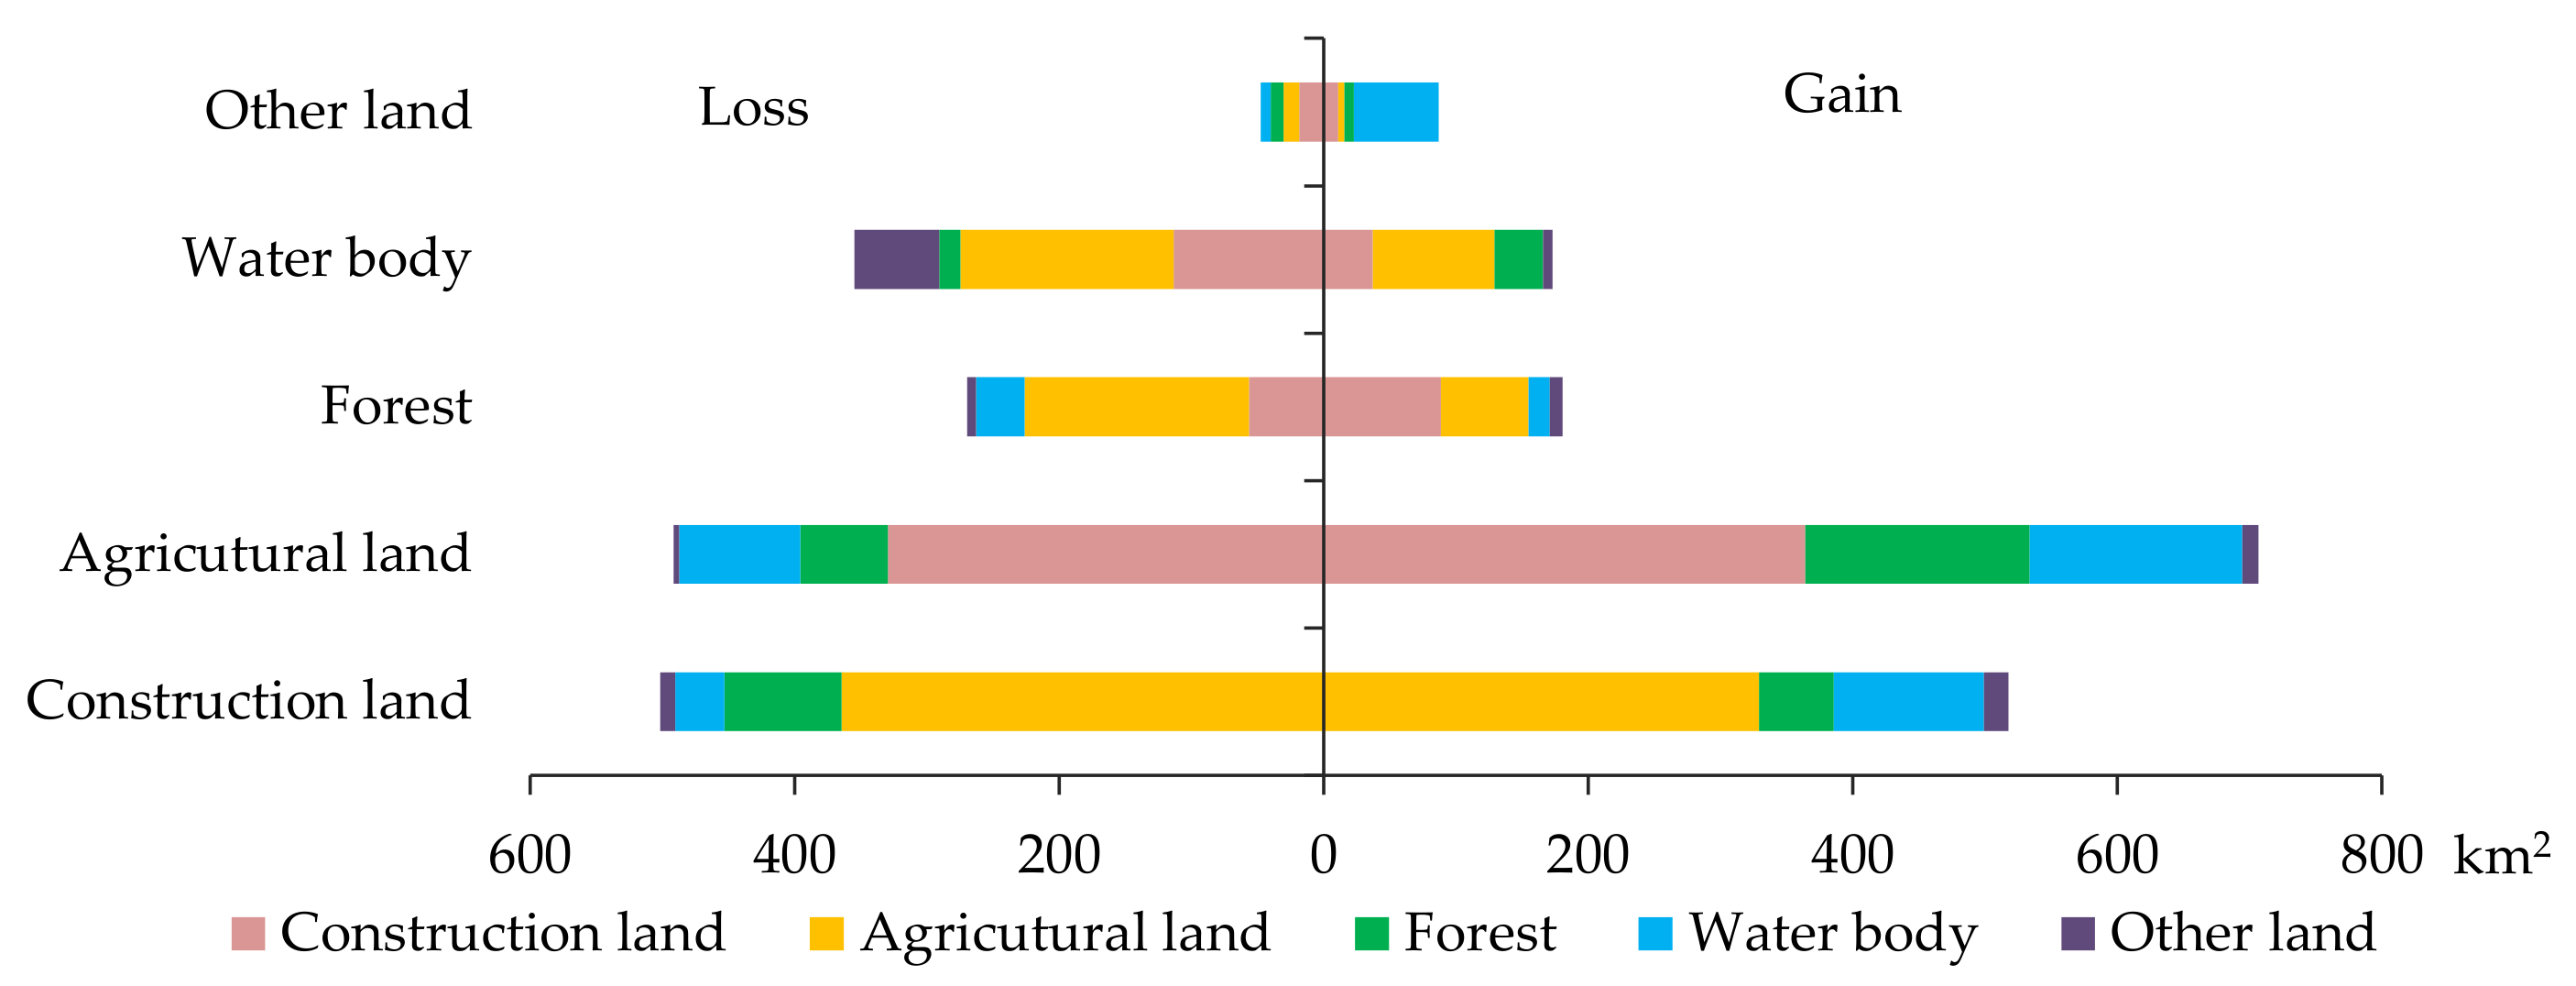
During 2005–2016, the area of transitioned land was 1665.13 km2, accounting for 17.9% of the total area of Ningbo. The main types of land use transition were identified as changes from construction land to agricultural land, from agricultural land to construction land, from forest to agricultural land, and from water bodies to agricultural land, adding up to about two-thirds (61.5%, 1023.84 km2) of the total changed area during this period. Unlike during 1990–2005, agricultural land expansion became a major feature of land use change during 2005–2016 (Figure 7), and construction land was identified as the largest contributor. The area of construction land reclaimed back to agricultural use summed to 364.33 km2, implying that about one-fourth (23.60%) of the construction land in 2005 was converted to agricultural use, which accounted for 51.6% of the total area of gained agricultural land during 2005–2016. Agricultural land was also being converted to construction land, but the area (329.25 km2) was smaller than that being converted from construction land to agricultural land (364.33 km2). Forest became the second-largest contributor to agricultural land expansion, accounting for 24% of the gained agricultural land. Areas experiencing changes from water body to agricultural land increased, accounting for 22.8% of the total area of gained agricultural land.

3.4. Spatial Variations in Major Types of Land Use Transitions by Groups of Spatial Attributes

Spatial variations in the DI values of the major types of land use transitions (Section 3.3) by groups of six spatial attributes (DUC, DCC, DCL, DMR, slope, and elevation) were analyzed for the two time periods 1990–2005 and 2005–2016 (Figure 8 and Figure 9, respectively) to comprehensively understand the spatial characteristics of land use change in Ningbo. Specifically, maps of the main roads at the beginning of the two time periods (1990 and 2005) were applied to determine the distance to road during 1990–2005 and 2005–2016, respectively. In contrast, the other spatial attributes remained unchanged during the study period.
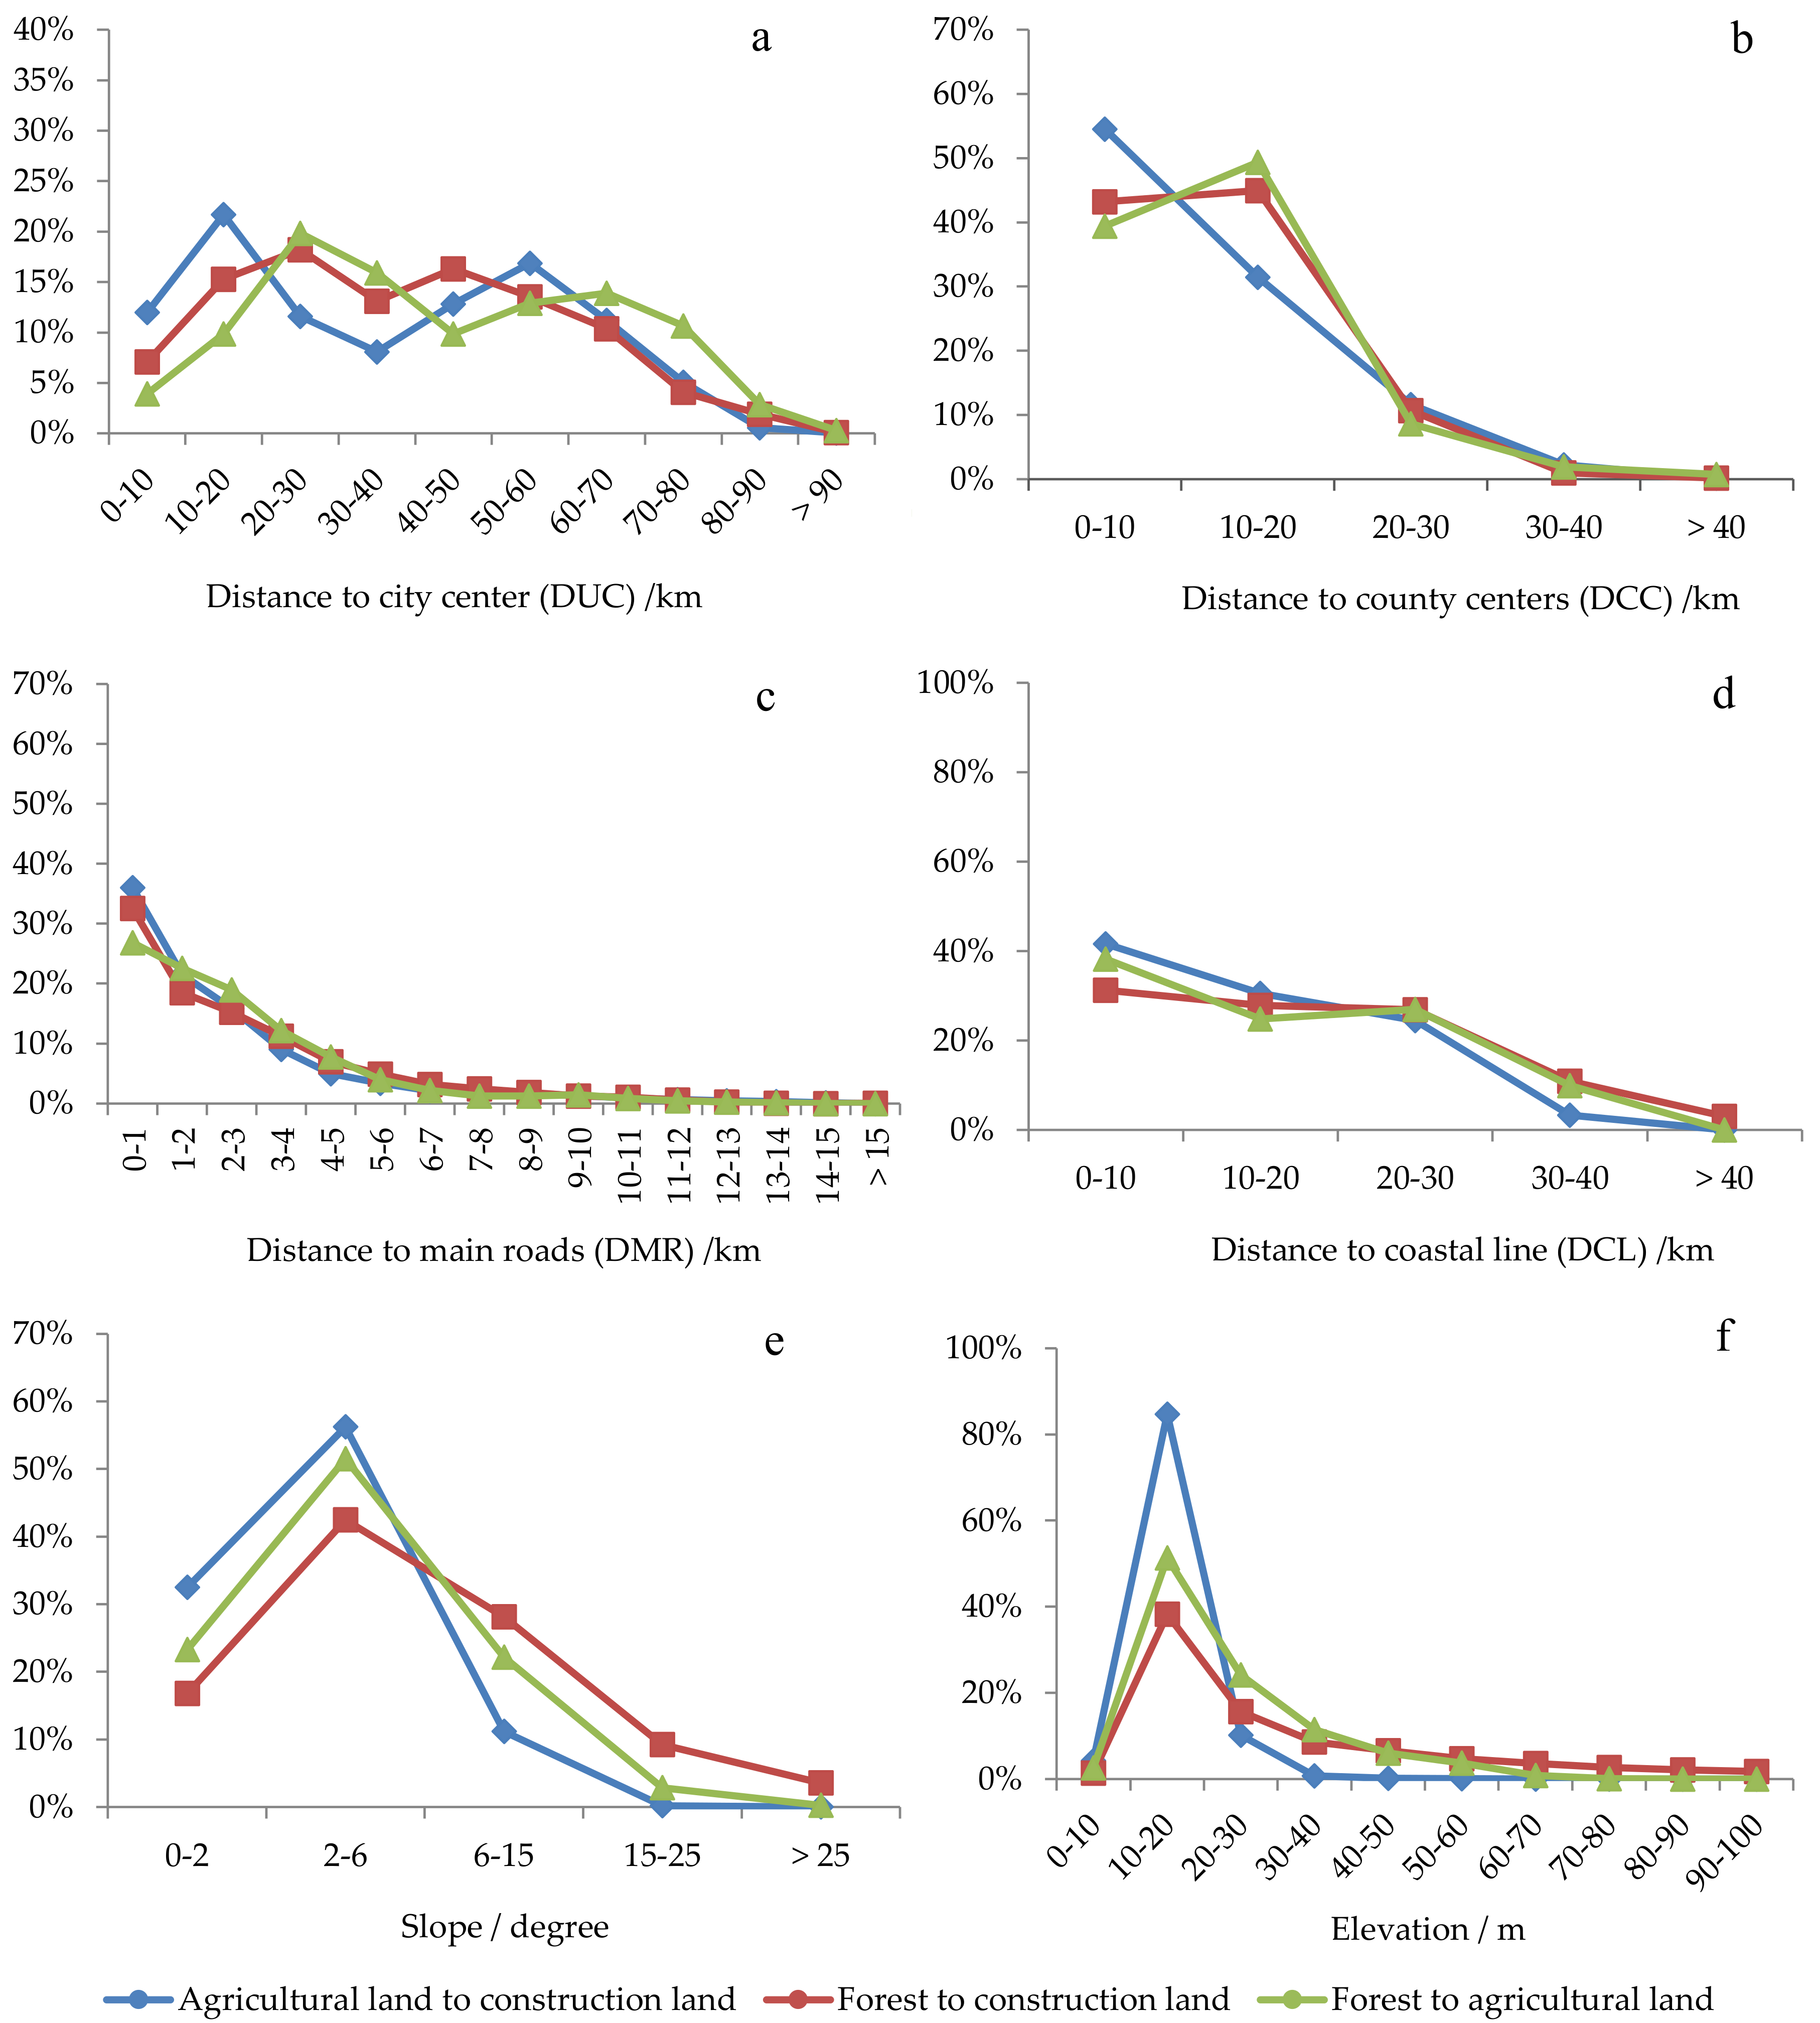
During 1990–2005, the DI values of three major types of land use transitions (i.e., changes from agricultural land to construction land, from forest to construction land, and from forest to agricultural land) showed similar trends to each other in all six spatial attributes (Figure 8). Specifically, they all presented two peaks in different DUC groups (Figure 8a). The first peak in the DI values for the change from agricultural land to construction land appeared with DUC ranging between 10 and 20 km, which could be attributed to the urban sprawl of the municipal city centers. The second peak occurred with DUC ranging between 50 and 60 km, which was mainly a result of development around county centers, such as those in Cixi and Yuyao. This is different from the worldwide ex-urbanization phenomenon, which is largely driven by incoming residents seeking amenities, such as proximity to landscapes with high natural and aesthetic value or privacy [63,64]. The peaks of the DI values for changes from forest to agricultural land appeared with DUC ranging between 20 and 30 km and 60 and 70 km, respectively, both adjacent to the peaks for changes from agricultural land to construction land and representing a supplementation of agricultural land reclaimed from forest. The peaks of the DI values for change from forest to construction land appeared with DUC ranging between 20 and 30 km and 40 and 50 km, showing that forests both around the municipal city centers and around the county centers were experiencing urban expansion in Ningbo city.
With respect to DCC, negative correlations between the DI values for the three major types of land use transitions and DCC were identified (Figure 8b). The three major types of land use transitions aggregated within 20 km of the county centers, and their proportions all totaled about 80%. Similarly, the DI values of the three major types of land use transitions showed continuously decreasing trends with increasing DMR and DCL (Figure 8c,d), indicating that land use types closer to main roads or to the coastline were more likely to suffer from land use transitions. In terms of slope and elevation, peak values of the DI values for the three major types of land use transitions both appeared in the second spatial groups and decreased sharply in the following groups (Figure 8e,f): Land use transitions mainly occurred in areas with slopes ranging between 2 and 6° or elevations ranging between 10 and 20 m in Ningbo city during 1990–2005.
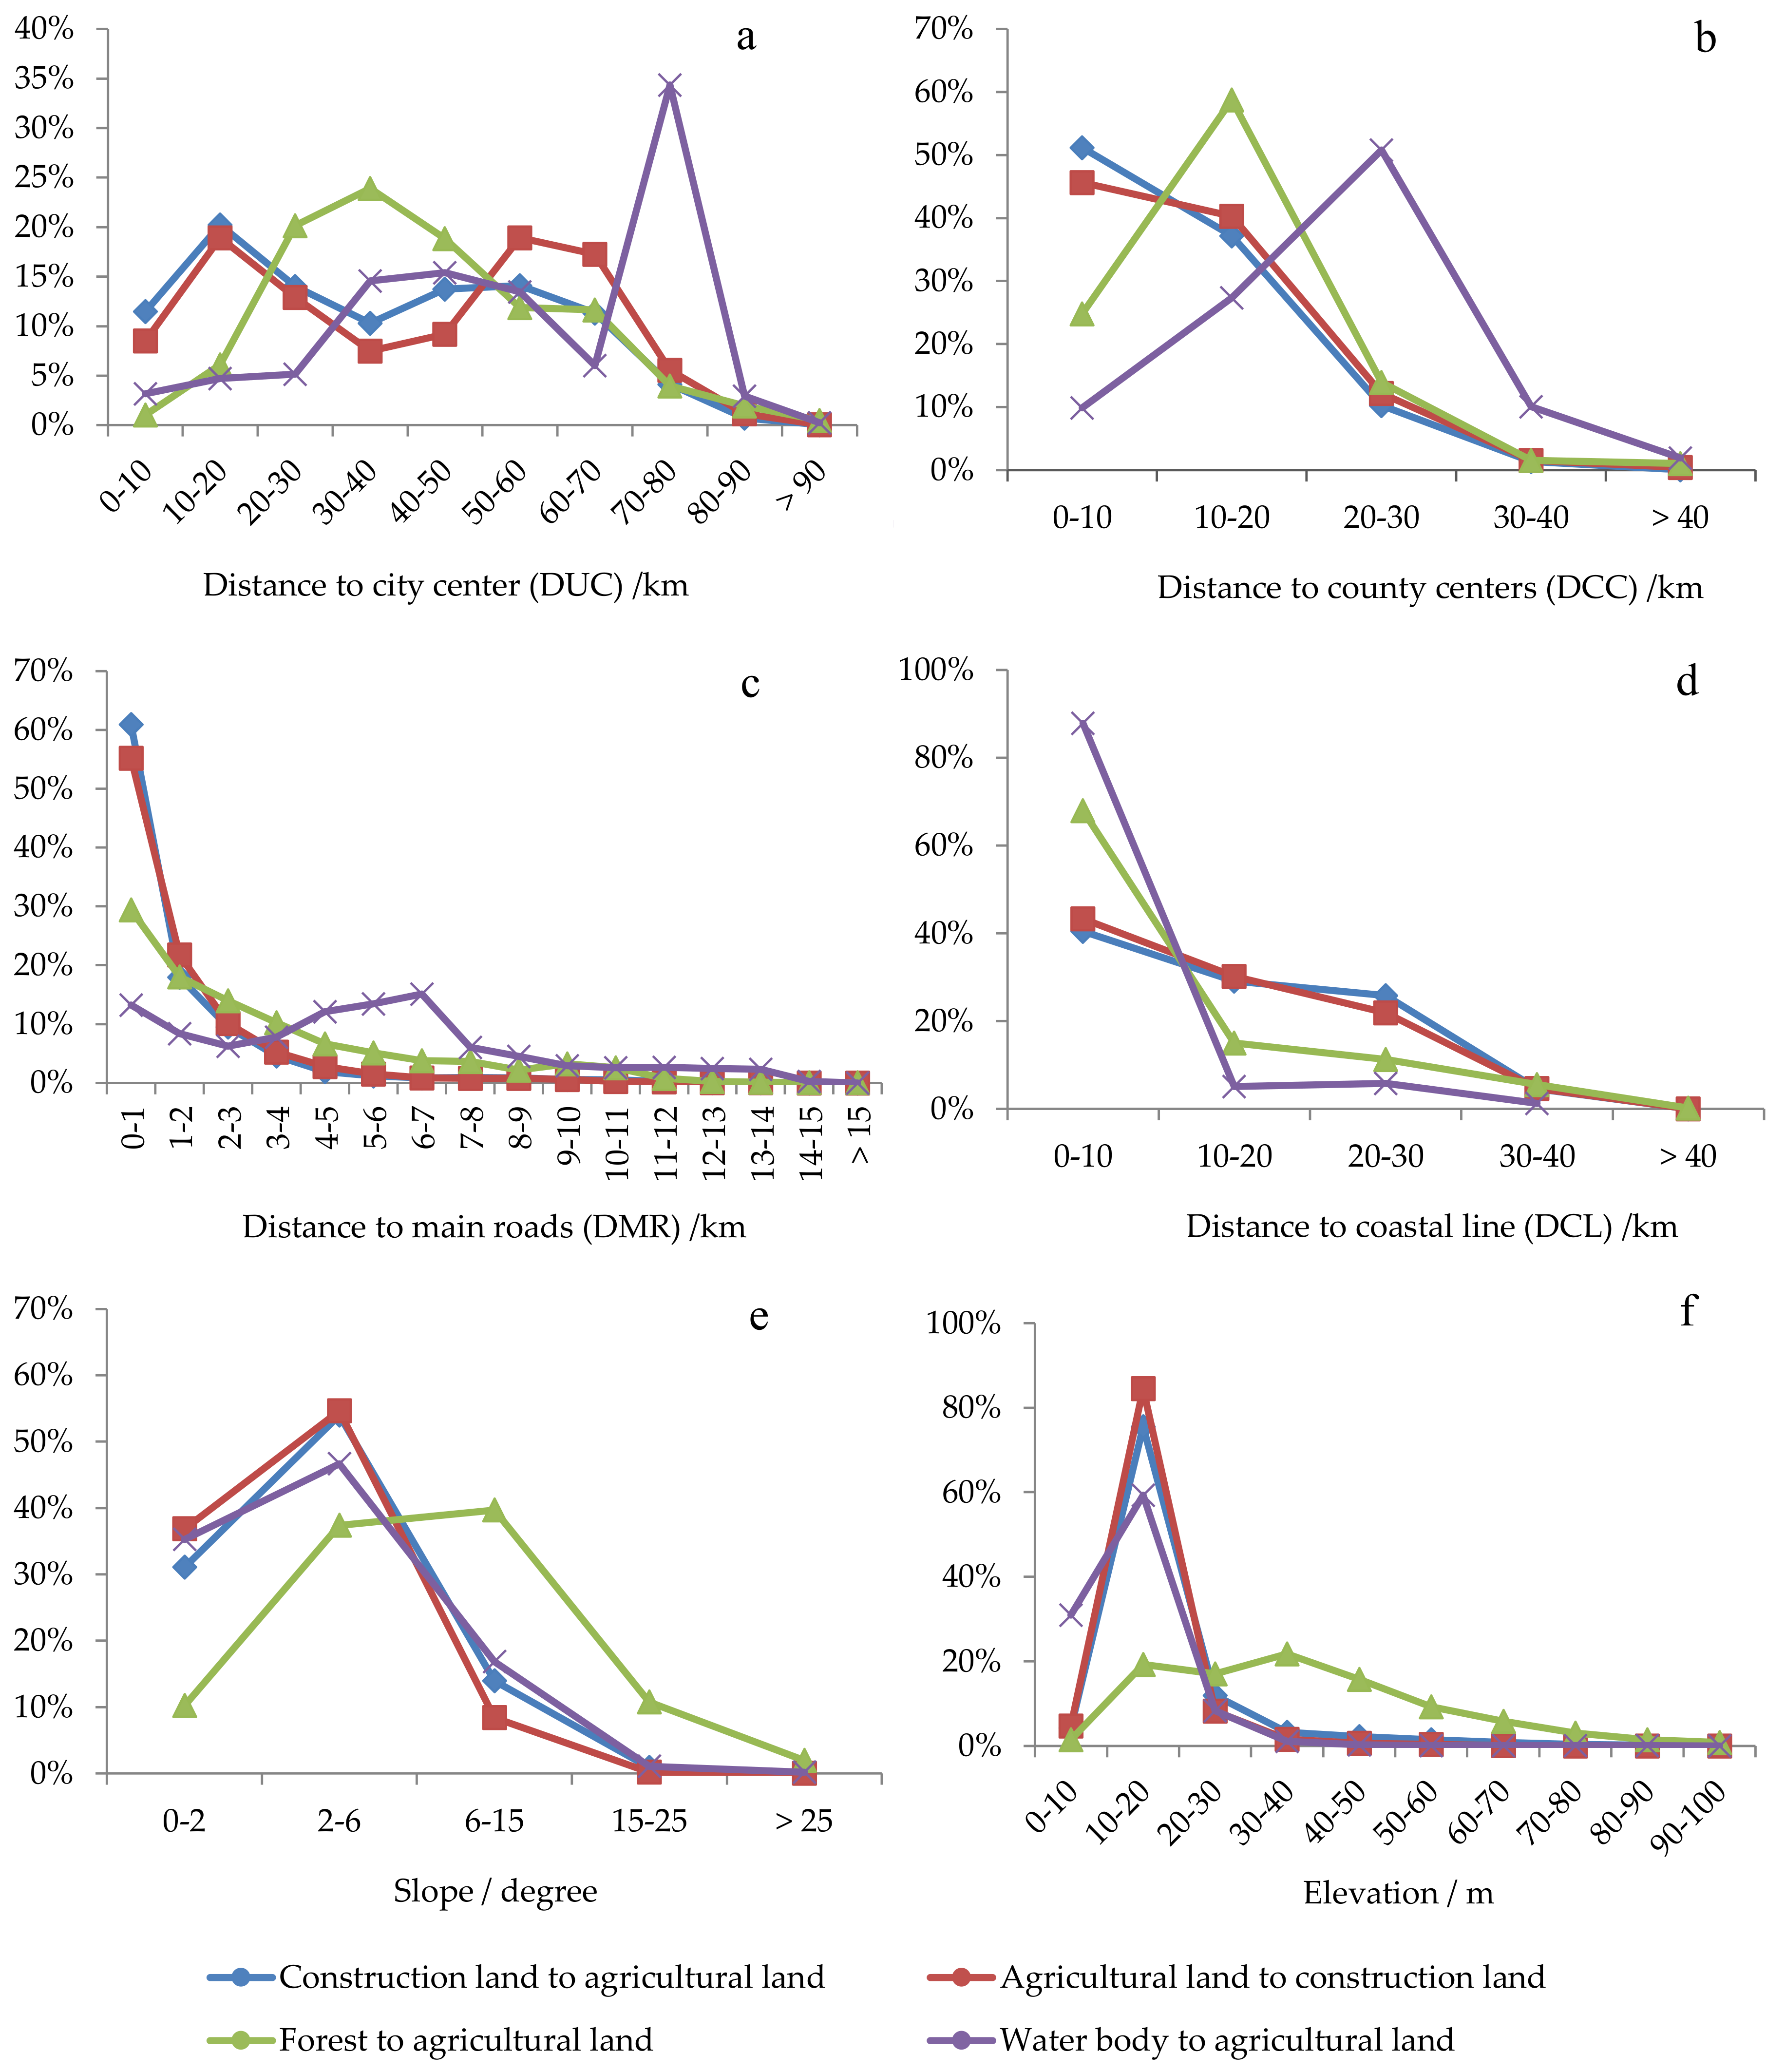
During 2005–2016, changes from construction land to agricultural land, from agricultural land to construction land, from forest to agricultural land, and from water body to agricultural land were observed, four major types of land use transition. Spatial variations in the DI values for the above four major types of land use transition are shown in Figure 9. The DI values for changes from construction land to agricultural land and from agricultural land to construction land showed similar patterns by different spatial attributes (Figure 9a–f). Larger DI values for the two changes were concentrated with DUC ranging between 10 and 20 km and 50 and 60 km, respectively, with slopes less than 6° and with elevations ranging between 10 and 20 m, whereas DI values were negatively correlated with DCC, DMR, and DCL. These indicated that occupation of agricultural land for nonagricultural use and construction land reclamation concurrently occurred adjacent to each other. In terms of change from forest to agricultural land, the DI values showed one peak at a DUC ranging from 30 to 40 km, which was longer than the first peak during 1990–2005, indicating that forest degradation had extended to more peripheral areas of the municipal city centers, which corresponded with the more peripheral areas of the county centers of Cixi and Yuyao (Figure 3a). This land use transition type was more concentrated with DCC ranging between 10 and 20 km and with DCL less than 10 km, similarly to 1990–2005. There was a tendency for people to move to hilly areas with larger slopes and higher elevations, as the largest DI values transitioned to slopes ranging between 6 and 15° and to elevations ranging between 30 and 40 m during 2005–2016 (Figure 9e–f). Water body became a new major source of agricultural land during this time period. According to the spatial distributions of the DI values, change from water body to agricultural land was mainly concentrated in areas near the coastline, near main roads, with a slope less than 6° or an elevation lower than 20 m, and located far away from municipal city centers (70–80 km) and county centers (20–30 km).
Overall, the rapid expansion of construction land by occupying agricultural land during 1990–2005 reached a dynamic equilibrium during 2005–2016, which was represented by similar amounts of conversions between construction land and agricultural land in identical spatial attribute groups in the latter period. The above analyses also indicated that during the study period, human influences (represented by the change from forest to agricultural land) were moving outward, expanding to the more peripheral areas of Ningbo’s municipal city/county centers, to coastal areas, and to hilly areas with steeper slopes and higher elevations, in particular along the main roads. Changes in water bodies, e.g., sea reclamation, were also a striking feature of land use change during 2005–2016.

4. Discussion

4.1. Driving Forces of Land Use Change in Ningbo City

The expansion of construction land proved to be a persistent land use change trajectory in both of the stages. Its driving forces could be mainly attributed to economic development in China characterized by three major compositions: Marketization, globalization, and decentralization [65,66]. The influences of marketization can be summarized into two aspects. First, the establishment of a market-oriented economy stimulated the development of private enterprises and attracted mass population congregations, which increased the demand for construction land for offices, factories, and residential areas in Ningbo. Second, the establishment and development of the land market increased land supply, which dramatically promoted urban expansion and related land use changes. The influences of globalization could be mainly attributed to the competition for foreign direct investment, mainly through the establishment of development zones, which contributed to the expansion of construction land. In terms of decentralization, a primary responsibility was generated for local government to promote economic development and employment. To secure extrabudgetary revenues and to provide promotion opportunities, local officials had strong incentives to lease most of the land for industrial, residential, and commercial purposes [67,68]. These factors contributed to the expansion of construction land in Chinese cities in general, and Ningbo was not an exception.
Agricultural land transitioned from a net decrease during 1990–2005 to a net increase during 2005–2016 in Ningbo city. The decrease in agricultural land could be attributed to the expansion of construction land, whereas construction land was identified as the largest contributor to the increase in agricultural land. With the ongoing increase in GDP and in the population in Ningbo during 1999–2016, agricultural land expansion could mainly be explained by the enhancement of an agricultural land protection policy in 2004. Specifically, agricultural land protection in China was first documented as a basic state policy by the Central Committee of the Communist Party of China (CPC) in 1986 [69]. However, the policy did not effectively protect agricultural land, whose area continued to decrease across China during 1998–2003. In response, strict agricultural land protection measures were proposed in the Central Committee’s No. 1 Document in 2004, particularly for prime agricultural land protection. Rules regarding agricultural taxes and land premiums, which benefited agricultural land protection, were introduced, “Maintaining 120 million ha of Farmland” was implemented [70,71], and agricultural land protection was given unprecedented attention [27], which contributed to the transition of agricultural land and to controlling the expansion of construction land in Ningbo city. The forest was another major contributor to agricultural land expansion. The requirement of a one-to-one replacement of agricultural land, regulated by the strict agricultural land protection policies, mandatorily resulted in the transformation of forest to agricultural land in Ningbo city, even in hilly areas with steeper slopes and higher elevations. This phenomenon was common in most Chinese cities [27]. In addition to construction land and forest, water bodies became a third contributor to agricultural land expansion in Ningbo during 2005–2016, mainly due to sea reclamation, which was originally encouraged by the local government in Ningbo city, especially after 2004 [72,73].
Additionally, we examined why water bodies first expanded during 1990–2000 and then shrunk during 2000–2016. The expansion was caused by two factors: (1) The construction or expansion of reservoirs when the Lianghui, Sizaopu, and Yangmeiling reservoirs were constructed, and the Siminghu and Meixi reservoirs were expanded; (2) the expansion of existing water bodies, such as rivers, lakes, and sea areas (mainly from agricultural land), which were mainly used for aquaculture [46]. In comparison, the shrinking of water bodies was mainly caused by sea reclamation, which was encouraged by central and local governments in China as a major source of supplementation of agricultural land and construction land in coastal cities [74].
Roughly negative correlations were found between the DI values of the major types of land use transition and two spatial attributes, DCC and DMR. Therefore, these two attributes could be regarded as factors influencing land use change. Specifically, the closer a given land use type was to a county center or to a main road, the more likely it was to undergo land use change. Notably, expansions of main roads occurred during 1990–2005, but we could not reveal the impacts of changing road networks on land use change in Ningbo city as it was beyond the scope of this study, but this could be analyzed in detail in further studies using proper econometric models. Land use change could also be affected by topographical attributes mainly concentrated in areas with slopes ranging between 2 and 6° and elevations ranging between 10 and 20 m. Considering the influences of DUC, the radiation ranges of the municipal city center of Ningbo on land use changes increased as the major types of land use transition moved outward from the municipal city center during 2005–2016.

4.2. Policy Implications for Spatial Regulations in Ningbo City

This study on land use change and its relations to natural and socioecological factors in Ningbo city is meaningful, not only for providing more accurate identifications of land use changes and their major trajectories in coastal cities, but also for providing policy suggestions for local spatial regulations, which can be applied as practical measures for sustainable development, especially for integrated water and flooding management in coastal cities [14,18].
Construction land expansion replaces vegetated soils with impermeable surfaces, which usually results in hydrological alternations, and finally leads to more severe water shortages and increases flood risks in coastal cities [14]. The persistent occupation of agricultural land and forest by construction land in Ningbo city implies that this city may have suffered an increased risk of flooding in the case of extreme weather during the study period. The good news is that during 2005–2016, a large amount of construction land was reclaimed back to agricultural land concurrently with the occupation of agricultural land by construction land, and agricultural land experienced a net increase overall. However, the newly gained agricultural land plots from construction land reclamation were usually small in size and distributed discretely: They were at considerable risk of being reconverted to non-agricultural use or being abandoned [46,75]. As prime agricultural land can be strictly protected by agricultural land protection policies, the identification of reclaimed construction land as prime agricultural land is suggested as one of the key issues in spatial regulation when aiming to guarantee the agricultural use of reclaimed construction land. The government should also accelerate the drawing of the redline of urban sprawl—the urban growth boundary—and control the occupation of agricultural land and forest by construction land outside the line [76]. This, together with the construction and improvement of urban storm drainage systems, can contribute to the integrated and sustainable management of water and a reduction in flood risk in Ningbo city. Improvements in construction land use efficiency should be highlighted in spatial regulations for promoting the sustainable use of construction land, with a concern for strict agricultural land protection policies that provide less space for construction land expansion [77].
Besides construction land, there were two other major sources for newly gained agricultural land: Forests and water bodies. Change from forest to agricultural land was identified as a major land use transition type, both during 1990–2005 and 2005–2016, and it mainly occurred in low-hilly regions with slopes ranging between 2 and 6° and elevations ranging between 10 and 20 m. With forest degradation in low-hilly areas, agricultural land reclaimed from forest tended to move up to hilly areas with steeper slopes (6–15°) and higher elevations (30–40 m). However, the transition of agricultural land from plain regions with good land quality to hilly regions with poor land quality could decrease local land productivity and negatively affect food security [46]. Therefore, more attention should be paid to the protection and improvement of agricultural land quality. There are a series of ecological and environmental problems accompanying forest degradation that should not be neglected. Specifically, forest degradation, especially its major representation, soil erosion, can affect the landscape’s ecological stability and increase ecological risk [78]. Forest degradation can also increase surface runoff and decrease groundwater recharge, which finally results in water shortages and increased flood risk and flood severity in coastal regions [79,80]. Besides, a loss of biodiversity is an inevitable consequence of forest degradation and its accompanying agricultural intensification [81,82]. In this context, forest degradation in coastal hilly areas should be strictly controlled through spatial regulations. A delimitation of an ecological redline can act as a powerful tool that should be implemented, and relevant forest areas should be protected rigorously from deforestation [83].
Water body was another source of agricultural land expansion, and the change from water body to agricultural land was mainly concentrated along coastal areas as a result of sea reclamation. Sea reclamation is common for most coastal cities [84], and agricultural land reclaimed from the sea, such as that reclaimed from lakes, usually manifests as large plain areas, which are beneficial for scale farming [85]. However, reclamation can result in an increase in salinity due to impeded runoff [86] and in a deterioration of the marine ecological environment (such as with water pollution and a decline in sea life) [87,88]. Coastal cities with sea reclamation usually face potential disaster risks related to coastal flooding under future climate change conditions [74]. As a result, sea reclamation was restrained by the Chinese central government in 2018, and it is forbidden to reclaim any more agricultural land from the sea [89]. Given this context, more attention should be paid in spatial regulations to existing reclaimed agricultural land, and specific measures, including monitoring soil pH changes, planting salt-tolerant crops, and constructing drainage systems, are suggested not only to guarantee land quality, but also to facilitate flood discharge. The reconstruction of coastal marsh ecosystems, such as planting mangroves, is also recommended, as it is beneficial for the conservation of fresh water and the mitigation of coastal disasters [13,90].

5. Conclusions

In this study, an integrated approach incorporating GIS, remote sensing images, RF classification, LUTM, and DI values was applied to analyze the features of land use change and the spatial variations in the major types of land use transitions by groups of spatial attributes in Chinese coastal cities during the rapid urbanization period of 1990–2016, taking Ningbo city as an example. Land use change in Ningbo could be characterized by a rough expansion of construction land, a transition from a decrease to an increase in agricultural land, and a rough decrease in forest area during the study period. The study period was divided into two stages, considering the different changing trajectories and different major types of land use transition in Ningbo city. The first stage (1990–2005) was mainly characterized by the expansion of construction land through occupying agricultural land and forest, while the second stage (2005–2016) was mainly characterized by the expansion of construction land through the occupation of agricultural land and the simultaneous expansion of agricultural land reclaimed from construction land, forests, and water bodies. The spatial variations in major types of land use transitions on the basis of spatial attributes indicated that during the study period, the major occurrences of land use transition were mainly located near county centers adjacent to main roads and the coastline and in areas with slopes ranging between 2 and 6° or elevations ranging between 10 and 20 m. We also found differences between the two stages: The rapid expansion of construction land during 1990–2005 changed to a dynamic equilibrium represented by similar amounts of conversions between construction land and agricultural land during 2005–2016; transitions from forest to agricultural land tended to occur in areas with larger slopes (6–15°) or higher elevations (20–40 m), moreso during 2005–2016 than during 1990–2005; and a large amount of agricultural land was reclaimed from the sea, which was a new feature of land use change during 2005–2016.
Although rapid construction land expansion has been controlled and agricultural land has been effectively protected, other land use issues, such as reconversion and abandonment of reclaimed construction land, degradation of coastal agricultural land, and forest degradation in hilly areas, should be focused on in Ningbo city. Thus, we provided policy suggestions on spatial regulations, including the protection of reclaimed agricultural land, an improvement in the efficiency of construction land, and control of forest conversion in hilly areas, which would be beneficial for sustainable development and especially water and flood management, not just in Ningbo but also in other coastal cities experiencing similar processes of urbanization and land use change.

Author Contributions

Conceptualization, C.Z., S.Z., X.W., L.S., L.L., and Y.L.; formal analysis, C.Z. and S.Z.; writing—original draft preparation, C.Z.; writing—review and editing, S.Z., X.W., L.S., L.L., and Y.L.

Funding

This research was funded by the Strategic Priority Research Program of the Chinese Academy of Sciences, Grant No. XDA19040102; the National Key Research and Development Program of China, Grant No. 2016YFA0602802; the National Natural Science Foundation of China (41771566); and the Ningbo government project “Territorial Planning of Ningbo City (2016–2030)”.

Acknowledgments

This work was jointly supported by the Key Laboratory of Carrying Capacity Assessment for Resource and Environment, the Ministry of Natural Resources (Chinese Academy of Natural Resource Economics, China University of Geosciences Beijing, Institute of Geographic Sciences and Natural Resources Research, CAS). We would like to thank Professor Aymen Elshkaki and Associate Professor Peng Li, who work in the Institute of Geographic Sciences and Natural Resources Research, for many accurate and constructive suggestions to improve this study.

Conflicts of Interest

The authors declare no conflicts of interest.

References

  1. Lambin, E.F.; Turner, B.L.; Geist, H.J.; Agbola, S.B.; Angelsen, A.; Bruce, J.W.; Coomes, O.T.; Dirzo, R.; Fischer, G.; Folke, C.; et al. The causes of land-use and land-cover change: Moving beyond the myths. Glob. Environ. Chang. Hum. Policy Dimens. 2001, 11, 261–269. [Google Scholar] [CrossRef]
  2. Hu, Y. An Analysis of Land-Use and Land-Cover Change in the Zhujiang–Xijiang Economic Belt, China, from 1990 to 2017. Appl. Sci. 2018, 8, 1524. [Google Scholar] [CrossRef]
  3. Song, W.; Pijanowski, B.C.; Tayyebi, A. Urban expansion and its consumption of high-quality farmland in Beijing, China. Ecol. Indic. 2015, 54, 60–70. [Google Scholar] [CrossRef] [Green Version]
  4. Carvalho, T.S.; Domingues, E.P.; Horridge, J.M. Controlling deforestation in the Brazilian Amazon: Regional economic impacts and land-use change. Land Use Policy 2017, 64, 327–341. [Google Scholar] [CrossRef]
  5. Hernández, Á.; Arellano, E.C.; Morales-Moraga, D.; Miranda, M.D. Understanding the effect of three decades of land use change on soil quality and biomass productivity in a Mediterranean landscape in Chile. Catena 2016, 140, 195–204. [Google Scholar] [CrossRef]
  6. Habermann, M.; Billger, M.; Haeger-Eugensson, M. Land use Regression as Method to Model Air Pollution. Previous Results for Gothenburg/Sweden. Procedia Eng. 2015, 115, 21–28. [Google Scholar] [CrossRef] [Green Version]
  7. Liu, J.; Liu, M.; Deng, X.; Zhuang, D.; Zhang, Z.; Luo, D. The land use and land cover change database and its relative studies in China. J. Geogr. Sci. 2002, 12, 275–282. [Google Scholar]
  8. Haney, N.; Cohen, S. Predicting 21st century global agricultural land use with a spatially and temporally explicit regression-based model. Appl. Geogr. 2015, 62, 366–376. [Google Scholar] [CrossRef]
  9. van Vliet, J.; de Groot, H.L.F.; Rietveld, P.; Verburg, P.H. Manifestations and underlying drivers of agricultural land use change in Europe. Landsc. Urban Plan. 2015, 133, 24–36. [Google Scholar] [CrossRef]
  10. van Vliet, J.; Eitelberg, D.A.; Verburg, P.H. A global analysis of land take in cropland areas and production displacement from urbanization. Glob. Environ. Chang. 2017, 43, 107–115. [Google Scholar] [CrossRef]
  11. Pazur, R.; Lieskovsky, J.; Feranec, J.; Otahel, J. Spatial determinants of abandonment of large-scale arable lands and managed grasslands in Slovakia during the periods of post-socialist transition and European Union accession. Appl. Geogr. 2014, 54, 118–128. [Google Scholar] [CrossRef]
  12. Bento-Gonçalves, A.; Vieira, A.; da Vinha, L.; Hamada, S. Changes in mainland Portuguese forest areas since the last decade of the XXth century. Méditerranée 2018, 2018. [Google Scholar] [CrossRef]
  13. Huang, Y.; Zhang, T.; Wu, W.; Zhou, Y.; Tian, B. Rapid risk assessment of wetland degradation and loss in low-lying coastal zone of Shanghai, China. Hum. Ecol. Risk Assess. Int. J. 2016, 23, 82–97. [Google Scholar] [CrossRef]
  14. Wheater, H.; Evans, E. Land use, water management and future flood risk. Land Use Policy 2009, 26, S251–S264. [Google Scholar] [CrossRef]
  15. Muis, S.; Lin, N.; Verlaan, M.; Winsemius, H.C.; Ward, P.J.; Aerts, J. Spatiotemporal patterns of extreme sea levels along the western North-Atlantic coasts. Sci. Rep. 2019, 9, 3391. [Google Scholar] [CrossRef]
  16. Sado-Inamura, Y.; Fukushi, K. Empirical analysis of flood risk perception using historical data in Tokyo. Land Use Policy 2019, 82, 13–29. [Google Scholar] [CrossRef]
  17. Kalantari, Z.; Briel, A.; Lyon, S.W.; Olofsson, B.; Folkeson, L. On the utilization of hydrological modelling for road drainage design under climate and land use change. Sci. Total Environ. 2014, 475, 97–103. [Google Scholar] [CrossRef]
  18. Pan, H.; Deal, B.; Destouni, G.; Zhang, Y.; Kalantari, Z. Sociohydrology modeling for complex urban environments in support of integrated land and water resource management practices. Land Degrad. Dev. 2018, 29, 3639–3652. [Google Scholar] [CrossRef]
  19. Yao, H. Characterizing landuse changes in 1990–2010 in the coastal zone of Nantong, Jiangsu province, China. Ocean Coast. Manag. 2013, 71, 108–115. [Google Scholar] [CrossRef]
  20. Ning, J.; Liu, J.; Kuang, W.; Xu, X.; Zhang, S.; Yan, C.; Li, R.; Wu, S.; Hu, Y.; Du, G.; et al. Spatiotemporal patterns and characteristics of land-use change in China during 2010–2015. J. Geogr. Sci. 2018, 28, 547–562. [Google Scholar] [CrossRef]
  21. Guo, L.; Wang, D.; Qiu, J.; Wang, L.; Liu, Y. Spatio-temporal patterns of land use change along the Bohai Rim in China during 1985–2005. J. Geogr. Sci. 2009, 19, 568–576. [Google Scholar] [CrossRef]
  22. Yu, W.J.; Zhou, W.Q. The Spatiotemporal Pattern of Urban Expansion in China: A Comparison Study of Three Urban Megaregions. Remote Sens. 2017, 9, 45. [Google Scholar] [CrossRef]
  23. Gumma, M.; Mohammad, I.; Nedumaran, S.; Whitbread, A.; Lagerkvist, C. Urban Sprawl and Adverse Impacts on Agricultural Land: A Case Study on Hyderabad, India. Remote Sens. 2017, 9, 1136. [Google Scholar] [CrossRef]
  24. Xu, M.; He, C.Y.; Liu, Z.F.; Dou, Y.Y. How Did Urban Land Expand in China between 1992 and 2015? A Multi-Scale Landscape Analysis. PLoS ONE 2016, 11, 1136. [Google Scholar] [CrossRef]
  25. Wang, J.; Chen, Y.; Shao, X.; Zhang, Y.; Cao, Y. Land-use changes and policy dimension driving forces in China: Present, trend and future. Land Use Policy 2012, 29, 737–749. [Google Scholar] [CrossRef]
  26. Liu, Y.; Fang, F.; Li, Y. Key issues of land use in China and implications for policy making. Land Use Policy 2014, 40, 6–12. [Google Scholar] [CrossRef]
  27. Cheng, L.; Jiang, P.; Chen, W.; Li, M.; Wang, L.; Gong, Y.; Pian, Y.; Xia, N.; Duan, Y.; Huang, Q. Farmland protection policies and rapid urbanization in China: A case study for Changzhou City. Land Use Policy 2015, 48, 552–566. [Google Scholar]
  28. Zhong, T.; Huang, X.; Zhang, X.; Scott, S.; Wang, K. The effects of basic arable land protection planning in Fuyang County, Zhejiang Province, China. Appl. Geogr. 2012, 35, 422–438. [Google Scholar] [CrossRef]
  29. The State Council of the People’s Republic of China. Outline of National Land Planning (2016–2030). 2017. Available online: http://www.gov.cn/zhengce/content/2017-02/04/content_5165309.htm (accessed on 15 December 2018).
  30. The General Office of State Council. Provincial Space Planning Pilot Program. 2017. Available online: http://www.gov.cn/zhengce/2017-01/09/content_5158211.htm (accessed on 15 December 2018).
  31. Zhang, C.; Miao, C.; Zhang, W.; Chen, X. Spatiotemporal patterns of urban sprawl and its relationship with economic development in China during 1990–2010. Habitat Int. 2018, 79, 51–60. [Google Scholar] [CrossRef]
  32. Li, X.; Zhang, L.; Liang, C. A GIS-based buffer gradient analysis on spatiotemporal dynamics of urban expansion in Shanghai and its major satellite cities. Procedia Environ. Sci. 2010, 2, 1139–1156. [Google Scholar] [CrossRef] [Green Version]
  33. Sun, C.; Wu, Z.-f.; Lv, Z.-q.; Yao, N.; Wei, J.-b. Quantifying different types of urban growth and the change dynamic in Guangzhou using multi-temporal remote sensing data. Int. J. Appl. Earth Obs. Geoinf. 2013, 21, 409–417. [Google Scholar] [CrossRef] [Green Version]
  34. Chen, J.F.; Chang, K.T.; Karacsonyi, D.; Zhang, X.L. Comparing urban land expansion and its driving factors in Shenzhen and Dongguan, China. Habitat Int. 2014, 43, 61–71. [Google Scholar] [CrossRef]
  35. Dou, P.; Chen, Y.B. Dynamic monitoring of land-use/land-cover change and urban expansion in Shenzhen using Landsat imagery from 1988 to 2015. Int. J. Remote Sens. 2017, 38, 5388–5407. [Google Scholar] [CrossRef]
  36. Xu, J.; Zhao, Y.; Zhong, K.; Zhang, F.; Liu, X.; Sun, C. Measuring spatio-temporal dynamics of impervious surface in Guangzhou, China, from 1988 to 2015, using time-series Landsat imagery. Sci. Total Environ. 2018, 627, 264–281. [Google Scholar] [CrossRef]
  37. You, H. Agricultural landscape dynamics in response to economic transition: Comparisons between different spatial planning zones in Ningbo region, China. Land Use Policy 2017, 61, 316–328. [Google Scholar] [CrossRef]
  38. Kantakumar, L.N.; Kumar, S.; Schneider, K. Spatiotemporal urban expansion in Pune metropolis, India using remote sensing. Habitat Int. 2016, 51, 11–22. [Google Scholar] [CrossRef]
  39. Wu, W.; Zucca, C.; Karam, F.; Liu, G. Enhancing the performance of regional land cover mapping. Int. J. Appl. Earth Obs. Geoinf. 2016, 52, 422–432. [Google Scholar] [CrossRef]
  40. Rodriguez-Galiano, V.F.; Chica-Rivas, M. Evaluation of different machine learning methods for land cover mapping of a Mediterranean area using multi-seasonal Landsat images and Digital Terrain Models. Int. J. Digit. Earth 2012, 7, 492–509. [Google Scholar] [CrossRef]
  41. Rodriguez-Galiano, V.F.; Ghimire, B.; Rogan, J.; Chica-Olmo, M.; Rigol-Sanchez, J.P. An assessment of the effectiveness of a random forest classifier for land-cover classification. Isprs J. Photogramm. Remote Sens. 2012, 67, 93–104. [Google Scholar] [CrossRef]
  42. Cracknell, M.J.; Reading, A.M. Geological mapping using remote sensing data: A comparison of five machine learning algorithms, their response to variations in the spatial distribution of training data and the use of explicit spatial information. Comput. Geosci. 2014, 63, 22–33. [Google Scholar] [CrossRef] [Green Version]
  43. Tang, Y.T.; Chan, F.K.S.; Griffiths, J. City profile: Ningbo. Cities 2015, 42, 97–108. [Google Scholar] [CrossRef] [Green Version]
  44. Bureau of Statistics of Ningbo City, Ningbo Investigation Team of National Bureau of Statistics. Statistical Yearbook of Ningbo City; China Statistics Press: Ningbo, China, 2018. Available online: http://vod.ningbo.gov.cn:88/nbtjj/tjnj/2017nbnj/indexch.htm (accessed on 13 December 2018).
  45. Wikipedia, Port of Ningbo-Zhoushan. 2019. Available online: https://en.wikipedia.org/wiki/Port_of_Ningbo-Zhoushan (accessed on 21 January 2019).
  46. Li, J.; Zhang, Z.; Ma, L.; Gu, Q.; Wang, K.; Xu, Z. Assessment on the impact of arable land protection policies in a rapidly developing region. ISPRS Int. J. Geo-Inf. 2016, 5, 69. [Google Scholar] [CrossRef]
  47. Municipal Bureau of Land Resources of Ningbo. General Plan of Land Use of Ningbo City (2006–2020). 2017. Available online: http://www.nblr.gov.cn/art/2018/6/25/art_17253_2961390.html (accessed on 27 March 2018).
  48. Waske, B.; van der Linden, S.; Oldenburg, C.; Jakimow, B.; Rabe, A.; Hostert, P. imageRF—A user-oriented implementation for remote sensing image analysis with Random Forests. Environ. Model. Softw. 2012, 35, 192–193. [Google Scholar] [CrossRef]
  49. Belgiu, M.; Drăguţ, L. Random forest in remote sensing: A review of applications and future directions. ISPRS J. Photogramm. Remote Sens. 2016, 114, 24–31. [Google Scholar] [CrossRef]
  50. McFeeters, S.K. The use of the normalized difference water index (NDWI) in the delineation of open water features. Int. J. Remote Sens. 1996, 17, 1425–1432. [Google Scholar] [CrossRef]
  51. Xu, H.Q. Modification of normalised difference water index (NDWI) to enhance open water features in remotely sensed imagery. Int. J. Remote Sens. 2006, 27, 3025–3033. [Google Scholar] [CrossRef]
  52. Kawamura, M.; Jayamanna, S.; Tsujiko, T. Relation between social and environmental conditions in Colombo Sri Lanka and the Urban Index estimated by satellite remote sensing data. Int. Arch. Photogramm. Remote Sens. 1996, 31 Pt B7, 321–326. [Google Scholar]
  53. Zha, Y.; Gao, J.; Ni, S. Use of normalized difference built-up index in automatically mapping urban areas from TM imagery. Int. J. Remote Sens. 2003, 24, 583–594. [Google Scholar] [CrossRef]
  54. Cao, R.; Li, C.; Liu, L.; Wang, J.; Yan, G. Extracting Miyun reservoir’s water area and monitoring its change based on a revised normalized different water index. Sci. Surv. Mapp. 2008, 33, 158–160. [Google Scholar]
  55. Shi, G.; Jiang, N.; Yao, L.Q. Land Use and Cover Change during the Rapid Economic Growth Period from 1990 to 2010: A Case Study of Shanghai. Sustainability 2018, 10, 426. [Google Scholar] [CrossRef]
  56. Su, S.; Zhou, X.; Wan, C.; Li, Y.; Kong, W. Land use changes to cash crop plantations: Crop types, multilevel determinants and policy implications. Land Use Policy 2016, 50, 379–389. [Google Scholar] [CrossRef]
  57. Li, X.; Zhou, W.; Ouyang, Z. Forty years of urban expansion in Beijing: What is the relative importance of physical, socioeconomic, and neighborhood factors? Appl. Geogr. 2013, 38, 1–10. [Google Scholar] [CrossRef] [Green Version]
  58. Dubovyk, O.; Sliuzas, R.; Flacke, J. Spatio-temporal modelling of informal settlement development in Sancaktepe district, Istanbul, Turkey. ISPRS J. Photogramm. Remote Sens. 2011, 66, 235–246. [Google Scholar] [CrossRef]
  59. Pan, H.; Deal, B.; Chen, Y.; Hewings, G. A Reassessment of urban structure and land-use patterns: Distance to CBD or network-based?—Evidence from Chicago. Reg. Sci. Urban Econ. 2018, 70, 215–228. [Google Scholar] [CrossRef]
  60. Lunetta, R.S.; Shao, Y.; Ediriwickrema, J.; Lyon, J.G. Monitoring agricultural cropping patterns across the Laurentian Great Lakes Basin using MODIS-NDVI data. Int. J. Appl. Earth Obs. Geoinf. 2010, 12, 81–88. [Google Scholar] [CrossRef]
  61. Sun, T.; Deng, W.; Ma, L. Urban land use change detection based on object-oriented classification. Geogr. Inf. 2018, 16, 94–99. (In Chinese) [Google Scholar]
  62. Olofsson, P.; Foody, G.M.; Herold, M.; Stehman, S.V.; Woodcock, C.E.; Wulder, M.A. Good practices for estimating area and assessing accuracy of land change. Remote Sens. Environ. 2014, 148, 42–57. [Google Scholar] [CrossRef] [Green Version]
  63. Taylor, L.E.; Hurley, P.T. A Comparative Political Ecology of Exurbia: Planning, Environmental Management, and Landscape Change; Springer international publishing AG: Cham, Switzerland, 2016. [Google Scholar]
  64. Janečková Molnárová, K.; Skřivanová, Z.; Kalivoda, O.; Sklenička, P. Rural identity and landscape aesthetics in exurbia: Some issues to resolve from a Central European perspective. Morav. Geogr. Rep. 2017, 25, 2–12. [Google Scholar] [CrossRef] [Green Version]
  65. Gao, J.L.; Wei, Y.D.; Chen, W.; Chen, J.L. Economic transition and urban land expansion in Provincial China. Habitat Int. 2014, 44, 461–473. [Google Scholar] [CrossRef]
  66. Huang, Z.; Wei, Y.D.; He, C.; Li, H. Urban land expansion under economic transition in China: A multi-level modeling analysis. Habitat Int. 2015, 47, 69–82. [Google Scholar] [CrossRef]
  67. Cao, G.Z.; Feng, C.C.; Tao, R. Local "Land finance" in China’s urban expansion: Challenges and solutions. China World Econ. 2008, 16, 19–30. [Google Scholar] [CrossRef]
  68. Chen, Z.; Tang, J.; Wan, J.; Chen, Y. Promotion incentives for local officials and the expansion of urban construction land in China: Using the Yangtze River Delta as a case study. Land Use Policy 2017, 63, 214–225. [Google Scholar] [CrossRef]
  69. The State Council of the People’s Republic of China. Notification of the Central Committee of the Communist Party of China and the State Council of the People’s Republic of China on Strengthening Land Management and Prohibiting the Irrational Occupation of Farmland. 1986. Available online: http://www.law-lib.com/law/law_view1.asp?id=47245 (accessed on 15 December 2018).
  70. The Central People’s Government of the People’s Republic of China. Some Suggestions of the Central People’s Government of the People’s Republic of China and the State Council of the People’s Republic of China and the State Council of the People’s Republic of China for the policies of Promoting Farmers Income Increase; 2004. Available online: http://www.gov.cn/gongbao/content/2004/content_63144.htm (accessed on 15 December 2018).
  71. The General Office of State Council. The Report of Government Work of 2007; 2007. Available online: http://www.gov.cn/test/2009-03/16/content_1260188.htm (accessed on 15 December 2018).
  72. General Office of People’s Government of Ningbo City. Planning for Reclamation of Tidal Flat in Ningbo City (2011–2020). 2011. Available online: http://www.doc88.com/p-0012079916795.html (accessed on 15 December 2018).
  73. Office of the development and reform commission of Zhejiang Province. General Plan for Tidal Flat Reclamation in Zhejiang Province (2005–2020). 2006. Available online: https://wenku.baidu.com/view/d0287e1aa300a6c30c229f42.html (accessed on 15 December 2018).
  74. Tian, B.; Wu, W.; Yang, Z.; Zhou, Y. Drivers, trends, and potential impacts of long-term coastal reclamation in China from 1985 to 2010. Estuar. Coast. Shelf Sci. 2016, 170, 83–90. [Google Scholar] [CrossRef]
  75. Hatna, E.; Bakker, M.M. Abandonment and Expansion of Arable Land in Europe. Ecosystems 2011, 14, 720–731. [Google Scholar] [CrossRef] [Green Version]
  76. Huang, D.; Huang, J.; Liu, T. Delimiting urban growth boundaries using the CLUE-S model with village administrative boundaries. Land Use Policy 2019, 82, 422–435. [Google Scholar] [CrossRef]
  77. Hu, Y.; Kong, X.; Zheng, J.; Sun, J.; Wang, L.; Min, M. Urban Expansion and Farmland Loss in Beijing during 1980–2015. Sustainability 2018, 10, 3927. [Google Scholar] [CrossRef]
  78. Li, H.; Zhang, X.; Zhang, Y.; Yang, X.; Zhang, K. Risk assessment of forest landscape degradation using Bayesian network modeling in the Miyun Reservoir catchment (China) with emphasis on the Beijing-Tianjin sandstorm source control program. Land Degrad. Dev. 2018, 29, 3876–3885. [Google Scholar] [CrossRef]
  79. Bradshaw, C.J.A.; Sodhi, N.S.; Peh, K.S.H.; Brook, B.W. Global evidence that deforestation amplifies flood risk and severity in the developing world. Glob. Chang. Biol. 2007, 13, 2379–2395. [Google Scholar] [CrossRef]
  80. Chakravarty, S.; Ghosh, S.K.; Suresh, C.P.; Dey, A.N.; Shukla, G. Deforestration: Causes, effects and control strategies. In Global Perspectives on Sustainable Forest Management; IntechOpen: Rijeka, Croatia, 2012. [Google Scholar]
  81. Decaens, T.; Martins, M.B.; Feijoo, A.; Oszwald, J.; Doledec, S.; Mathieu, J.; Arnaud de Sartre, X.; Bonilla, D.; Brown, G.G.; Cuellar Criollo, Y.A.; et al. Biodiversity loss along a gradient of deforestation in Amazonian agricultural landscapes. Conserv. Biol. 2018, 32, 1380–1391. [Google Scholar] [CrossRef]
  82. Carugati, L.; Gatto, B.; Rastelli, E.; Lo Martire, M.; Coral, C.; Greco, S.; Danovaro, R. Impact of mangrove forests degradation on biodiversity and ecosystem functioning. Sci. Rep. 2018, 8, 13298. [Google Scholar] [CrossRef]
  83. Jiang, B.; Bai, Y.; Wong, C.P.; Xu, X.; Alatalo, J.M. China’s ecological civilization program–Implementing ecological redline policy. Land Use Policy 2019, 81, 111–114. [Google Scholar] [CrossRef]
  84. Meng, W.; Hu, B.; He, M.; Liu, B.; Mo, X.; Li, H.; Wang, Z.; Zhang, Y. Temporal-spatial variations and driving factors analysis of coastal reclamation in China. Estuar. Coast. Shelf Sci. 2017, 191, 39–49. [Google Scholar] [CrossRef]
  85. Yang, L.; Jiang, F.; Xie, Z.; Wang, J.; Liao, F.; Qi, S. Study on land reclamation around Poyang Lake in the abandoned farmland in the context of the policy for converting farmland to lake. China Land Sci. 2017, 31, 44–50. (In Chinese) [Google Scholar]
  86. Shen, Y.; Jia, H.; Li, C.; Tang, J. Numerical simulation of saltwater intrusion and storm surge effects of reclamation in Pearl River Estuary, China. Appl. Ocean Res. 2018, 79, 101–112. [Google Scholar] [CrossRef]
  87. Li, N.; Wang, Z.; Xia, L.; Yan, F.; Xu, L.-Q.; Qiao, Y.-J.; Li, X.-h.; An, S.-Q.; Fang, S.-B. Effects of long-term coastal reclamation on suitable habitat and wintering population size of the endangered Red-crowned Crane, Grus japonensis. Hydrobiologia 2017, 827, 21–29. [Google Scholar] [CrossRef]
  88. Gao, D.; Chen, G.; Li, X.; Lin, X.; Zeng, C. Reclamation Culture Alters Sediment Phosphorus Speciation and Ecological Risk in Coastal Zone of Southeastern China. Clean-Soil Air Water 2018, 46, 1700495. [Google Scholar] [CrossRef]
  89. The State Council of the People’s Republic of China. Notification of the State Council of Strengthening Coastal Wetland Protection and Strictly Control Reclamation; 2018. Available online: http://www.gov.cn/zhengce/content/2018-07/25/content_5309058.htm (accessed on 15 December 2018).
  90. Murray, N.J.; Phinn, S.R.; DeWitt, M.; Ferrari, R.; Johnston, R.; Lyons, M.B.; Clinton, N.; Thau, D.; Fuller, R.A. The global distribution and trajectory of tidal flats. Nature 2019, 565, 222–225. [Google Scholar] [CrossRef]
Figure 1. Location of Ningbo city.
Sustainability 11 02122 g001
Figure 2. Flowchart for land use mapping using random forest (RF) classification.
Sustainability 11 02122 g002
Figure 3. Groups of different spatial attributes in Ningbo city: (a) Distance to city center (DUC), (b) distance to county center (DCC), (c) distance to coastline (DCL), (d) distance to main roads (DMR), (e) elevation, and (f) slope.
Sustainability 11 02122 g003
Figure 4. Land use in Ningbo city from 1990 to 2016.
Sustainability 11 02122 g004
Figure 5. Annual net change in each land use type in Ningbo city from 1990 to 2016.
Sustainability 11 02122 g005
Figure 6. Gain and loss of each land use type and their sources in Ningbo city during 1990–2005.
Sustainability 11 02122 g006
Figure 7. Gain and loss of each land use type and their sources in Ningbo city during 2005–2016.
Sustainability 11 02122 g007
Figure 8. Spatial variations in the distribution index (DI) values for the major types of land use transitions during 1990–2005 by (a) DUC, (b) DCC, (c) DMR, (d) DCL, (e) slope, and (f) elevation.
Sustainability 11 02122 g008
Figure 9. Spatial variations of DI values for major types of land use transitions during 2005–2016 by (a) DUC, (b) DCC, (c) DMR, (d) DCL, (e) slope, and (f) elevation.
Sustainability 11 02122 g009
Table 1. Description of the images used in this study.
No.Acquisition DateSensorPath/RowCloud Cover (%)
114 August 1990Landsat 5118/39,118/400
212 August 1995Landsat 5118/39,118/400
318 September 2000Landsat 7118/39,118/400
430 July 2005Landsat 7118/392
515 August 2005Landsat 7118/390
619 September 2006Landsat 7118/400
704 June 2005Landsat 5118/404
817 July 2009Landsat 5118/390
920 July 2010Landsat 5118/4020
1020 July 2016Landsat 8118/391
1128 July 2016Landsat 7118/403
Table 2. The land use classification system used in Ningbo city.
CodeLand Use TypeDescription
1Construction landLand covered by construction, including urban or rural residential land, industrial areas, commercial areas, transportation facility areas, etc.
2Agricultural landLand for growing crops, also called cultivated land or arable land in other studies
3ForestLand for growing trees, shrubs, and bamboo, as well as coastal mangrove forest
4Water bodyRivers, lakes, sea areas, ponds, reservoirs, etc.
5Other landOther types of land use, including unused land
Table 3. Overall accuracy (OA) and kappa coefficients and their comparison to the results of You’s study [37].
YearThis StudyYou’s Study
OA (%)KappaOA (%)Kappa
199087.80.8392.5 10.89 1
199591.60.8894.10.92
200092.80.9091.70.89
200585.50.8193.60.91
201088.80.8593.90.91
201686.80.83----
1 These two numbers are results from the year 1991 in You’s study [37].
Table 4. Areas and percentages of five land use types in Ningbo city from 1990 to 2016.
YearConstruction LandAgricultural LandForestWater BodyOther Land
Area (km2)Percentage (%)Area (km2)Percentage (%)Area (km2)Percentage (%)Area (km2)Percentage (%)Area (km2)Percentage (%)
1990531.515.712515.9127.025351.2457.46903.29.7010.850.12
1995992.9710.662519.4127.054861.0852.20923.629.9215.610.17
20001200.5612.892238.6824.044756.7751.081052.111.3064.590.69
20051543.8716.582074.2522.274646.1549.89988.3110.6160.110.65
20101515.416.272119.0722.754662.6950.07881.339.46134.221.44
20161560.1516.752289.2724.584557.148.93806.558.6699.621.07