A Decision-Making Algorithm for Maritime Search and Rescue Plan

 ,
,
Abstract
1. Introduction
2. Materials and Methods
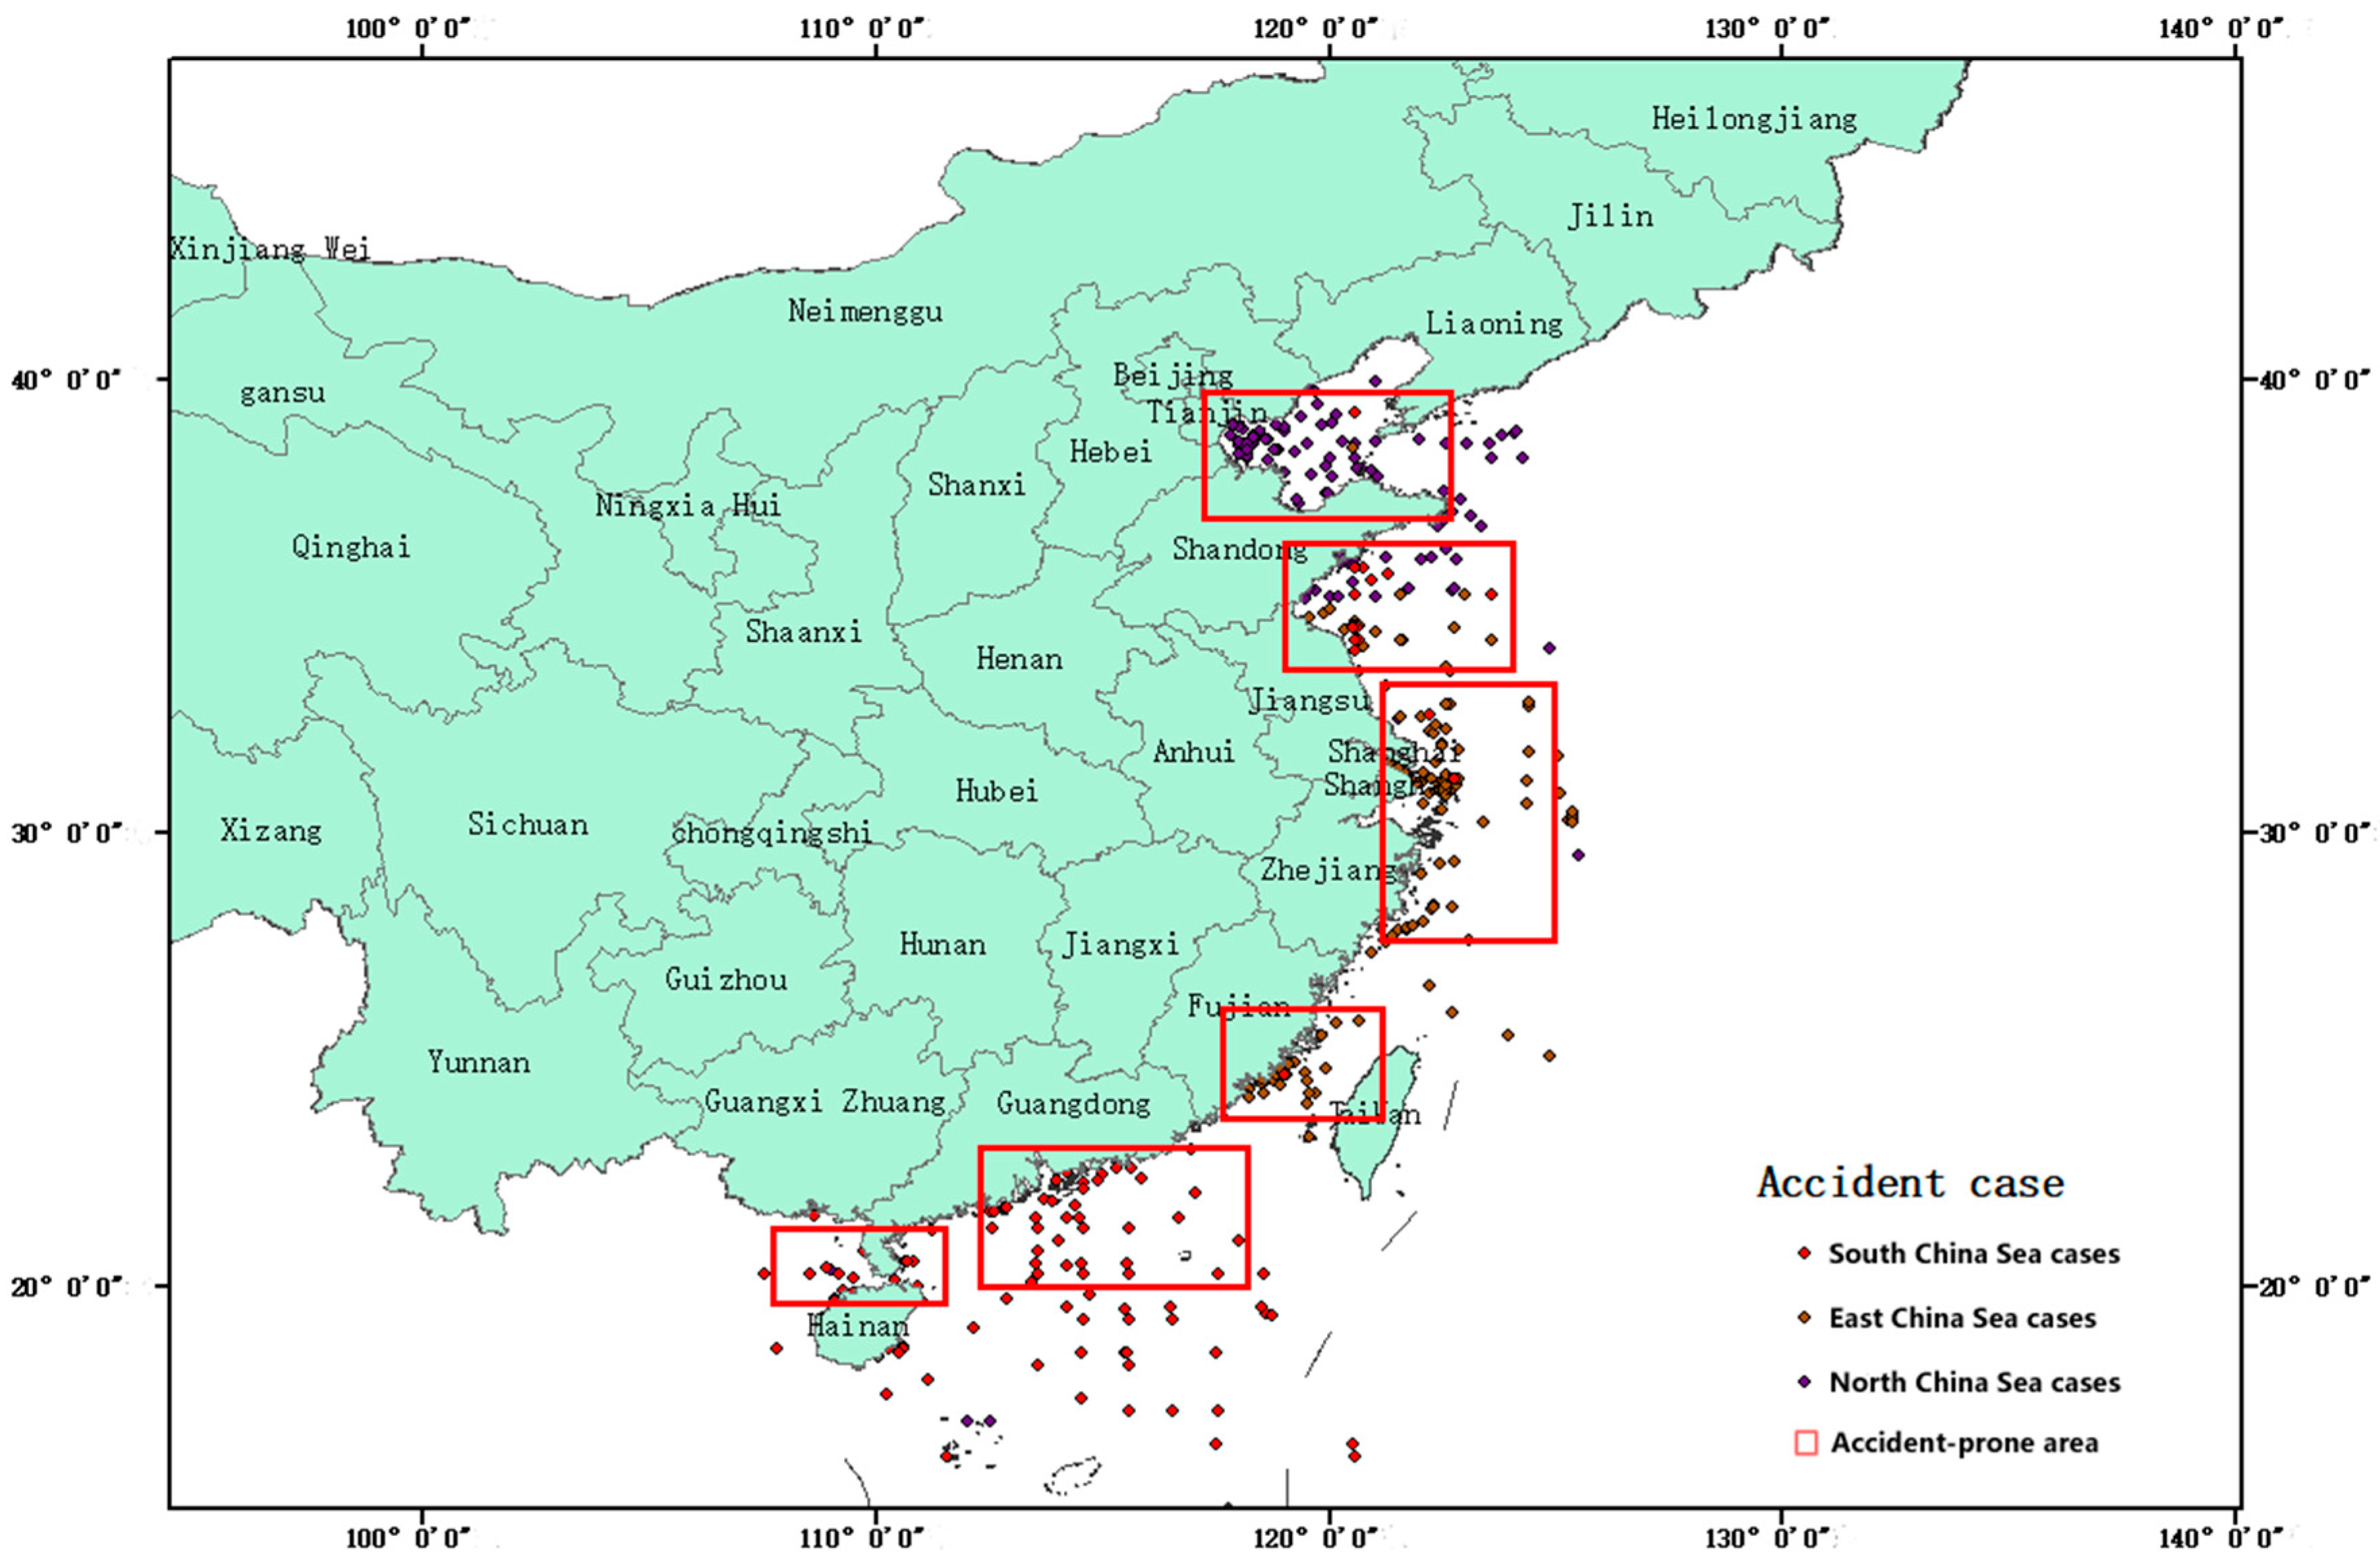
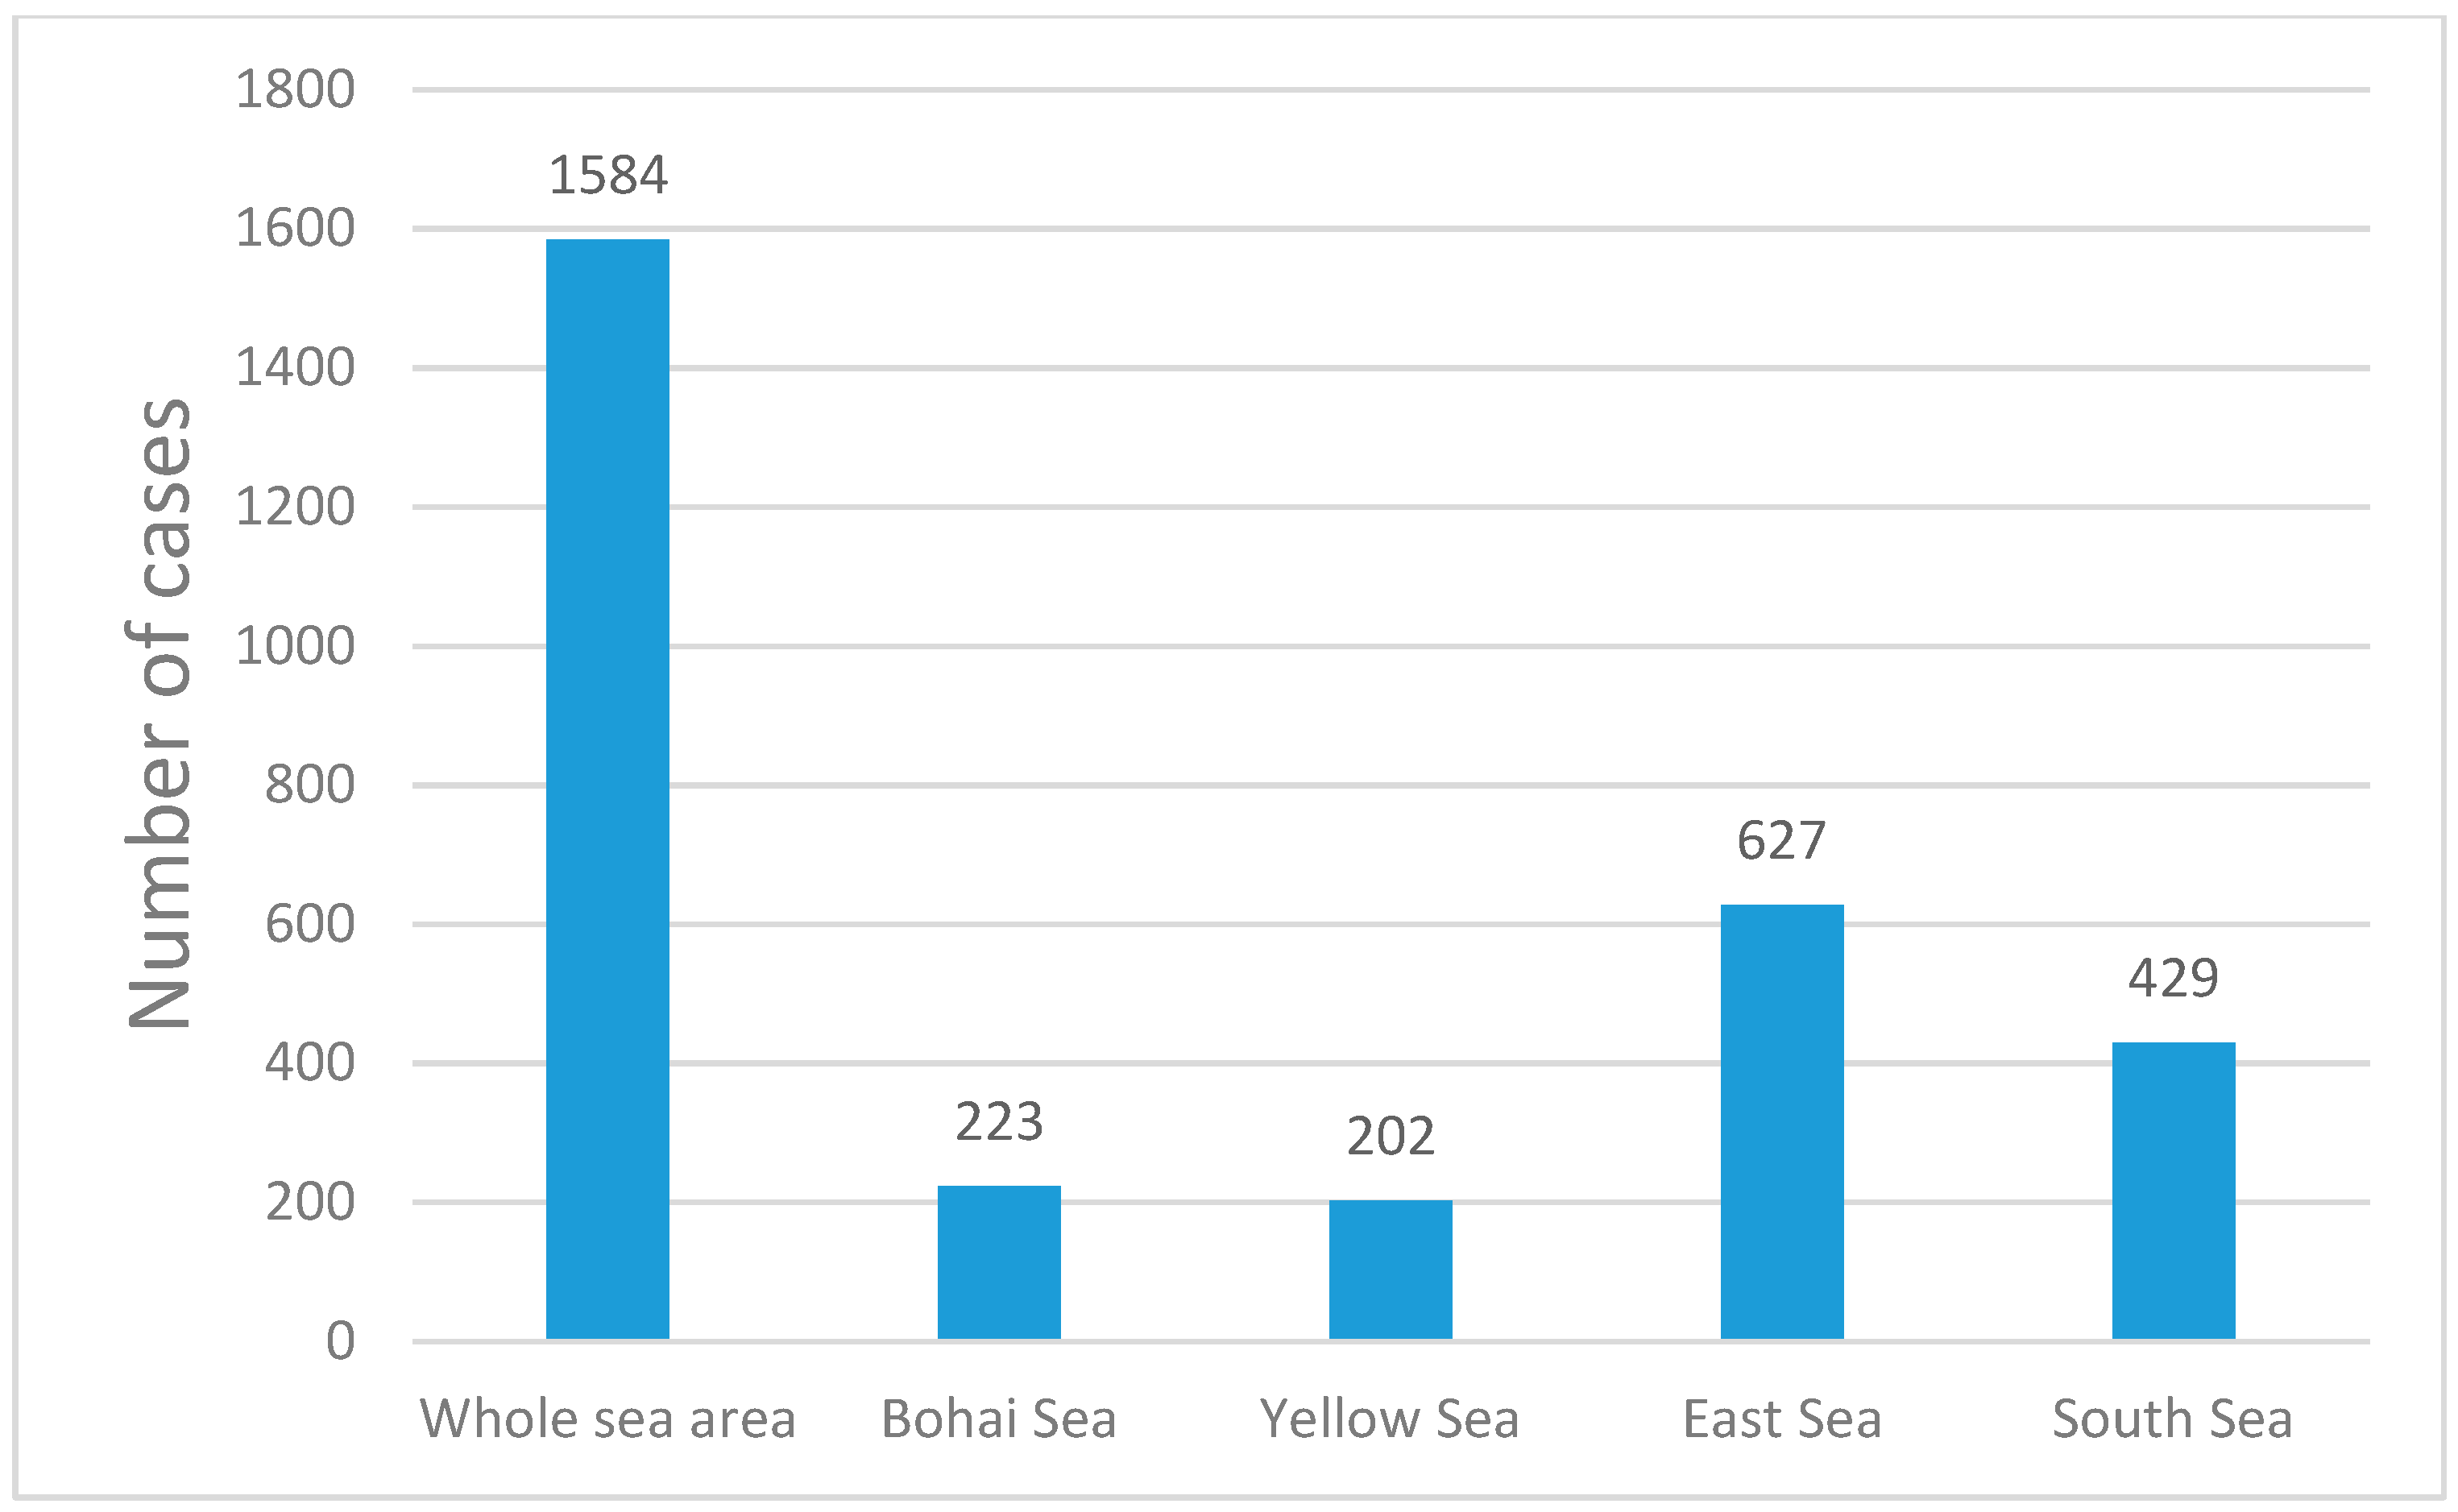
2.1. Description of Study Area
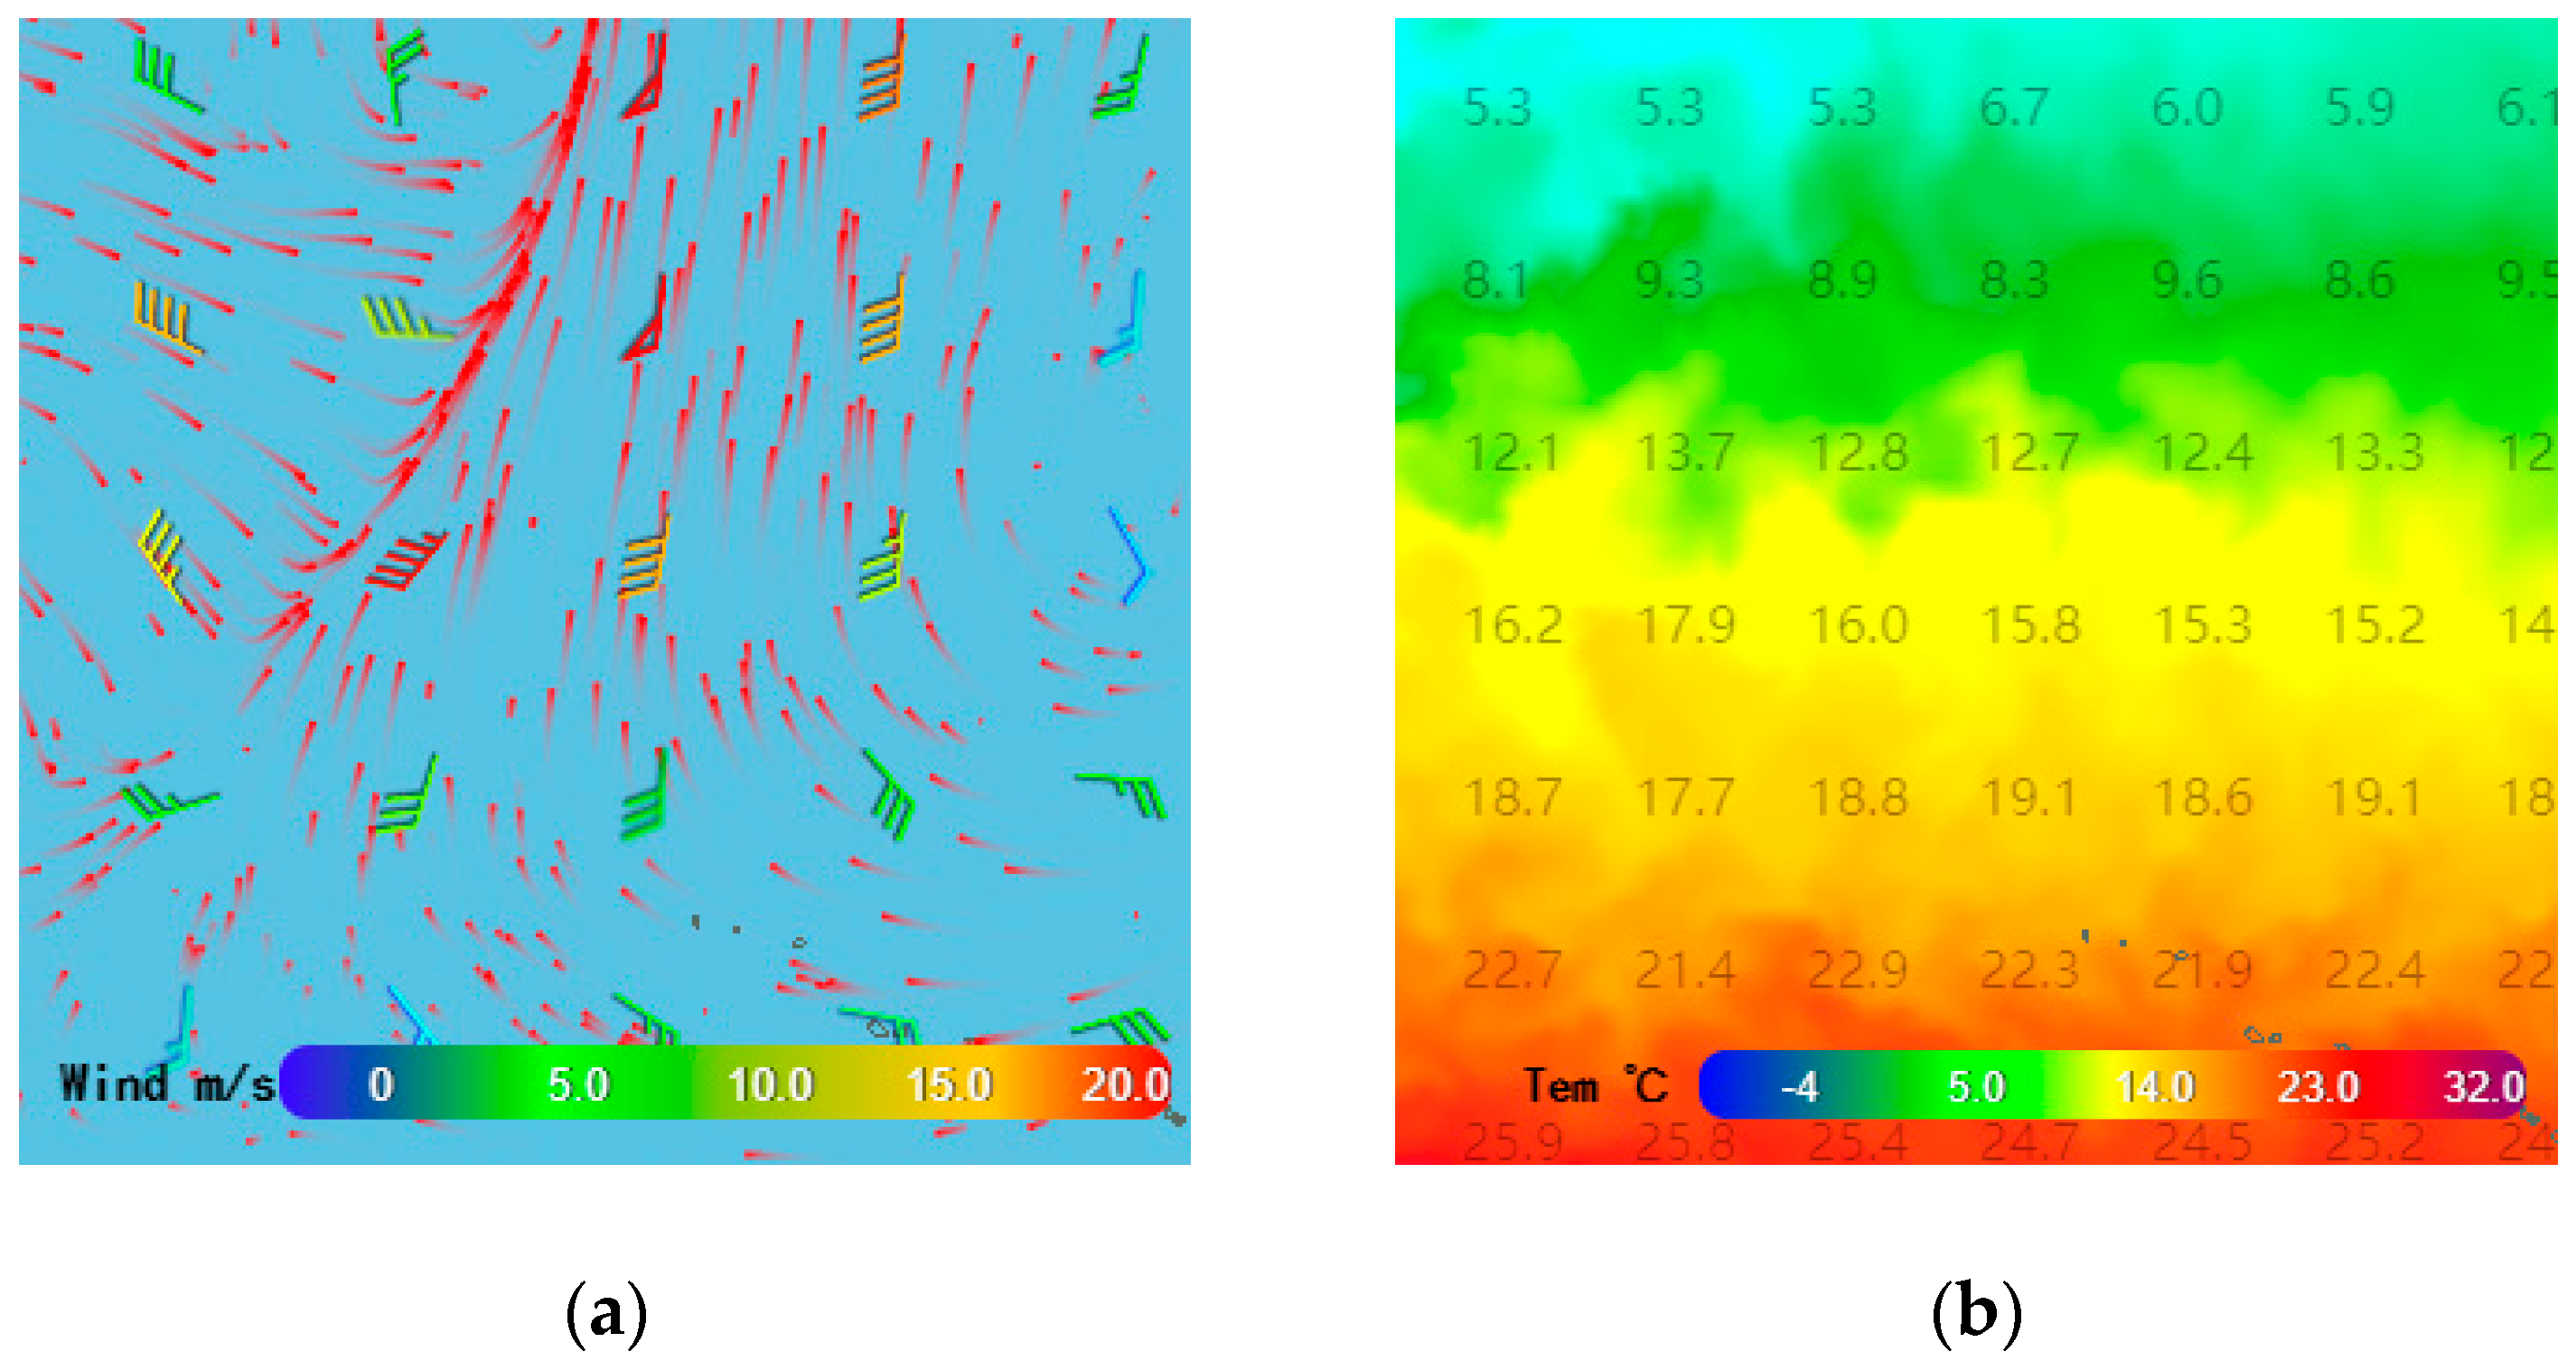
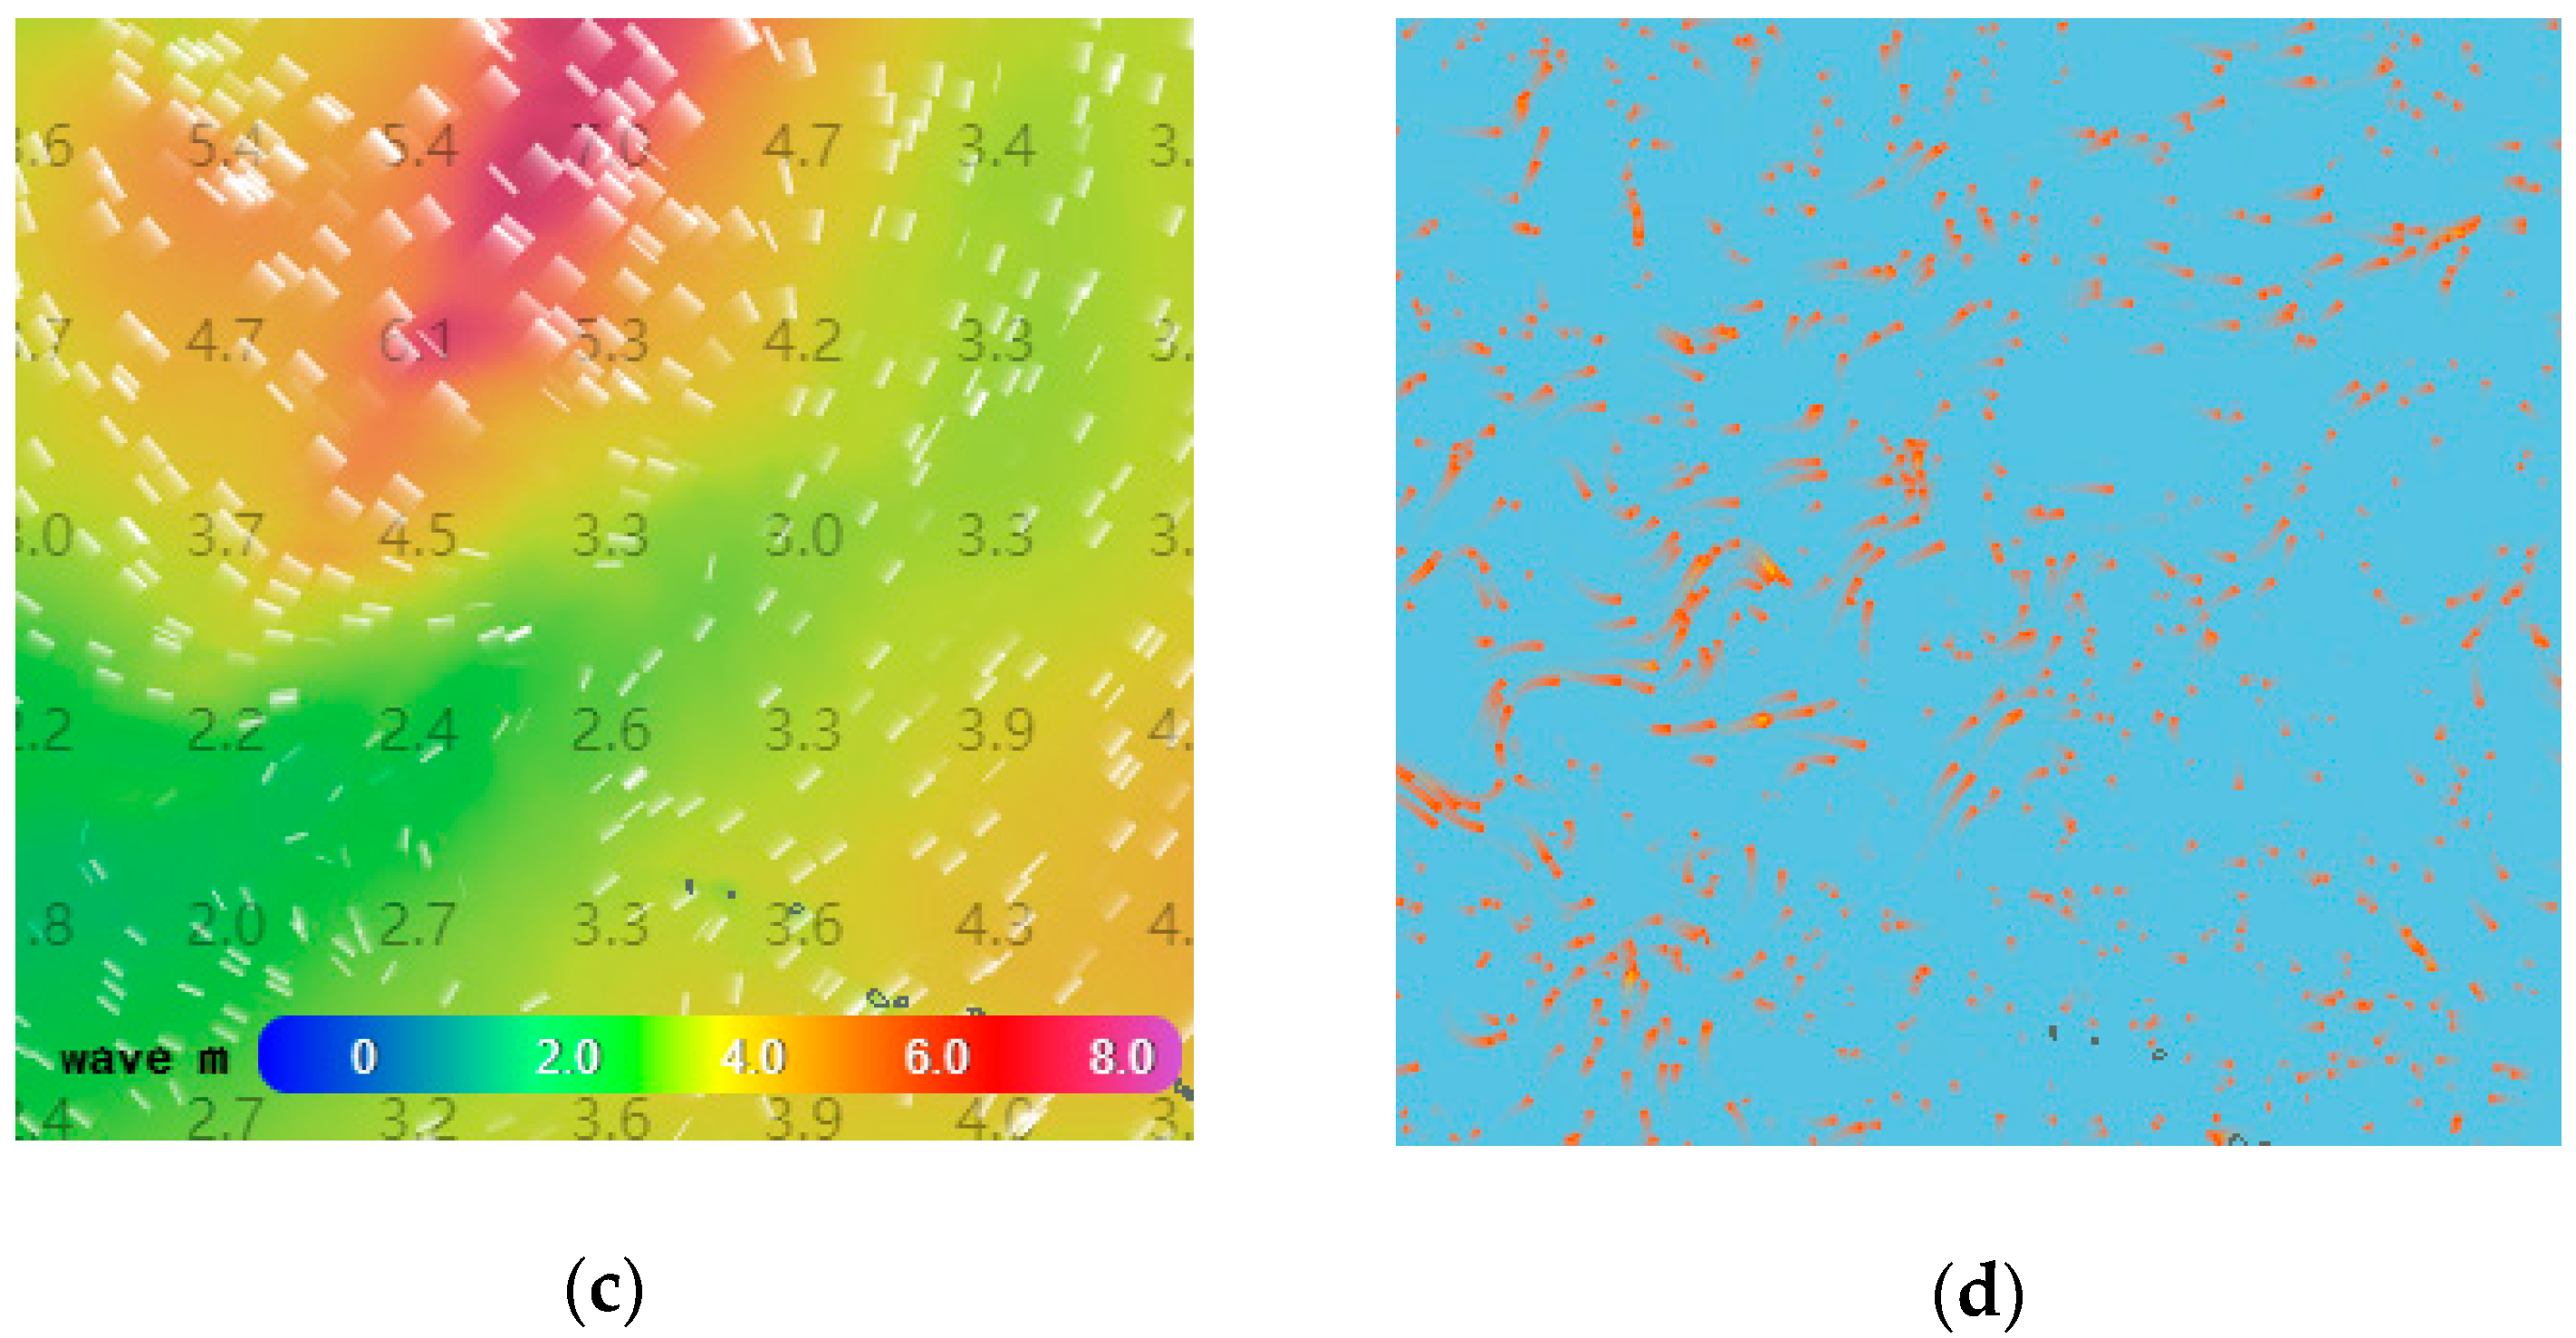
2.2. Description of Experimental Data
2.3. Description of the Probability of Containment
The Density Ratio
2.4. Description of the Probability of Detection
2.5. Description of the Probability of Success
3. Results
3.1. Determine the Search Area
3.1.1. Monte Carlo Algorithm Introduction
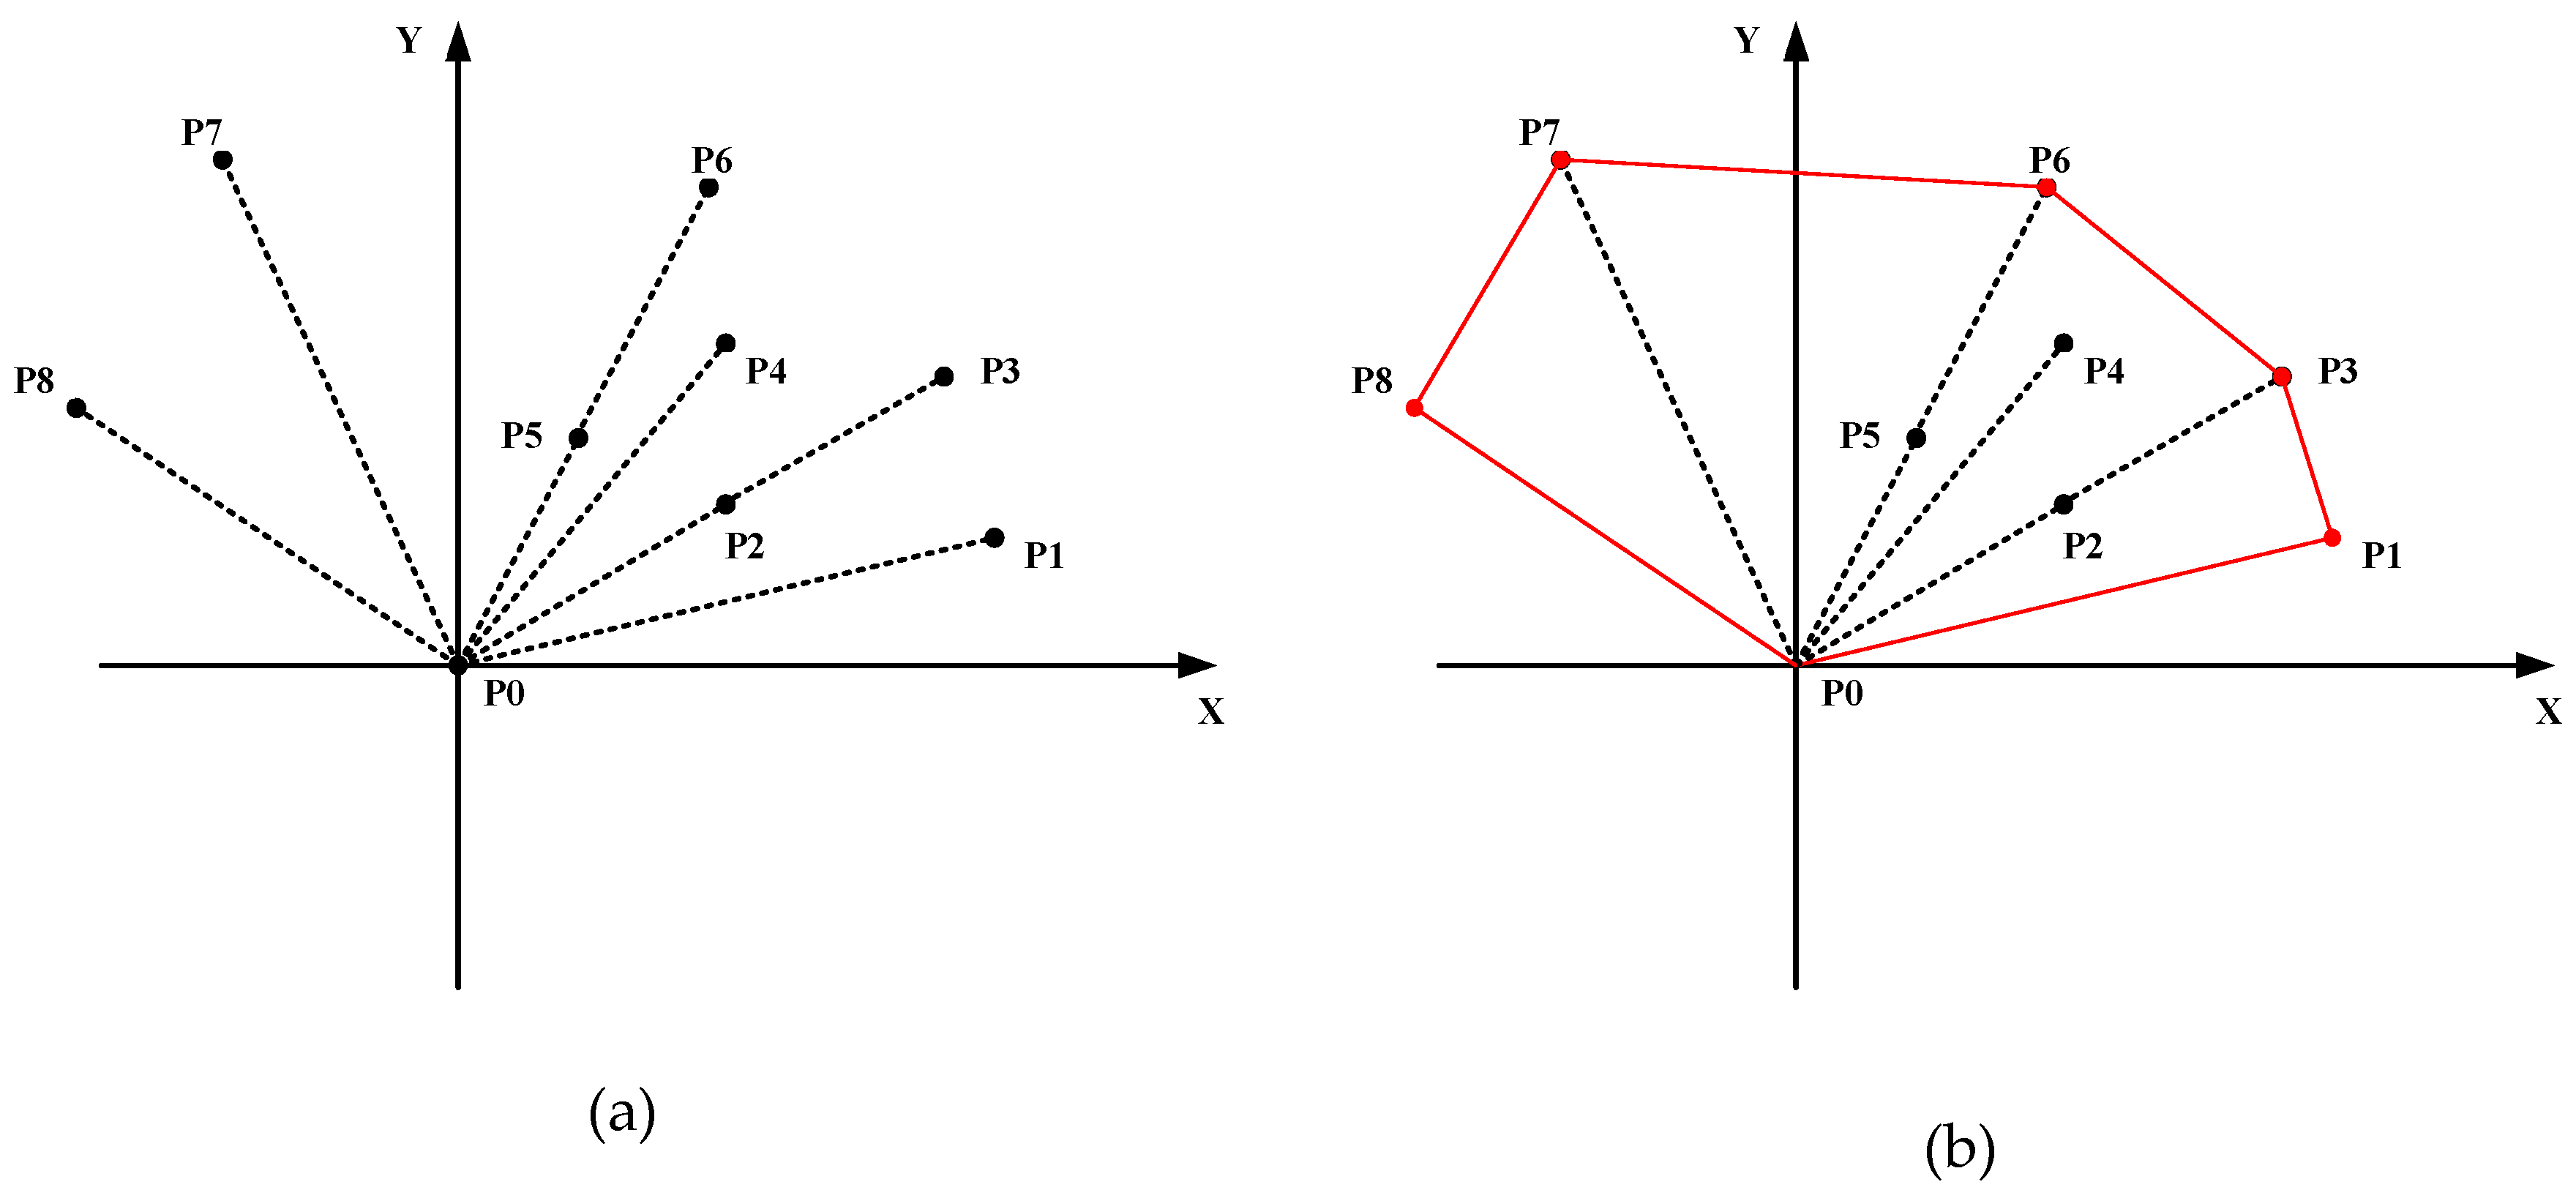
3.1.2. Graham Scan Algorithm Introduction
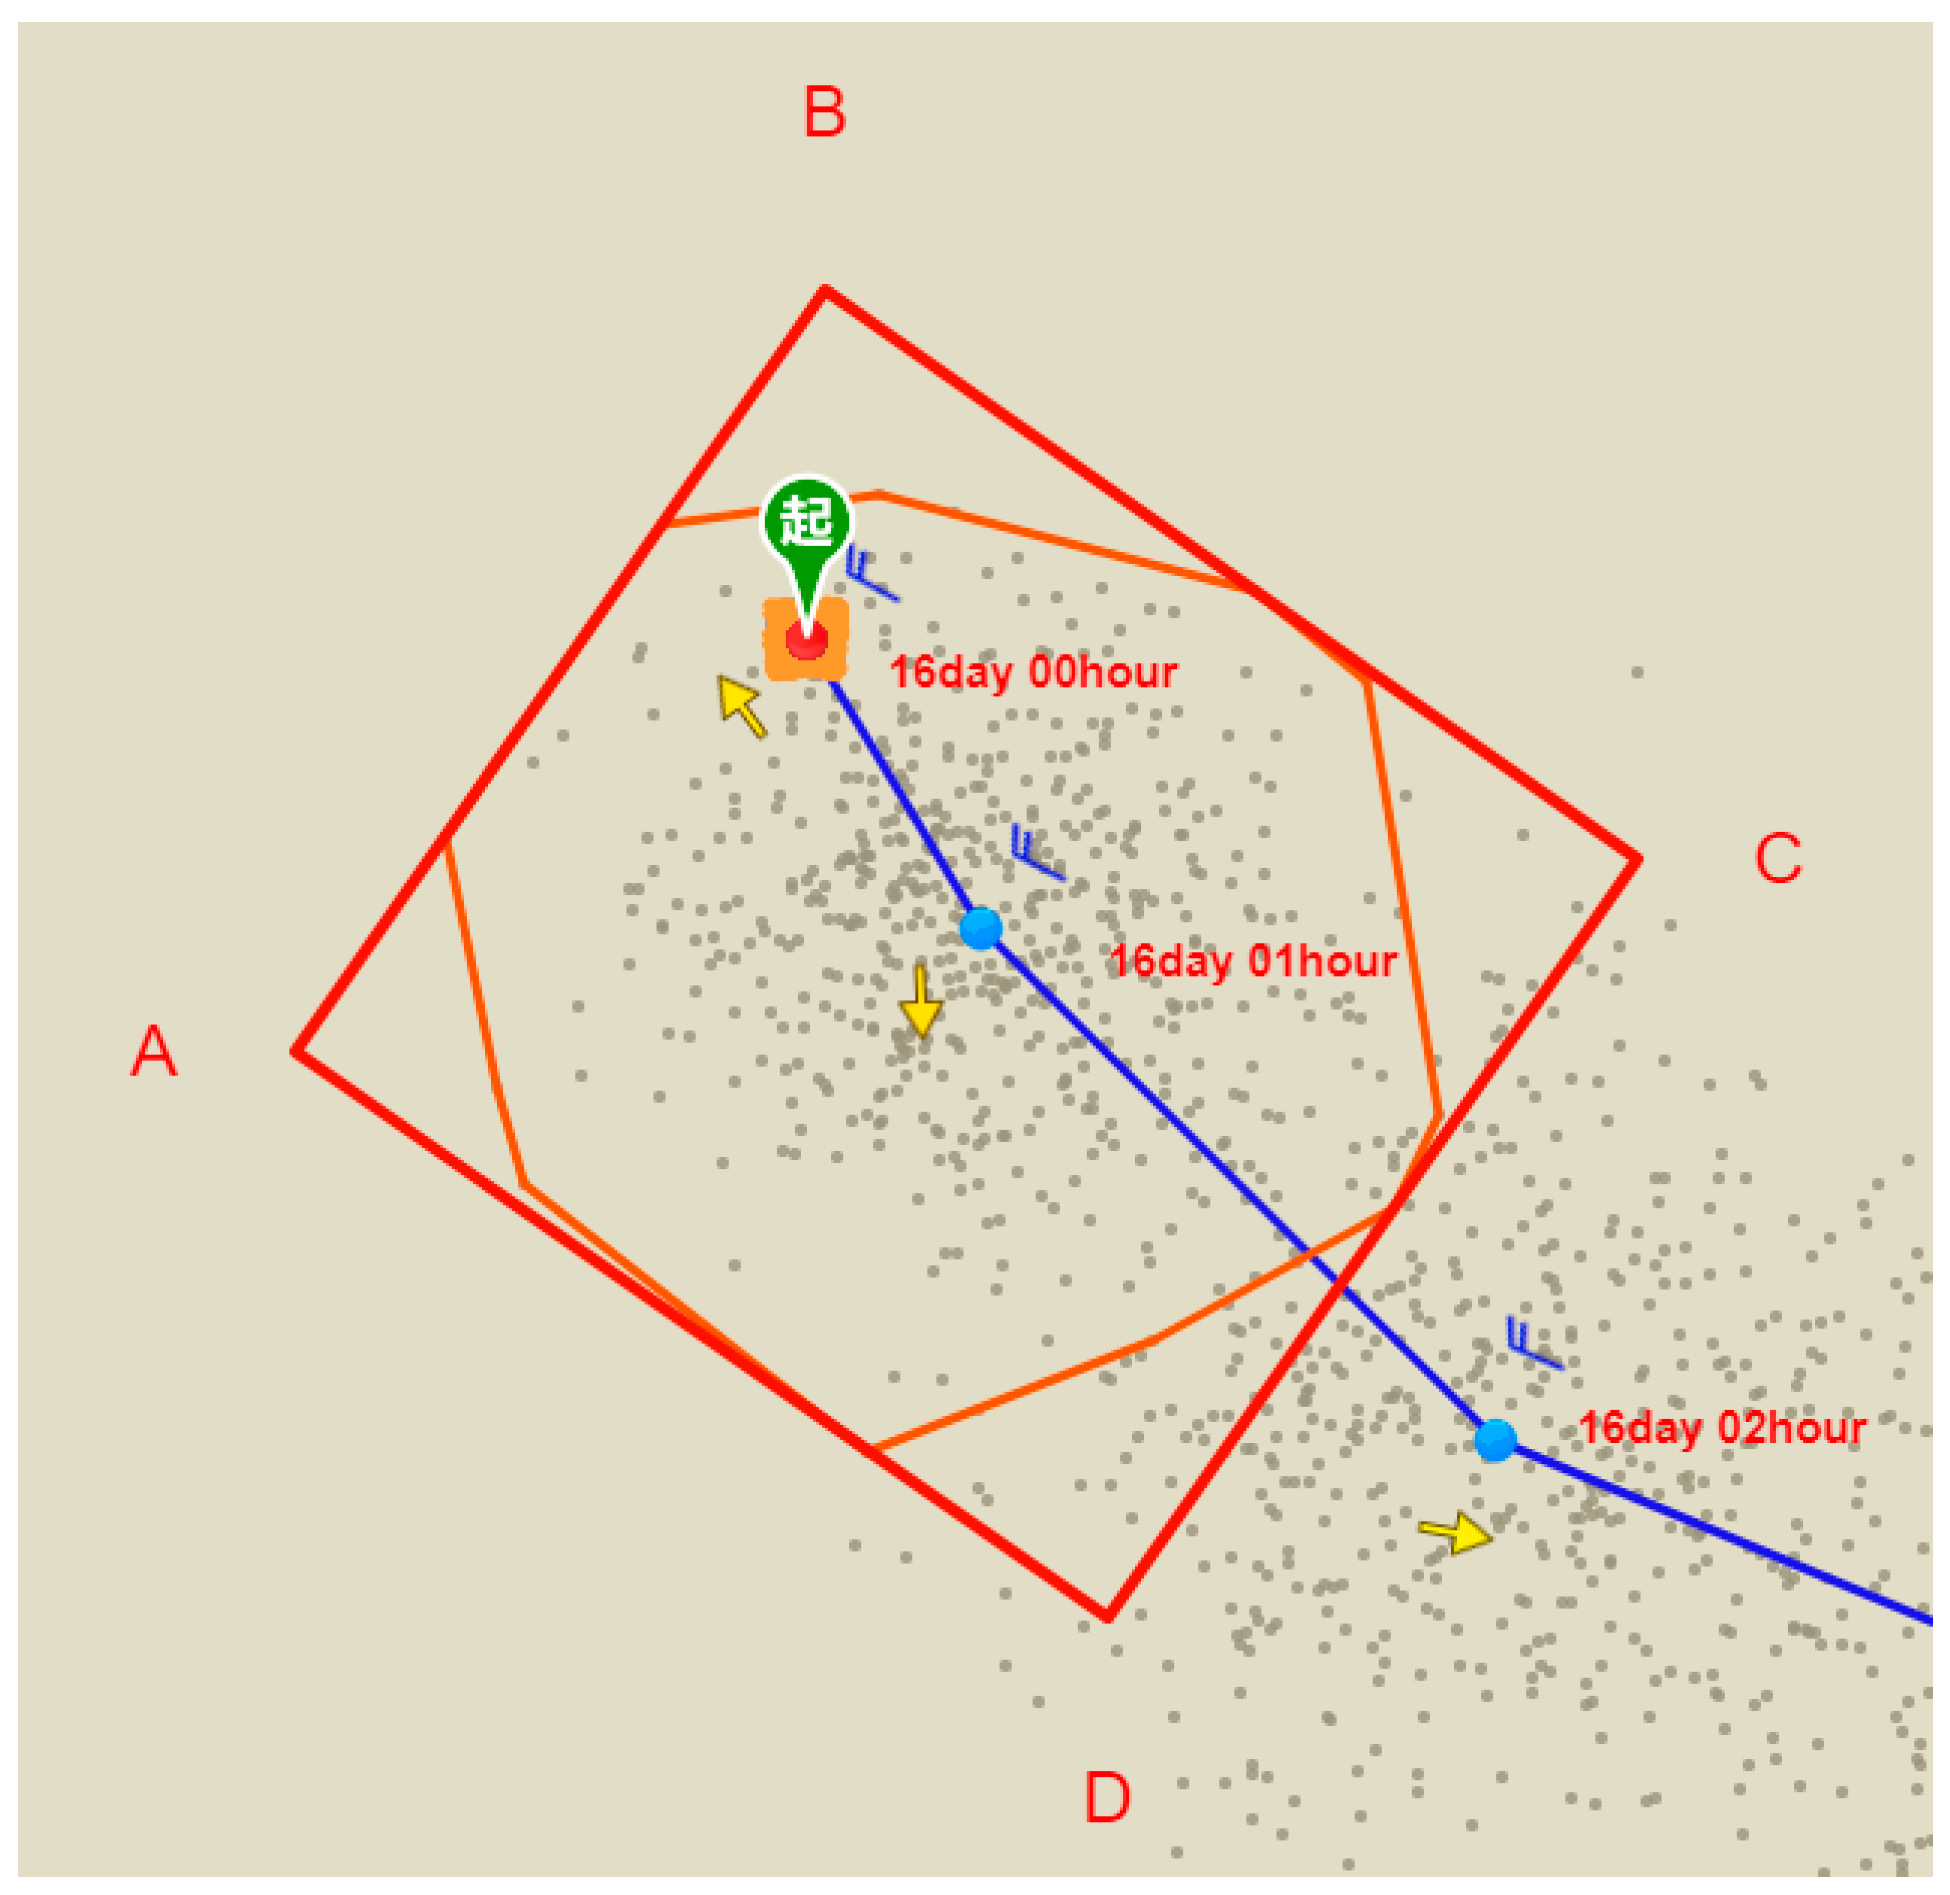
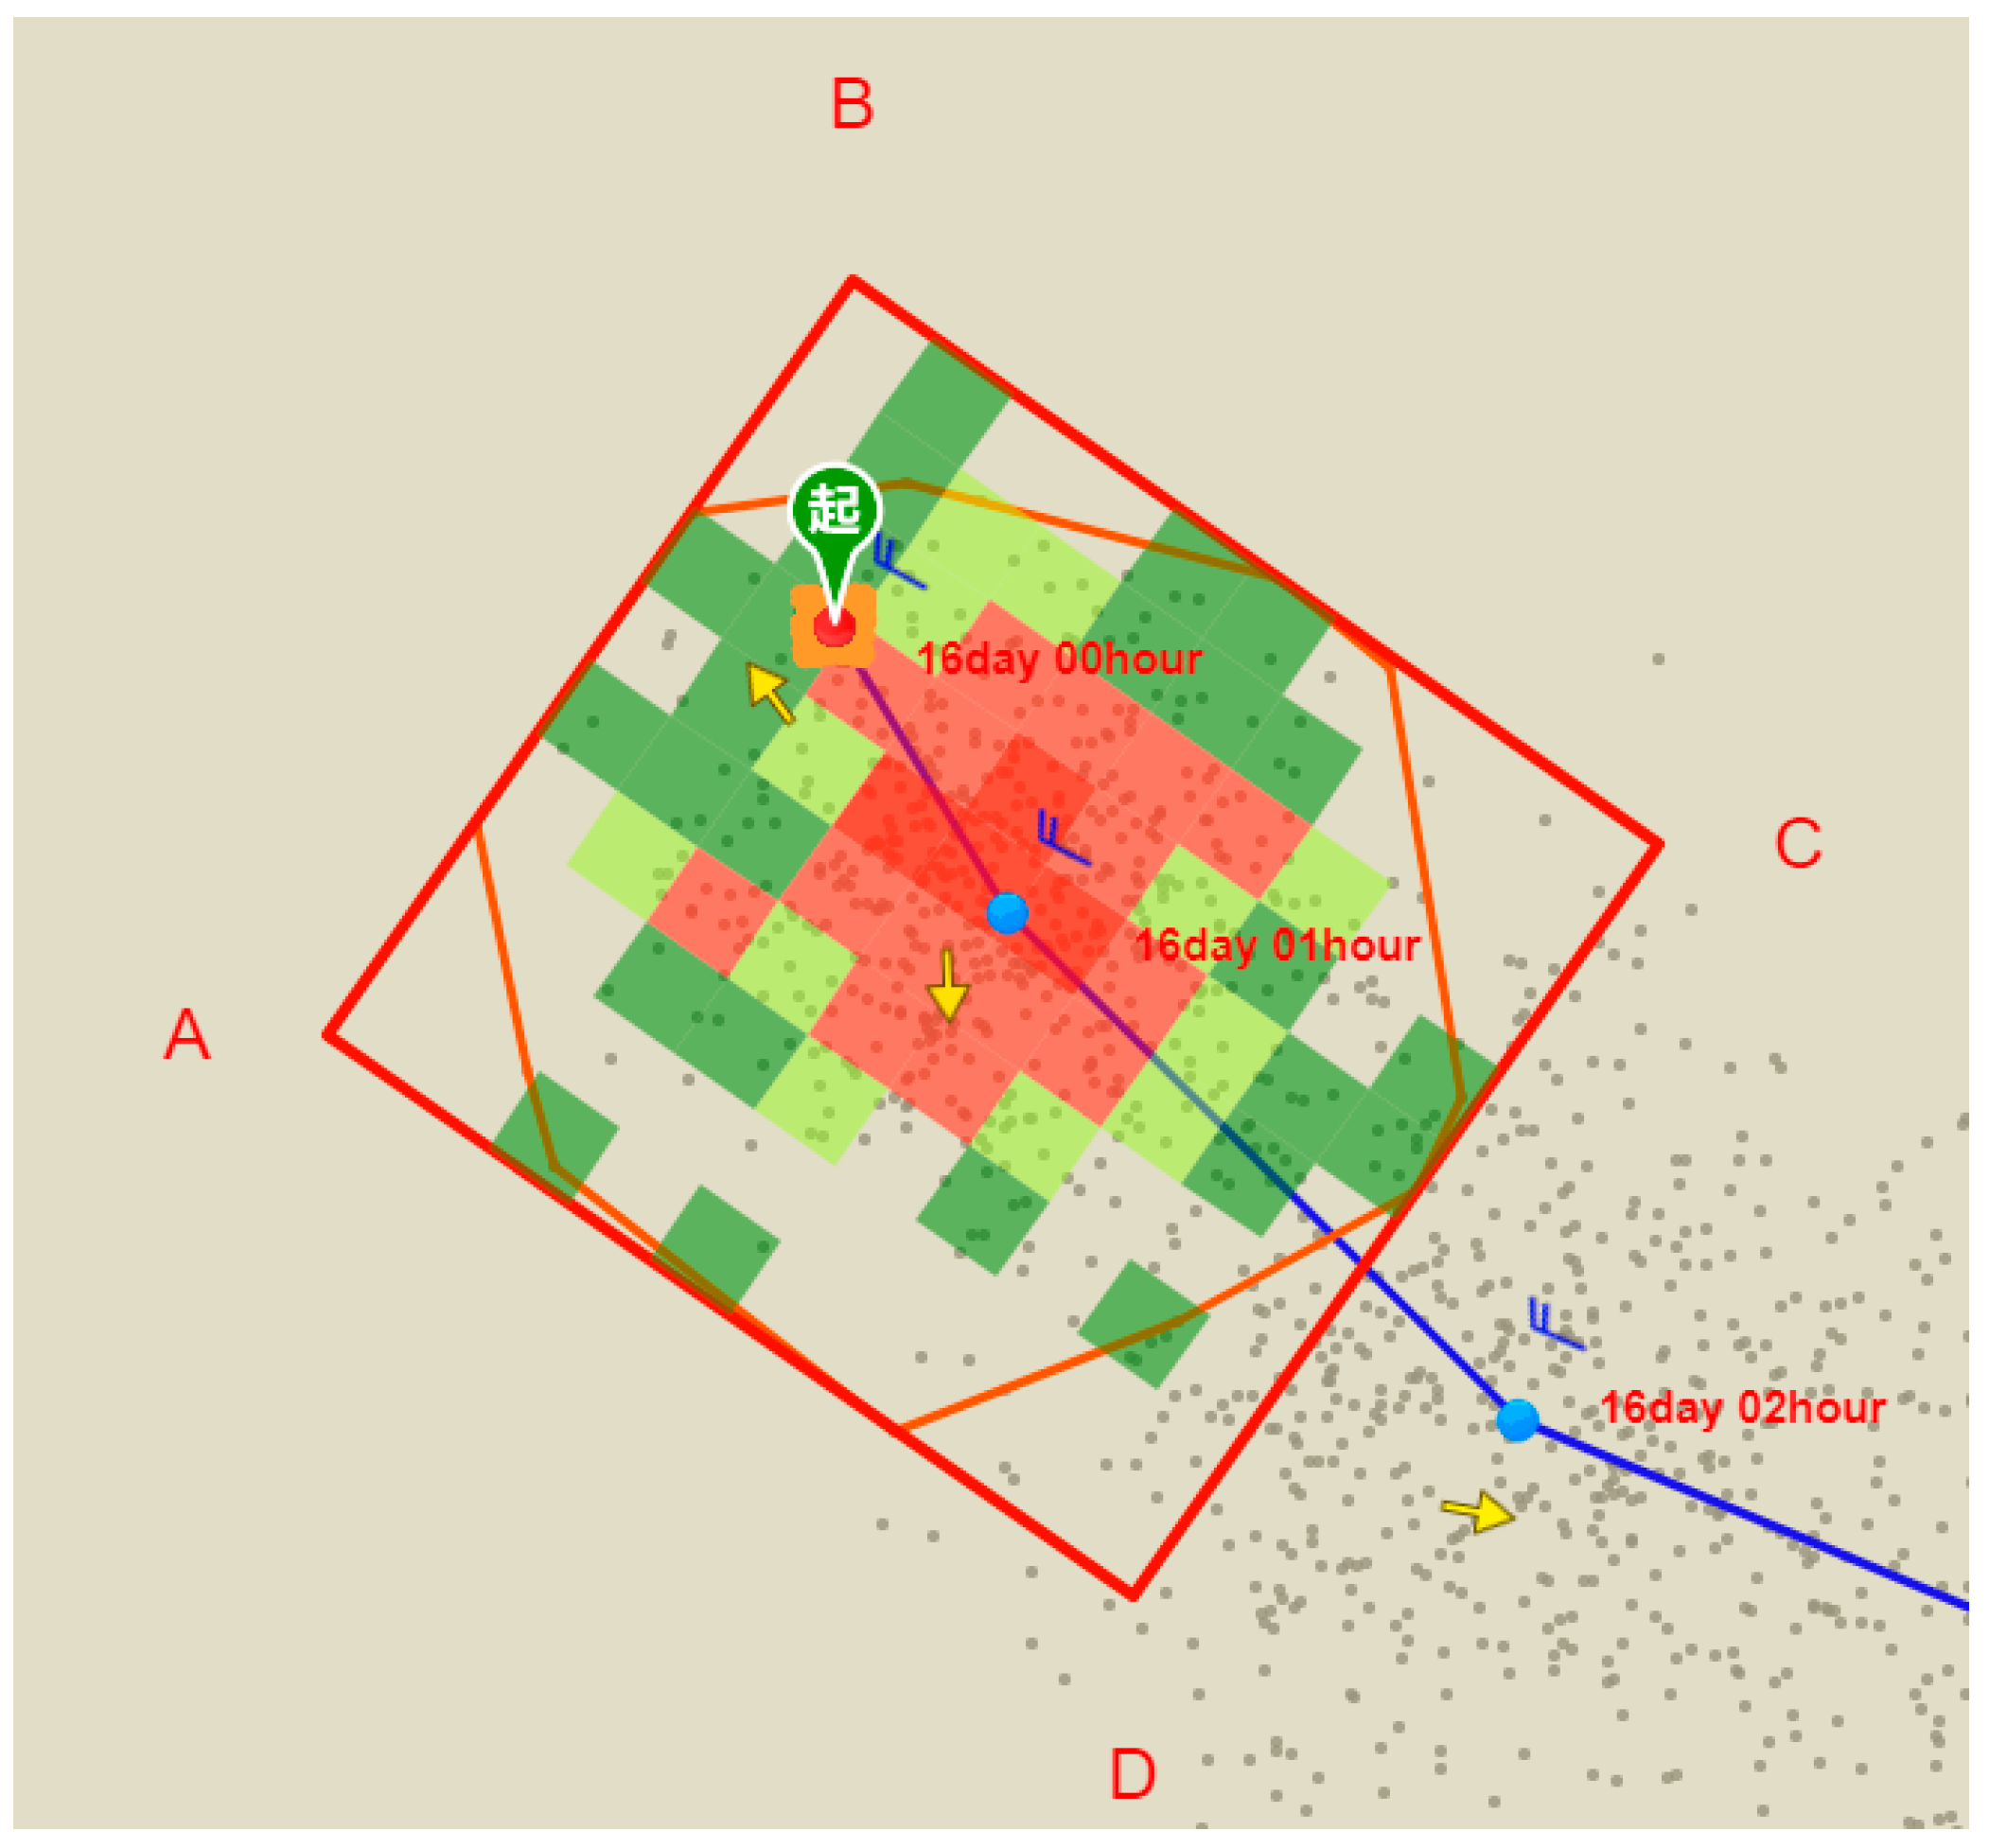
3.1.3. Minimum Rectangle Generation Algorithm Introduction
3.2. POC Calculation
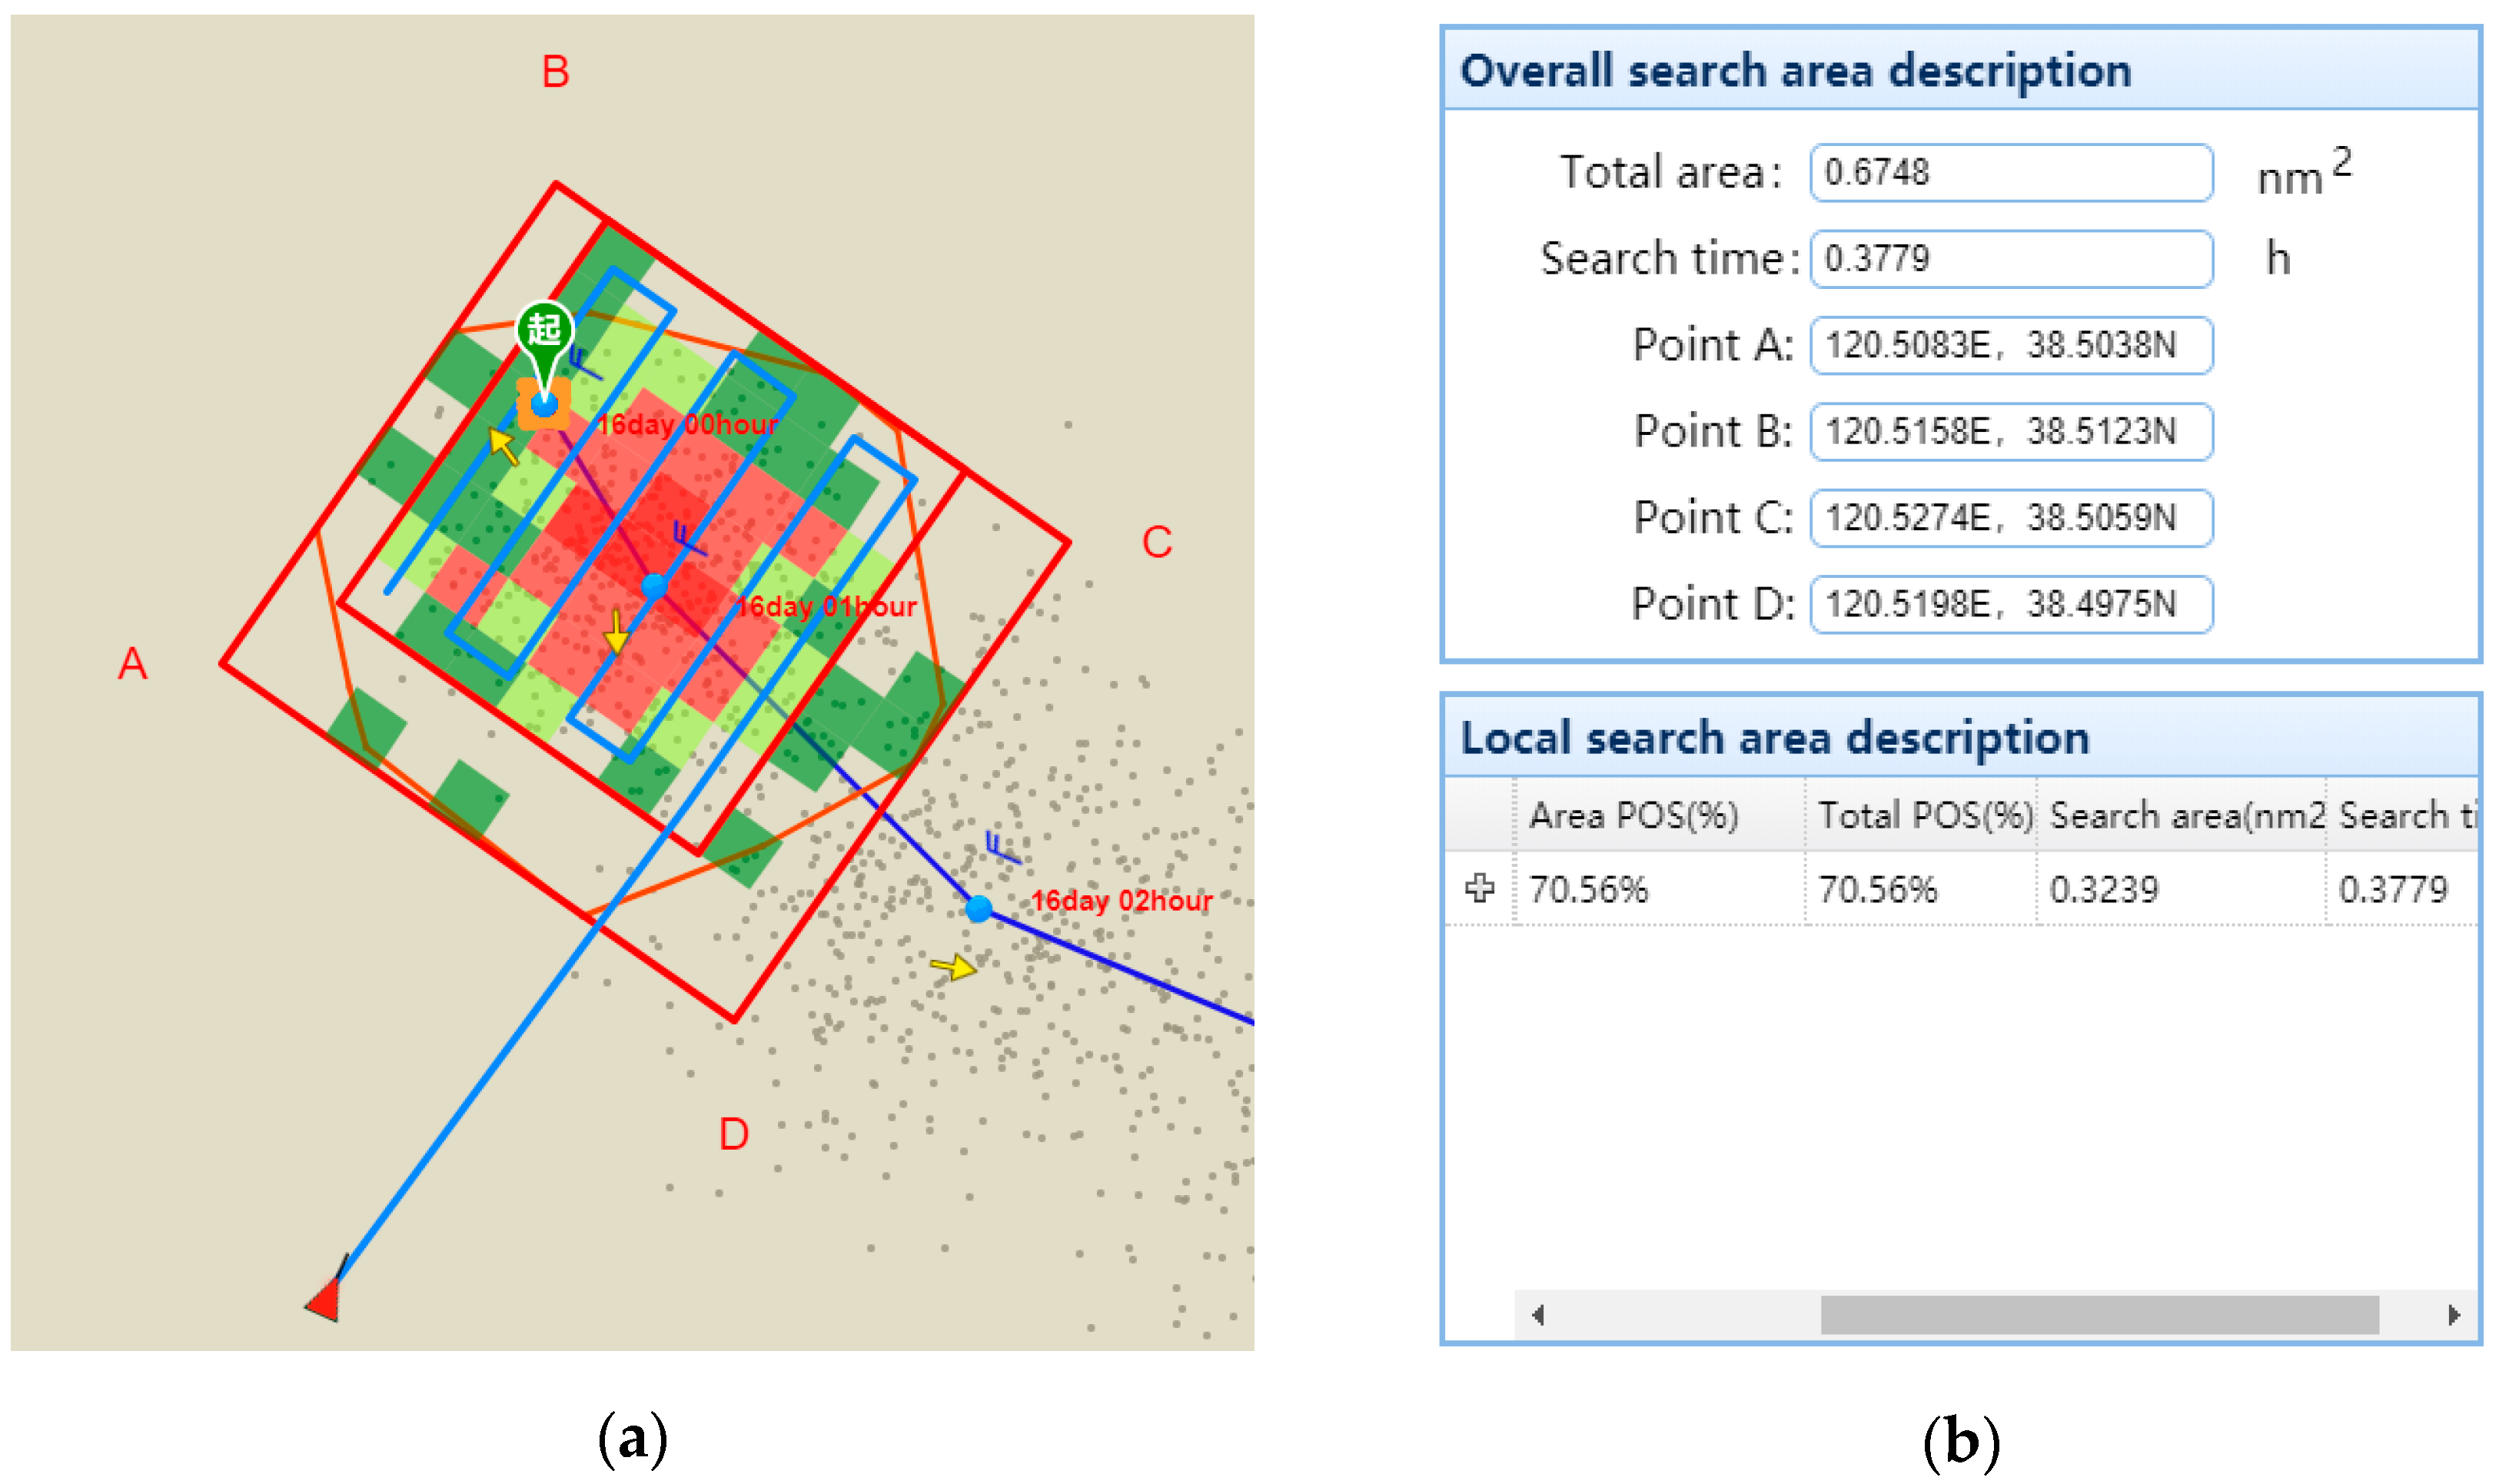
3.3. POD Calculation
3.4. POS Calculation
3.5. Analytical Approach
4. Discussion
4.1. Analysis of Algorithm
4.2. Analysis of Result
4.2.1. Comparison of POC Calculation Results
4.2.2. Comparison of POD Calculation Results
5. Conclusions
Author Contributions
Funding
Acknowledgments
Conflicts of Interest
References
- Abi-Zeid, I.; Nilo, O. A Constraint Optimization Approach for the Allocation of Multiple Search Units in Search and Rescue Operations. INFOR 2011, 49, 15–30. [Google Scholar] [CrossRef]
- Ashton, C.; Shuster Bruce, A.; Colledge, G.; Dickinson, M. The Search for MH370. J. Navig. 2015, 68, 1–22. [Google Scholar] [CrossRef]
- Stone, L.D.; Keller, C.M.; Kratzke, T.M.; Strumpfer, J.P. Search for the wreckage of air France flight AF 447. Stat. Sci. 2014, 29, 69–80. [Google Scholar] [CrossRef]
- Koopman, B.O. The theory of search, Part III: The optimum distribution of searching effort. Oper. Res. 1957, 5, 613–626. [Google Scholar] [CrossRef]
- Kratzke, T.M.; Stone, L.D.; Frost, J.R. Search and Rescue Optimal Planning System. In Proceedings of the 2010 13th International Conference on Information Fusion, Edinburgh, UK, 26–29 July 2011; Volume 13, pp. 1–8. [Google Scholar]
- Koczkodaj, W.; Orlows, M. An Orthogonal Basis for Computing a Consistent Approximation to a Pairwise Comparisons Matrix. Comput. Math. Appl. 2009, 7, 41–47. [Google Scholar] [CrossRef]
- Xiao, W.J.; Du, P.J.; Gong, M.X.; Kang, X. An operational search and rescue model system for Shanghai coast and adjacent seas. Mar. Forecasts 2013, 30, 80–86. [Google Scholar]
- Wang, B.Y. Maritime Optimal Search Area Research. Master’s Thesis, Dalian Maritime University, Dalian, China, 2016. [Google Scholar]
- Ren, J.Y. An Optimum Search Method for Sea Targets. Master’s Thesis, Changchun University of Technology, Changchun, China, 2017. [Google Scholar]
- Kasyk, L.; Pleskacz, K. An Adaptation of an Algorithm of search and rescue operation to ship maneuverability. TRANSNAV 2015, 9, 265–269. [Google Scholar] [CrossRef]
- Abi-Zeid, I.; Frost, J.R. SARPlan: A decision support system for Canadian search and rescue operations. Eur. J. Oper. Res. 2005, 162, 630–653. [Google Scholar] [CrossRef]
- Liang, B.C.; Liu, X.; Li, H.J.; Wu, Y.J.; Li, D.Y. Wave Climate Hind casts for the Bohai Sea, Yellow Sea, and East China Sea. J. Coast. Res. 2014, 32, 172–180. [Google Scholar]
- Liu, Z. Research on Risk Evaluation System for Vessels in Yellow Sea and Bohai Sea during Severe Weather. Master’s Thesis, Dalian Maritime University, Dalian, China, 2015. [Google Scholar]
- Zhang, J.; Ângelo, P.T.; Soares, C.G.; Yan, X. Probabilistic modelling of the drifting trajectory of an object under the effect of wind and current for maritime search and rescue. Ocean Eng. 2017, 129, 253–264. [Google Scholar] [CrossRef]
- Fan, X.W. Study on SAR Environment at Sea. Master’s Thesis, Dalian Maritime University, Dalian, China, 2013. [Google Scholar]
- Devarakonda, R.; Wei, Y.X.; Thornton, M.M. Accessing and distributing large volumes of NetCDF data. In Proceedings of the IEEE International Conference on Big Data, Washington, DC, USA, 5–8 December 2017; pp. 3966–3967. [Google Scholar]
- Wollan, E. A Primer on Search and Rescue. 2007. Available online: www.Mindensoaringclub.com (accessed on 6 September 2007).
- Wang, C. Principles and Practices towards SAR Services: A Comparative Study on State’s Approaches to Improving Maritime SAR. Master’s Thesis, World Maritime University, Malmö, Sweden, 2006; pp. 1–105. [Google Scholar]
- Richardson, H.R.; Discenza, J.H. The United States Coast Guard Computer-Assisted Search Planning system (CASP). Naval Res. Logist. Quart. 1980, 27, 659–680. [Google Scholar] [CrossRef]
- Stone, L.D. Theory of Optimal Search; Harcourt Brace Jovanovich: New York, NY, USA; London, UK, 1975; pp. 1586–1589. [Google Scholar]
- Monaghan, J.J. Smoothed Particle Hydrodynamics. World Sci. 2003, 30, 543–574. [Google Scholar]
- Huang, J.; Xu, J.L.; Gao, S.; Guo, J.T. Analysis of Factors Affecting Migration Trajectory of Sea Drift Based on Offshore Test. Mar. Forecasts 2014, 31, 98–104. [Google Scholar]
- Soza Company, Ltd. The Theory of Search A Simplified Explanation; Office of Search and Rescue U.S. Coast Guard: Washington, WA, USA, 1996; p. 101.
- Burciu, Z. Bayesian methods in reliability of search and rescue action. Pol. Marit. Res. 2010, 17, 72–78. [Google Scholar] [CrossRef][Green Version]
- Yu, M.; Xu, Z.J. Optimal Search Algorithm for Missing Target Based on Bayesian Approach. Comput. Mod. 2016, 10, 21–29. [Google Scholar]
- Zhou, C.Y.; Zhao, Y.T.; Sun, Y.Z. Missile Aircraft Discovery Probability Model Based on Bayesian Information Update. Math. Model. Appl. 2015, 4, 71–78. [Google Scholar]
- Menon, A.K.; Ong, C.S. Linking losses for density ratio and class-probability estimation. In Proceedings of the International Conference on International Conference on Machine Learning, Canberra, ACT, Australia, 19 June 2016. [Google Scholar]
- Coppini, G.; Jansen, E.; Turrisi, G.; Creti, S.; Shchekinova, E.Y.; Pinardi, N.; Lecci, R.; Carluccio, I.; Kumkar, Y.V.; D’Anca, A.; et al. A new search-and-rescue service in the Mediterranean Sea: A demonstration of the operational capability and an evaluation of its performance using real case scenarios. Nat. Hazards Earth Syst. Sci. Discuss. 2016, 16, 2713–2727. [Google Scholar] [CrossRef]
- International Maritime Organization. International Aeronautical and Maritime Search and Rescue Manual; IMO: London, UK, 2013; p. 1086. [Google Scholar]
- Liao, G.X.; Li, M.F. A GIS based decision-making Support System for Maritime search and rescue. In Proceedings of the International conference on E-Business and E-Government, Guangzhou, China, 7–9 May 2010. [Google Scholar]
- Wu, X.; Zhou, J.H. Research on probability of detection in maritime search and rescue. J. Saf. Sci. Technol. 2015, 11, 28–33. [Google Scholar]
- Liu, G.Q. Study on Determining the Width of Sweeping Sea in Maritime Search. Master’s Thesis, Dalian Maritime University, Dalian, China, 2009. [Google Scholar]
- Xiao, F.B. Research on the Key Technologies of Maritime Search and Rescue Decision Support System. Ph.D. Thesis, Dalian Maritime University, Dalian, China, 2009. [Google Scholar]
- Xiao, F.B.; Yi, Y.; Jin, Y.C.; Zhang, X.Y. Determination of maritime search area based on random particle simulation. Navig. China 2011, 34, 34–39. [Google Scholar]
- Jie, L.; Yao, S.; Zhang, Z. Research on subareas division problem of maritime search and rescue based on improved Monte Carlo algorithm. In Proceedings of the 2013 IEEE International Conference on Mechatronics and Automation, Takamatsu, Japan, 4–7 August 2013; pp. 1464–1468. [Google Scholar]
- Samik, R. Introduction to Monte Carlo Simulation. In Proceedings of the 2008 Winter Simulation Conference, Austin, TX, USA, 12 July 2008. [Google Scholar]
- Ai, B.; Liu, Y.M.; Wang, Z.H.; Sun, D.C. Evaluation of multi-scale representation of ocean flow fields using the Euler method based on map load. J. Spat. Sci. 2019. [Google Scholar] [CrossRef]


| Weather Condition Wind Speed /Wave Height | Search and Rescue Target (People/<10 m Life Raft) | Other Objects |
|---|---|---|
| 0–28/0–1 | 1.0 | 1.0 |
| 28–46/1–1.5 | 0.5 | 0.9 |
| >46/>1.5 | 0.25 | 0.9 |
| (pts.) | (pts.) | ||||||
|---|---|---|---|---|---|---|---|
| 346 | 500 | 9.88 | 55.83 | 35.02 | 8.96 | 3.91 | 0.98 |
| N | N-1 | r | W | L | Z | A | C | POD |
|---|---|---|---|---|---|---|---|---|
| 30 | 29 | 0.33 | 0.66 | 19.14 | 12.63 | 9.88 | 1.28 | 0.72 |
| POC | POD | POS |
|---|---|---|
| 0.98 | 0.72 | 0.7056 |
| (pts.) | ||
|---|---|---|
| 100 | 0.68 | 0.2 |
| 200 | 0.89 | 0.4 |
| 300 | 0.97 | 0.6 |
| 350 | 0.98 | 0.7 |
| 400 | 0.99 | 0.8 |
| N | N-1 | r | W | L | Z | A | C | POD |
|---|---|---|---|---|---|---|---|---|
| 15 | 14 | 0.33 | 0.66 | 9.24 | 6.094 | 9.88 | 0.66 | 0.46 |
| 0.72 | 0.46 | 0.72 > 0.46 |
© 2019 by the authors. Licensee MDPI, Basel, Switzerland. This article is an open access article distributed under the terms and conditions of the Creative Commons Attribution (CC BY) license (http://creativecommons.org/licenses/by/4.0/).
Share and Cite
Agbissoh OTOTE, D.; Li, B.; Ai, B.; Gao, S.; Xu, J.; Chen, X.; Lv, G. A Decision-Making Algorithm for Maritime Search and Rescue Plan. Sustainability 2019, 11, 2084. https://doi.org/10.3390/su11072084
Agbissoh OTOTE D, Li B, Ai B, Gao S, Xu J, Chen X, Lv G. A Decision-Making Algorithm for Maritime Search and Rescue Plan. Sustainability. 2019; 11(7):2084. https://doi.org/10.3390/su11072084
Chicago/Turabian StyleAgbissoh OTOTE, Donatien, Benshuai Li, Bo Ai, Song Gao, Jing Xu, Xiaoying Chen, and Guannan Lv. 2019. "A Decision-Making Algorithm for Maritime Search and Rescue Plan" Sustainability 11, no. 7: 2084. https://doi.org/10.3390/su11072084
APA StyleAgbissoh OTOTE, D., Li, B., Ai, B., Gao, S., Xu, J., Chen, X., & Lv, G. (2019). A Decision-Making Algorithm for Maritime Search and Rescue Plan. Sustainability, 11(7), 2084. https://doi.org/10.3390/su11072084