Belt and Road Initiative and Railway Sector Efficiency—Application of Networked Benchmarking Analysis


Abstract
1. Introduction
2. Railway Research of the Belt and Road Initiative
3. Research Methodology and Data Sources Used
4. Efficiency Analysis of Belt and Road Countries’ Railway Sector
4.1. DEA Efficiency Analysis with World Bank Data (2000–2005)
4.2. DEA Efficiency Analysis with UIC Data (2000–2016)
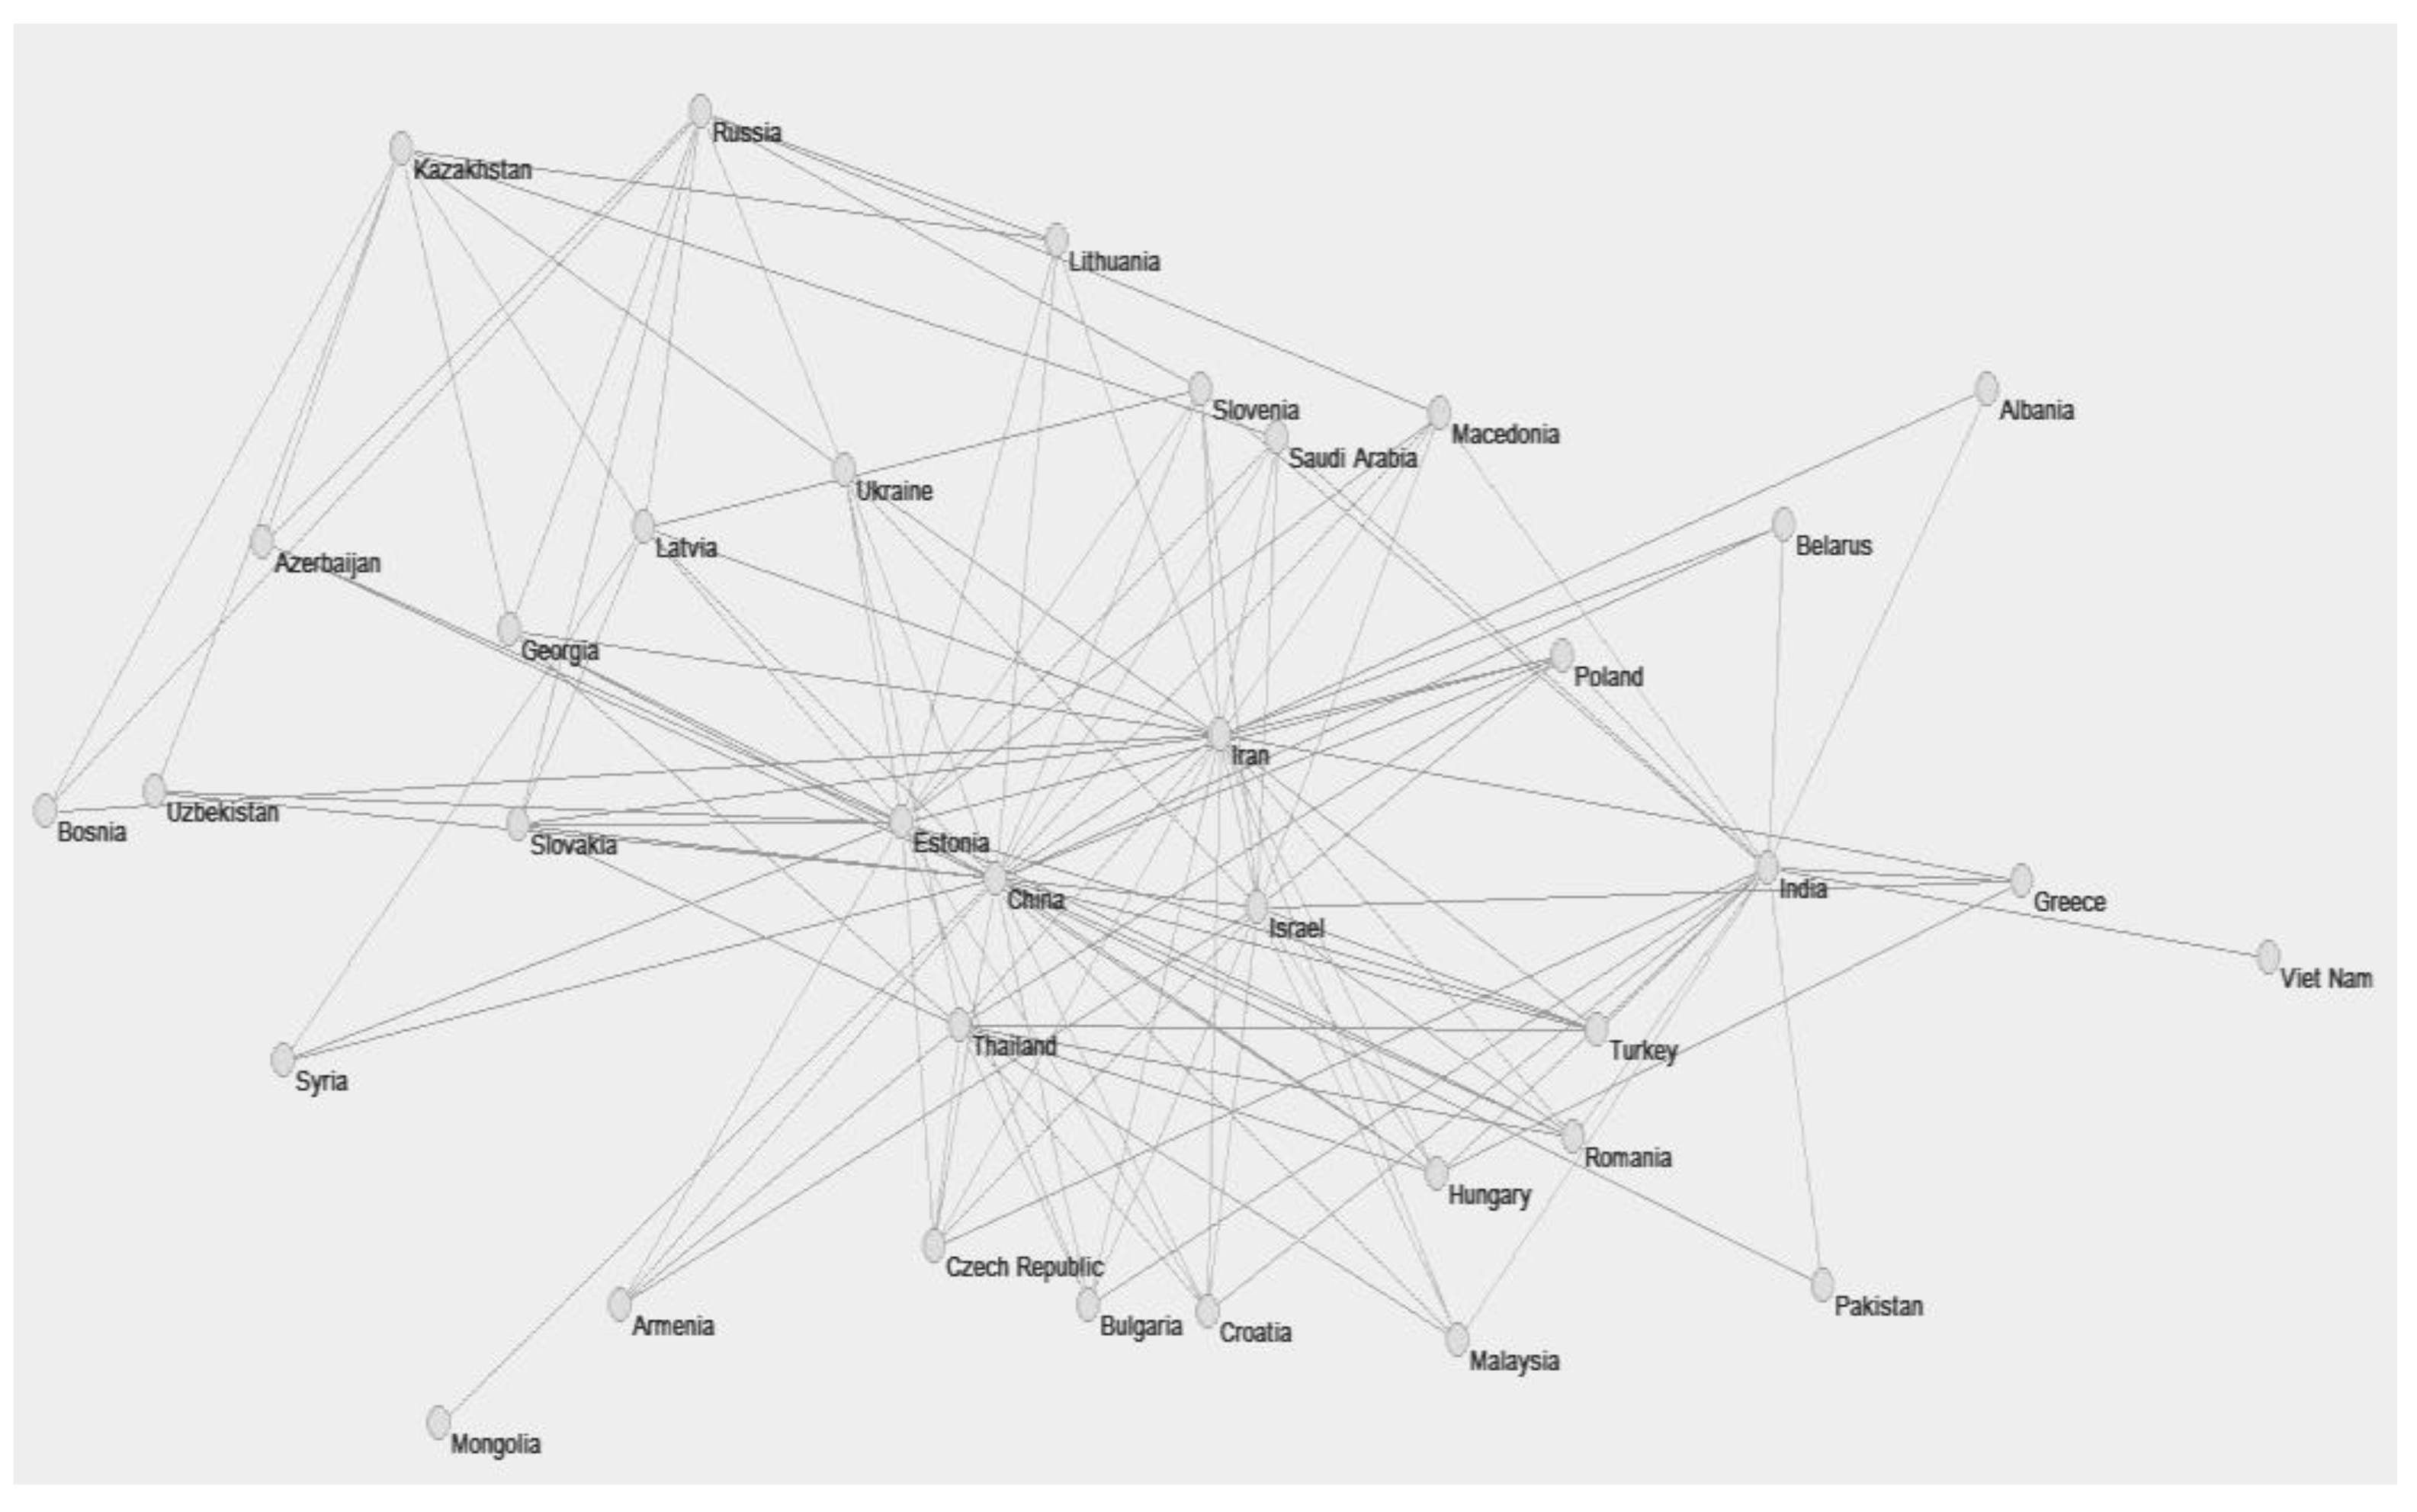
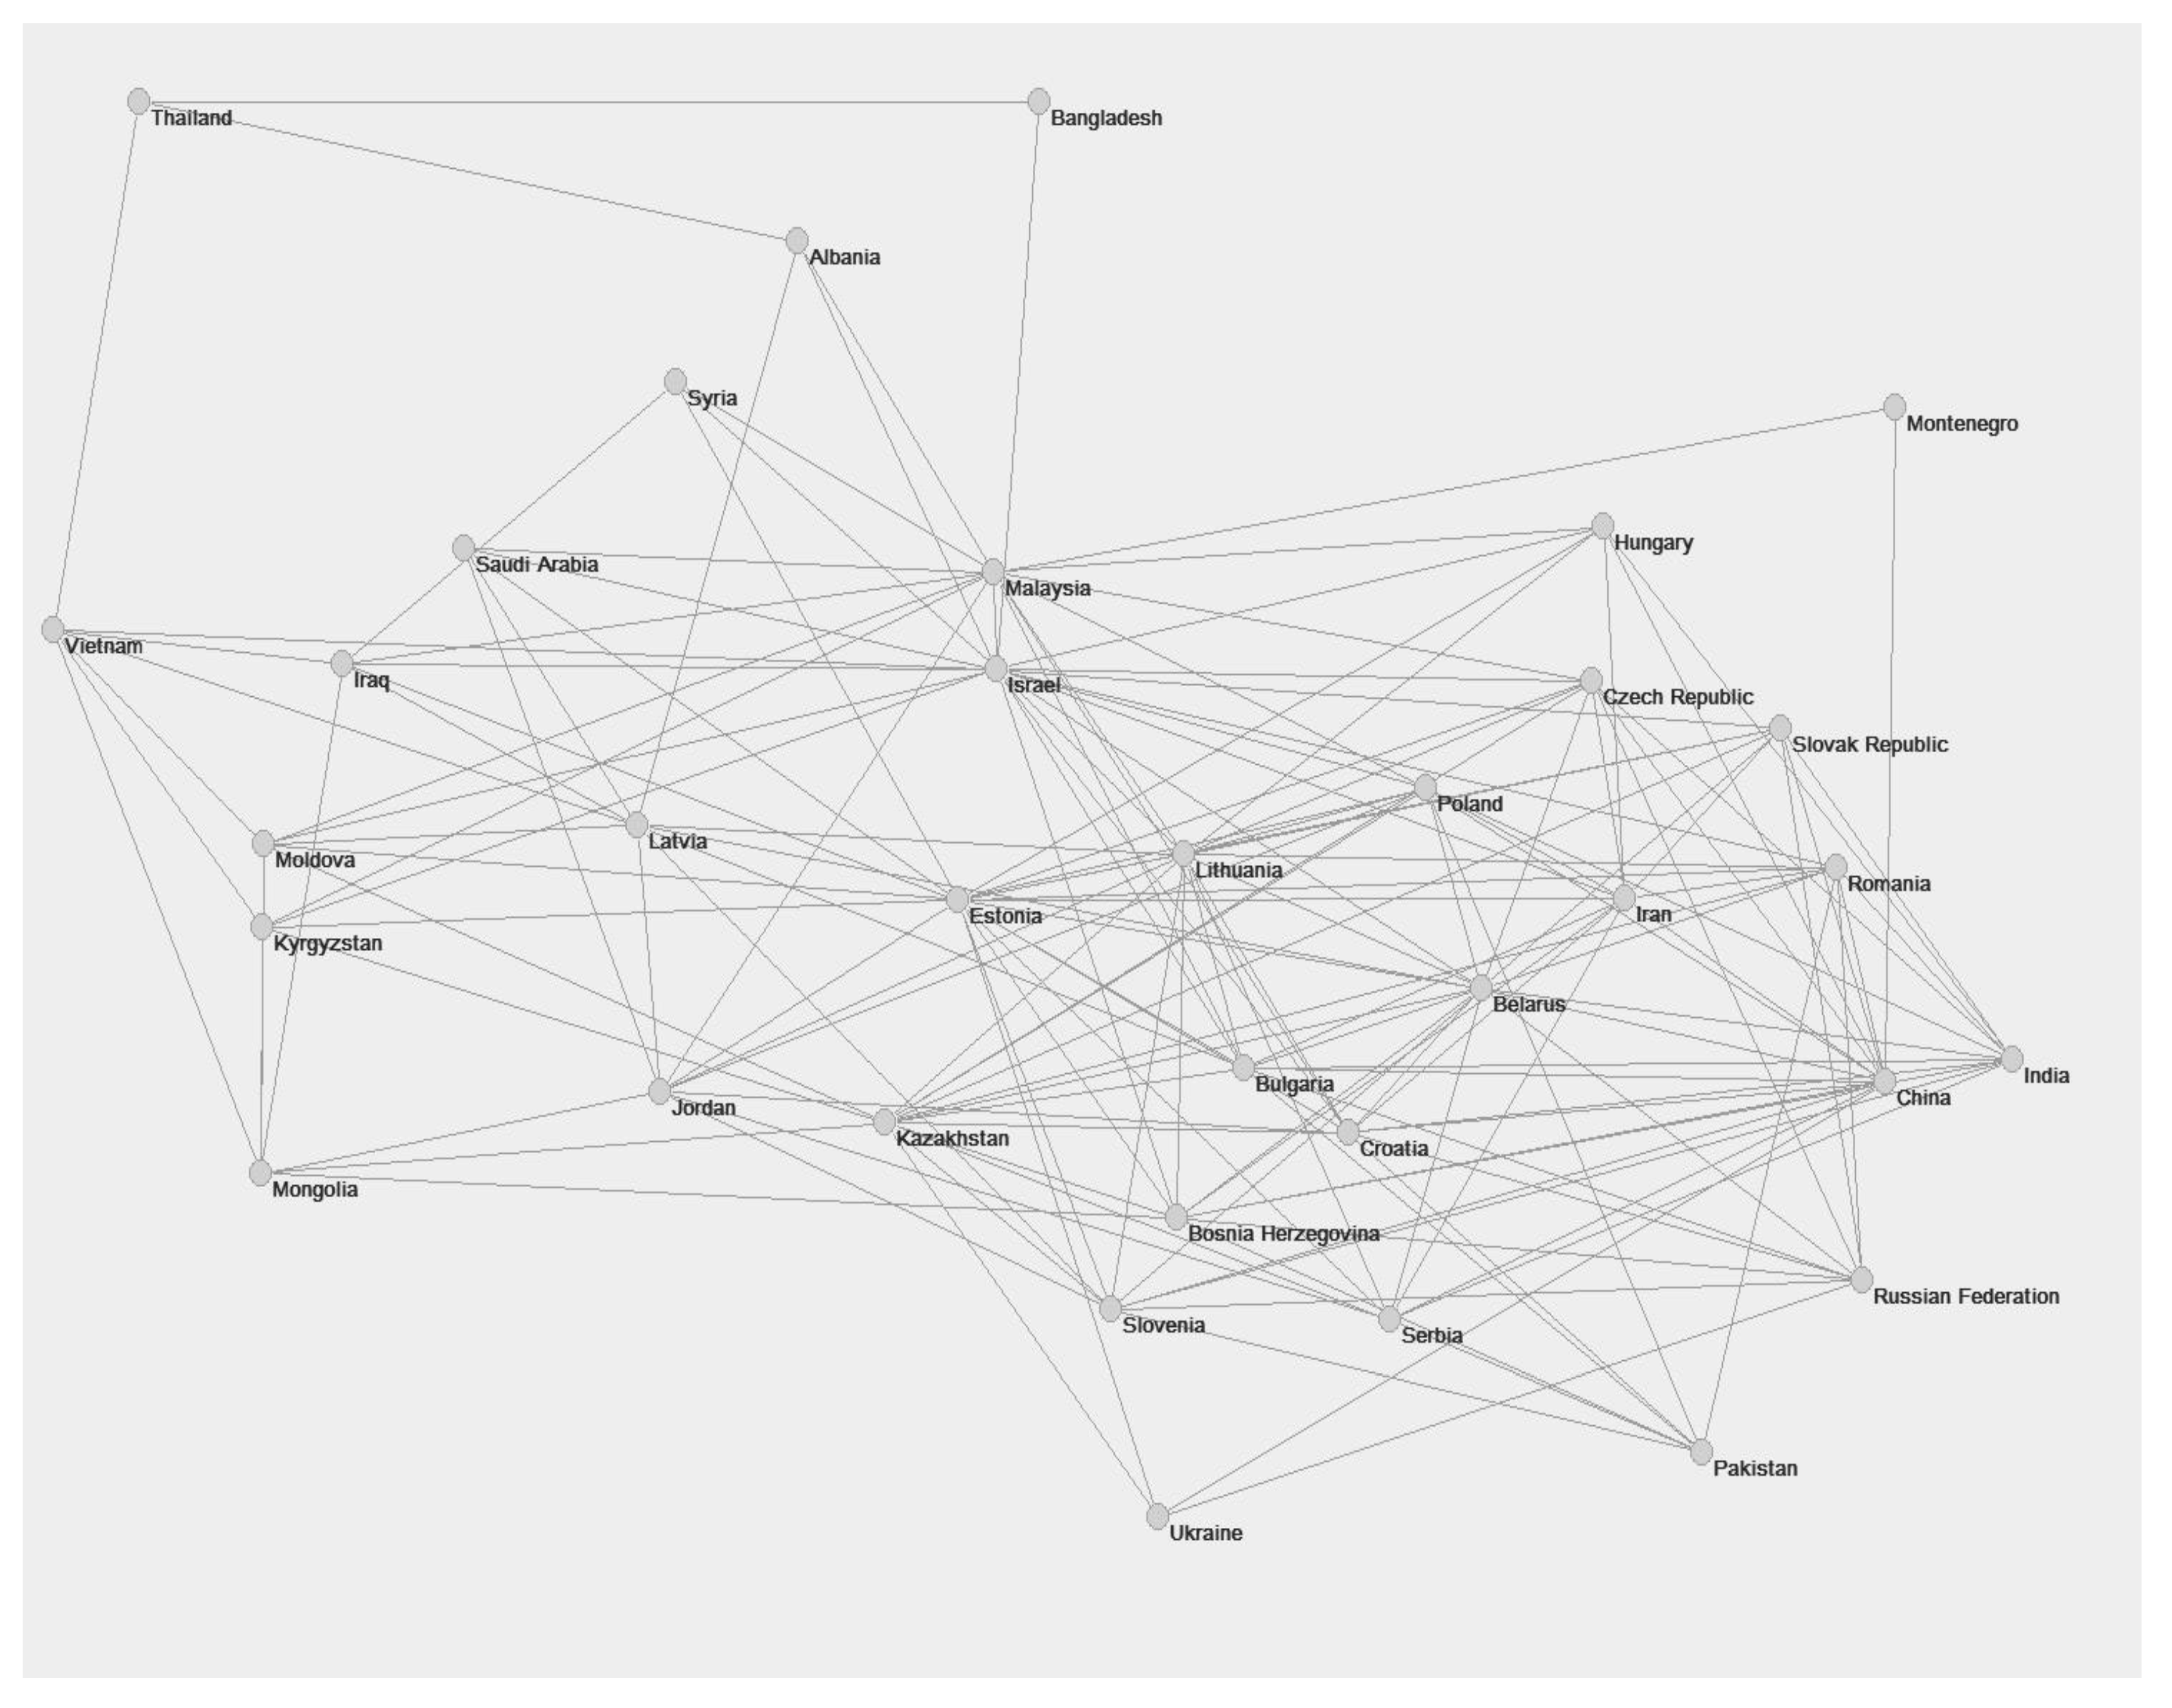
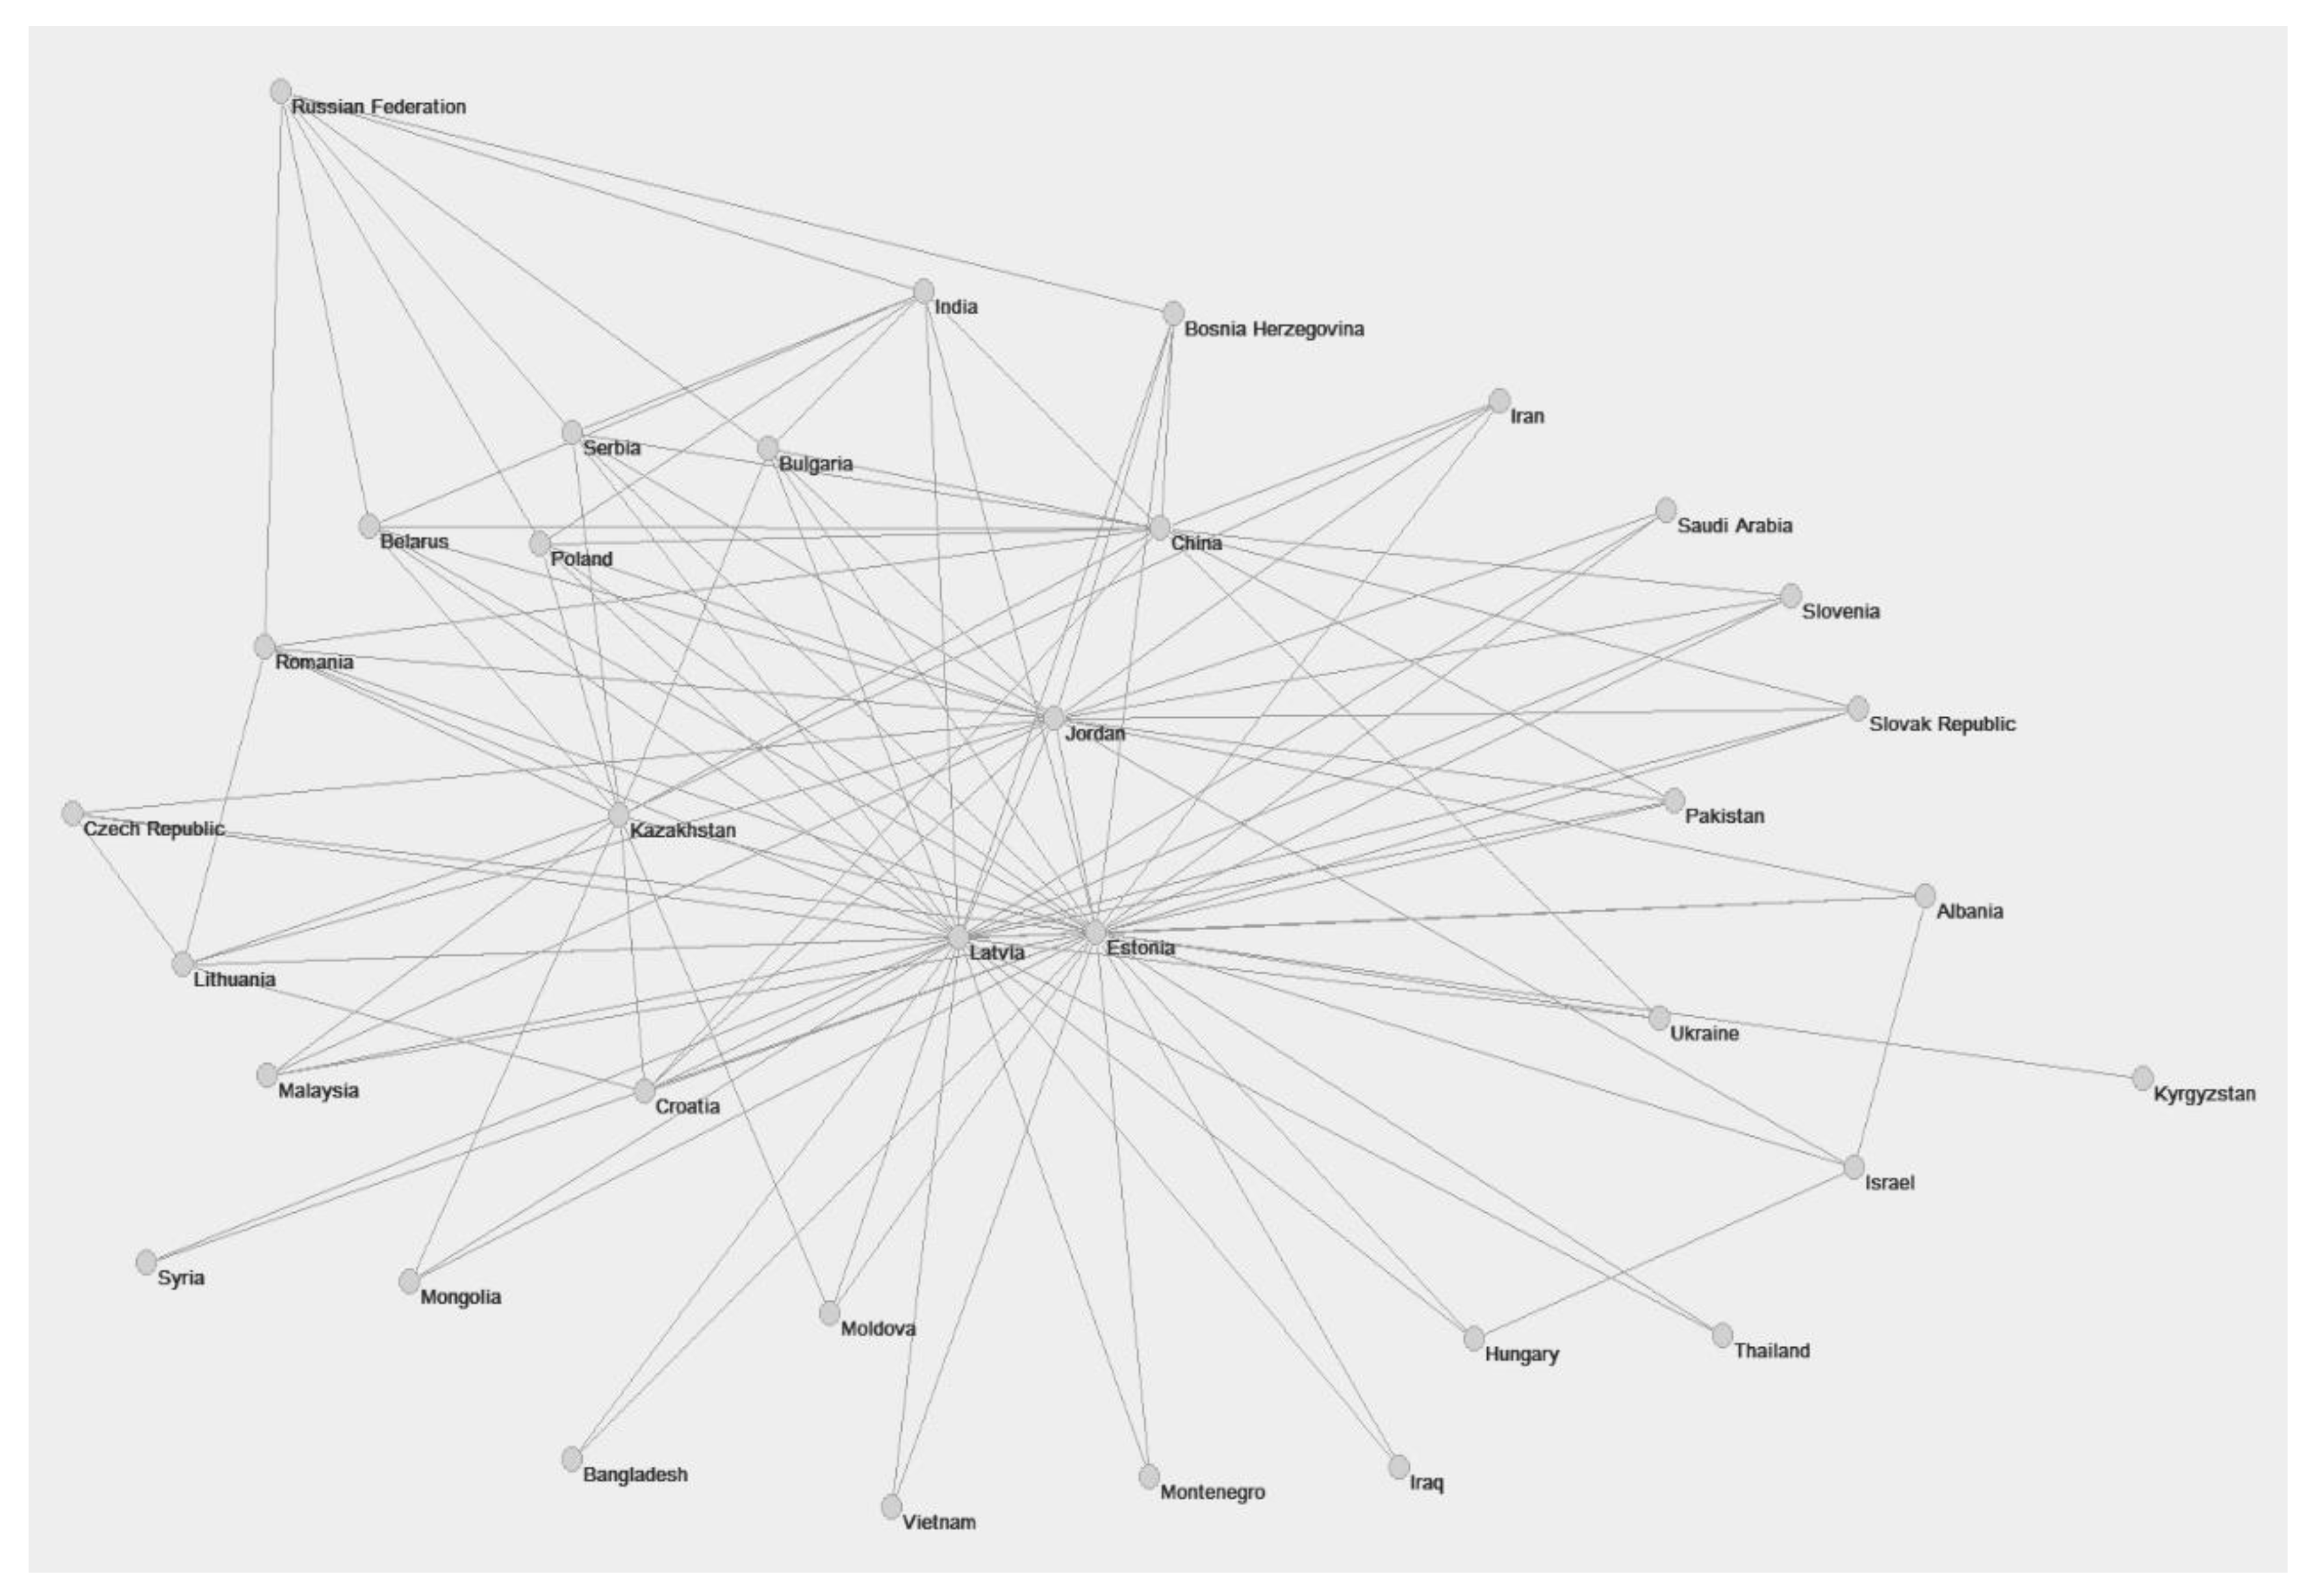
5. Using Network Analysis to Reveal Benchmarking Relationships
6. Conclusions
Author Contributions
Funding
Conflicts of Interest
References
- He, H. Key challenges and countermeasures with railway accessibility along the Silk Route. Engineering 2016, 2, 288–291. [Google Scholar] [CrossRef]
- Shaikh, F.; Ji, Q.; Fan, Y. Prospects of Pakistan–China energy and economic corridor. Renew. Sustain. Energy Rev. 2016, 59, 253–263. [Google Scholar] [CrossRef]
- Zeng, Q.; Wang, G.W.Y.; Qu, C.; Li, K.X. Impact of the Carat canal on the evolution of hub ports under China’s belt and road initiative. Transp. Res. Part E 2017, 117, 96–107. [Google Scholar] [CrossRef]
- Wang, J.J.; Yau, S. Case studies on transport infrastructure projects in belt and road initiative: An actor network theory perspective. J. Transp. Geogr. 2018. [Google Scholar] [CrossRef]
- Yang, D.; Pan, K.; Wang, S. On service network improvement for shipping lines under the one belt one road initiative of China. Transp. Res. Part E 2017. [Google Scholar] [CrossRef]
- Yang, D.; Jiang, L.; Ng, A.K.Y. One belt one road, but several routes: A case study of new emerging trade corridors connecting the Far East to Europe. Transp. Res. Part A 2018, 117, 190–204. [Google Scholar] [CrossRef]
- Jiang, Y.; Sheu, J.-B.; Peng, Z.; Yu, B. Hinterland patterns of China railway (CR) express in China under the Belt and Road Initiative: A preliminary analysis. Transp. Res. Part E 2018, 119, 189–201. [Google Scholar] [CrossRef]
- Hilmola, O.-P.; Henttu, V.; Panova, Y. Development of Asian Landbridge from Finland: Current State and Future prospects. 22nd Cambridge International Manufacturing Symposium, University of Cambridge, UK, 27–28 September 2018. Available online: https://www.repository.cam.ac.uk/bitstream/handle/1810/284350/3_development_of_asian_landbridge_from_finland_current_state_and_future_prospects.pdf?sequence=1&isAllowed=y (accessed on 20 December 2018).
- Gibson, J.; Li, C. The “Belt and Road Initiative” and comparative regional productivity in China. Asia Pac. Policy Stud. 2018, 5, 168–181. [Google Scholar] [CrossRef]
- Hilmola, O.-P. Benchmarking global railway freight transportation efficiency during the period of 1980–2004. Int. J. Shipp. Transp. Logist. 2009, 1, 311–328. [Google Scholar] [CrossRef]
- Hilmola, O.-P. Global railway passenger transports—Efficiency analysis from period of 1980–2004. Int. J. Logist. Econ. Glob. 2009, 2, 23–39. [Google Scholar] [CrossRef]
- Charnes, A.; Cooper, W.W.; Rhodes, E. Measuring the efficiency of decision making units. Eur. J. Oper. Res. 1978, 2, 429–444. [Google Scholar] [CrossRef]
- UIC. Railisa—UIC Statistics. Available online: https://uic-stats.uic.org/ (accessed on 10 January 2019).
- World Bank. Railway Database—Update 2007. Available online: http://siteresources.worldbank.org/EXTRAILWAYS/Resources/5152441268663980770/68638411276539314873/railways_database_2007.xls (accessed on 3 February 2019).
- Armstrong, J.; Preston, J. Alternative railway futures: Growth and/or specialisation? J. Transp. Geogr. 2011, 19, 1570–1579. [Google Scholar] [CrossRef]
- Kurosaki, F.; Alexandersson, G. Managing unprofitable passenger rail operations in Japan—Lessons from the experience in Sweden. Res. Transp. Econ. 2018, 69, 460–469. [Google Scholar] [CrossRef]
- Hilmola, O.-P.; Laisi, M. Shareholder value creation on deregulated transportation sector: Focus on North American railway freight. Expert Syst. Appl. 2015, 42, 113–124. [Google Scholar] [CrossRef]
- Jingjing, C.; Changjiang, Z.; Ming, Y. Research on rail transit network system and its connection model in the metropolitan area. Proc. Soc. Behav. Sci. 2013, 96, 1286–1292. [Google Scholar] [CrossRef]
- Stanton, N.A.; Mcllroy, R.C.; Harvey, C.; Blainey, S.; Hickford, A.; Preston, J.M.; Ryan, B. Following the cognitive work analysis train of thought: Exploring the constraints of modal shift to rail transport. Ergonomics 2013, 56, 522–540. [Google Scholar] [CrossRef] [PubMed]
- National Bureau of Statistics of China. China Statistical Yearbook 2018; China Statistics Press: Beijing, China, 2018. Available online: http://www.stats.gov.cn/tjsj/ndsj/2018/indexeh.htm (accessed on 27 January 2019).
- Li, J.; Wen, J.; Jiang, B. Spatial spillover effects of transport infrastructure in Chinese new silk road economic belt. Int. J. eNavig. Marit. Econ. 2017, 6, 1–8. [Google Scholar] [CrossRef]
- Gao, Y.; Li, W.; You, X. Research on the efficiency evaluation of China’s railway transport enterprises with network DEA. China Soft Sci. 2011, 5, 176–182. [Google Scholar]
- Li, Y.; Li, X.; Wang, S. Does the reform of the Ministry of Railways and the entry of high speed railway improve the technical efficiency of the railway industry? Reform Econ. Syst. 2018, 4, 179–186. [Google Scholar]
- Huang, Y. Understanding China’s belt & road initiative: Motivation, framework and assessment. China Econ. Rev. 2016, 40, 314–321. [Google Scholar]
- Shao, Z.-Z.; Ma, Z.-J.; Sheu, J.-B.; Gao, H.O. Evaluation of large-scale transnational high-speed railway construction priority in the belt and road region. Transp. Res. Part E 2017, 117, 40–57. [Google Scholar] [CrossRef]
- Tsuji, H. International container transport on the Trans-Siberian railway in 2005–2006: The end of Finland transit and expectations regarding Japanese use. Erina Rep. 2007, 73, 20–30. [Google Scholar]
- Hilmola, O.-P.; Lorentz, H. Confidence and supply chain disruptions: Insights into managerial decision-making from the perspective of policy. J. Model. Manag. 2012, 7, 328–356. [Google Scholar]
- Kuzmicz, K.A.; Pesch, E. Approaches to empty container repositioning problems in the context of Eurasian intermodal transportation. Omega 2018. [Google Scholar] [CrossRef]
- Al-Sayed, R.; Yang, J. Towards Chinese smart manufacturing ecosystem in the context of the one beltone road initiative. J. Sci. Technol. Policy Manag. 2019. [Google Scholar] [CrossRef]
- Yang, J.; McCarthy, P. Multi-modal transportation investment in Kazakhstan: Planning for trade and economic development in a post-soviet country. Proc. Soc. Behav. Sci. 2013, 96, 2105–2114. [Google Scholar] [CrossRef][Green Version]
- Xu, H. Domestic railroad infrastructure and exports: Evidence from the Silk Road. China Econ. Rev. 2016, 41, 129–147. [Google Scholar] [CrossRef]
- Ahmed, A.; Arshad, M.A.; Mahmood, A.; Akhtar, S. Neglecting human resource development in OBOR, a case of the China–Pakistan economic corridor (CPEC). J. Chin. Econ. Foreign Trade Stud. 2017, 10, 130–142. [Google Scholar] [CrossRef]
- Oum, T.H.; Yu, C. Economic efficiency of railways and implications for public policy. J. Transp. Econ. Policy 1994, 28, 121–138. [Google Scholar]
- Cantos, P.; Pastor, J.M.; Serrano, L. Productivity, efficiency and technical change in the European railways: A non-parametric approach. Transportation 1999, 26, 337–357. [Google Scholar] [CrossRef]
- Savolainen, V.-V.; Hilmola, O.-P. The relative technical efficiency of European transportation systems concerning air transport and railways. Int. J. Bus. Perform. Manag. 2011, 11, 19–42. [Google Scholar] [CrossRef]
- Hilmola, O.-P. European railway freight transportation and adaptation to demand decline—Efficiency and partial productivity analysis from period of 1980–2003. Int. J. Prod. Perform. Manag. 2007, 56, 205–225. [Google Scholar] [CrossRef]
- Sameni, M.K.; Preston, J.; Sameni, M.K. Evaluating efficiency of passenger railway stations: A DEA approach. Research Transp. Bus. Manag. 2016, 20, 33–38. [Google Scholar] [CrossRef]
- Samá, M.; Meloni, C.; D’Ariano, A.; Corman, F. A multi-criteria decision support methodology for real-time train scheduling. J. Rail Transp. Plan. Manag. 2015, 5, 146–162. [Google Scholar]
- Pittman, R. The freight railways of the former Soviet Union, twenty years on: Reforms lose steam. Res. Transp. Bus. Manag. 2013, 6, 99–115. [Google Scholar] [CrossRef]
- Lin, E.T.J. Route-based performance evaluation of Taiwanese domestic airlines using data envelopment analysis: A comment. Transp. Res. Part E Logist. Transp. Rev. 2007, 44, 894–899. [Google Scholar] [CrossRef]
- Chiou, Y.-C.; Chen, Y.-H. Route-based performance evaluation of Taiwanese domestic airlines using data envelopment analysis. Transp. Res. Part E Logist. Transp. Rev. 2006, 42, 116–127. [Google Scholar] [CrossRef]
- Marchetti, D.; Wanke, P.F. Efficiency in rail transport: Evaluation of the main drivers through meta-analysis with resampling. Transp. Res. Part A Policy Pract. 2019, 120, 83–100. [Google Scholar] [CrossRef]
- Lim, S.; Bae, H.; Lee, L.H. A study on the selection of benchmarking paths in DEA. Expert Syst. Appl. 2011, 38, 7665–7673. [Google Scholar] [CrossRef]
- Borrett, S.R.; Sheble, L.; Moody, J.; Anway, E.C. Bibliometric review of ecological network analysis: 2010–2016. Ecol. Model. 2018, 382, 63–82. [Google Scholar] [CrossRef]
- Zhang, W.; Zhuang, X. The stability of Chinese stock network and its mechanism. Physica A 2019, 515, 748–761. [Google Scholar] [CrossRef]
- Visvizi, A.; Lytras, M.D. Rescaling and refocusing smart cities research: From mega cities to smart villages. J. Sci. Technol. Policy Manag. 2018, 9, 134–145. [Google Scholar] [CrossRef]
- Visvizi, A.; Lytras, M.D.; Damiani, E.; Mathkour, H. Policy making for smart cities: Innovation and social inclusive economic growth for sustainability. J. Sci. Technol. Policy Manag. 2018, 9, 126–133. [Google Scholar] [CrossRef]


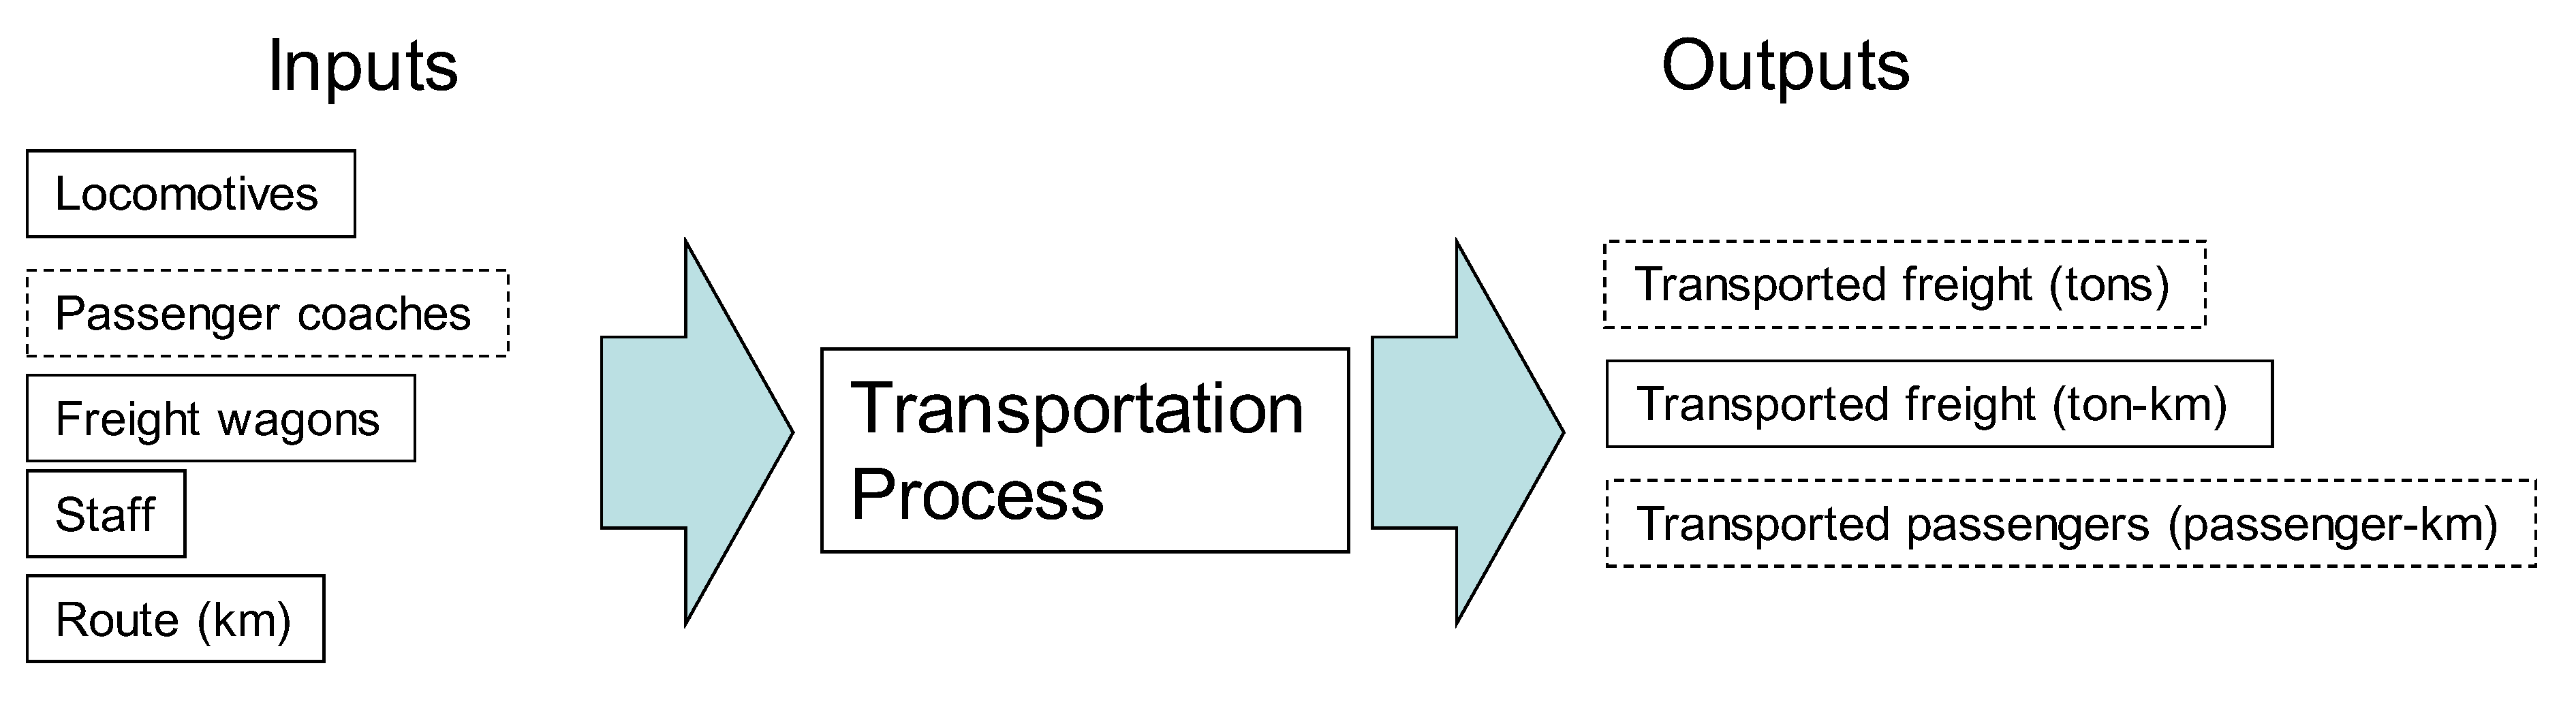
| Route {I} | Locomotives {I} | Staff {I} | F_wagon {I} | F_Tons {O} | F_Tonkms {O} | Passkms {O} | |
|---|---|---|---|---|---|---|---|
| Route {I} | 1.000 | ||||||
| Locomotives {I} | 0.927 | 1.000 | |||||
| Staff {I} | 0.921 | 0.944 | 1.000 | ||||
| F_wagon {I} | 0.918 | 0.982 | 0.908 | 1.000 | |||
| F_Tons {O} | 0.823 | 0.956 | 0.909 | 0.951 | 1.000 | ||
| F_Tonkms {O} | 0.812 | 0.925 | 0.872 | 0.939 | 0.978 | 1.000 | |
| Passkms {O} | 0.917 | 0.878 | 0.951 | 0.831 | 0.827 | 0.778 | 1.000 |
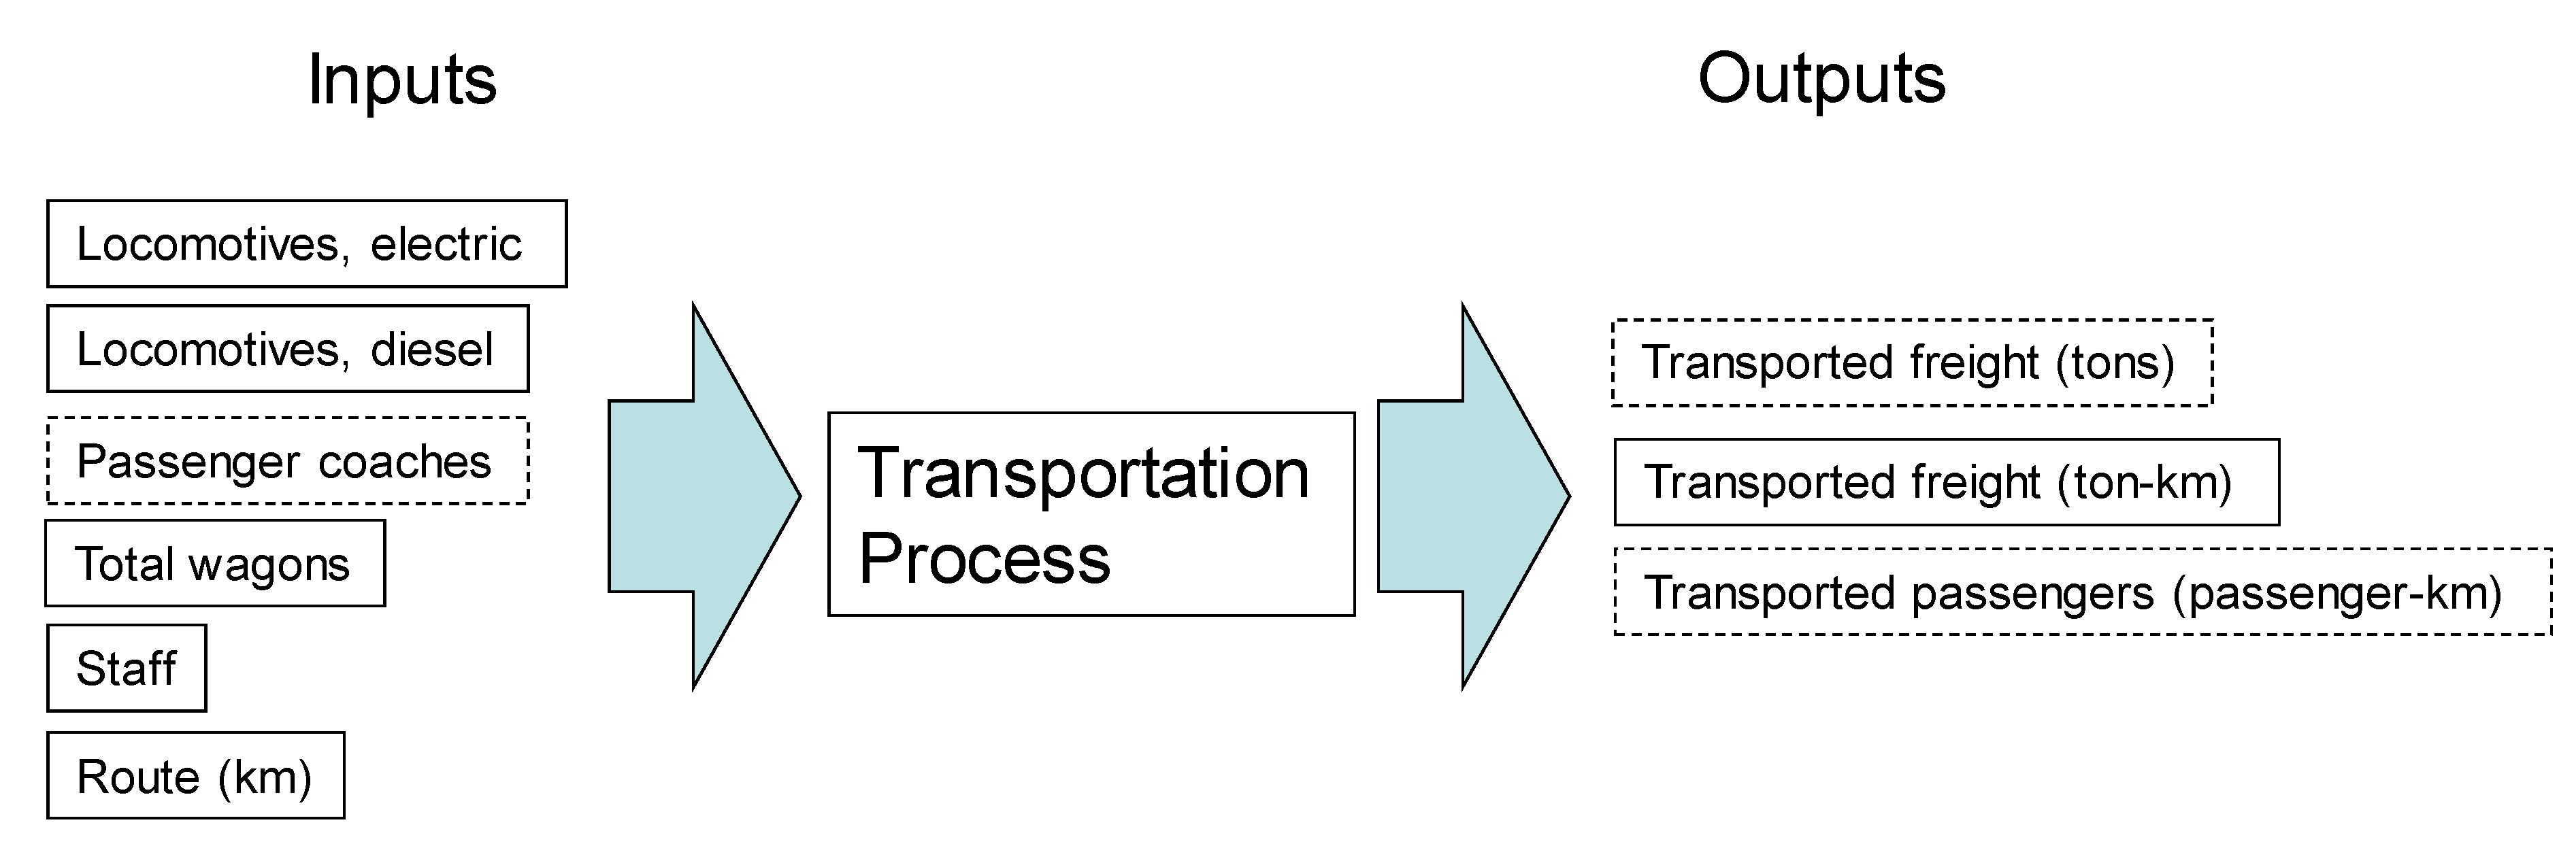
| Tracks (km) {I} | Dlocos {I} | Elocos {I} | Wagons {I} | Staff {I} | Freight (tn) {O} | Freight (tkm) {O} | Pass (pkm) {O} | |
|---|---|---|---|---|---|---|---|---|
| Tracks (km) {I} | 1.000 | |||||||
| Dlocos {I} | 0.955 | 1.000 | ||||||
| Elocos {I} | 0.906 | 0.911 | 1.000 | |||||
| Wagons {I} | 0.912 | 0.933 | 0.868 | 1.000 | ||||
| Staff {I} | 0.965 | 0.932 | 0.876 | 0.918 | 1.000 | |||
| Freight (tn) {O} | 0.901 | 0.946 | 0.905 | 0.951 | 0.928 | 1.000 | ||
| Freight (tkm) {O} | 0.840 | 0.922 | 0.928 | 0.880 | 0.860 | 0.962 | 1.000 | |
| Pass (pkm) {O} | 0.888 | 0.777 | 0.756 | 0.760 | 0.912 | 0.782 | 0.679 | 1.000 |
| Country | 2000 | 2001 | 2002 | 2003 | 2004 | 2005 | Average |
|---|---|---|---|---|---|---|---|
| Bosnia-Herzegovina | 0.058 | 0.058 | |||||
| Armenia | 0.067 | 0.067 | |||||
| Albania | 0.077 | 0.071 | 0.074 | ||||
| Macedonia | 0.163 | 0.106 | 0.108 | 0.105 | 0.107 | 0.118 | |
| Syria | 0.177 | 0.188 | 0.182 | ||||
| Azerbaijan | 0.185 | 0.241 | 0.213 | ||||
| Bulgaria | 0.305 | 0.256 | 0.199 | 0.191 | 0.181 | 0.169 | 0.217 |
| Georgia | 0.257 | 0.253 | 0.264 | 0.194 | 0.257 | 0.245 | |
| Croatia | 0.264 | 0.228 | 0.303 | 0.315 | 0.199 | 0.200 | 0.251 |
| Czech Republic | 0.340 | 0.330 | 0.262 | 0.239 | 0.224 | 0.209 | 0.267 |
| Slovakia | 0.343 | 0.357 | 0.286 | 0.270 | 0.220 | 0.374 | 0.308 |
| Romania | 0.379 | 0.355 | 0.273 | 0.271 | 0.270 | 0.310 | |
| Hungary | 0.350 | 0.505 | 0.329 | 0.322 | 0.323 | 0.298 | 0.355 |
| Vietnam | 0.406 | 0.360 | 0.354 | 0.373 | |||
| Poland | 0.511 | 0.405 | 0.369 | 0.382 | 0.323 | 0.288 | 0.379 |
| Slovenia | 0.447 | 0.406 | 0.466 | 0.320 | 0.265 | 0.381 | |
| Greece | 0.444 | 0.533 | 0.400 | 0.418 | 0.449 | ||
| Uzbekistan | 0.381 | 0.536 | 0.458 | ||||
| Turkey | 0.520 | 0.567 | 0.490 | 0.560 | 0.470 | 0.393 | 0.500 |
| Lithuania | 0.519 | 0.602 | 0.588 | 0.596 | 0.531 | 0.567 | |
| Saudi Arabia | 0.658 | 0.623 | 0.428 | 0.521 | 0.627 | 0.607 | 0.577 |
| Malaysia | 0.654 | 0.663 | 0.721 | 0.659 | 0.510 | 0.641 | |
| Belarus | 0.714 | 0.635 | 0.618 | 0.656 | |||
| Ukraine | 0.740 | 0.822 | 0.728 | 0.653 | 0.460 | 0.681 | |
| Mongolia | 0.776 | 0.942 | 0.859 | ||||
| Latvia | 0.914 | 1.000 | 1.000 | 1.000 | 0.734 | 0.966 | 0.936 |
| Pakistan | 0.982 | 0.923 | 0.971 | 0.996 | 0.963 | 0.848 | 0.947 |
| Iran | 0.865 | 1.000 | 1.000 | 1.000 | 1.000 | 1.000 | 0.978 |
| China | 1.000 | 1.000 | 1.000 | 1.000 | 1.000 | 1.000 | 1.000 |
| Estonia | 1.000 | 1.000 | 1.000 | 1.000 | 1.000 | 1.000 | 1.000 |
| India | 1.000 | 1.000 | 1.000 | 1.000 | 1.000 | 1.000 | 1.000 |
| Israel | 1.000 | 1.000 | 1.000 | 1.000 | 1.000 | 1.000 | 1.000 |
| Kazakhstan | 1.000 | 1.000 | 1.000 | 1.000 | |||
| Russia | 1.000 | 1.000 | |||||
| Thailand | 1.000 | 1.000 | 1.000 | ||||
| Average | 0.594 | 0.595 | 0.576 | 0.619 | 0.531 | 0.540 | |
| n | 24 | 23 | 26 | 22 | 29 | 29 |
| Country | 2000 | 2001 | 2002 | 2003 | 2004 | 2005 | Average |
|---|---|---|---|---|---|---|---|
| Armenia | 0.061 | 0.061 | |||||
| Albania | 0.078 | 0.079 | 0.036 | 0.064 | |||
| Pakistan | 0.071 | 0.081 | 0.083 | 0.079 | 0.071 | 0.073 | 0.076 |
| Greece | 0.116 | 0.090 | 0.118 | 0.134 | 0.069 | 0.105 | |
| Macedonia | 0.176 | 0.166 | 0.194 | 0.149 | 0.171 | ||
| Bulgaria | 0.146 | 0.190 | 0.183 | 0.208 | 0.213 | 0.129 | 0.178 |
| Syria | 0.179 | 0.200 | 0.190 | ||||
| Romania | 0.168 | 0.160 | 0.139 | 0.247 | 0.251 | 0.193 | |
| Vietnam | 0.233 | 0.241 | 0.173 | 0.216 | |||
| Malaysia | 0.255 | 0.276 | 0.236 | 0.233 | 0.120 | 0.224 | |
| Thailand | 0.221 | 0.254 | 0.238 | ||||
| Turkey | 0.290 | 0.271 | 0.247 | 0.267 | 0.271 | 0.169 | 0.252 |
| Georgia | 0.256 | 0.253 | 0.264 | 0.350 | 0.279 | 0.280 | |
| Poland | 0.286 | 0.242 | 0.302 | 0.329 | 0.368 | 0.185 | 0.285 |
| Hungary | 0.261 | 0.300 | 0.318 | 0.317 | 0.388 | 0.193 | 0.296 |
| Saudi Arabia | 0.298 | 0.266 | 0.271 | 0.305 | 0.413 | 0.238 | 0.299 |
| Bosnia-Herzegovina | 0.341 | 0.257 | 0.299 | ||||
| Czech Republic | 0.234 | 0.297 | 0.327 | 0.410 | 0.383 | 0.171 | 0.304 |
| Croatia | 0.323 | 0.419 | 0.391 | 0.417 | 0.306 | 0.143 | 0.333 |
| Slovakia | 0.367 | 0.363 | 0.356 | 0.518 | 0.500 | 0.568 | 0.445 |
| Slovenia | 0.388 | 0.482 | 0.640 | 0.677 | 0.302 | 0.498 | |
| India | 0.463 | 0.489 | 0.501 | 0.542 | 0.533 | 0.517 | 0.508 |
| Uzbekistan | 0.411 | 0.623 | 0.517 | ||||
| Ukraine | 0.620 | 0.665 | 0.623 | 0.693 | 0.499 | 0.620 | |
| Lithuania | 0.519 | 0.582 | 0.633 | 0.940 | 0.601 | 0.655 | |
| Iran | 0.523 | 0.638 | 1.000 | 1.000 | 1.000 | 0.447 | 0.768 |
| Jordan | 0.564 | 1.000 | 0.782 | ||||
| Belarus | 0.866 | 0.863 | 0.705 | 0.811 | |||
| Mongolia | 0.932 | 0.953 | 0.942 | ||||
| Israel | 1.000 | 1.000 | 1.000 | 1.000 | 1.000 | 0.858 | 0.976 |
| Latvia | 0.914 | 1.000 | 1.000 | 1.000 | 1.000 | 1.000 | 0.986 |
| China | 1.000 | 1.000 | 1.000 | 1.000 | 1.000 | 1.000 | 1.000 |
| Estonia | 1.000 | 1.000 | 1.000 | 1.000 | 1.000 | 1.000 | 1.000 |
| Kazakhstan | 1.000 | 1.000 | 1.000 | 1.000 | |||
| Russia | 1.000 | 1.000 | |||||
| Average | 0.404 | 0.437 | 0.517 | 0.479 | 0.556 | 0.430 | |
| n | 24 | 25 | 27 | 23 | 27 | 29 |
| Country | 2000 | 2001 | 2002 | 2003 | 2004 | 2005 | 2006 | 2007 | 2008 | 2009 | 2010 | 2011 | 2012 | 2013 | 2014 | 2015 | 2016 | Average |
|---|---|---|---|---|---|---|---|---|---|---|---|---|---|---|---|---|---|---|
| Bosnia-Herzegovina | 0.031 | 0.034 | 0.041 | 0.072 | 0.114 | 0.340 | 0.101 | 0.107 | 0.236 | 0.107 | 0.121 | 0.100 | 0.127 | 0.154 | 0.253 | 0.121 | 0.071 | 0.125 |
| Iraq | 0.223 | 0.255 | 0.055 | 0.063 | 0.149 | |||||||||||||
| Albania | 0.276 | 0.105 | 0.159 | 0.090 | 0.157 | |||||||||||||
| Serbia | 0.176 | 0.131 | 0.172 | 0.148 | 0.167 | 0.303 | 0.142 | 0.166 | 0.119 | 0.106 | 0.122 | 0.167 | 0.160 | |||||
| Bulgaria | 0.310 | 0.227 | 0.201 | 0.317 | 0.206 | 0.198 | 0.184 | 0.166 | 0.213 | 0.125 | 0.129 | 0.171 | 0.297 | 0.313 | 0.207 | 0.107 | 0.102 | 0.204 |
| Romania | 0.386 | 0.248 | 0.189 | 0.345 | 0.254 | 0.272 | 0.236 | 0.214 | 0.155 | 0.165 | 0.163 | 0.148 | 0.157 | 0.186 | 0.157 | 0.255 | 0.215 | |
| Slovakia | 0.251 | 0.225 | 0.198 | 0.387 | 0.177 | 0.234 | 0.202 | 0.202 | 0.305 | 0.179 | 0.214 | 0.165 | 0.189 | 0.206 | 0.245 | 0.187 | 0.199 | 0.221 |
| Croatia | 0.187 | 0.208 | 0.209 | 0.287 | 0.214 | 0.245 | 0.266 | 0.296 | 0.337 | 0.298 | 0.277 | 0.216 | 0.219 | 0.197 | 0.226 | 0.170 | 0.157 | 0.236 |
| Montenegro | 0.239 | 0.239 | ||||||||||||||||
| Czech Republic | 0.294 | 0.232 | 0.208 | 0.335 | 0.231 | 0.233 | 0.276 | 0.272 | 0.294 | 0.245 | 0.253 | 0.223 | 0.283 | 0.311 | 0.246 | 0.250 | 0.261 | |
| Kyrgyzstan | 0.209 | 0.370 | 0.497 | 0.275 | 0.224 | 0.315 | ||||||||||||
| Poland | 0.375 | 0.312 | 0.311 | 0.492 | 0.361 | 0.338 | 0.348 | 0.343 | 0.364 | 0.281 | 0.313 | 0.274 | 0.335 | 0.340 | 0.325 | 0.341 | ||
| Hungary | 0.430 | 0.362 | 0.397 | 0.435 | 0.341 | 0.335 | 0.265 | 0.390 | 0.369 | |||||||||
| Syria | 0.247 | 0.461 | 0.314 | 0.214 | 1.000 | 0.447 | ||||||||||||
| Slovenia | 0.320 | 0.335 | 0.361 | 0.515 | 0.442 | 0.461 | 0.372 | 0.436 | 0.733 | 0.555 | 0.499 | 0.488 | 0.609 | 0.702 | 0.524 | 0.514 | 0.492 | |
| Moldova | 0.616 | 0.441 | 0.474 | 0.686 | 0.685 | 0.576 | 0.544 | 0.340 | 0.190 | 0.506 | ||||||||
| Jordan | 0.413 | 1.000 | 0.024 | 0.395 | 0.756 | 0.518 | ||||||||||||
| Ukraine | 0.537 | 0.532 | 0.556 | 0.587 | 0.553 | |||||||||||||
| Belarus | 1.000 | 1.000 | 0.940 | 0.829 | 0.651 | 1.000 | 0.905 | 0.760 | 0.751 | 0.514 | 0.564 | 0.893 | 0.407 | 0.429 | 0.760 | |||
| Saudi Arabia | 0.930 | 0.670 | 0.756 | 0.852 | 0.725 | 0.724 | 1.000 | 0.808 | ||||||||||
| Lithuania | 0.605 | 0.588 | 0.647 | 0.639 | 0.622 | 0.584 | 0.596 | 0.787 | 1.000 | 0.991 | 1.000 | 1.000 | 1.000 | 1.000 | 1.000 | 1.000 | 1.000 | 0.827 |
| Bangladesh | 0.664 | 1.000 | 0.832 | |||||||||||||||
| Vietnam | 0.837 | 0.668 | 0.808 | 1.000 | 1.000 | 0.863 | ||||||||||||
| Mongolia | 1.000 | 1.000 | 1.000 | 0.875 | 0.969 | |||||||||||||
| Iran | 1.000 | 0.927 | 1.000 | 1.000 | 1.000 | 1.000 | 1.000 | 1.000 | 1.000 | 1.000 | 1.000 | 1.000 | 1.000 | 1.000 | 0.995 | |||
| Malaysia | 1.000 | 0.951 | 1.000 | 1.000 | 1.000 | 0.993 | 1.000 | 1.000 | 1.000 | 1.000 | 1.000 | 0.995 | ||||||
| China | 1.000 | 1.000 | 1.000 | 1.000 | 1.000 | 1.000 | 1.000 | 1.000 | 1.000 | 1.000 | ||||||||
| Estonia | 1.000 | 1.000 | 1.000 | 1.000 | 1.000 | 1.000 | 1.000 | 1.000 | 1.000 | |||||||||
| India | 1.000 | 1.000 | 1.000 | 1.000 | 1.000 | 1.000 | 1.000 | 1.000 | 1.000 | 1.000 | 1.000 | 1.000 | ||||||
| Israel | 1.000 | 1.000 | 1.000 | 1.000 | 1.000 | 1.000 | ||||||||||||
| Kazakhstan | 1.000 | 1.000 | 1.000 | 1.000 | 1.000 | 1.000 | ||||||||||||
| Latvia | 1.000 | 1.000 | 1.000 | 1.000 | 1.000 | 1.000 | 1.000 | 1.000 | 1.000 | |||||||||
| Pakistan | 1.000 | 1.000 | 1.000 | 1.000 | 1.000 | |||||||||||||
| Russian Federation | 1.000 | 1.000 | 1.000 | 1.000 | ||||||||||||||
| Thailand | 1.000 | 1.000 | ||||||||||||||||
| Average | 0.593 | 0.586 | 0.590 | 0.607 | 0.506 | 0.520 | 0.541 | 0.574 | 0.620 | 0.551 | 0.528 | 0.510 | 0.439 | 0.459 | 0.496 | 0.516 | 0.498 | |
| N | 19 | 27 | 23 | 21 | 22 | 23 | 20 | 24 | 23 | 19 | 14 | 19 | 13 | 13 | 13 | 11 | 12 |
| Country | 2000 | 2001 | 2002 | 2003 | 2004 | 2005 | 2006 | 2007 | 2008 | 2009 | 2010 | 2011 | 2012 | 2013 | 2014 | 2015 | 2016 | Average |
|---|---|---|---|---|---|---|---|---|---|---|---|---|---|---|---|---|---|---|
| Bangladesh | 0.031 | 0.038 | 0.045 | 0.038 | ||||||||||||||
| Albania | 0.041 | 0.041 | 0.036 | 0.040 | 0.051 | 0.049 | 0.072 | 0.047 | ||||||||||
| Iraq | 0.101 | 0.124 | 0.150 | 0.054 | 0.014 | 0.089 | ||||||||||||
| Pakistan | 0.085 | 0.101 | 0.113 | 0.089 | 0.098 | 0.117 | 0.114 | 0.103 | ||||||||||
| Thailand | 0.167 | 0.167 | ||||||||||||||||
| Malaysia | 0.161 | 0.185 | 0.215 | 0.177 | 0.151 | 0.124 | 0.167 | 0.166 | 0.169 | 0.178 | 0.172 | 0.198 | 0.172 | |||||
| Serbia | 0.195 | 0.155 | 0.170 | 0.181 | 0.260 | 0.239 | 0.157 | 0.173 | 0.151 | 0.126 | 0.162 | 0.176 | 0.179 | |||||
| Romania | 0.147 | 0.146 | 0.121 | 0.251 | 0.175 | 0.146 | 0.134 | 0.190 | 0.187 | 0.120 | 0.113 | 0.131 | 0.123 | 0.186 | 0.206 | 0.223 | 0.503 | 0.182 |
| Syria | 0.174 | 0.174 | 0.124 | 0.123 | 0.271 | 0.231 | 0.183 | |||||||||||
| Bulgaria | 0.176 | 0.163 | 0.228 | 0.254 | 0.189 | 0.180 | 0.172 | 0.240 | 0.226 | 0.127 | 0.146 | 0.263 | 0.233 | 0.263 | 0.194 | 0.264 | 0.218 | 0.208 |
| Croatia | 0.116 | 0.166 | 0.224 | 0.255 | 0.190 | 0.211 | 0.226 | 0.377 | 0.346 | 0.232 | 0.220 | 0.204 | 0.206 | 0.242 | 0.242 | 0.243 | 0.239 | 0.232 |
| Montenegro | 0.158 | 0.166 | 0.229 | 0.365 | 0.362 | 0.281 | 0.260 | |||||||||||
| Czech Republic | 0.232 | 0.232 | 0.237 | 0.257 | 0.185 | 0.168 | 0.179 | 0.278 | 0.306 | 0.266 | 0.240 | 0.238 | 0.245 | 0.319 | 0.312 | 0.363 | 0.387 | 0.261 |
| Vietnam | 0.234 | 0.176 | 0.277 | 0.300 | 0.343 | 0.266 | ||||||||||||
| Hungary | 0.235 | 0.233 | 0.305 | 0.237 | 0.213 | 0.260 | 0.336 | 0.332 | 0.269 | |||||||||
| Poland | 0.286 | 0.256 | 0.330 | 0.329 | 0.250 | 0.251 | 0.218 | 0.296 | 0.266 | 0.197 | 0.231 | 0.312 | 0.242 | 0.307 | 0.298 | 0.271 | ||
| Slovakia | 0.340 | 0.339 | 0.338 | 0.359 | 0.270 | 0.249 | 0.261 | 0.327 | 0.349 | 0.238 | 0.241 | 0.263 | 0.266 | 0.311 | 0.307 | 0.331 | 0.394 | 0.305 |
| Saudi Arabia | 0.328 | 0.258 | 0.176 | 0.267 | 0.277 | 0.441 | 0.475 | 0.317 | ||||||||||
| Moldova | 0.272 | 0.364 | 0.371 | 0.455 | 0.421 | 0.425 | 0.479 | 0.514 | 0.185 | 0.115 | 0.105 | 0.149 | 0.321 | |||||
| Bosnia-Herzegovina | 0.170 | 0.193 | 0.233 | 0.275 | 0.597 | 0.798 | 0.349 | 0.460 | 0.536 | 0.453 | 0.442 | 0.565 | 0.581 | 0.616 | 0.624 | 0.652 | 0.719 | 0.486 |
| Kyrgyzstan | 0.265 | 0.477 | 0.895 | 0.695 | 0.692 | 0.605 | ||||||||||||
| Iran | 0.449 | 0.402 | 0.509 | 0.475 | 0.449 | 0.501 | 0.647 | 0.606 | 0.498 | 0.523 | 0.582 | 0.837 | 1.000 | 1.000 | 1.000 | 1.000 | 0.655 | |
| Jordan | 0.329 | 0.424 | 1.000 | 0.602 | 0.493 | 0.809 | 0.643 | 0.944 | 0.655 | |||||||||
| Slovenia | 0.420 | 0.443 | 0.652 | 0.790 | 0.545 | 0.528 | 0.540 | 0.815 | 0.799 | 0.530 | 0.546 | 0.579 | 0.767 | 0.825 | 0.816 | 0.957 | 0.659 | |
| Ukraine | 0.685 | 0.691 | 0.737 | 0.623 | 0.684 | |||||||||||||
| Lithuania | 0.493 | 0.434 | 0.676 | 0.739 | 0.608 | 0.569 | 0.580 | 0.797 | 0.867 | 0.629 | 0.675 | 0.781 | 0.868 | 1.000 | 1.000 | 1.000 | 1.000 | 0.748 |
| Belarus | 0.830 | 0.736 | 0.884 | 0.721 | 0.686 | 0.806 | 0.768 | 0.771 | 0.677 | 0.676 | 0.669 | 0.770 | 0.689 | 0.792 | 0.748 | |||
| India | 0.528 | 0.929 | 0.619 | 0.643 | 1.000 | 1.000 | 1.000 | 0.716 | 1.000 | 0.835 | 0.872 | 0.831 | ||||||
| Mongolia | 0.928 | 0.967 | 0.885 | 0.719 | 0.875 | |||||||||||||
| Israel | 1.000 | 0.904 | 0.819 | 0.784 | 1.000 | 0.902 | ||||||||||||
| Latvia | 0.969 | 0.994 | 1.000 | 0.982 | 1.000 | 1.000 | 0.955 | 1.000 | 1.000 | 1.000 | 1.000 | 1.000 | 1.000 | 1.000 | 1.000 | 1.000 | 1.000 | 0.994 |
| Kazakhstan | 0.991 | 0.995 | 1.000 | 1.000 | 1.000 | 1.000 | 0.998 | |||||||||||
| China | 1.000 | 1.000 | 1.000 | 1.000 | 1.000 | 1.000 | 1.000 | 1.000 | 1.000 | 1.000 | ||||||||
| Estonia | 1.000 | 1.000 | 1.000 | 1.000 | 1.000 | 1.000 | 1.000 | 1.000 | 1.000 | 1.000 | 1.000 | 1.000 | 1.000 | 1.000 | ||||
| Russian Federation | 1.000 | 1.000 | 1.000 | 1.000 | ||||||||||||||
| Average | 0.428 | 0.434 | 0.485 | 0.433 | 0.427 | 0.394 | 0.414 | 0.479 | 0.480 | 0.485 | 0.497 | 0.527 | 0.506 | 0.533 | 0.568 | 0.609 | 0.698 | |
| n | 20 | 28 | 23 | 21 | 26 | 25 | 24 | 28 | 28 | 24 | 16 | 21 | 16 | 15 | 14 | 14 | 13 |
© 2019 by the authors. Licensee MDPI, Basel, Switzerland. This article is an open access article distributed under the terms and conditions of the Creative Commons Attribution (CC BY) license (http://creativecommons.org/licenses/by/4.0/).
Share and Cite
Li, W.; Hilmola, O.-P. Belt and Road Initiative and Railway Sector Efficiency—Application of Networked Benchmarking Analysis. Sustainability 2019, 11, 2070. https://doi.org/10.3390/su11072070
Li W, Hilmola O-P. Belt and Road Initiative and Railway Sector Efficiency—Application of Networked Benchmarking Analysis. Sustainability. 2019; 11(7):2070. https://doi.org/10.3390/su11072070
Chicago/Turabian StyleLi, Weidong, and Olli-Pekka Hilmola. 2019. "Belt and Road Initiative and Railway Sector Efficiency—Application of Networked Benchmarking Analysis" Sustainability 11, no. 7: 2070. https://doi.org/10.3390/su11072070
APA StyleLi, W., & Hilmola, O.-P. (2019). Belt and Road Initiative and Railway Sector Efficiency—Application of Networked Benchmarking Analysis. Sustainability, 11(7), 2070. https://doi.org/10.3390/su11072070