Article

A Dominance-Based Network Method for Ranking Efficient Decision-Making Units in Data Envelopment Analysis

1
Department of Industrial Engineering, Hanyang University, 222 Wangsimni-ro, Seongdong-gu, Seoul 04763, Korea
2
Graduate School of Technology and Innovation Management, Hanyang University, 222 Wangsimni-ro, Seongdong-gu, Seoul 04763, Korea
*
Author to whom correspondence should be addressed.
Sustainability 2019, 11(7), 2059; https://doi.org/10.3390/su11072059
Submission received: 4 March 2019 / Revised: 26 March 2019 / Accepted: 2 April 2019 / Published: 7 April 2019
(This article belongs to the Section Economic and Business Aspects of Sustainability)

Abstract

:
Ranking of efficient decision-making units (DMUs) using data envelopment analysis (DEA) results is very important for various purposes. We propose a new comprehensive ranking method using network analysis for efficient DMUs to improve the discriminating power of DEA. This ranking method uses a measure, namely dominance value, which is a network centrality-based indicator. Thus far, existing methods exploiting DMU’s positional features use either the superiority, which considers the efficient DMUs’ relative position on the frontier compared to other DMUs, or the influence, which captures the importance of the DMUs’ role as benchmarking targets for inefficient DMUs. However, in this research, the dominance value is the compounded measure of both core positional features of DMUs. Moreover, a network representation technique has been used to ensure the performance of the dominance value compared to the superiority and influence. To demonstrate the proposed ranking method, we present two examples, research and development (R&D) efficiency of small and medium-sized enterprises (SMEs) and technical efficiency of plug-in hybrid electric vehicles (HEVs). Through these two examples, we can see how the known weaknesses and the unobserved points in the existing method differ in this new method. Hence, it is expected that the proposed method provides another new meaningful ranking result that can show different implications.

1. Introduction

Data envelopment analysis (DEA) is a well-known linear programming-based technique for measuring the relative efficiency of homogeneous decision-making units (DMUs) [1]. DEA is a representative nonparametric method that does not require statistical assumptions about data or prior knowledge of production functions. DEA has the advantage that it can simultaneously utilize multiple input and output variables of different units and produces a single aggregate efficiency measure. Moreover, it is not necessary to specify the weight of the variables in applying DEA. However, there also exists a weakness in DEA. For example, since traditional DEA models are deterministic in nature, they are highly depending on the data and very sensitive to extreme observations [2]. Therefore, one should pay much attention to setting DMUs and input and output variables for the appropriate application of DEA.
DEA has attracted considerable attention after the introduction and has been widely used in various sectors including energy [3], innovation [4,5], environment [6], agriculture [7], and banking [8] as a decision support tool. More applications of DEA can be found in Emrouznejad and Yang [9] and Liu et al. [10]. From a functional perspective, DEA is most often used for DMU ranking [11,12] and benchmarking target selection [13,14], and also used for technological forecasting [15] and clustering [16].
In particular, DEA-based ranking helps to understand the current level of DMUs’ performance and provides some useful information for decision-making, such as establishing incentive schemes or supporting policies according to the performance, and developing strategies to sustain the future business or core competence. Here, the DMUs we deal with may be individual companies that compete with each other, departments within the enterprise, or individual technologies themselves. In order to maintain the sustainability of competitive advantage in the enterprise, it is important to evaluate the efficiency of operation. Furthermore, differentiation of strategy for sustainable growth is needed according to the ranking. The ranking of DMUs can be also used in identifying competitors with similar performance levels and determining the future direction of efficiency improvement for sustainable development, such as inefficient DMUs’ benchmarking target. Moreover, it is useful for efficient DMUs in establishing strategies and goals to obtain a competitive advantage and have opportunities for sustainability in growth.
Since DEA classifies DMUs into efficient DMUs and inefficient DMUs, where efficient DMUs are all assigned the same efficiency score 1, efficient DMUs are not distinguished from each other. Therefore, various ranking methods have been developed to distinguish the performance of all DMUs.
In general, these methods supplement efficiency evaluation methods or conduct additional analyses to more accurately rank efficient DMUs. Methods for discriminating efficient DMUs can be classified into two categories according to the information they use. One category uses the relative-positional feature of the given input–output data, and the other category gathers and employs additional information, for example, the common set of weights [17,18] and subjective evaluation [19,20]. This study focuses on the first category for discriminating efficient DMUs that is useful in all situations, even when additional information is not available.
The methods of the first category used only one feature, either superiority or influence, and, hence, can be divided into superiority-focused approaches and influence-focused approaches. Here, the superiority indicates distance-based superiority of efficient DMUs’ relative position compared to other DMUs in a dataset. Methods based on the super efficiency [21,22,23,24], cross efficiency [25,26,27], alternative frontier [28,29,30], efficiency change of inefficient DMU [31,32,33], and virtual DMU [34,35,36,37,38] belongs to the superiority-focused approaches. On the other hand, influence-focused approaches exploit the importance of the efficient DMUs’ role as benchmarking targets. Methods proposed by Liu et al. [39], Liu and Lu [40], and Liu and Lu [41] are typical examples of this sub-category.
However, existing studies have exploited only one feature, so there are some limitations for discrimination. For example, there may be an efficient DMU that is not selected as an exemplar for inefficient DMUs, even if that DMU has a large efficiency gap. Likewise, there may be a popular exemplar DMU for many inefficient DMUs, even if the efficiency gap is not large enough. In such cases, it would be more reasonable to consider these two features together in the evaluation.
Based on this background, this study aims to develop a new ranking method to discriminate efficient DMUs by including both the superiority and influence features. To this end, we introduce quantified measures for estimating the superiority and influence features and define the “dominance value,” a compounded measure of two positional features by using the centrality of the network, a commonly used term to identify the most centric vertex in a network. The dominance value is used for ranking the efficient DMUs. Moreover, we visualize the superiority, influence, and the dominance values using a network representation to compare the results and discuss the data distribution properties. Two practical examples are presented to illustrate how the proposed method makes decisions that differ from the results of evaluating two features separately. It is expected that the proposed method provides another new meaningful ranking result that can show different implications.
The remainder of this paper is organized as follows. In the next section, we review existing ranking methods that used positional features of DMUs and introduce how to express DEA results using a network. We then present the baseline idea and the process of deriving the dominance value corresponding to the centrality measure in Section 3. In Section 4, two examples are provided to demonstrate the usefulness of the proposed method, and the results and implications are discussed. Finally, we summarize our work and then conclude the paper.

2. Background

2.1. Ranking Methods Using Positional Features

Typical positional features-based ranking methods include super efficiency (SE)-based methods [21,22,23,24], cross efficiency (CE)-based methods [25,26,27], alternative frontier-based methods [28,29,30], efficiency change of inefficient DMU-based methods [31,32,33], virtual DMU-based methods [34,35,36,37,38], and benchmarking importance-based methods [39,40,41].
Superiority-focused approaches include ranking methods based on SE, CE, alternative frontier, efficiency change of inefficient DMUs and virtual DMU. SE-based methods operate by dropping each efficient DMU from the reference set and evaluating the efficiency of the excluded DMU, thus the excluded DMU’s positional superiority compared to all the other DMUs is measured. Andersen and Petersen [21] first proposed a SE model that measures how efficient DMUs can maximize their inputs while maintaining an efficiency score of 1. This basic SE-based ranking method calculates the maximum input that can be reached without changing the efficiency status for each efficient DMU and assigns a higher rank to a DMU that allows for a larger amount of input increase. Chen [22] proposed a modified SE-based ranking method that overcomes the infeasibility problem by suggesting to use both input- and output-oriented SE model. The method presented in Jahanshahloo et al. [23] also exploited the leave-one-out strategy to discriminate efficient DMUs using l1-norm and Rezai Balf et al. [24] proposed a method with the same strategy while using Tchebycheff norm.
The CE-based method is pioneered by Sexton et al. [25], in which the efficiency of each DMU is compared one by one, and then these cross-evaluated efficiencies are aggregated to derive the final efficiency. Cross-efficiency can be understood as a measure of the average relative superiority through comparison with all of the DMUs. This method has been further improved by Zerafat Angiz et al. [26] and Liu et al. [27]. Specifically, Zerafat Angiz et al. [26] developed a cross-ranking matrix, a converted form of the cross-efficiency matrix based on the ranking order of DMUs, and determined the overall ranking based on this matrix. Liu et al. [27] introduced a CE-based ranking method that can consider undesirable outputs.
Another method proposed by Jahanshahloo and Afzalinejad [28] determined the rank of efficient DMUs based on the distance from the inefficient frontier, which is defined by the least productive DMUs (worst performers). Azizi [29] proposed a ranking method using the interval efficiency integrating original efficiency score (optimistic view) and efficiency score, determined based on the inefficient frontier (pessimistic view). Similarly, Wang et al. [30] suggested a method to better discriminate DMUs by integrating two efficiencies into a geometric average efficiency.
On the other hand, some ranking methods evaluated distance-based superiority using their effect on the efficiency score of inefficient DMUs when each efficient DMU is excluded in a reference set. For example, Jahanshahloo et al. [31] proposed a simple method that evaluates the average efficiency score of inefficient DMUs after the exclusion of each efficient DMU, which is generally higher than the original score. Chen and Deng [32] introduced a cross-dependence-based method that ranked both efficient DMUs and inefficient DMUs. In their work, the evaluation of efficient DMU depends on the efficiency change of all inefficient DMUs induced by its absence, and inefficient DMU is assessed based on its efficiency change occurred by the exclusion of each efficient DMU. In a similar vein, a method proposed by Du et al. [33] combined each efficient DMU’s influence on all other inefficient DMUs and the standard efficiency score, to rank all DMUs.
The ranking method using virtual DMUs is a relatively new method known as the most flexible, since there are various ways of setting virtual DMUs [11]. Methods in this category rank DMUs using the positional superiority of efficient DMUs to a virtual DMU. For example, Wang and Luo [34] added an ideal DMU (IDMU) with the least input and the most output, and an anti-ideal DMU (ADMU) with the most input and the least output. The efficiencies were then evaluated with respect to the IDMU and ADMU. These two efficiency scores reflect the viewpoints of the worst and the best possible relative efficiency. Then, the two efficiencies are integrated into a single value called the “relative closeness”, and DMUs are ranked using relative closeness. In a similar vein, Shetty and Pakkala [35] defined a virtual DMU representing the average of inefficient DMUs and evaluate the impact of efficient DMUs on it. Similarly, Izadikhah and Farzipoor Saen [36] proposed a method for fully ranking all DMUs based on the influence of efficient DMUs on other efficient DMUs and a virtual DMU, a proxy of all inefficient DMUs. Additionally, Wang and Yang [37] used interval efficiency of which the lower bound is determined by a virtual anti-ideal DMU, and Azizi and Wang [38] improved the method introduced in [37] to be capable for handling zero-valued output.
In contrast, influence-focused approaches rank efficient DMUs based on how much they influence inefficient DMUs by focusing on their role as the benchmarking target. Benchmarking targets are known to supply the information of the input–output mix required to reach an efficient frontier. In another words, the position of efficient DMUs becomes the production guideline for improving the efficiencies. However, not all efficient DMUs receive equal attention. For example, although the performance of a certain efficient DMU can be outstanding, it may be an outlier if the DMU is located far from other DMUs, and there is no benchmark. It is; therefore, very important to analyze how many times efficient DMUs are selected as benchmarking targets and how important they are, the major considerations of influence-focused approaches.
Liu et al. [39] proposed a ranking method using the number of selections as benchmarking targets as well as benchmarking weights to evaluate the influence of efficient DMUs. In their work, benchmarking relationship of DMUs is represented as a directed and weighted network, in which nodes correspond to DMUs and the strength of the edges correspond to the benchmarking weight. After construction of the benchmarking relationship network, they employed the centrality, a concept commonly used in social network analysis, to rank efficient DMUs. An efficient DMU is said to be more influential when it is chosen more often for benchmarking purposes and has a higher weight. However, Liu and Lu [40] revealed that method of [39] had a problem that it ranked favorably for some DMUs with small inputs and outputs, and, hence, proposed a method that uses the normalized value of lambda to overcome this flaw. Furthermore, an influence-based ranking method for a two-stage network DEA model is introduced in Liu and Lu [41].
These methods are summarized in Table 1. However, there are some methods that use information other than the positional features which are quite far from this research. These methods can be found in Aldamak and Zolfaghari [11] and Hinojosa et al. [42].

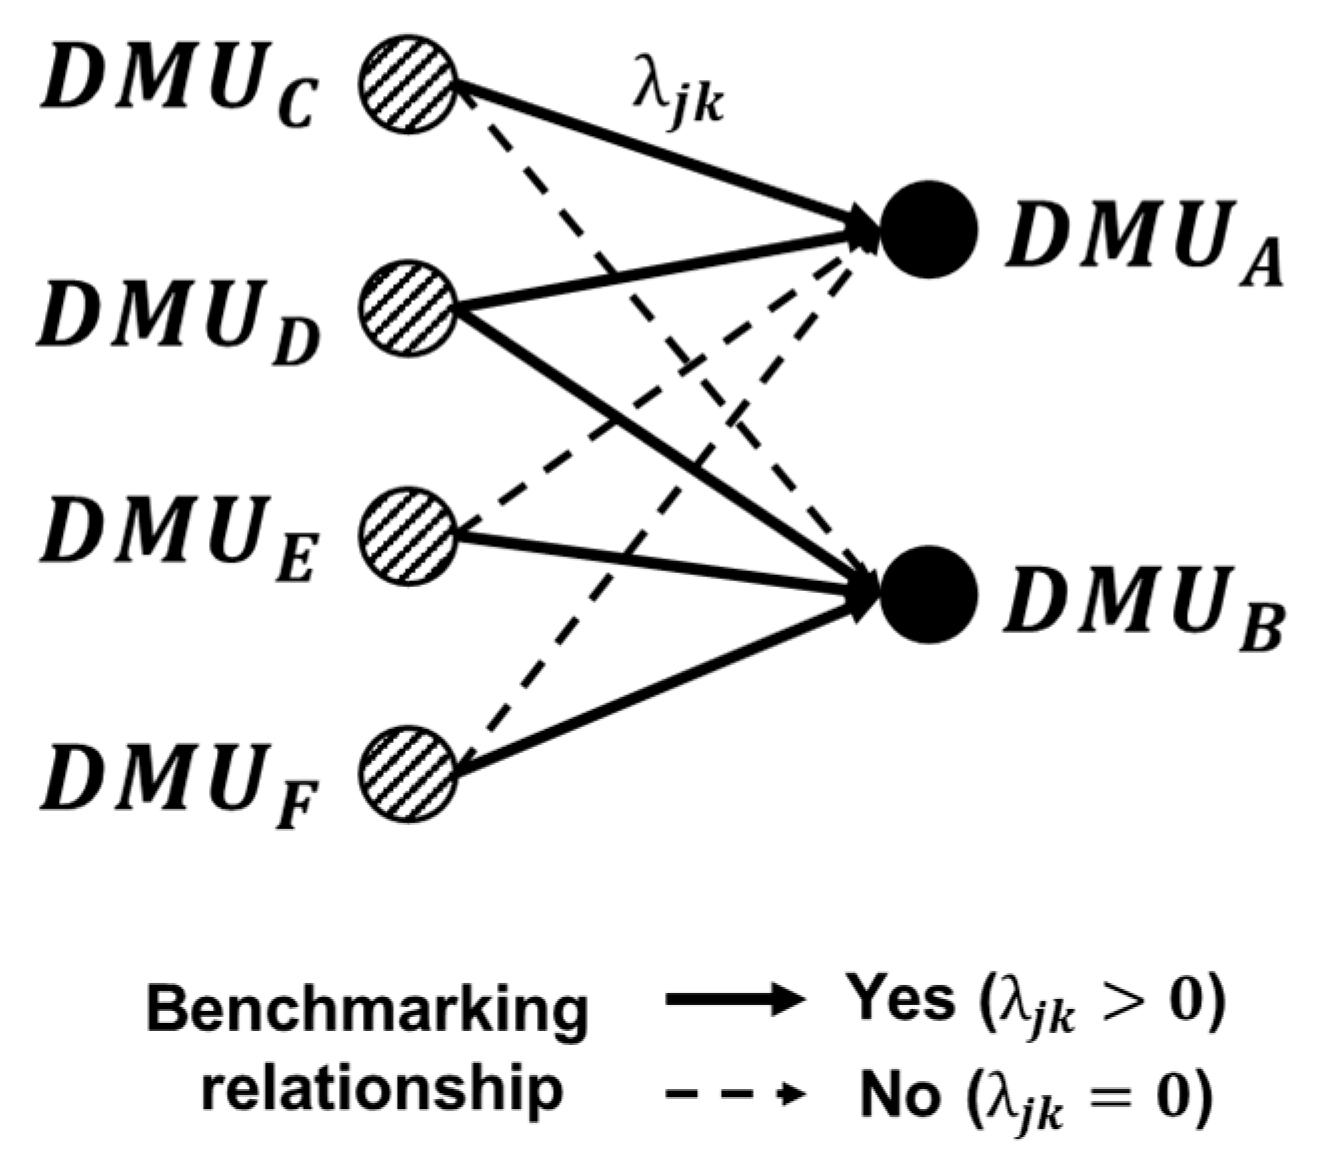
2.2. Network Representation for DEA

A network, a type of data representation technique, is a graph composed of the vertices and edges that visualize the relationship of the data. The vertex, edge, and edge weight represent each data point, the existence of a relationship between the vertices, and the intensity of the relationship, respectively. For example, in this sense, one can imagine a network with a city as a vertex, an edge as a directed road, and the edge weight as the traffic. As introduced in [39], DEA results can also be represented by a network using the efficiency score and benchmarking information.
Let { D M U k   : k = 1 , , n } be the set of DMUs, where n is the number of DMUs, and x j m and y j s indicate the m t h input and s t h output of D M U k , respectively ( m = 1 , , M ,   s = 1 , , S ) . Following (1) is a typical input-oriented BCC (Banker, Charnes, and Cooper) model [43] that finds the efficiency score and benchmarking target of D M U k .
{ E k = min λ , θ θ k   θ k x k m i = 1 n λ i x i m , m = 1 , , M y k s i = 1 n λ i y i s , s   = 1 , ,   S λ i 0 , i = 1 n λ i = 1 .
The value of E k , an optimal solution of Model 1, is the efficiency score of D M U k . If E k = 1 , then λ k = 1 and λ i = 0   ( i ,   i k ) , and if E k < 1 , then the benchmarking targets of D M U k are the DMUs with λ i > 0 . Note that in the case of a weak-efficient DMU, λ i > 0 ( i k ) can happen even though E k = 1 . Liu et al. [39] and Liu and Lu [40] constructed a network based on the benchmarking relationship of which the edge weights correspond to the lambda of (1), as shown in Figure 1.
In network theory, it is critical to calculate the centrality of each vertex in order to quantify the importance of vertices in a network. The centrality of a vertex is usually derived from the existence of an edge and the edge weight. There are four main types of centrality used. Degree centrality, the simplest measure, is calculated by the total number of edges connected to a vertex. Eigenvector centrality is determined by putting a greater value on the vertices that are connected to the more centric vertices in order to overcome some weakness of the degree centrality. The betweenness centrality of a vertex depends on the number of passing-through shortest paths between each vertex except for the vertex. Finally, the closeness centrality is calculated by averaging the distance of the shortest paths from a particular vertex to all the other vertices. For more information on network theory and centrality, see [44].
Choice of the centrality measure should be done on the basis of the definition of the vertex, edge, and edge weight. As described, we define the vertex as a DMU and an edge and its direction as the benchmarking relationship. The edge weight is defined by the dominance value, the compounded measure of the superiority and influence features of the efficient DMUs, which is introduced in Section 3. In our context, the centrality measure represents the quantified importance of the efficient DMUs with respect to the dominance value and benchmarking relationship. The centrality measure selection and calculation process are also presented in Section 3.

3. Dominance Value Using Centrality

The dominance value is a compounded measure to reflect the core positional features of efficient DMUs: superiority and influence. Here, we introduce the baseline idea of measuring the superiority and influence features in this study. As explained, the superiority feature focuses on the relative position of efficient DMUs compared to other DMUs. Since efficient DMUs define the boundary of the production possibility set (PPS), the set of all possible operating points, the absence of an efficient DMU usually leads to contraction of the PPS [31]. As illustrated in Figure 2a, the change in PPS with respect to the presence of an efficient DMU becomes greater when an efficient DMU is located in a predominant position. We can easily tell that the PPS change of removing D M U B is larger than that of removing D M U C . When D M U C is removed, D M U E becomes an efficient DMU and constitutes an alternative frontier that is very close to the original frontier. This happens because the relative position of D M U B compared to the other DMUs is superior to that of D M U C . Based on these facts, a certain efficient DMU can be said to be superior when the PPS is greatly contracted by the absence of the efficient DMU compared to other efficient DMUs. This superiority concept is used in previous ranking methods proposed by Jahanshahloo et al. [31], Du et al. [33], and Chen and Deng [32].
Secondly, let us take into account the influence feature. According to the extant literature, the higher the benchmarking importance, the more competitive the DMU will rank in a higher position. Here, in accordance with the existing literatures such as Liu et al. [39], Liu and Lu [40], and Liu and Lu [41], the benchmarking importance is defined by the number of times it is selected as the benchmarking target by inefficient DMUs and the corresponding weights. Therefore, the influence reflects the role of efficient DMUs as exemplars for inefficient DMUs. Figure 2b shows the five zones with respect to the benchmarking target type. For example, the DMUs in Zone 1 benchmark D M U A , and DMUs belong to Zone 2 benchmark DMU A and DMU B . In total, two DMUs benchmark DMU A and eight DMUs benchmark D M U C . This is evidence for the role of DMU C , as an exemplar, being more important than that of DMU A . In the following texts, we provide a specific measure for calculating the superiority and influence features and the process for deriving the dominance value by compounding two features that will be used for ranking efficient DMUs.
Now, let us determine the edge weights using superiority and influence, and develop the dominance value by evaluating the centrality. As mentioned, superiority is measured based on the relative position of a certain efficient DMU compared to the other DMUs. We utilize super efficiency [21] as a proxy for the change of the PPS depending on the absence of each efficient DMU. The super efficiency of DMU k is evaluated compared to all the PPS constructed DMUs except for DMU k . Let E k , j denote the new efficiency score of DMU k by removing DMU j for k , j = 1 , , n ,   k j . E k , j is the optimal solution for the following super efficiency-based model. Note that E k , 0 equals E k from (1).
{ E k , j = min λ , θ θ k , j θ k , j x k m i = 1 ,   i j n λ i x i m , m = 1 , , M y k s i = 1 , i j n λ i y i s , s = 1 , ,   S λ i 0 .
However, it should be noted how much an inefficient DMUs’ efficiency is changed by the absence of D M U k . For example, in Figure 2a, E G , B is almost 1 whereas E F , B is still quite less than 1. This implies that the PPS contraction near DMU G is larger than that of DMU F , which also lets us estimate the magnitude of the PPS change. Considering this, the measure of the superiority of D M U j upon D M U k , is defined as follows.
Definition 1.
Let matrix G = [ G j k ] n × n be the gap (= efficiency change) matrix, where the efficiency gap of D M U k with respect to the absence of D M U j is calculated by
G j k = E k , 0 E k , j ,   j , k = 1 , , n   , k j ,
and
G j j = 0 ,     j = 1 , , n .
The quantified measure used for evaluating the superiority is G jk . If DMU j is an efficient DMU, and the absence of DMU j influences the other DMUs’ efficiency, then G jk > 0 for some k ; otherwise, G jk = 0 for all k . Now we can redefine the superiority using the definition as follows: If G jk > G ik for all k , then DMU j is called superior to DMU i for some i , j .
In accordance with the previous literature, we use the benchmarking weights ( λ i ) from (1) to measure the influence features since they represent the importance of benchmarking targets. In this step, the benchmarking weight is newly defined using two subscripts to incorporate the benchmarking relationship (i.e., who is benchmarking whom).
Definition 2.
Let matrix Λ = [ λ j k ] n × n be the weight matrix, where λ j k is the benchmarking weight of D M U j for D M U k for j , k = 1 , , n   ,     k j , and
λ j j = 0 , j = 1 , , n .
The value of λ jk represents the optimal benchmarking weight when DMU j is selected as a benchmarking target for inefficient DMU k in (1). If DMU k benchmarks DMU j then 0 < λ jk 1 . Otherwise, λ jk = 0 . Thus far, we define the superiority and influence by the gap matrix and the weight matrix, respectively. Finally, we define the weighted-gap matrix, which will be used as the edge weight of the network.
Definition 3.
Let matrix W = [ W j k ] n × n be the weighted-gap matrix, where
W j k = λ j k × G j k ,       j , k = 1 , , n ,
and
G j k = G j k / max j ,   k G j k j , k = 1 , , n .
Here, W is the n × n weighted-gap matrix reflecting both the superiority and influence of the DMUs. The range of the G jk may influence the weighted gap since 0 λ jk 1 , so scaling is required. Note that Diag ( W ) = 0 , since Diag ( Λ ) = 0 and Diag ( G ) = 0 . A network with W as an adjacency matrix (edge weight from the vertex k to j is W jk ) is the weighted-gap network that we want to derive for further analysis.
The next step is to identify the dominance of the DMUs (=nvertices). We propose the “dominance value” by utilizing the closeness centrality under the assumption that the shorter the average length of the shortest path to the other vertices, the greater the centric vertices in the network. Note that the distance in the closeness centrality corresponds to the edge weight (= weighted-gap) in our weighted-gap network. Additionally, we have to mention that, contrary to the distance, the higher the weighted-gap, the higher the superiority and influence of the corresponding efficient DMU. Therefore, the higher the edge weight, the higher the rank in dominance. It is also important to know how many edges are connected to an efficient DMU in the weighted-gap network. If DMU j is selected as the benchmarking target more times than that of DMU i , then DMU j dominates DMU i , even though their average edge weights are similar. Therefore, we define the dominance value using the sum of the weighted-gaps directed to each efficient DMU as follows.
Definition 4.
Let d j be the dominance value of D M U j , where
d j = k = 1 n W j k ,
for an efficient D M U j .
The value of d j is defined as the sum of the weighted-gaps of all the DMUs that benchmark DMU j and efficient DMUs are ranked based on the dominance values.
The procedure of the proposed method is illustrated in Figure 3.
Even though DEA models used in the proposed method (i.e., (1) and (2)) are presented in the input-oriented version, the output-oriented model can be used too. Additionally, other types of efficiency measures can be used flexibly. For example, the slacks-based measure [45] can be used instead of (1) and the leave-one-out strategy using l 1 -norm [23] can be an alternative of (2).

4. Examples of the Dominance-Based Network Method

In this chapter, we present some results of the two applications of the proposed method. The first is for the research and development (R&D) efficiency of small and medium-sized enterprises (SMEs), and the second is for the efficiency of hybrid electric vehicle (HEV) technologies. As described in the previous section, the weight, gap, and weighted-gap matrices were generated along with the proposed method. The weight matrix and the gap matrix reflected the influence and superiority features, respectively, and the weighted-gap matrix incorporated both of these features. The dominance value used for ranking was calculated in the network constructed with the weighted-gap matrix. However, we also generated two other networks, namely the weight network and the gap network made with the weight and gap matrices for comparative analysis of the features in detail.
For DEA analysis, the software R and its Benchmarking package was used. The Benchmarking package contains most of the basic DEA models, and the code for executing the matrix calculation necessary for the dominance value derivation was included. For network visualization, we used the igraph package of the R software as well.

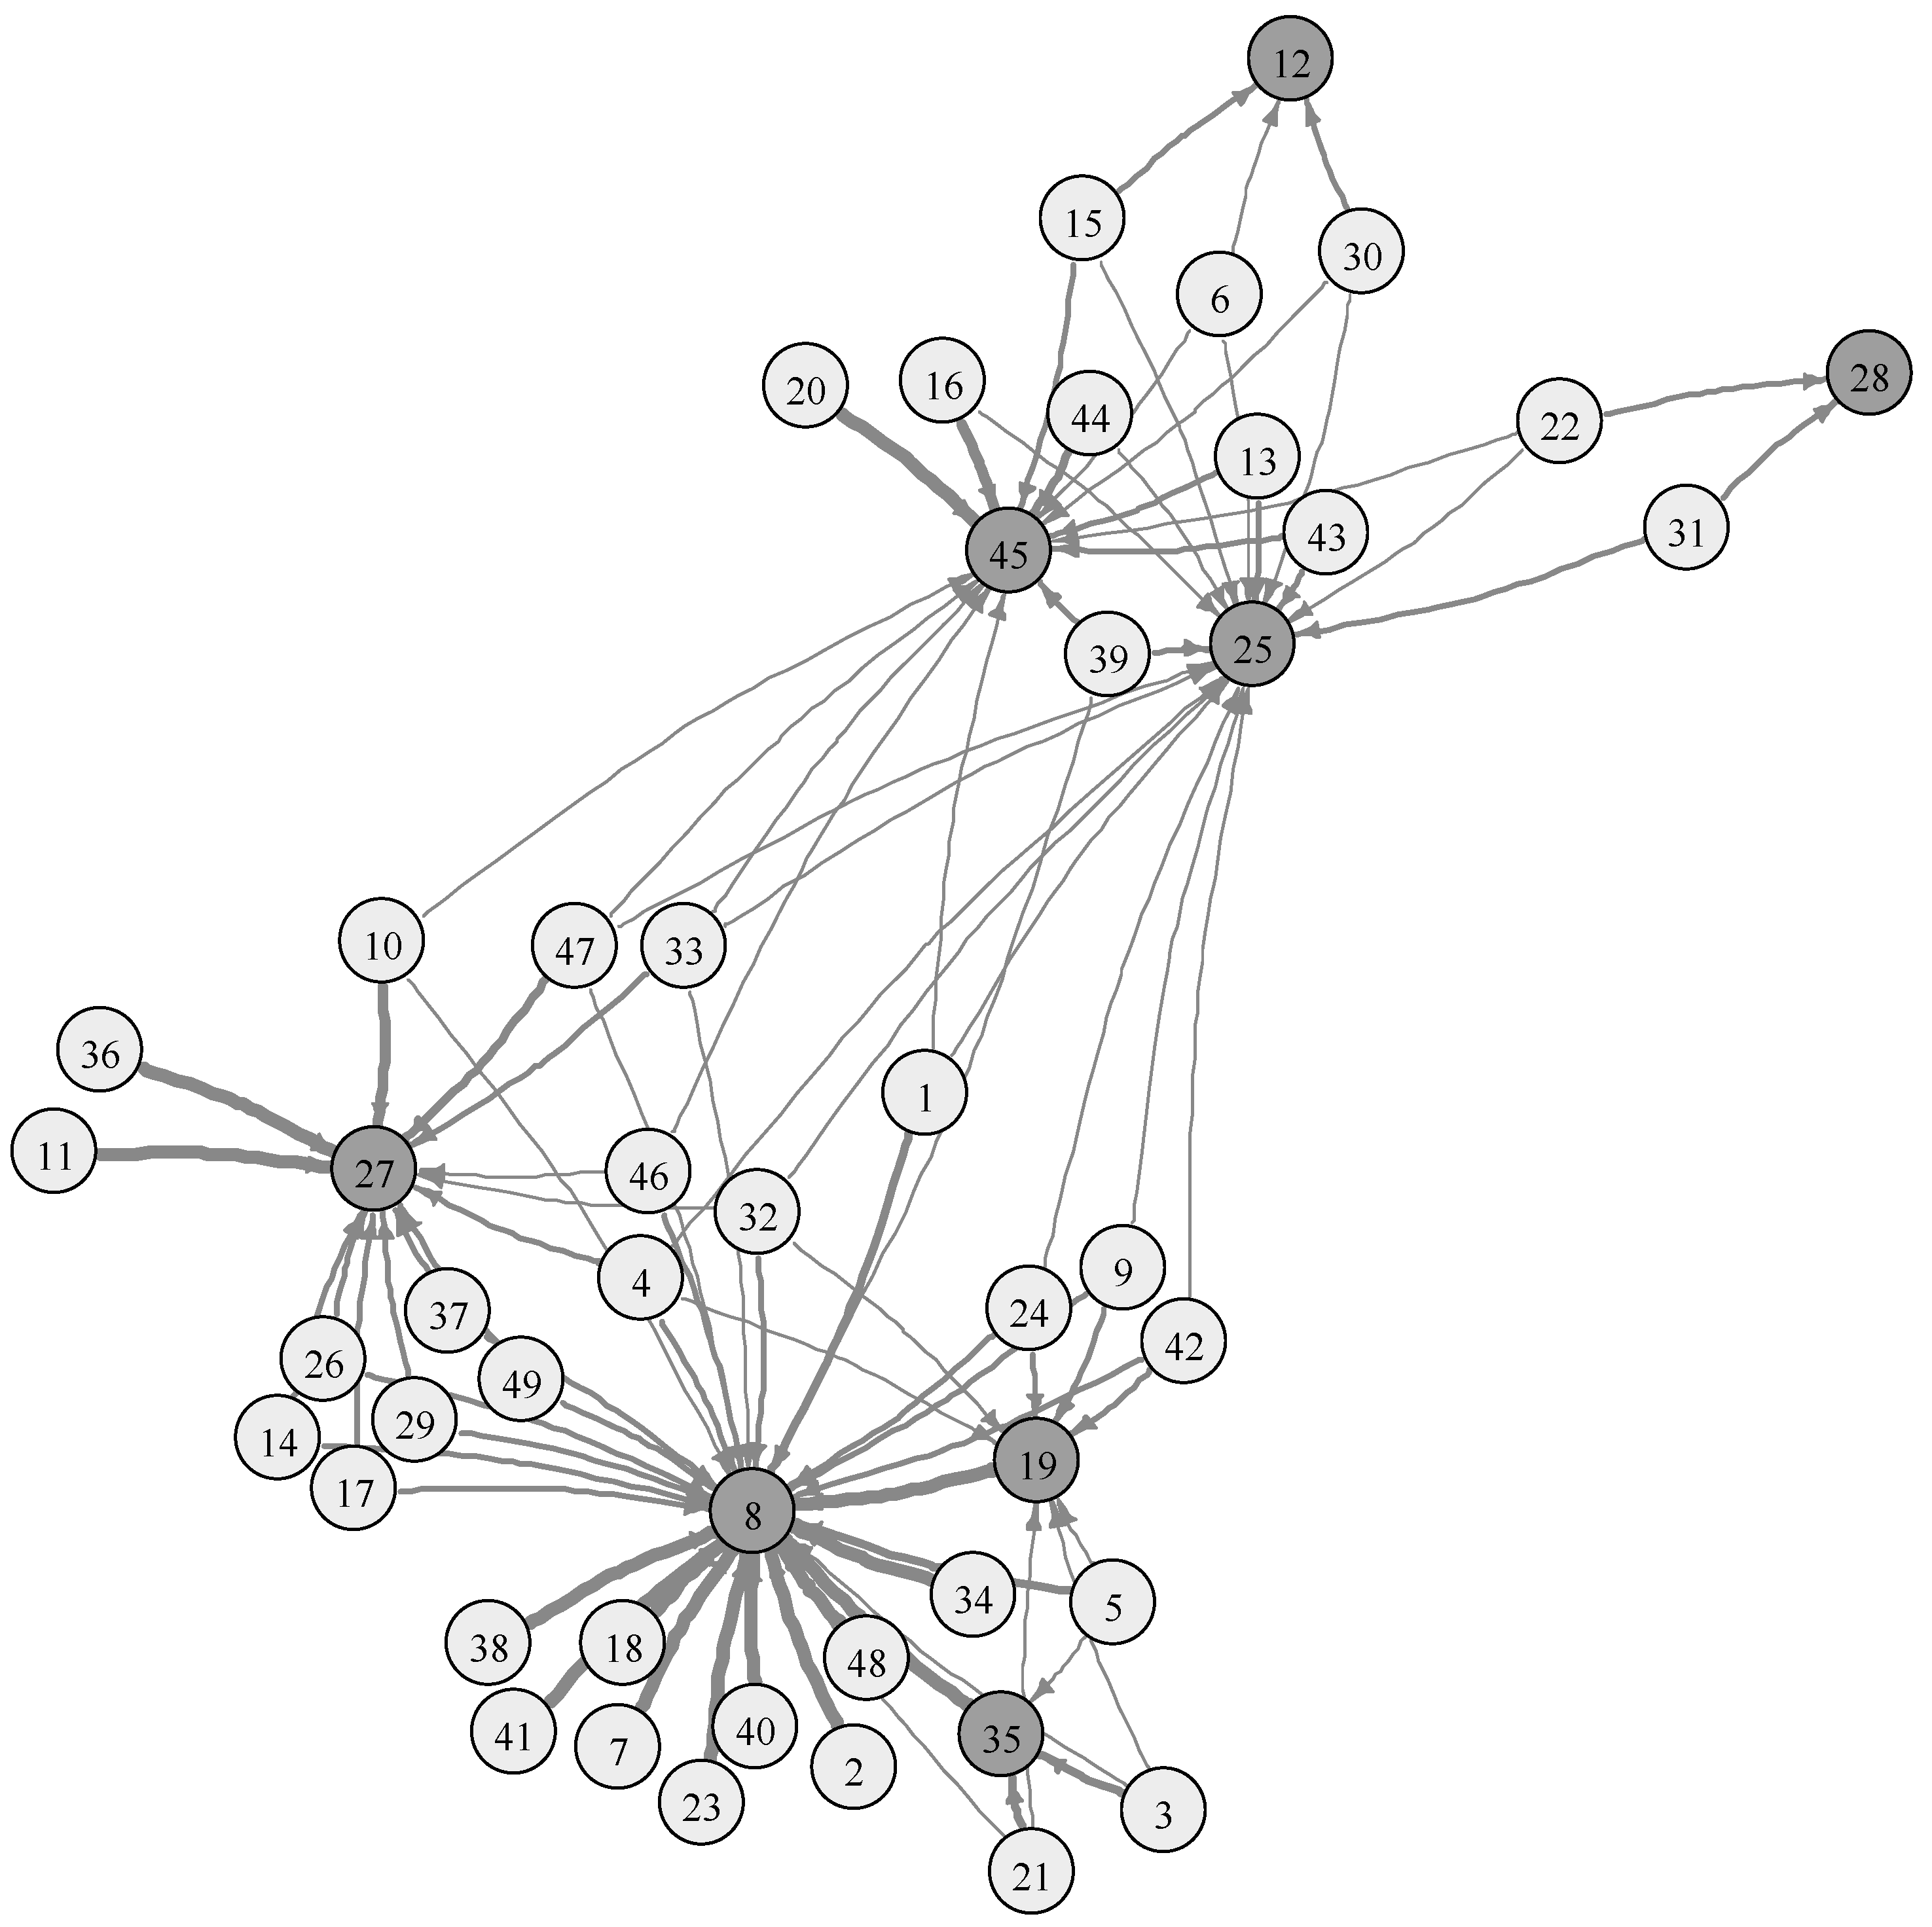
4.1. R&D Efficiency in SMEs

R&D is becoming increasingly important for long-term survival and sustainable growth in a rapidly changing technology environment and increasing competition. However, compared to large firms, SMEs usually lack R&D resources such as human, technology, and financial resources. Therefore, it is very important to implement the R&D process efficiently using the limited resources of SMEs. Many studies [4,46] have been conducted to analyze the R&D efficiency of SMEs. In this context, we try to apply the proposed method for the case of SMEs in Korea. According to the data of KOSIS (Korean Statistical Information Service) [47], SMEs occupied 99.9% of the total enterprises and 51.1% of total sales in Korea, which means that SMEs play a considerable role in the economy of Korea.
For input variables, R&D employees ( x 1 ) and R&D expenditures ( x 2 ) were used, and R&D sales ( y 1 ) and intellectual property rights (IPs) ( y 2 ) were used as output variables. The unit of the monetary variable is 1 million (m) KRW, and the unit of R&D employees and IPs is an integer. R&D employees and R&D expenditures are the most commonly used variables for R&D input that represents the total amount of human and monetary resources invested in R&D [4]. IP is an indicator of the property rights acquired through R&D activities and is known to be a very important parameter for measuring the non-monetary result of R&D [46]. R&D sales represent the monetary value of R&D [4]. Additionally, we applied it to 49 low technology SMEs in the 2016 data of the “Technical Statistics Survey of SMEs” conducted by the Korean Federation of SMEs, Small and Medium Business Administration, and the Small and Medium Business Corporation. The survey has been conducted annually for SMEs with between five and 300 employees, and includes items that are relevant to R&D activities and outcomes. The descriptive statistics of the used data is presented in Table 2.
The summarized results are presented in Table 3. “Influence” refers to the sum of the benchmarking weights ( k   =   1 n λ jk ), an indicator that only considers the benchmarking influence and “Superiority” is the sum of efficiency gap induced by the corresponding efficient DMU that only considers the superiority. These two ranking results were provided for comparison. “Dominance” is the dominance value proposed in this study.
As the result of the input-oriented BCC model, eight out of 49 DMUs appeared to be efficient. There was a significant difference between the two ranks. The rank of D M U 8 with respect to the benchmarking importance (Influence rank) was 1; however, it was in sixth place when incorporating the efficiency gap. First place of the dominance was D M U 45 , which was third place in the influence rank. Additionally, D M U 27 (third place) and D M U 25 (fourth place) only differ by 0.007 in terms of superiority, but the dominance ranks of two DMUs were considerably different due to the high influence of D M U 27 .
The weight, gap, and weighted-gap networks of DMUs are shown in Figure 4, Figure 5 and Figure 6, respectively. Figure 4 shows the benchmarking relationships between the DMUs and the corresponding weights. Here, the vertex V k in the network represents DMU k in DEA. If a certain inefficient DMU, the light gray-colored vertex, benchmarks an efficient DMU, the dark gray-colored vertex, then there is an edge between them. The thickness of each edge is proportional to the benchmarking weights. For example, the benchmarking weight of D M U 8 for inefficient D M U 1 is higher than that of D M U 45 .
In Figure 4, we can see that D M U 8 (first place) and D M U 27 (second place) were the most popular benchmarking targets for inefficient DMUs with a relatively large weight. D M U 12 and D M U 28 were selected as benchmarking targets from a small number of DMUs, and their weights were also relatively small, which means that their influence in the network was not significant.
Figure 5 is a network with the gap matrix as the adjacency matrix depending on the absence of efficient DMUs. The edge thickness is proportional to the efficiency gap (e.g., G 1.52 > G 1.10 > 0 ). It is easy to determine that the networks in Figure 4 and Figure 5 were very different. For example, the largest difference was captured in DMU 8 , which played an important role in Figure 4, but was not that much important in Figure 5. This means that although DMU 8 was selected as the benchmarking target for many inefficient DMUs (first place in influence rank), its positional superiority was not distinctive (sixth place in superiority rank). On the other hand, DMU 45 caused a comparatively large efficiency change in other inefficient DMUs. Namely, DMU 45 was not only an influential benchmarking target but also had a relatively superior position on the frontier. Although DMU 12 affected only a few inefficient DMUs, it ranked second place in superiority rank, because the efficiency change that occurred by this was quite big.
Figure 6 shows a weighted-gap network that was made of compounding the two previous networks in Figure 4 and Figure 5. The dominance value of efficient DMUs and their corresponding rank are presented in the last two columns in Table 3. As explained, the dominance value ( d j ) is the sum of the edge weights ( W j ) entering each efficient DMU j in Figure 6. D M U 45 was ranked at the top with an overwhelming dominance value of 1.574, since it was a major benchmarking target for many DMUs as well as was located in a superior position. D M U 27 and D M U 12 occupied second and third place of the rank.

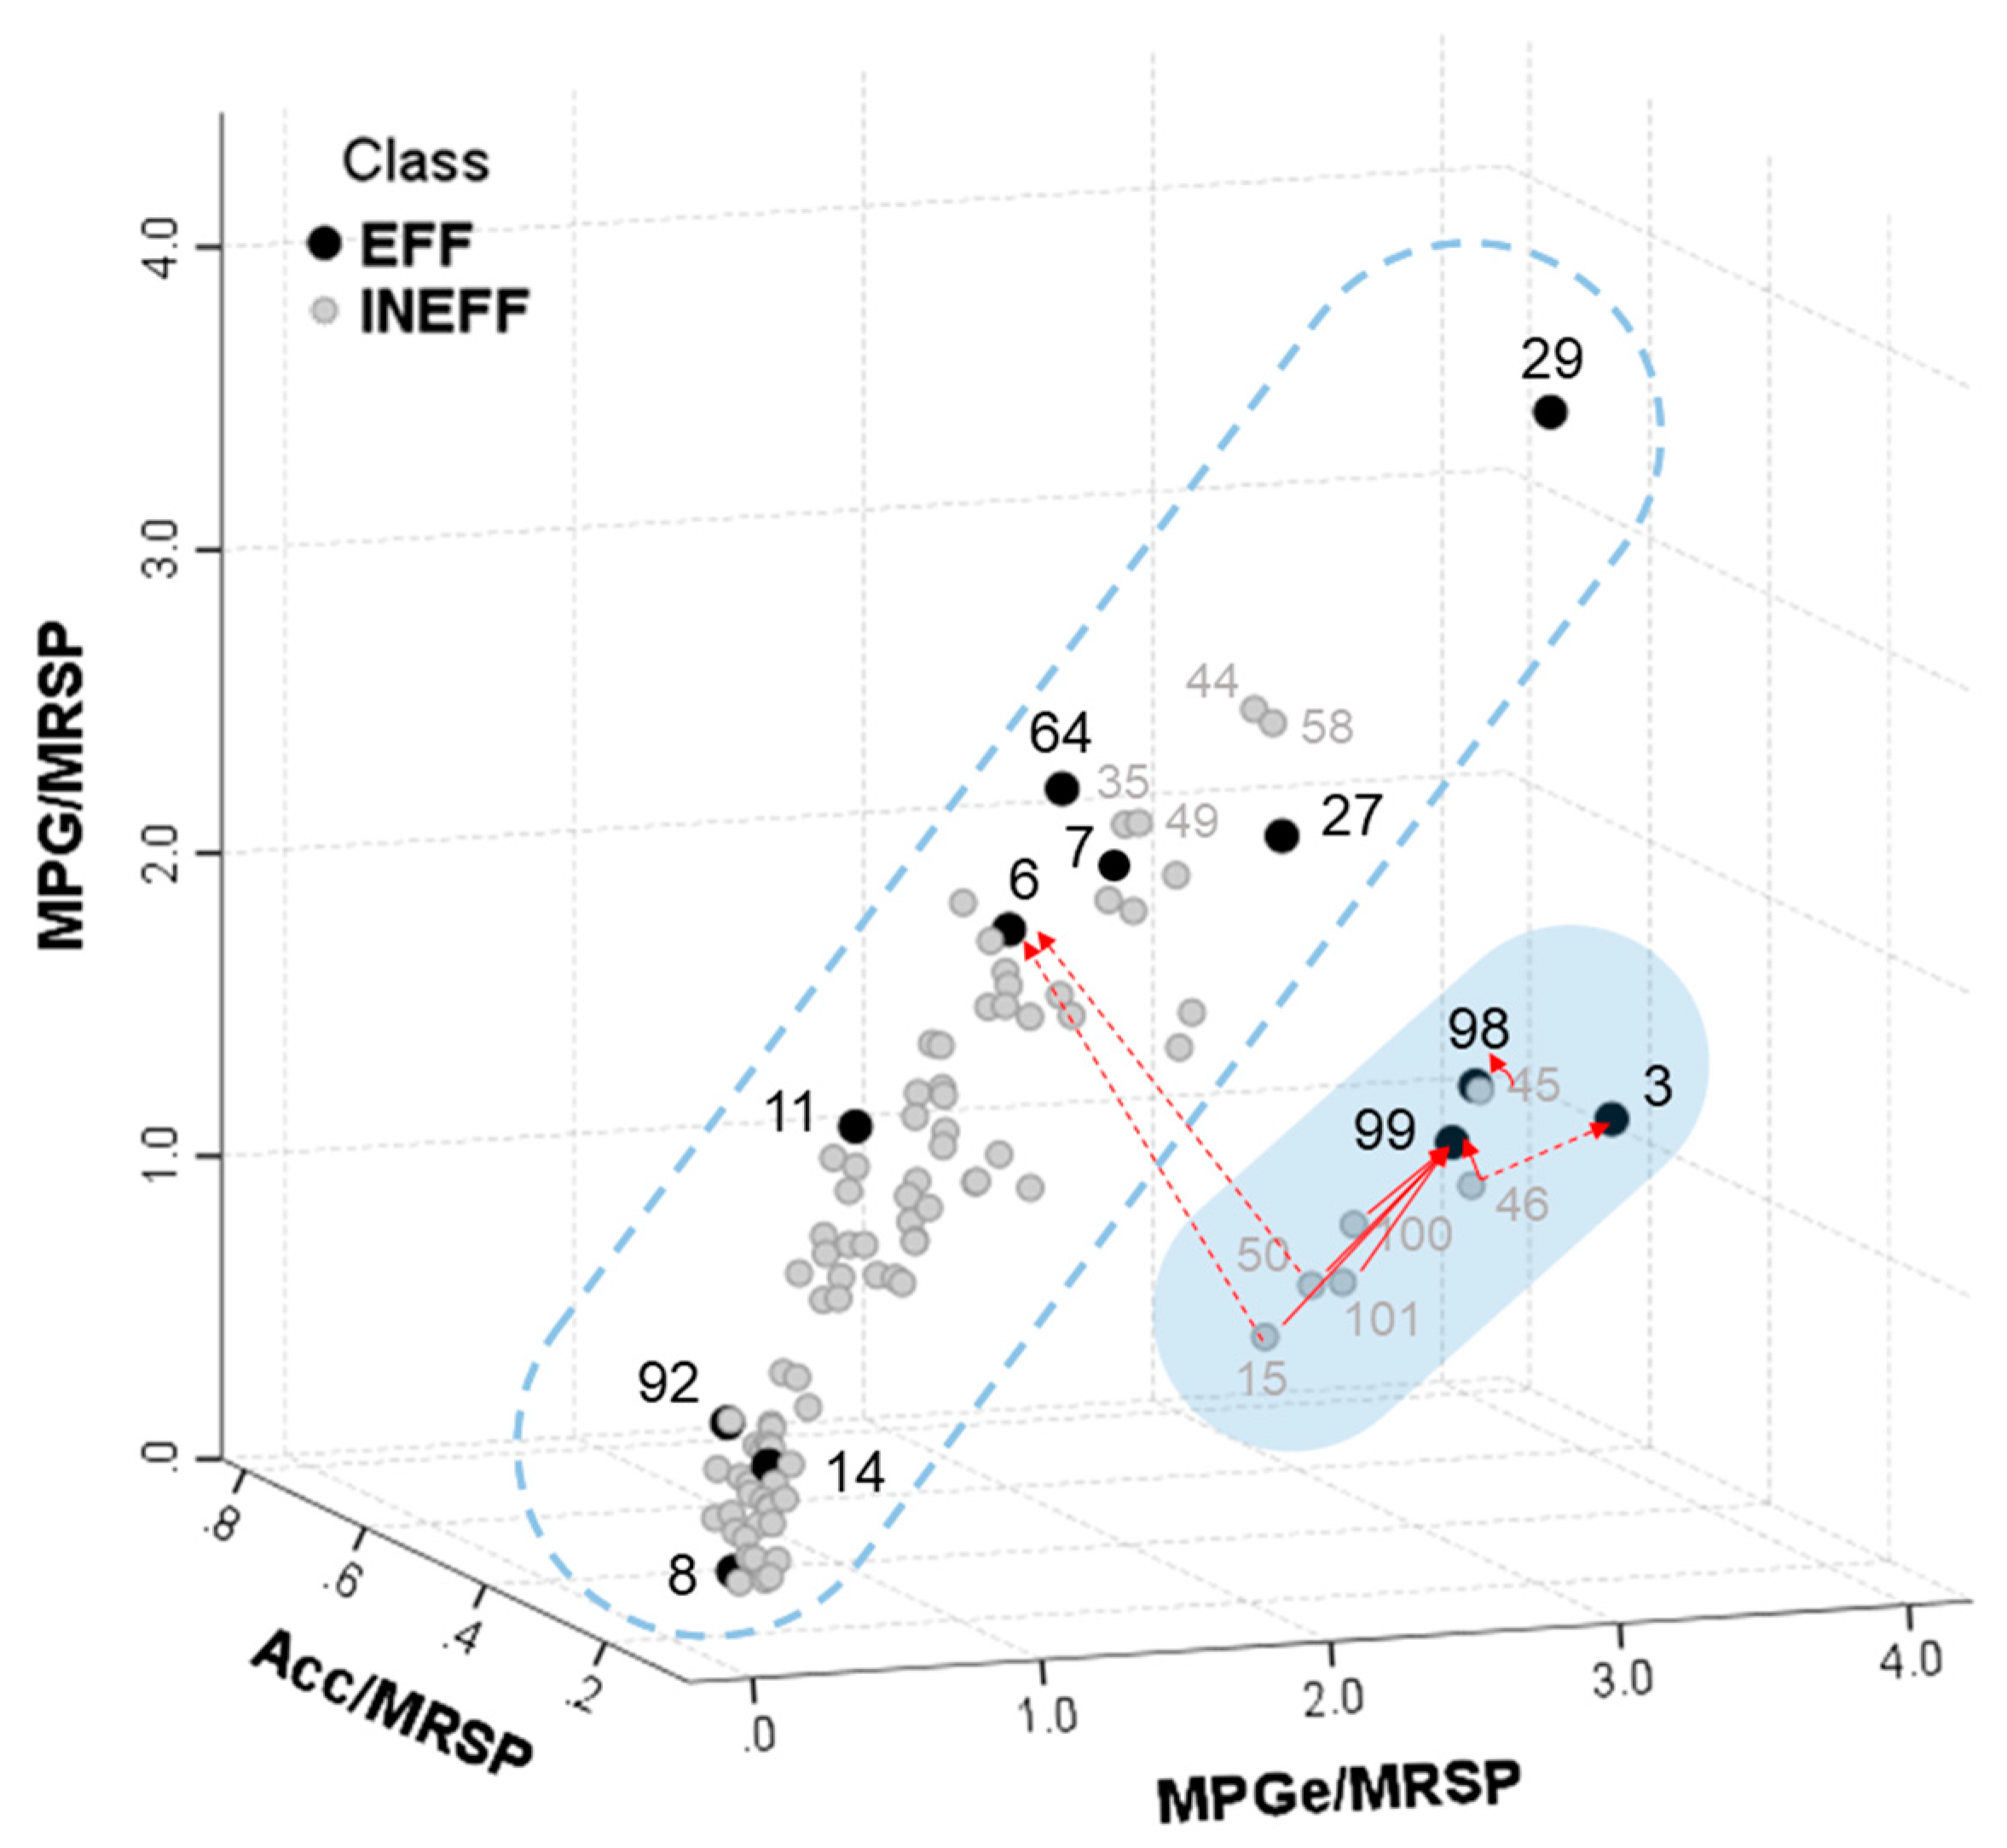
4.2. Efficiency of HEVs

The second example is an automotive technology case. Based on increasing oil prices and environmental problems, the demand for electric vehicles (EV) is consistently increasing. To encourage the purchase of eco-friendly cars, governments in many countries have introduced various supportive policies and offered subsidies. However, there is still a need for HEVs using both a conventional internal combustion engine and an electric motor and battery, prior to a pure EV vehicle that uses only a battery and an electric motor. This need is due to the long charge time and short travel range problems of pure EV vehicles. The data we analyzed for the second case is plug-in HEVs, an improved version of HEV in terms of fuel economy.
Automotive vehicles are composed of a diverse and complex set of technologies, and a small number of leading companies occupy most of the market. Unlike the previous R&D data example, in the case of the technology data, a former technology tends to fall behind when technology develops over time. This difference means that benchmarking the state-of-the-art company may be even more important in a technology case to constantly catch-up on technology trends. Thus, it is very important for rival companies to analyze the competitiveness and relative advantage of frontier technologies (i.e., efficient DMUs) for setting the direction for future technology and strategy formation.
We used data consisting of 101 plug-in HEVs, released between 2010 and 2013, used in Lim et al. [48]. The manufacturer’s suggested retail price (MSRP) was used as input variable ( x 1 ). We used three output variables ( y 1 ,   y 2 ,   y 3 for an acceleration rate (ACC), mile per gallon (MPG), and mile per gallon equivalent (MPGe), respectively. ACC refers to the time (in seconds) HEV takes to reach 100 kilometers per hour from 0; MPG corresponds to fuel consumption in the hybrid mode, and MPGe is the additional parameter to be considered for the fuel consumption measurement in the pure-electric mode. The descriptive statistics of the HEV example is presented in Table 4. More details about the data are provided in [48].
The results are summarized in Table 5. A total of 12 out of 101 DMUs appeared to be efficient as a result of the input-oriented BCC model. Similar to the previous example, the difference between the two ranks was captured. For example, D M U 11 was ranked in fourth place in superiority, but the dominance rank was 2 because of the high influence. On the contrary, D M U 29 and D M U 27 ranked second and third place, respectively, in superiority; however, their rankings were lowered to third and fourth, respectively, in the dominance rank because of their relatively low influence. Meanwhile, D M U 6 ranked first place in all ranking results in virtue of its high influence and superiority. The weight, gap, and weighted-gap networks of the DMUs for this example are shown in Figures 7, 9, and 10, respectively.
By using the network representation (Figure 7), we can figure out that DMU 6 , DMU 11 , and DMU 64 were the most popular benchmarking targets with considerable weights. It was found that DMU 29 and DMU 92 also had a relatively high benchmarking weight, although not many DMUs benchmarked them. DMU 98 and DMU 99 were analyzed to be very important benchmarking targets only for a few DMUs.
In this case, it was possible to obtain additional information on the data distribution through network analysis. In the basic radial DEA model, the benchmarking relationship usually occurs between DMUs with a similar input–output transformation ratio. In Figure 2b, for example, the DMUs belonging to Zone 3 have input-to-output ratios that correspond to the coefficient between the line from the origin to DMU B and DMU C , respectively. In this regard, the fact that five DMUs, benchmarking DMU 99 and DMU 45 , DMU 98 , and DMU 3 , were distributed away from the network implies that they had a distinctive position in the data space. DMUs benchmarking DMU 99 tended to exclusively benchmark DMU 99 . This exclusive benchmarking also happened between D M U 45 and D M U 98 . Figure 8 shows the real data distribution to demonstrate the information provided by the network.
The three axes in Figure 8 are set by dividing the three output variables into the input variable multiplied by 1000 for the convenience of expression. The index of several DMUs required for explanation is presented. The shaded area in Figure 8 shows that the group of DMUs benchmarking DMU 3 , D M U 98 , and DMU 99 were positioned quite away from the region, surrounded by the dotted line, where the majority of DMUs were located. Note that DMU 29 also appeared to be located away from the majority, but it was selected as a benchmarking target for DMUs, such as DMU 35 , DMU 44 , DMU 49 , and DMU 58 . Based on these facts, it is possible to say that the production characteristics of the shaded region are different from the main data distribution. Unlike the majority of efficient DMUs that showed no significant difference between MPG and MPGe, the MPG of the efficient DMUs in the shaded region was about twice as large as MPGe. Through this examination, we confirmed that utilizing network representation can be a good choice to deduce information about the data distribution, considering that DEA often uses high-dimensional data composed of many inputs and outputs.
Figure 9 shows the gap network generated using the gap matrix as an adjacency matrix. Again, the gap network was significantly different from the weight network. It is easy to find that G 0.27 and G 0.29 were larger than that of other efficient DMUs. Some edges directed to DMU 6 were also thick. The frontier-positional superiority of DMU 11 was not dominant because G 0.11 was not fairly thick, although it seemed to be quite influential in Figure 7. There were many positive values in G 0.92 , but the value of G 0.92 was not that large. Remember that DMU 99 was chosen as an exclusive exemplar for a few inefficient DMUs (Figure 7), the absence of DMU 99 influenced all inefficient DMUs and was especially influential for DMU 100 . This can be interpreted as a very noticeable DMU from a strategic perspective, because DMU 99 was positioned in an unusual area that may imply a distinctive technology or niche market that should be noted.
The networks in Figure 7 and Figure 9 are compounded into the weighted-gap network shown in Figure 10. As mentioned, the sum of the edge weights entering an efficient DMU in Figure 10 corresponds to the dominance ( d j ) presented in Table 5.
Through these two examples, we have confirmed and discussed the results that can be derived from the proposed method. Overall, we were able to discriminate efficient DMUs in depth and consider important positional features, influence and superiority, by using the proposed method. In addition, we compared the results of each step to determine the competitive advantage in terms of the two positional features. The difference between the results of separate evaluation of superiority and influence supported the necessity of an integrated measure. Moreover, it was possible to deduce information about the distribution of high-dimensional data, which is difficult to visualize, as well as the relationship between DMUs by representing it as a network form.
We were also able to confirm that the meaning of the ranking result can be considerably different with respect to the nature of the data used. The meaning of the influence in the R&D data was an indicator that reflected the popularity and generality of the input–output transformation characteristics by showing how many inefficient DMUs have similar input–output structures. The superiority of R&D focused on how outstanding the performance was relative to other DMUs at that point. However, since the HEV case dealt with technology data, a more specialized approach can be applied to interpret the results. The outputs of the HEV case reflected and were proportional to the technology level, and thus, an expansion of the production possibility set can be described as the technology development. This interpretation is a well-known approach in technological forecasting using DEA (TFDEA) research [49]. Note that an expansion and reduction of the production possibility set of the R&D efficiency case does not directly imply development or regression of R&D. Therefore, the production possibility set of the technology data generally expands over time as the technology advances. From this perspective, efficient DMUs can be regarded as not only achievers of the highest performance, but also pioneers of technology development. Consider the following two situations. First, the influence of a particularly efficient DMU is very large, but its superiority is low. This difference means that although the DMU is the current exemplar for many inefficient DMUs, there is a high probability of being caught-up by inefficient DMUs because of the low-performance gap (low superiority). Therefore, much effort will be needed to maintain the leading position. Conversely, consider a situation where the superiority of a certain DMU is very high, but the influence is extremely low. This implies that a certain DMU has pioneered a new technology area and niche market, but there is also market risk because its positional characteristic is quite distinctive and only valid for a few DMUs. For these reasons, the rank result is more meaningful and considered as sophisticated when applying the proposed dominance-based method to the technology data.

5. Conclusions

Much previous work has pointed out the low discriminating power of DEA, because it is hard to distinguish the performance of efficient DMUs, and a number of ranking methods have been attempted. This study proposes a “dominance value” for ranking efficient DMUs based on the concept of centrality measures in network theory. The dominance value incorporates two core positional features of efficient DMUs: influence and superiority. Influence captures the importance of the role of efficient DMUs as a benchmarking target for inefficient DMUs, and superiority reflects the relative position on the frontier compared to other DMUs.
The major contribution of our study is that we compound influence and superiority features into a single measure (i.e., the dominance value), which was conventionally discussed separately in the existing literature. The proposed method; therefore, gives a comprehensive ranking result. For demonstration, we also introduce two examples to illustrate how the dominance value-based ranking differs from the ranking results of evaluating two features separately. Additionally, by comparing the networks generated through the application process, one can grasp the information about the actual distribution of efficient DMUs.
This research introduces three ways of expressing the relationship of DMUs in a network form: the network of influence (weight network), superiority (gap network), and dominance (weighted-gap network). In a typical DEA study, the efficiency score and benchmarking results are usually presented in a table or text format. Through this work, we confirmed that more information can be obtained by expressing the relationship of DMU with a network representation. DEA frequently deals with high-dimensional data of multiple inputs and outputs, so it is difficult but critical to identify the relationship between the data and DEA results [50]. However, through this research paper, it is confirmed that network representation has the potential to be a useful technique as a visualization method for DEA.
We highlight that there are some areas where an application of the proposed method is thought to be beneficial. For example, based on the empirical evidence from the HEV example, it could be applied to the problem of establishing a specific technology strategy for determining the direction of future technology development. Information about the superiority and influence features of contemporary state-of-the-art technologies may be valuable for decision makers. In a similar vein, the proposed method could be also used in establishing a market entry strategy or competition analysis.
However, there are a few limitations to the proposed method. First is a problem of ranking weak-efficient DMUs. In the case of weak-efficient DMUs, two positional features may not be captured and, thus, it is difficult to discriminate them. Other approaches, for example, the CE-based superiority or virtual DMU-based superiority, need to be studied to overcome this limitation. Second, more research on the combination method of superiority and influence is required. For example, combining a method that reflects the decision maker’s preference for the two features can be developed and other types of combination method for two features instead the matrix multiplication can be explored. Third, network visualization may not be useful when the number of DMUs is too many. In such cases, it is recommended to complementarily use other network analysis tools (i.e., other centrality measures) to understand the relationship between DMUs.
There are several avenues for future work since the proposed method is very extensible and flexible. First, the application of panel data. By analyzing the multi-period trends of the competitiveness and positional characteristics of DMUs, it is also possible to measure the sustainability of performance. The sustainability of performance could become a new feature, in addition to superiority and influence. Second, the network edge formed by the basic DEA result is directed from inefficient DMUs to efficient DMUs, which results in a simple network. It is well known that the basic benchmarking target of DEA is too ideal for inefficient DMUs with poor performance, thus many methods [51,52] have been introduced to identify stepwise-benchmarking targets. Context-dependent DEA [53] is a tier analysis technique, which iteratively finds the next-best frontier. After stratification of the frontiers, one can generate a tier-wise benchmarking relationship based on this and build a network with a deeper structure containing benchmarking path candidates. When applying tier analysis in the proposed method, it is expected that one will be able to implement a more in-depth and detailed analysis than merely by dividing DMSs into either efficient or inefficient. Additionally, the proposed method has the potential as an outlier detection method or production frontier estimation method, when focusing on the process of deducting information about data distribution.

Author Contributions

Conceptualization, J.L. and G.C.; methodology, J.L. and G.C.; software, J.L.; validation, J.L. and G.C.; formal analysis, J.L.; writing—original draft preparation, J.L.; writing—review and editing, G.C.; visualization, J.L.; supervision, G.C.

Funding

This research received no external funding.

Conflicts of Interest

The authors declare no conflicts of interest.

References

  1. Charnes, A.; Cooper, W.W.; Rhodes, E. Measuring the efficiency of decision making units. Eur. J. Oper. Res. 1978, 2, 429–444. [Google Scholar] [CrossRef]
  2. De Witte, K.; Marques, R.C. Influential observations in frontier models, a robust non-oriented approach to the water sector. Ann. Oper. Res. 2010, 181, 377–392. [Google Scholar] [CrossRef] [Green Version]
  3. Lin, W.; Chen, B.; Xie, L.; Pan, H. Estimating energy consumption of transport modes in China using DEA. Sustainability 2015, 7, 4225–4239. [Google Scholar] [CrossRef]
  4. Guan, J.; Chen, K. Measuring the innovation production process: A cross-region empirical study of China’s high-tech innovations. Technovation 2010, 30, 348–358. [Google Scholar] [CrossRef]
  5. Lee, J.; Kim, C.; Choi, G. Exploring data envelopment analysis for measuring collaborated innovation efficiency of small and medium-sized enterprises in Korea. Eur. J. Oper. Res. 2018, in press. [Google Scholar] [CrossRef]
  6. Simões, P.; Marques, R.C. On the economic performance of the waste sector. A literature review. J. Environ. Manag. 2012, 106, 40–47. [Google Scholar] [CrossRef] [PubMed]
  7. Pang, J.; Chen, X.; Zhang, Z.; Li, H. Measuring eco-efficiency of agriculture in China. Sustainability 2016, 8, 398. [Google Scholar] [CrossRef]
  8. Wu, D.; Yang, Z.; Liang, L. Using DEA-neural network approach to evaluate branch efficiency of a large Canadian bank. Expert Syst. Appl. 2006, 31, 108–115. [Google Scholar] [CrossRef]
  9. Emrouznejad, A.; Yang, G.L. A survey and analysis of the first 40 years of scholarly literature in DEA: 1978–2016. Socio-Econ. Plan. Sci. 2018, 61, 4–8. [Google Scholar] [CrossRef]
  10. Liu, J.S.; Lu, L.Y.Y.; Lu, W.-M. Research fronts in data envelopment analysis. Omega 2016, 58, 33–45. [Google Scholar] [CrossRef]
  11. Aldamak, A.; Zolfaghari, S. Review of efficiency ranking methods in data envelopment analysis. Measurement 2017, 106, 161–172. [Google Scholar] [CrossRef]
  12. Adler, N.; Friedman, L.; Sinuany-Stern, Z. Review of ranking methods in the data envelopment analysis context. Eur. J. Oper. Res. 2002, 140, 249–265. [Google Scholar] [CrossRef]
  13. Park, J.; Sung, S.I. Integrated approach to construction of benchmarking network in DEA-based stepwise benchmark target selection. Sustainability 2016, 8, 600. [Google Scholar] [CrossRef]
  14. Estrada, S.A.; Song, H.S.; Kim, Y.A.; Namn, S.H.; Kang, S.C. A method of stepwise benchmarking for inefficient DMUs based on the proximity-based target selection. Expert Syst. Appl. 2009, 36, 11595–11604. [Google Scholar] [CrossRef]
  15. Anderson, T.R.; Hollingsworth, K.; Inman, L. Assessing the rate of change in the enterprise database system market over time using DEA. In Proceedings of the Portland International Conference on Management of Engineering and Technology (PICMET), Portland, OR, USA, 29 July–2 August 2001; pp. 384–390. [Google Scholar]
  16. Po, R.-W.; Guh, Y.-Y.; Yang, M.-S. A new clustering approach using data envelopment analysis. Eur. J. Oper. Res. 2009, 199, 276–284. [Google Scholar] [CrossRef]
  17. Liu, F.H.F.; Hsuan Peng, H. Ranking of units on the DEA frontier with common weights. Comput. Oper. Res. 2008, 35, 1624–1637. [Google Scholar] [CrossRef]
  18. Ramón, N.; Ruiz, J.L.; Sirvent, I. Common sets of weights as summaries of DEA profiles of weights: With an application to the ranking of professional tennis players. Expert Syst. Appl. 2012, 39, 4882–4889. [Google Scholar] [CrossRef]
  19. Hadad, Y.; Hanani, M.Z. Combining the AHP and DEA methodologies for selecting the best alternative. Int. J. Logist. Syst. Manag. 2011, 9, 251–267. [Google Scholar] [CrossRef]
  20. Sinuany-Stern, Z.; Mehrez, A.; Hadad, Y. An AHP/DEA methodology for ranking decision making units. Int. Trans. Oper. Res. 2000, 7, 109–124. [Google Scholar] [CrossRef]
  21. Andersen, P.; Petersen, N.C. A Procedure for Ranking Efficient Units in Data Envelopment Analysis. Manag. Sci. 1993, 39, 1261–1264. [Google Scholar] [CrossRef]
  22. Chen, Y. Ranking efficient units in DEA. Omega 2004, 32, 213–219. [Google Scholar] [CrossRef]
  23. Jahanshahloo, G.R.; Hosseinzadeh Lotfi, F.; Shoja, N.; Tohidi, G.; Razavyan, S. Ranking using l1-norm in data envelopment analysis. Appl. Math. Comput. 2004, 153, 215–224. [Google Scholar] [CrossRef]
  24. Rezai Balf, F.; Zhiani Rezai, H.; Jahanshahloo, G.R.; Hosseinzadeh Lotfi, F. Ranking efficient DMUs using the Tchebycheff norm. Appl. Math. Model. 2012, 36, 46–56. [Google Scholar] [CrossRef]
  25. Sexton, T.R.; Silkman, R.H.; Hogan, A.J. Data Envelopment Analysis: Critique and Extensions. New Dir. Progr. Eval. 1986, 1986, 73–105. [Google Scholar] [CrossRef]
  26. Zerafat Angiz, M.; Mustafa, A.; Kamali, M.J. Cross-ranking of Decision Making Units in Data Envelopment Analysis. Appl. Math. Model. 2013, 37, 398–405. [Google Scholar] [CrossRef] [Green Version]
  27. Liu, X.; Chu, J.; Yin, P.; Sun, J. DEA cross-efficiency evaluation considering undesirable output and ranking priority: A case study of eco-efficiency analysis of coal-fired power plants. J. Clean. Prod. 2017, 142, 877–885. [Google Scholar] [CrossRef]
  28. Jahanshahloo, G.R.; Afzalinejad, M. A ranking method based on a full-inefficient frontier. Appl. Math. Model. 2006, 30, 248–260. [Google Scholar] [CrossRef]
  29. Azizi, H. The interval efficiency based on the optimistic and pessimistic points of view. Appl. Math. Model. 2011, 35, 2384–2393. [Google Scholar] [CrossRef]
  30. Wang, Y.M.; Chin, K.S.; Yang, J.B. Measuring the performances of decision-making units using geometric average efficiency. J. Oper. Res. Soc. 2007, 58, 929–937. [Google Scholar] [CrossRef]
  31. Jahanshahloo, G.R.; Junior, H.V.; Lotfi, F.H.; Akbarian, D. A new DEA ranking system based on changing the reference set. Eur. J. Oper. Res. 2007, 181, 331–337. [Google Scholar] [CrossRef]
  32. Chen, J.X.; Deng, M. A cross-dependence based ranking system for efficient and inefficient units in DEA. Expert Syst. Appl. 2011, 38, 9648–9655. [Google Scholar] [CrossRef]
  33. Du, J.; Liang, L.; Yang, F.; Bi, G.B.; Yu, X.B. A new DEA-based method for fully ranking all decision-making units. Expert Syst. 2010, 27, 363–373. [Google Scholar] [CrossRef]
  34. Wang, Y.M.; Luo, Y. DEA efficiency assessment using ideal and anti-ideal decision making units. Appl. Math. Comput. 2006, 173, 902–915. [Google Scholar] [CrossRef]
  35. Shetty, U.; Pakkala, T.P.M. Ranking efficient DMUs based on single virtual inefficient DMU in DEA. OPSEARCH 2010, 47, 50–72. [Google Scholar] [CrossRef]
  36. Izadikhah, M.; Farzipoor Saen, R. A new data envelopment analysis method for ranking decision making units: An application in industrial parks. Expert Syst. 2015, 32, 596–608. [Google Scholar] [CrossRef]
  37. Wang, Y.M.; Yang, J.B. Measuring the performances of decision-making units using interval efficiencies. J. Comput. Appl. Math. 2007, 198, 253–267. [Google Scholar] [CrossRef] [Green Version]
  38. Azizi, H.; Wang, Y.M. Improved DEA models for measuring interval efficiencies of decision-making units. Measurement 2013, 46, 1325–1332. [Google Scholar] [CrossRef]
  39. Liu, J.S.; Lu, W.M.; Yang, C.; Chuang, M. A network-based approach for increasing discrimination in data envelopment analysis. J. Oper. Res. Soc. 2009, 60, 1502–1510. [Google Scholar] [CrossRef]
  40. Liu, J.S.; Lu, W.M. DEA and ranking with the network-based approach: A case of R&D performance. Omega 2010, 38, 453–464. [Google Scholar]
  41. Liu, J.S.; Lu, W.M. Network-based method for ranking of efficient units in two-stage DEA models. J. Oper. Res. Soc. 2012, 63, 1153–1164. [Google Scholar] [CrossRef]
  42. Hinojosa, M.A.; Lozano, S.; Borrero, D.V.; Mármol, A.M. Ranking efficient DMUs using cooperative game theory. Expert Syst. Appl. 2017, 80, 273–283. [Google Scholar] [CrossRef]
  43. Banker, R.D.; Charnes, A.; Cooper, W.W. Some Models for Estimating Technical and Scale Inefficiencies in Data Envelopment Analysis. Manag. Sci. 1984, 30, 1078–1092. [Google Scholar] [CrossRef]
  44. Zafarani, R.; Abbasi, M.A.; Liu, H. Social Media Mining: An Introduction; Cambridge University Press: Cambridge, UK, 2014; ISBN 9781139088510. [Google Scholar]
  45. Tone, K. A slacks-based measure of efficiency in data envelopment analysis. Eur. J. Oper. Res. 2001, 130, 498–509. [Google Scholar] [CrossRef] [Green Version]
  46. Cruz-Cázares, C.; Bayona-Sáez, C.; García-Marco, T. You can’t manage right what you can’t measure well: Technological innovation efficiency. Res. Policy 2013, 42, 1239–1250. [Google Scholar] [CrossRef]
  47. KOSIS (KOrean Statistical Information Service). Available online: http://kosis.kr/statHtml/statHtml.do?orgId=101&tblId=DT_1KI1556&conn_path=I2 (accessed on 5 April 2019).
  48. Lim, D.J.; Jahromi, S.R.; Anderson, T.R.; Tudorie, A.A. Comparing technological advancement of hybrid electric vehicles (HEV) in different market segments. Technol. Forecast. Soc. Chang. 2015, 97, 140–153. [Google Scholar] [CrossRef]
  49. Inman, L.; Anderson, T. TFDEA: A New Approach for Technology Forecasting of New Product Development Targets. In Proceedings of the Portland International Conference on Management of Engineering and Technology (PICMET 04), Seoul, Korea, 1–4 August 2004. [Google Scholar]
  50. Akay, A.E.; Ertek, G.; Büyüközkan, G. Analyzing the solutions of DEA through information visualization and data mining techniques: SmartDEA framework. Expert Syst. Appl. 2012, 39, 7763–7775. [Google Scholar] [CrossRef] [Green Version]
  51. Kwon, H.B.; Marvel, J.H.; Roh, J.J. Three-stage performance modeling using DEA–BPNN for better practice benchmarking. Expert Syst. Appl. 2017, 71, 429–441. [Google Scholar] [CrossRef]
  52. Ramón, N.; Ruiz, J.L.; Sirvent, I. Two-step benchmarking: Setting more realistically achievable targets in DEA. Expert Syst. Appl. 2018, 92, 124–131. [Google Scholar] [CrossRef] [Green Version]
  53. Seiford, L.M.; Zhu, J. Context-dependent data envelopment analysis—Measuring attractiveness and progress. Omega 2003, 31, 397–408. [Google Scholar] [CrossRef]
Figure 1. DEA results (radial model) using network representation; λ j k refers to the benchmarking weight of D M U j for inefficient D M U k (Definition 2). λ j k > 0 when D M U k benchmarks D M U j ; otherwise, λ j k = 0 .
Sustainability 11 02059 g001
Figure 2. Superiority and influence.
Sustainability 11 02059 g002
Figure 3. Illustration of the procedure of the proposed method.
Sustainability 11 02059 g003
Figure 4. Weight (influence) network for the R&D case.
Sustainability 11 02059 g004
Figure 5. Gap (superiority) network for the R&D case.
Sustainability 11 02059 g005
Figure 6. Weighted-gap (dominance) network for the R&D case.
Sustainability 11 02059 g006
Figure 7. Weight (influence) network for the HEV case.
Sustainability 11 02059 g007
Figure 8. Data distribution of HEVs. EFF: Efficient DMUs. INEFF: Inefficient DMUs.
Sustainability 11 02059 g008
Figure 9. Gap (superiority) network for the HEV case.
Sustainability 11 02059 g009
Figure 10. Weighted-gap (dominance) network for the HEV case.
Sustainability 11 02059 g010
Table 1. Ranking methods using positional features.
CategoryReferencesDescriptionsFocus
Super efficiency (SE)Andersen and Petersen [21]; Chen [22]; Jahanshahloo et al. [23]; Rezai Balf et al. [24]Drop a certain efficient DMU being evaluated from the reference set and evaluate efficiencyDistance-based superiority
Cross efficiency (CE)Sexton et al. [25]; Zerafat Angiz et al. [26]; Liu et al. [27] Efficiency of each DMU is compared one by one for all pairs and aggregated to derive the final efficiencyDistance-based superiority
Alternative frontierJahanshahloo and Afzalinejad [28]; Azizi [29]; Wang et al. [30]Evaluate based on the least efficient frontierDistance-based superiority
Efficiency change of Inefficient DMUJahanshahloo et al. [31]; Du et al. [33]; Chen and Deng [32]Assess the efficiency change of inefficient DMUs that occurred by the exclusion of each efficient DMUDistance-based superiority
Virtual DMUWang and Luo [34]; Shetty and Pakkala [35]; Izadikhah and Farzipoor Saen [36]; Wang and Yang [37]; Azizi and Wang [38]Set a virtual DMU and compare the efficiency of DMUs with virtual DMUDistance-based superiority
Benchmarking importanceLiu et al. [39]; Liu and Lu [40]; Liu and Lu [41]Assess the benchmarking importance of efficient DMUsBenchmarking importance-based influence
Table 2. Descriptive statistics for R&D efficiency example.
x 1   ( number ) x 2   ( 1   m   KRW ) y 1   ( 1   m   KRW ) y 2   ( number )
Average4.82288.761989.542.20
St.dev5.15225.102257.341.34
Table 3. Influence, superiority, and dominance rank for R&D efficiency example.
InfluenceSuperiorityDominance
DMUValueRankValueRankValueRank
456.37631.87311.5741
278.36620.79930.7412
121.28370.92920.6623
281.00080.77250.5424
253.68140.79240.4275
819.18310.47860.3726
351.32260.00070.0007
191.78950.00070.0007
Table 4. Descriptive statistics for HEV example.
x 1   ( USD ) y 1   ( Seconds ) y 2   ( MPG ) y 3   ( MPGe )
Average40,762.7112.5334.6339.63
St.dev20,934.942.9310.6520.37
Table 5. Influence, superiority, and dominance rank for the HEV example.
InfluenceSuperiorityDominance
DMUValueRankValueRankValueRank
629.73611.47412.7571
1120.74020.85341.4902
297.96541.05721.4003
272.20380.88831.3144
6411.02130.56550.8175
994.02760.19070.4986
73.81270.27660.3077
927.57550.13980.2278
30.921100.04890.0439
981.00090.003100.00810
80.000110.000110.00011
140.000110.000110.00011

