1. Introduction
China’s economic accomplishments over the past forty years have gained worldwide attention, but the country has seen an expanding conflict between its economic development and depletion of resources and deterioration of the environment. In 2015, China consumed 23% of the world’s energy, while it contributed only 14.7% to the global GDP. That same year, among 338 prefecture-level cities, 265 of them (78.4% of all cities) failed to meet environmental air quality standards. In 2016, China ranked second to last on the global EPI (Environmental Performance Index). China’s 13th Five-Year Plan regards “green”—the promotion of the concordance between human beings and nature—as one of the most promising methods for tackling developmental problems and enhancing developmental powers. The 19th CPC National Congress named green development as a means to solve important social issues in the new era. On 18 May 2018, President Xi Jinping mentioned during the National Eco-Environmental Protection Meeting that green development was a promising way to form a high-quality modernized economic system and was also a fundamental method to solve pollution issues. He stressed that the future economy should be led by green development.
Green development has recently come to be viewed as a common-sense goal in China, but the population is divided on how to achieve it. One opinion asserts that implementing high-quality developmental policies can advance green development, with “green” being generally responsible for high-quality development [
1] (pp. 5–16). High-quality eco-environments and resources are major components of high-quality development. At the macro level, improvements in the quality of economic development increase the allocation efficiency of entire social resources. At the micro level, high-quality development (improving the total-factor productivity (TFP), which includes resources and the environment [
2] (pp. 20–34)) strives to be efficient. TFP involves increasing the production of goods or reducing harmful products (e.g., pollution) without changing inputs. Green development accounts for both developmental quality and efficiency, and it is focused on efficient resource use and comprehensive environmental protection [
3] (pp. 280). Development efficiency seeks to increase social welfare while reducing resource consumption and pollutant discharge. Improving input–output efficiency is the primary criterion for measuring green development. Thus, high-quality development can guide green development, and the impact of guiding high-quality development is both positive and significant.
Another view is to build environmental resources to force green development. This mode introduces a backward pass in economic development and sets the framework to dismiss any possible risks from society or deterioration [
4] (pp. 59–62). “Forcing methods” attempt to dissolve social contradictions in a way that tackles practical needs during reform and development [
5] (pp. 4–20) by generating impacts based on orientation, regulation, and creativity [
6] (pp. 141–150). The reason for implementing an environmental forcing mechanism for resources is to properly set scientific goals that force energy-saving and emission reduction. Such a mechanism explains that a sustainable human society yields reversible routes and is forward-thinking, which is a goal-oriented approach that sets strong constraints on resources and environmental targets. China’s 13th Five-Year Plan mentions that, compared to 2015, the GDP water consumption of every 10,000 Yuan in 2020 will decrease by 23%. The unit GDP energy consumption will also decrease by 15%, while the unit GDP carbon dioxide emissions will decrease by 18%. These statistics will be used to develop guidelines for district assessments. The central government in China has extreme control over local governments and can set authoritative goals for environmental resources. To achieve these goals, local governments must constantly adjust their economic modes.
Overcoming the issues above and determining the best mode for accomplishing green development will allow the green development movement to succeed and help build a green China. Thus, the aim of this paper is to identify the key factors of green development as well as test the effectiveness of policies aimed at high-quality development guidance and resource- and environmental-forcing. In addition, suggestions on appropriate paths for China’s Green Development will be made. It is also important to solve real economic issues to minimize social conflicts between development and protection.
This study uses synergy theory and a Haken model to build a systematic research framework where high-quality developmental guidance, resources, and environmental forcing can be simultaneously studied. This research tested the effects of their co-evolution using multiple comparison tests and revealed the parameter order for green developmental evolution and possible developmental routes. It also provides an in-depth analysis of multiple thoughts and the impact of each factor, determining the practical level of systematic evolution, and making judgements on green development levels within each province in China.
2. Literature Review
The study on green development mainly focuses on its influential mechanisms, which can be categorized as either macro or micro. There are four views at the macro level. The first view believes the government plays a vital role in green development. The government stipulations are the basis for building a legal social system, green society, and eco and economic systems [
7] (pp. 138–152). The government may promote green development by creating mechanisms to motivate, evaluate, constrict, and subsidize [
8,
9] (pp. 1018–1031, pp. 399–409). Taxation must also be included because the manipulation of a green environment tax can create a double route between the economy and the environment [
10] (pp. S108–S118), which also has a remarkable impact on improving companies’ green production technologies in this regard [
11] (pp. 814–823). In addition, the government plays a very important role in maintaining fairness, which encourages the entire society to democratically participate and manage green development [
12,
13] (pp. 1457–1468, pp. 72–81). The second view believes economic structure has a significant impact on green development. The OFDI brings green spillovers, but the current effects show large heterogeneities [
14] (pp. 829–844). The influence of high-tech industry on green development doubled the effect [
15] (pp. 1432). A third view argues that natural endowment is a significant factor in green development. In addition to the traditional government and industrial elements, geological elements, resource endowment, and natural capacity are also important for green development [
16,
17] (pp. 221–230, pp. 323–333). Resource exploitation and assets are key factors for win-win economic development [
18,
19] (pp. 9282–9304, pp. 80–91). The fourth view believes that citizens are key economic indicators, thus environmental protection education generates a direct and long-lasting impact [
20,
21] (p. 8, pp. 117–129). Zhang [
22] (pp. 18–24) proposed that a benign relationship exists between humans and nature when people change their way of life to adopt a greener lifestyle.
There are also four beliefs at the micro level, which are summarized as follows. The first view thinks that consumers’ values in consumption, sensibility, and spending habits influences and encourages green manufacturing, and the idea of “going green” encourages people to buy green products [
23] (pp. 16–24). Green brand satisfaction has a positive effect on green trust, effects, and loyalty [
24] (pp. 306–316). Stronger green consumption values increase preferences for environmentally-friendly products [
25,
26] (pp. 336–354, pp. 36–39). The second opinion is that appropriate strategies by companies respond effectively to the environment [
27] (pp. 83–96). The third view is that productive manufacturing methods are an indispensable means to encourage green development by promoting green techniques, cleaning techniques, and green materials [
28,
29] (pp. 1285–1295, pp. 1240–1246). Informal environmental regulations are represented by environmental-related technologies, which show positive and significant impacts on green growth [
30] (pp. 1346–1354). Building production methods that circulate utilization and promote energy efficiency are equally important [
31,
32] (pp.448-453, pp. 189–210). The fourth view thinks that enterprises should build green product value chain frameworks based on product development, processing, marketing, organization, and institutions [
33] (pp. 984–995). Green supplier development is also necessary for effectively managing green supply chains [
34,
35] (pp. 1200–1210, pp. 656–688). Involving key suppliers in the development of new green products for environmentally-demanding customers and markets can bring both environmental and commercial success [
36,
37] (pp. 527–538, pp. 757–779).
Zhang [
38] (pp. 14–17) analyzed China’s green development system using a coordinated theory framework, but the research was not comprehensive; it only investigated energy and environment systems and neglected the economic system. Thus, such a study does not provide a real systematic analysis of green development.
A comprehensive analysis of the existing research shows that systematic characteristics of green development are mostly neglected, and studies simply equate green development with environmental protection. The reality is that green development is a system consisting of many factors such as the economy, the environment, and resources. If the systematic characteristics of green development are not understood, then it is impossible to study it from an internal perspective, which is why the current literature mainly studies green development from an external perspective. The current literature regards the economic development as a liner mode of “resource–product–emission,” and this idea pits economic development against environmental resource protection. It also ignores the endogenous function of high-quality development, which is characterized by a higher output with a lower input, which saves resources and reduces pollutant discharge. In addition, current literature has mainly focused on influences, while the green development system itself is seldom regarded as the research subject. This results in an incomplete understanding of the internal movements of green development.
3. Green Development Synergy Mechanism
There are abundant examples of synergistic phenomena that exist in both natural and social fields. Synergy means that all factors of a complicated system work together to dissect, transfer, affect, and deliver information to reach unity, and this has complementary effects, scale effects, and amplification effects. This type of interaction makes a systematic function larger than the simple sum of the individual factors or any sub-systems; this gives a result of one plus one that is greater than two. Synergy is the premise and key basis of system development and evolution, which advances the system from balanced to imbalanced to balanced, and from organized to disorganized to organized, reaching the overall development goal.
The green development system considers the consumption of resources and ecosystems as internal factors for reviewing economic development. It includes the economy, resources, the environment, government, enterprises, the public, individuals, and others. They restrain and transform each other, and they dynamically optimize to drive the evolution of green development. In this study, the green development system is divided into two parts: a power system and a constraint system. High-quality development is guided by a power system, and the quality of resources and the environment are driven by the high-quality development of the entire society. Green development can be realized by guiding the high-quality development of an entire society. Resource and environmental forcing are constraint systems, and by setting strict targets for resource consumption and pollution discharge, the economic development is forced to transform. Green development can be realized by implementing restrictions on resource consumption and pollution discharge since these two systems cooperate and interact with each other to form a logical kernel.
Dissipative structures are the foundation and premise for synergistic development. Dissipative theory proposes that there are four necessary conditions for a system to transform from a disordered state to dissipative structure. They are open, imbalanced, and non-linear effects of internal factors and fluctuation factors, and green development meets these requirements.
Openness of the system. Green developmental systems are open systems, which means that external information and energy can directly impact the sustainability of power and system constraints (high-quality developmental guiding and resources- and environmental-forcing). High-quality is a comparative concept because many external factors can impact and constrain its evaluation criterion. Undergoing more frequent exchanges and interactions can generate different modes and new policy tools, as well as new programming methods. Environmental-and resource-forcing is more related to external factors. The targets of energy consumption and environmental protection can be affected by different political and economic times. The methods, content, and standards of power of a constrained system can be continually improved according to different external environments to allow it to evolve to its optimum state.
Non-linearity: Non-linearity is the result of a green development power system and a constraint system, and it is also an internal factor of micro to macro evolution. High-quality guidance and resource- and environmental-forcing systems are an agreement concerning effective economic development, environmental protection, resource savings, public well-being, and other purposes. All factors and sub-systems located at different levels are impacted by their external environments (for example: global warming) and increasing internal pressure, which can cause structural changes to uses among elements and systems. Thus, the uncertainty and unpredictability obviously grow, and a simple linear relationship cannot adequately explain this. The green development process can be viewed as practical solution in a multi-objective optimality from the transformation of a system constraint and power system.
Imbalance. The non-linear aspect of green development causes resources, environments, governments, industry, and the public and other elements, variables, and sub-systems to enter an inconsistent and imbalanced state. After each factor, power varies and the constraint system exchanges energy and information with its surroundings; thus, its own structure and stability will be changed. For example, new environmental protection technology and energy-saving materials can alter the constraint system. Once it has been changed, it will cause chaos when interacting with other factors and variables, which further disturbs the green development mechanism balance. Furthermore, subsystems such as economic development, resource savings, and environmental protection may separate into smaller subsystems that each have different technique statuses, progressions, and changeable conditions. This can cause fluctuations that result in a long-lasting, imbalanced status for green development.
Fluctuation. Changes to any individual factor in a green development process will cause the “butterfly effect”. This will first appear in an internal system when a certain limit is exceeded, causing changes that will expand to the outside, resulting in a final qualitative change in the green development system. For instance, as the economy develops, resource and environmental projects increase stress, but within a certain scope, extensive development is maintained. However, when the resource-bearing and environmental capacities are reached, it can be disastrous for resource and environment systems. In other words, when economic sustainability is low, social wellbeing and the quality of people’s daily lives will decrease, which will cause the whole system to degenerate to a lower “organized” level. The economic system will then adjust internally to choose a new developmental mode. The “fluctuations” can cause great impact because green developmental systems and their subsystems are imbalanced in the long term.
In summary, the power, constraint, and other subsystems have an imbalanced impact on green developmental systems. When the changeable level of variables exceeds the linear stability static point, the system will change from an organized state to a disorganized one, which generates a new balance and leads to a new form of organization. Therefore, based on the characteristics of green developmental self-organized synergy, this study can employ the Haken model to analyze its internal synergy mechanism.
5. Results
5.1. Traits of Green Development Subsystems
Based on the indications and methods above, the resource-restricted system (REI), environmental-restricted system (ENI), and power system of high-quality development (ECI) were computed. Results are listed in
Table 2,
Table 3 and
Table 4.
5.2. Green Development Synergy Evolution Result
This study contained three variables (REI, ENI, and ECI), while the Haken model had only
,
, and this study analyzed these three subsystems with any two variables accordingly. In the first step of the method, a model value was proposed for
,
. In the second step, a subsystem motion equation was built and tested. In the third step, parameter execution and testing, and adiabatic approximation occurred, and the proposed model was tested.
Table 5 shows the result from 2003 to 2015.
Zhang [
38] (pp. 14–17) showed that energy efficiency was the order parameter in green development. It is the key factor in determining sustainable development in China’s energy-economy-environment (3E) system and has a profound impact on reducing the intensity of atmospheric pollution. Neither energy efficiency nor pollutant emission intensity had a benign synergistic effect, and in fact, pollutant emission intensity reduced energy efficiency. The results of the present study were different because Zhang [
38] (pp. 14–17) only tested the energy and environment systems and did not discuss the 3E economic system. In addition, they used an insufficient data sample of only three years (2010, 2005, and 2000).
During the green development process, high-quality development was the order parameter. Model 3 in
Table 5 presents the synergy evolution results of China’s green development. By promoting the internal system from an imbalanced state to a balanced state, the key factor to realize a spiral increase was the guidance of high-quality development. It showed that increasing the quality of economic development was an effective way to promote green development. China’s economy has received global attention, but the benefits for labor and the capital gain are disappearing. Additionally, multiple pressures from resource depletion and environmental degradation have pushed economic development. Transforming the power of economic growth into technological progress (i.e., driving innovation), is an inevitable choice [
43] (pp. 56–71). High-quality development seeks to build a sustainable economy through active implementation of technological innovations to improve TFP, reduce energy consumption, and reduce the ecological cost, resource cost, and environmental costs of economic development [
44,
45] (pp. 66–86). The key to increasing economic quality is total-factor productivity, which includes macro-resource distribution efficiency and micro-production effectivity. Increasing the distribution of resources depends heavily on maximizing the use of natural resources, including reducing resource consumption, updating the resource structure, and developing new energies. Increasing micro-productivity requires an increase in the production rate and the consideration of the pollution factor, with a certain input. Therefore, increasing the total-factor productivity, diversifying the economic development, and gaining the development power to increase sustainability will change the methods of resource, environment, and economic use to promote green development.
Improving the quality of economic development may promote the efficiency of environmental forcing, but not vice versa. Model 3 in
Table 5 shows the control parameter b = 0.1838, and since it was a positive value, it indicated that an increase in quality of economic development generated a synergistic effect on the environmental forcing mechanism. Regional economic development can help regions solve environmental problems [
46] (pp. 66–86), and TFP development is the key factor. The growth of total-factor productivity can reduce environmental pollution emissions per unit of output matter. High-quality development pursues a person-centered development view, while the pursuit of good life includes a stable ecosystem and environment. Thus, high-quality development includes the eco-environment, general economic benefits, and social benefits. A high-quality economy needs to have a high-quality eco-environment. China has promoted industrial structures that are more appropriate and high-end, while also reducing pollution and changes to the environment. In 2017, the average PM2.5 was 43 μg/m
3, which was 6.5% lower than the 2016 value. The over-standard day ratio was 12.4%, which was 1.7% lower than in 2016. I~III water quality section (point) ratio increased by 0.1% compared to 2016.
However, the control parameter had a positive value, which indicated that environment forcing did not promote high-quality development. Such a research result was interesting, but it was unclear why the result was obtained. To explain it, it must first be noted that the goal of unit pollution emission itself is not appropriate. When pollution emission is stable or shows a slight increase, a large increase in the denominator (industrial producing value, GDP) sum still meets the goal, especially since the high-polluted industry itself is high-value, which is why it is difficult in practice to let go of the over-produced products. Secondly, an established, objective-constraint forcing mechanism cannot be realized without a restrictive environmental policy. While impacted by district, industrial structures, and other reasons, environmental stipulations do not influence pollution emission in a linear way [
47] (pp. 56–71). Thirdly, at the micro level, because of differences in the cost of compliance with environmental regulations among different enterprises, adjustment measures were different for different enterprises that faced the same environmental regulations. It is not necessary for some enterprises to reduce their production of high pollution emissions [
48] (pp. 43–62). Fourthly, there is not an effective benefit-sharing mechanism, which causes a gap between ecological protectors and environmental beneficiaries. This imbalance has led to a new environmental inequity [
49] (pp. 14–27), which reduces the willingness of entities to voluntarily reduce their emissions.
(3) Increasing high-quality development may promote the organized evolution of green development, while environment forcing prevents the goal from being reached. Model 3 in
Table 5 shows the control parameter
= −0.0067, and the value was negative, which indicated that high-quality development had already resulted in a positive feedback mechanism within the organized evolution of green development. Increasing the quality of economic development will also increase the green development level accordingly, and when the former decreases, the latter will too. The absolute value of
was relatively low, which meant that the synergy evolution ability of high-quality development was low. These results show that full attention should be given to the role of politics and culture in improving green development levels. Environmental regulation is the main method for realizing the green transition [
50] (pp. 56–71), as well as guiding high-quality development, and improving personal lifestyles in addition to manufacturing methods.
= 0.4673, it was positive, which indicated that the effects of environment forcing were decreasing. While this cannot promote a positive organized evolution of the green development, it can, however, hinder the green development. As stated above, the effects that restrict the unit emission to build a forcing mechanism are limited. If the mode of economic development is not transferred, the forcing mechanism can only function after events have occurred. Secondly, this paper focused on industrial pollution emission and did not include living pollution in the analysis framework. As the living standard improves, the living pollution emission ratio increases at a rapid pace. For example, with waste water emissions, relative to influence factors, sewage has been the main source of pollution. In fact, in 2015 the amount of sewage was 53.52 billion tons, which accounted for 72.78% of all water waste, while the value in 2005 was 53.65%.
(4) High-quality development does not generate a synergistic effect on resource forcing. Models 1 and 2 in
Table 5 show that neither the high-quality development nor the resource-saving passed the order parameter test and indicates that neither party formed the synergy evolution mechanism of the green development system. Interaction and inter-promotion effects were not observed within high-quality development nor in resource forcing. Upon further analysis, it was seen that one was at a different level from China’s economic development level, where some districts were industrial sectors. Heavy industry consumes more rations and results in a large increase in resource consumption. Using Xin Jiang as example, the unit energy consumption was not obvious. The price level was kept at its 1990 value, and the energy consumption was 5.14 tons in 2015 per 10,000 yuan of GDP, which was an increase of 0.16 tons compared to the 2005 value. Secondly, this paper focused mainly on industry-level resource conservation, and household consumption was not included. However, China’s day-to-day living energy consumption was obvious and accounted for 33% of the total energy consumption in 2015, which was 5% higher than the 2010 value.
5.3. Motion Synergy Ability Test Results
Computing the function equation allows the stable point of the green developmental system synergy evolution to be determined for each major province (city) or self-governing district, as well as the evolution result, judging by its green developmental level. According to Equation (7), the potential function for the green development of China over the period of 2003–2015 is:
Since
,
, Equation (12) has three solutions.
,
, and
, where
is the unstable point. Regardless of what the system is, it will return to
and
. The second derivative of the potential function is:
Substituting the steady-state solution
into Equation (13):
This means
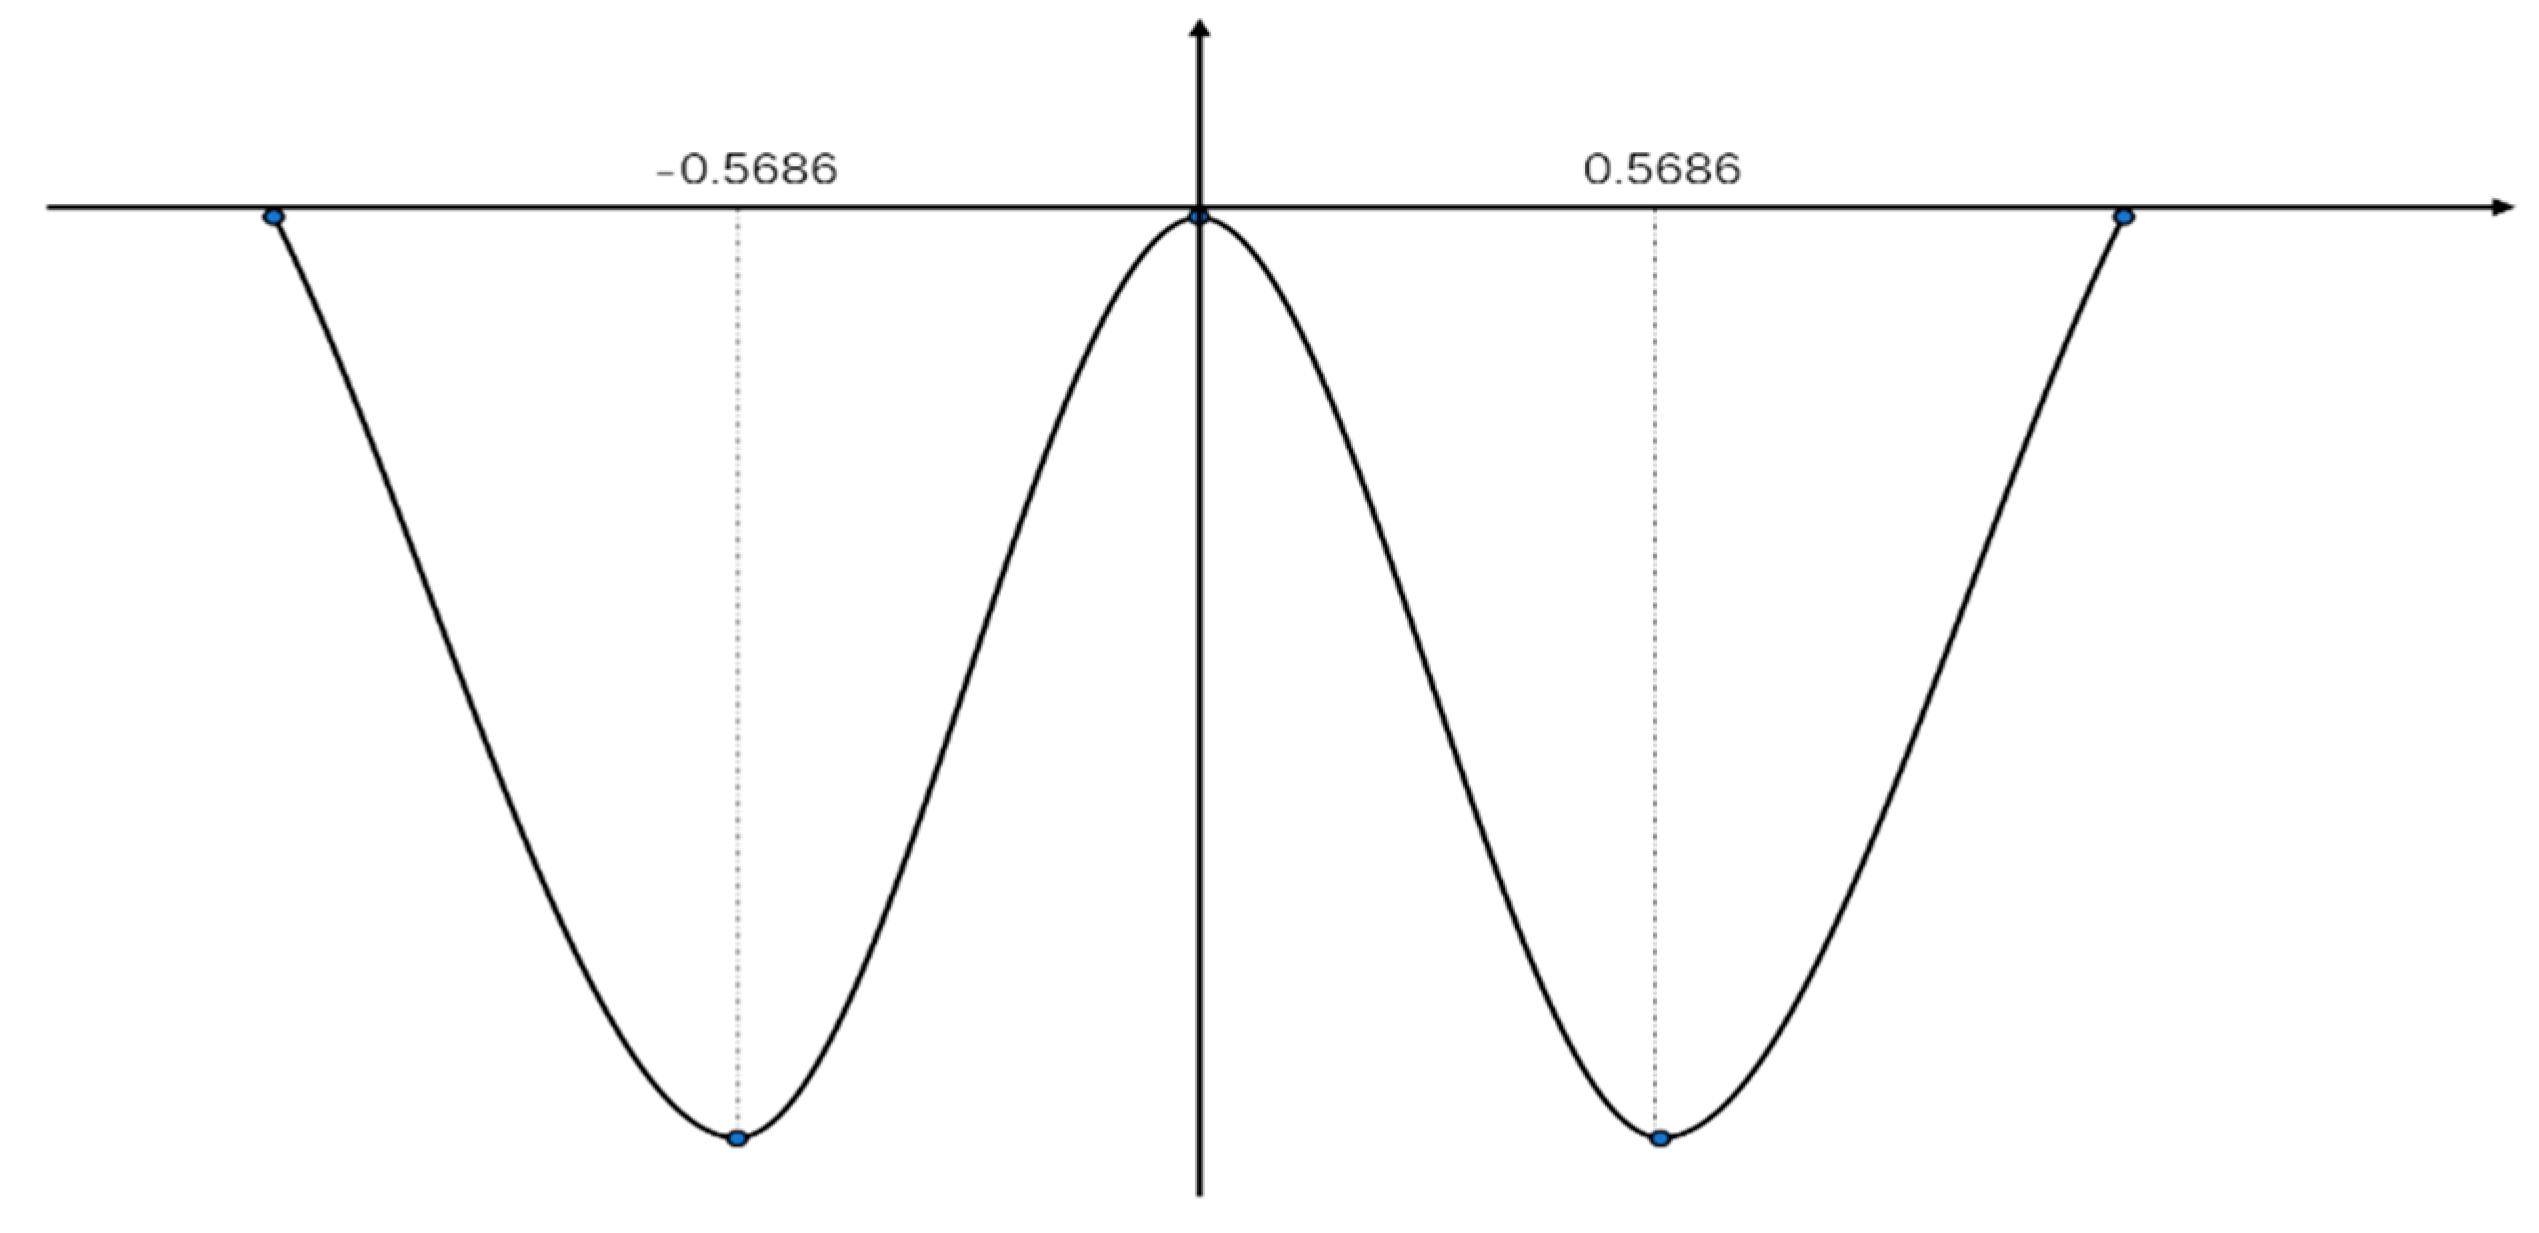
, and its potential function has minimal value, as shown in
Figure 1.
Structural traits of potential functions reflect the evolution mechanisms of green development systems, when status variables , , and control parameters , , , and change, the system also changes, and the original stable status returns to an unstable one. When proper control variables are used, the green developmental power system and constraint system generates non-zero values and forms a new stable status. This means that, when a stable status has been reached, the system obtains a new organized structure to enter into a new stage. Based on the results presented in this paper, the synergy point was 0.5686, which meant that values less than this indicated a low synergy developmental stage. At this stage, the synergy impact of high-quality development is low, and green development exists at a relatively low stage. Values above this point indicate an increase in the synergistic effect of high-quality development. The economic development quality generates an internal impetus to decrease the unit pollution emission, which can lead to a reduction in emissions, and promote green development, which at this stage is fairly high.
According to
Table 4, the eastern area of China showed a relatively high green development synergy evolution at the district level. Since 2013, the average synergy value of the east exceeded the static point, and the synergistic effect of the high-quality economic development showed an obvious increase. High-quality economic development in the eastern part of the country also had an increasingly prominent impact on environmental pollution, which can push green development into a higher stage. The main reasons for this phenomenon are, firstly, the east possesses a high technology level with strong inventiveness (in 2015, ten of the eastern provinces applied for a total of 1.77 million patent applications, and 1.75 million were granted, which accounted for values as high as 66.4% and 67.3%). The inventiveness effectively promotes changes in the economic development mode, which raises the productivity and the adoption of new technology, tools, and methods in manufacturing to upgrade the production processes to lower pollution emissions. Secondly, the east has previously suffered environmental limitations, so this region pays greater attention to upgrading its industrial structure, economic development synergy, and environmental protection to increase its developmental quality. In 2015, the total value of the five most highly-polluting industries included paper-making, petroleum processing, chemical products, non-metallic minerals, and ferrous metals. This accounted for 46% of the nation’s total value, and decreased to 15% compared to the 2002 value, which has had a positive impact on green development.
In the central, west, and northeast areas of China, the static point has not yet been reached, and lies far away from the average value. This indicates that the northeast, central, and west regions have a low synergy effect from the economic development. In the central area, the economic structure is inappropriate. In 2015, its industry accounted for 46% of GDP, which was 6% higher than the average, and increased the pollution emissions in the central area. In 2015, the air pollution with 10,000-yuan industrial value added in the central area was 1.4 times higher than the national value. The western area had a lower economic development, and its 2015 per capita GDP, per capita retail sales, and per capita income of the national average were 69%, 61%, and 74%, respectively. The ability of new technology to impact the speed of green developmental synergy evolution is relatively weak. The west and central areas were more impacted by the transfer of industry. The proportion of high energy consumption and pollution industry in GDP was increased. Using coal and concrete as examples, in 2015, the west area’s coal and cement accounted for 56% and 34% of the total, and increased to 22% and 13% in 2003, respectively. The northeast was impacted more by the economic development adjustment, especially its per capita income and per capita retail sales, which were lower than the national average.
Many provinces in China have exceeded the static point since 2008. The synergy impact from high-quality economic development on the reduction of environmental pollution showed an obvious increase, and these provinces entered a new stage of green development, as shown in
Table 6.
Since 2008, China has seen seven provinces and cities enter a more advanced stage of synergy evolution: Shanghai, Beijing, Tianjin, Jiangsu, Zhejiang, Guangdong, and Shandong. A common trait of these provinces is that they promoted industrial structure upgrades earlier, more quickly changed their economic development modes, and their total factor productivity contributed highly to their economic growth. The results of this study are basically similar to [
40] (pp. 21–33).
6. Conclusions and Suggestions
6.1. Conclusions
The academic contribution and practical value of this study is threefold. First, compared to the previous studies focusing on the external impact mechanisms, this study establishes an evolutionary research framework of China’s green development from the internal view. Internal systems of green development are the study subject, which provides a new research angle for green development. Secondly, this study applies the Haken model to observe the impact of high-quality development guidance and the environment- and resource-forcing mechanisms in China. The different outcomes were analyzed to identify a feasible path of green development. It also programs operational methods and possible routes for China’s green development, as well as theoretical and practical results. Thirdly, the study introduces a critical point algorithm of a potential function, quantitatively draws judgmental bases of green development in broader China, and analyzes the stages, merits, and weaknesses of different areas to avoid a zero conclusion of quantitative analysis.
A high-quality developmental mechanism, environmental-forcing mechanism, and resource-forcing mechanism were tested, respectively. We conclude that:
(1) High-quality development is the order parameter of China’s green development. It is the key factor of green development in China, and it determines the evolution direction and the change in speed of green development. Improving the quality of development has a synergistic effect on environmental forcing. This will promote a reduction in pollution. Contrary to what may be expected, the environmental-forcing mechanisms have not promoted an increase in the development quality. The environmental-forcing mechanism has no obvious effect on green development. This study has also noted that economic development quality has no synergistic effect with the resource-forcing mechanism. While high-quality development promotes green development, the effect needs to be increased since no synergistic interaction effects exist between them.
(2) The synergy static point of China’s green developmental system is 0.5686. The east exceeded the static point and has entered a highly-synergistic development stage. The economic developmental quality of the east had a synergistic impact on environmental pollution, which decreased the overall pollution emissions. While the northeast, central, and west regions will remain at relatively low synergy levels. At the provincial level, seven provinces and cities were determined to have a higher green developmental synergy impact: Shanghai, Beijing, Tianjin, Jiangsu, Zhejiang, Guangdong, and Shandong.
(3) High-quality development should be viewed as the preferred green development policy. According to the results of this study, guiding high-quality development is more important to China’s green development compared with resource- and environment-forcing. Continuously improving the quality of economic development can effectively promote improvements in the green developmental level. Thus, China’s green development policies should consider how to improve TFP and the quality of economic development.
6.2. Suggestions
Establish a correct outlook on development. China’s economy is entering a new stage with an increasing amount of uncertainty and more serious difficulties and challenges. It is important to foster a correct view of both economic development and environmental protection. This will behave as a guide for meeting future challenges, maintaining sound economic development, and avoiding falling into the middle-income trap. Many scholars have suggested that it is worthwhile to protect the environment at the expense of economic development, but sacrificing economic development to improve resources and environmental conditions is not preferred. China has encountered many problems over the past 40 years, but these problems should also be solved in the process of continuous development. Using resource protection and environmental improvement as motivations will result in reduced developmental needs, or even stop them, preventing it from solving problems from their root. This study has shown that the resource- and environmental-forcing mechanisms did not promote green development, while the high-quality development guidance is the main route. Therefore, the view of sacrificing economic development to protect the environment and resources is not the best choice. The key to green development is to improve development quality and economic interests by transferring resources more efficiently among practices and developments. TFP is an important index to measure the quality of economic growth. By maintaining sound economic growth and improving the quality of development, the TFP of economic growth will be improved, and this is the path of China’s green development.
Make different energy-saving emission policies. “The 13th Five-Year Plan on energy saving work” listed the double-control consumption goal of total and intensity into each province (district and city). Energy-saving is considered to be a key point for upgrading China’s economic structure, promoting green development, and establishing an eco-culture. Combined with the actual situation of each region, formulating different energy-saving policies helps improve the effects of policy implementation and avoids shortcomings of “one size fits all” policies. Based on the research, the east, especially the provinces of Shanghai, Beijing, Tianjin, Jiangsu, Zhejiang, Guangdong, and Shandong, have entered a high-synergy level stage of green development, which is the key to extending the scope. In contrast, the northeast, central, and west have not yet reached a balanced point yet, and are still in the improvement stage, where the key is to change the developmental mode. Therefore, the goal of the east’s energy-saving should be the reduction in the intensity of emissions, accompanied by a reduction in the total emissions, which will lead the east to lower its unit pollution emissions. The central, west, and northeast should save energy with the goal of reducing the total emission, accompanied by a reduction in the emission intensity. This will push these areas to upgrade their industrial structures, to hasten upgrades, and change their developmental modes.
6.3. Limitations and the Future Research
This study has investigated the impact of guiding high-quality development and resource- and environment-forcing on China’s green development. Correlative conclusions were drawn. It is meaningful to adopt green development policies. Since all the research samples are from China, the reference and contribution for the global community are limited. There is no understanding of the relative criteria for green development in China. In future research, samples should be expanded to the OECD, which includes 36 countries, and comparable analytical information for other developed countries will be shown.


