Abstract
Haze pollution, a serious livelihood and environmental issue, has hindered China’s economic development. This paper, based on the improved output density model, empirically analyzes spatial patterns and impact factors of haze pollution within the Yangtze River Delta from 2015 to 2017 by statistical and spatial econometric models. The study shows that: (1) The characteristics of haze pollution due to seasonal changes are obvious in the Yangtze River Delta region, and the situation has gradually improved. (2) The haze pollution has significant local agglomeration characteristics and spatial heterogeneity, demonstrated as significant low-level agglomerations in Hangzhou, Ningbo, and Taizhou, and high agglomerations in Chuzhou, Yangzhou, Zhenjiang, and Taizhou. The polluted area clusters around the provincial boundary, and its level gradually decreases from northwest to southeast. There is a significant spatial positive correlation and spatial spillover effect of intercity haze pollution, which will have a negative impact on the region and surrounding areas. (3) The population growth, research and development (R&D) investment, industrial structure, industrial smoke and dust emissions, and urban construction in the Yangtze River Delta have positive impacts on haze pollution, while factors, such as investment intensity of foreign direct investment (FDI), energy consumption and precipitation, have a negative impact on smog pollution. However, there is no Kuznets curve relationship between smog pollution and economic growth. By optimizing spatial distribution, incorporating production factors, and sharing pollution control infrastructure, this paper shows that economic agglomeration has an inhibitory effect on haze pollution.
1. Introduction
With dramatic urbanization and industrialization over the past four decades, haze pollution has also increased in China. Continuous and regional haze pollution has frequently enveloped areas of China since 2000, especially in urban agglomerations, such as the Yangtze River Delta, the Pearl River Delta, and the Beijing–Tianjin–Hebei regions [1,2,3], which has aroused widespread concern. According to the 2017 meteorological bulletin of the atmospheric environment issued by the China Meteorological Administration, the average concentration of the fine particulate matter (PM2.5) and inhalable particulate matter (PM10) in the whole year is 43 and 75 displacement ug/m3, respectively, and the average number of haze days is 27.5 days per year, which is far from the qualified standard. On the one hand, haze can not only reduce horizontal visibility [4] and cause climate change by changing the radiation balance [5] but it may also enhance urban heat islands [6]. Moreover, the increase of haze concentration has adverse effects on human health [7]. Domestic and foreign studies have shown that the degree of atmospheric pollution in a given region is closely related to the incidence and mortality of lung cancer [8,9]. An estimated 2.5 million people in China die each year from the health effects of indoor and outdoor air pollution [10]. As the most developed economic and social regions of China, it is imperative to the prevention and control of haze pollution, and to the promotion and coordinated development of the economy and environment in the Yangtze River Delta (YRD) to study the spatial and temporal distribution characteristics and influencing factors of haze pollution.
Current research has put an emphasis on exploring the formation mechanisms of haze by studying the pollution sources from their physical and chemical perspectives. For example, Huang et al. [11] investigated the chemical nature and sources of particulate matter using offline analytical approaches and statistical techniques. The researchers discovered that the severe haze pollution event was driven to a large extent by secondary aerosol formation, which contributed 30 to 77 percent and 44 to 71 percent (average for all four cities) of PM2.5 and of organic aerosol, respectively. Li et al. [12] measured trace gases and aerosols at an urban site in Jinan during a regional brown haze and found that concentrations of gaseous precursors including NO, NO2, SO2, and CO on haze days were 2 to 6 times higher than those on clear days. Based on the data of black carbon (BC) mass concentration (CBC) and meteorological parameters from April 2007 to March 2010 in Shanghai, Wang et al. [13] analyzed the relationship between black carbon (BC) aerosols and haze with different intensities, proposing that there is a positive correlation between monthly averaged CBC and haze intensity.
To prevent haze pollution, we should examine its main impact factors to define the relevant core control elements and on this basis propose the policy management program [14]. Many researchers have explored the factors contributing to pollutions, including both natural and socio-economic factors. It has been proven that natural factors, such as precipitation, temperature, humidity, climate change, boundary layer, and wind speed, have a significant influence over the concentration and diffusion of atmospheric pollutants [15,16]. For example, from the perspective of observation data and the climate model theory on global climate change, research demonstrates that the change of circulation caused by global greenhouse gas emissions may increase the frequency of severe haze in Beijing [17]. Loss of Arctic sea ice and extensive boreal snowfall enhanced the regional circulation mode of poor ventilation in the East China Plains (ECP) region and provided conducive conditions for extreme haze, such as that of 2013 [18]. Monitoring data shows that the main risk factors driving the formation and evolution of haze pollution in Beijing during wintertime are stagnant meteorological conditions [19].
In terms of social and economic factors, scholars point out that energy consumption, industrial structure, exhaust emission, and population agglomeration are the main sources of haze pollution. Factors, such as economic (industrial) agglomeration, level of urbanization, foreign direct investment (FDI) economic growth, technological progress, and environmental regulations, will also have varied impacts on urban air quality. Lin et al. [20] explored the factors impacting the PM2.5 concentrations in China from 2001 to 2010, indicating that the increasing populations, local economic growth, and urban expansion are the three main factors that result in PM2.5 concentrations in China. Based on air quality monitoring reports in several major cities, Afroz et al. [21] reviewed the air pollution and health impacts in Malaysia and found that air pollution comes mainly from land transportation, industrial emissions, and open burning sources. Among them, land transportation contributes the most to air pollution.
Some scholars discussed the temporal–spatial distribution and evolution features of haze pollution using a spatial econometric model [22,23]. The PM2.5 concentration showed great seasonal variation, which is high in autumn and winter but low in spring and summer. And there was a distinct characteristic of spatial agglomeration. The North China Plain was the predominant region of agglomeration, and the southeastern coastal area had stable, good air quality [24].
In summary, previous studies examined the formation mechanism, features, factors, and controlling strategies and their studies were highly successful at returning useful data on haze pollution. However, it is undeniable that there are still some limitations. First, the use of a single pollutant, such as PM2.5 or PM10 as an indicator, ignores the complexity of the cause of smog pollution, and may deviate from the true pollution level. Second, it tends to directly refer to relevant models, and seldom starts with theoretical model derivation. Third, it focuses on the description and statistical analysis of the formation mechanism of haze pollution, ignoring its spatial correlation and heterogeneity. Accordingly, compared with previous research, the contributions of this study are mainly embodied in three aspects. First, the air quality index (AQI) consisting of PM10, PM2.5, SO2, NO2, O3, and CO was adopted to characterize the current composite haze concentration. Second, we apply spatial econometric models to estimate the effect of economic agglomeration on haze pollution and to minimize deviations of estimation results caused by the other omitted variables, a set of control variables are taken into consideration. Third, the time–spatial convergence of haze pollution in the Yangtze River Delta region was analyzed using spatial interpolation.
2. Research Methods and Data Source
2.1. Theoretical Model
According to the literature review, relevant studies directly took environment as a production factor into their production model; that is, environmental input will bring pollution. This paper, based on the production density model of Ciccone [25], incorporated environment as one of the production factors into the model, and production factors and haze concentration into the output link of the model. Ciccone considered that the externality of economic agglomeration originates from the density of economic activities, and, therefore, the basic model is as follows:
where refers to the output per unit area of city I; refers to the total factor productivity of city; refers to the number of urban employees per unit area; refers to the average human capital level, and refers to the material capital input per unit area. α refers to the scale return of unit area capital and labor, and when 0 < α ≤ 1, it indicates a diminishing marginal productivity. β refers to the rate of factor contribution, 0 < β ≤ 1. and are the total output and total area of city, and refers to the spatial output density. λ refers to the output density coefficient, and when λ > 1, it means that the agglomeration has positive externality.
2.1.1. Theoretical Analysis of the Environmental Effect on Economic Agglomeration
The core characteristic of economic agglomeration is industrial agglomeration. From the perspective of industry, the impact on the spatial process of economic activities is highly concentrated on the environment by those in the academic community. Grossman [26] believed that when the industrial agglomeration reaches a certain level, it will have an impact on the environment through scale, structure, and technological effects. The scale effect means agglomeration will enlarge the scale of production, which will aggravate the consumption of resources and pollution to the environment. The structure effect refers to the change of industrial structure in a region caused by agglomeration, thus, changing pollution emission and attracting a large number of pollution-intensive industries with high tax brackets and high added value at the cost of environmental quality. The technology effect refers to the industrial agglomeration which may bring the improvement of production technology and environmental protection technology, thereby, reducing resource consumption and pollution emission with the same output.
Krugman [27] proposed that centripetal and centrifugal force of industrial agglomeration result in industrial agglomeration and dispersion. Namely, when centripetal force is the dominant force, industrial agglomeration will be strengthened. On the contrary, if the crowding effect causes the increase in production cost to be greater than the reduction in production cost caused by centripetal force, which has formed industrial agglomeration diseconomies, the industry will tend to be dispersed. In the early stage of economic development, enterprises are driven by factors, such as market, labor, and transportation, and they tend to cluster in the central areas, realizing economic scale, and, thereby, reducing marginal costs, which then increases labor productivity mainly in terms of production scale expansion and increases in total output. In the meantime, pollution has also increased. When economic activities are over-concentrated, it always leads to agglomeration and uneconomic outcomes, such as a shortage of resources, environmental degradation, and increased production and operation costs. At this time, the centrifugal force of agglomeration is greater than the concentration force, which produces a diffusion effect and causes a large number of population departments and enterprises to move out of the central areas, thus, improving the environmental quality to some extent. Of course, economic agglomeration will promote the increase of regional income, which will lead to living standards improvement, environmental awareness enhancement, and the tendency to buy cleaner products with less environmental pollution. In addition, local governments may force enterprises to improve technology or optimize industrial structure through environmental regulations, so as to reduce the proportion of pollution-intensive industries and to realize energy conservation and emission reduction, which in turn reduces environmental pollution. It can be seen that there is a certain correlation between pollution degree and economic agglomeration level. The higher the economic agglomeration level in the initial stage of agglomeration, the more serious the pollution is; on the contrary, when agglomeration level exceeds the threshold, it will curb pollution.
2.1.2. Theoretical Model of Economic Agglomeration and Haze Pollution
The production density model is helpful to deduce the mechanism between haze pollution and economic agglomeration by its suitable development. Assumption as follows: is the total number of urban I employment, is the total capital input of urban I, is the haze concentration per unit area of city I, and is the total haze amount of city I. The formula is as follows:
where γ represents the contribution of capital investment to output per unit area, 0 < γ ≤ 1.
The derivation of Equation (2) is as follows:
Equation (3) shows haze is related to economic agglomeration, coefficient indicates the strength and direction of impact on economic agglomeration with haze intensity.
2.2. Model Construction and Variable Description
2.2.1. Model Construction
According to the theoretical model, a spatial econometric regression model of haze pollution can be constructed to verify the impact factors of haze pollution. In this paper, the AQI index is used to characterize the haze pollution degree, and a set of control variables are introduced to the empirical model:
where i represents the sample area; and represent haze pollution and economic agglomeration, respectively; represents the spatial relationship among region. In this paper, the most common binary-value spatial weight matrix is adopted, that is, if the two regions are adjacent, = 1; otherwise, = 0. represents a set of control variables affecting haze pollution. is a random disturbance term, and is the estimated coefficient of spatial spillover of haze pollution between adjacent regions, representing the strength and direction of spatial spillover effect of haze pollution. is used to describe the endogenous relationship between haze pollution and economic agglomeration. If > 0, it means that local haze pollution tends to be worsen with local economic agglomeration growth, and vice versa, it shows that the increase of economic agglomeration has a reducing effect on haze pollution.
2.2.2. Variable Description and Data Source
In consideration of a scientific premise, data consistency and integrity, variables as shown in Table 1 were selected with reference to existing research results [20,21,22,23].

Table 1.
Description of variables.
The air quality data (AQI) collected in this paper were derived from the data center of the Ministry of Environmental Protection and National Climate Center. Since October 2013, this website has collected air quality data of cities across the country and recorded them day by day according to the daily observation data of different monitoring stations. The calculation of AQI comprehensively considers a variety of common pollutants, such as PM2.5, PM10, SO2, NO2, and CO, which can better characterize China’s ambient air quality and reflect the current complex air pollution situation. Therefore, AQI can be considered as the most authoritative data metric for measuring the air quality of a region, and is used to measure the degree of haze pollution [28,29]. Other variable data mainly comes from 2016 Statistical Yearbook of each sample city, “Statistical Communiqué of National Economic and Social Development in 2015”, and “China Urban Statistical Yearbook 2016”.
2.3. Research Methods
This paper, using ordinary Kriging interpolation methods in geo-statistics, describes the temporal and spatial distribution characteristics of haze pollution. Furthermore, the spatial correlation of haze pollution in the Yangtze River Delta region was verified by the global and local spatial autocorrelation analysis in ESDA (Exploratory Spatial Data Analysis), and then a spatial econometric regression model was constructed to analyze the impact factors of haze pollution.
2.3.1. Global Autocorrelation Analysis
Global spatial autocorrelation is used to describe the agglomeration of regional spatial distribution for regional innovation activities from the perspective of overall space, and to depict spatial dependence degree of relevant variables in the whole region. The formula is as follows:
I is the global Moran’ I; n is the number of samples; and represent the observations of region i and region j, respectively; is a spatial weight matrix; is the average of the observed variables, and is the variance of the observed variable. The value I range is [-1,1]. When I is greater than 0, there is a spatial positive correlation between observations in each region; otherwise, when I is less than 0, spatial correlation is negative. However, when I is 0, it means spatial correlation is insignificant.
2.3.2. Local Autocorrelation Analysis
The local spatial autocorrelation reflects the relationship between a regional unit and the same research phenomenon in the adjacent unit. The formula is as follows:
The positive local Moran’s I indicates that a high value is surrounded by a high value (high–high), or a low value is surrounded by a low value (low–low). The negative local Moran’s I indicates that a high value is surrounded by a low value (high–low), or a low value is surrounded by a high value (low–high).
2.3.3. Kriging Interpolation
Kriging interpolation, known as the spatial local interpolation method, can be used to conduct linear unbiased optimal estimation of the interpolation point’s elevation according to the spatial position of the interpolated points and the adjacent measured elevation points, so as to generate a Kriging interpolation graph about the elevation to express the original geographical element morphology in the research region. Relevant studies show that Kriging interpolation can better predict regional pollutants distribution trend, and is closer to the observed value [30].
2.3.4. Spatial Econometric Model
If exploratory spatial data analysis finds spatial dependence, it needs to be reflected in the model. Traditional spatial measurement models mainly include spatial lag model (SLM) and spatial error model (SEM). SLM focuses on the spatial spillover effect of the dependent variable, and moreover, the model contains the spatial lag term of the dependent variable. SEM focuses on the spatial dependence caused by missing variables, that is, the error term contains factors that cause spatial correlation of the independent variables, and moreover, the spatial error model contains the lag term of the error term. The formula is as follows:
where X and Y are independent variables and dependent variables, respectively; ρ is spatial regression coefficient; λ is spatial error coefficient; W is spatial weight matrix, and ε and μ are error terms.
3. Temporal and Spatial Distribution Characteristics of Haze Pollution
In this paper, according to the 26 core cities air quality index (AQI) data in the Yangtze River Delta from 2015 to 2017, the spatial distribution of AQI in the corresponding temporal scale was obtained by spatial interpolation of the 26 cities’ seasonal and annual AQI by the ordinary Kriging method.
3.1. Temporal and Spatial Distribution Characteristics of Annual Average Haze Pollution
As Figure 1, Figure 2 and Figure 3 demonstrate, AQI in the Yangtze River Delta decreased from 2015 to 2017, indicating an improvement in air quality. It also showed that there were significant spatial differences in haze pollution degree in various cities. In general, Shanghai and the surrounding cities’ AQI in the provincial boundary is relatively high, mainly including Nanjing, Suzhou, Zhenjiang, Changzhou, Wuxi in south Jiangsu, and Yangzhou, Taizhou, Nantong, et al. While the cities’ AQI in the southeastern coastal areas are relatively low, including Taizhou in east Zhejiang and Ningbo, and Zhoushan in south Zhejiang province. In the winter of 2016, in addition to the rebound of Shanghai’s AQI, the winter smog pollution in the cities of the Yangtze River Delta showed a downward trend, and the air quality improved. Meanwhile, the haze pollution in all cities of the Yangtze River Delta has declined, showing that the air quality has gradually improved (Figure 4, Figure 5 and Figure 6).
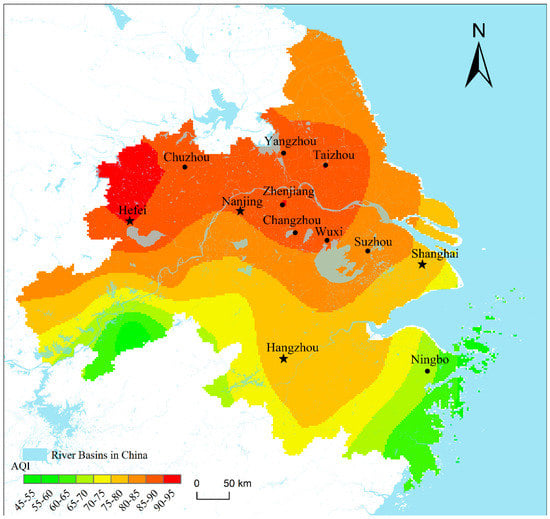
Figure 1.
Spatial distribution patterns of annual air quality index (AQI) of the Yangtze River Delta (YRD) in 2015.
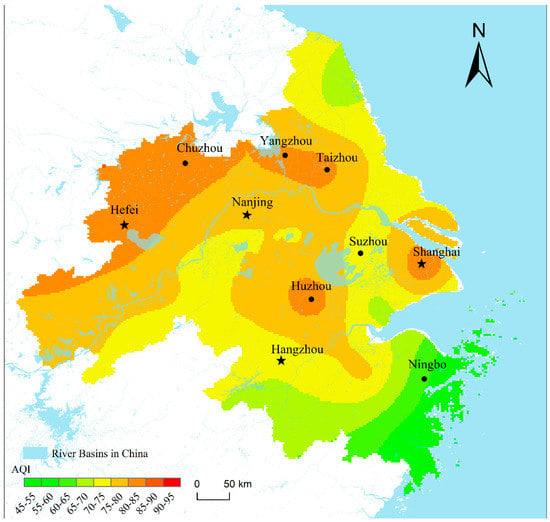
Figure 2.
Spatial distribution patterns of annual AQI of YRD in 2016.
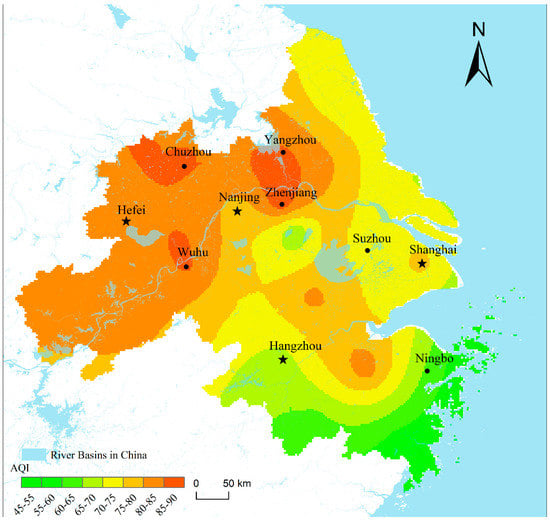
Figure 3.
Spatial distribution patterns of annual AQI of YRD in 2017.
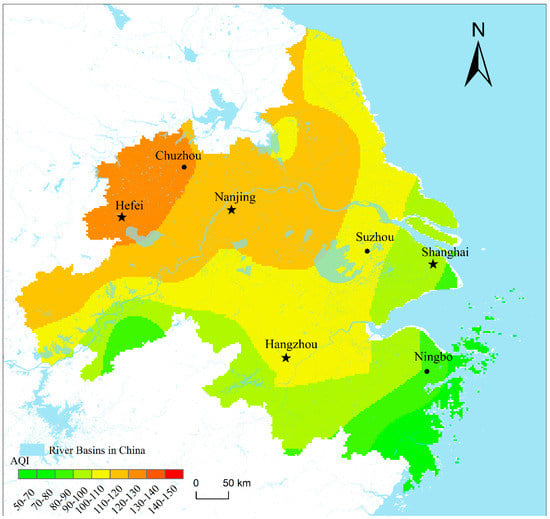
Figure 4.
Spatial distribution patterns of winter AQI of YRD in 2015.
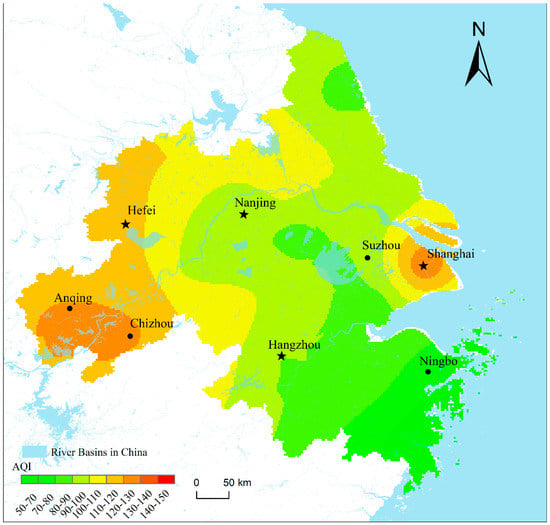
Figure 5.
Spatial distribution patterns of winter AQI of YRD in 2016.
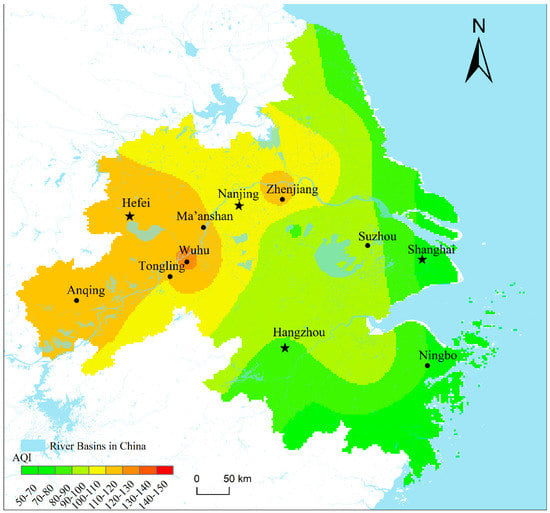
Figure 6.
Spatial distribution patterns of winter AQI of YRD in 2017.
3.2. Temporal and Spatial Distribution Characteristics of Seasonal Haze Pollution
The characteristics of seasonal changes in haze pollution in the Yangtze River Delta are obvious and follow winter>spring>autumn>summer characteristics. The air quality index (AQI) of spring, summer, and autumn is between 45 and 95, indicating that the overall air quality is good and rarely contains haze pollution (Figure 7). In summer, due to abundant precipitation and favorable meteorological conditions to pollutant diffusion, AQI in all cities is the lowest, and the difference is relatively small year over year, from summer to summer. The AQI in winter decreases significantly, and haze pollution spreads in a wide range and has a large spatial difference. The polluted areas are mainly clustered in the northwest of Yangtze River Delta. These include urban agglomerations, such as Anqing, Wuhu, Tongling, Chizhou, Maanshan, Hefei, Chuzhou, Nanjing, and Zhenjiang, among which Anqing and Wuhu are the most highly polluted. If people are in such an atmosphere for a long time, they would probably be adversely affected. Conversely, AQI in the southeast coastal cities of the Yangtze River Delta is relatively good, among which Zhoushan City has the best air quality.
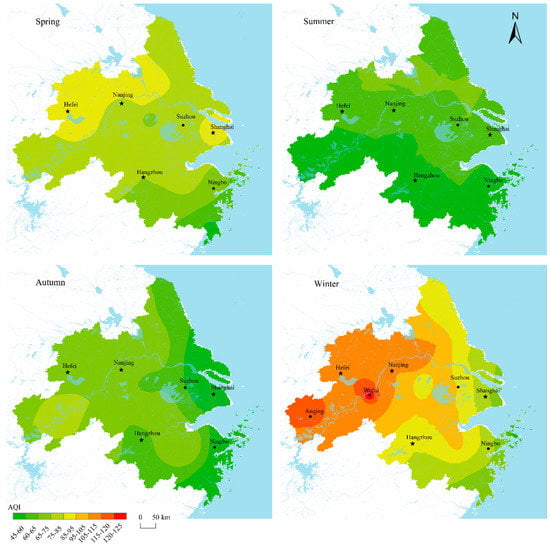
Figure 7.
Spatial distribution patterns of seasonal AQI of YRD in 2017.
3.3. Spatial Autocorrelation Analysis of Haze Pollution
To survey whether the spatial distribution of haze pollution has agglomeration characteristics or not, the global and local autocorrelation analysis are used according to the 2015 AQI data to obtain the 2015 AQI annual mean Moran’s I 0.329294, and passed the significance test, indicating that the spatial distribution of haze pollution was significantly and positively correlated in 2015. With the 2015 AQI Moran scatter plot (Figure 8) and local Geary cluster plot (Figure 9), it can be seen that there were obvious localized clustering characteristics in the Yangtze River Delta region, while Hangzhou, Ningbo, and Taizhou were characterized by low–low agglomeration, which showed low haze pollution in those areas and low haze pollution in neighboring cities. Chuzhou, Yangzhou, Zhenjiang, and Taizhou showed a trend of high–high concentration, and the haze pollution of these cities was high, as was the haze pollution of their neighboring areas. Therefore, the analysis toward the impact on economic agglomeration of haze pollution must consider such geospatial factors, to avoid results deviation.
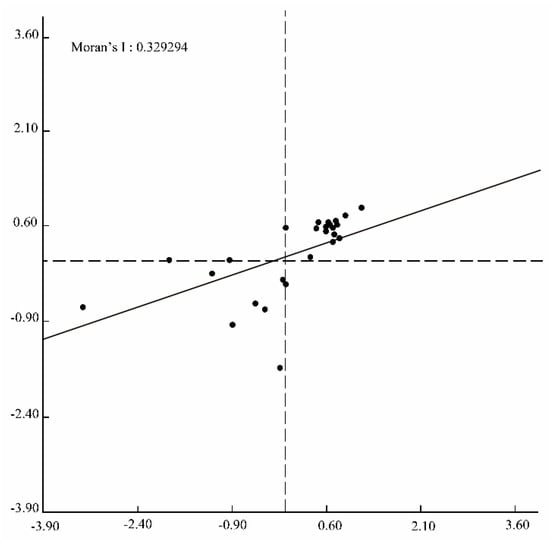
Figure 8.
Moran scatter plot map of AQI of YRD in 2015.
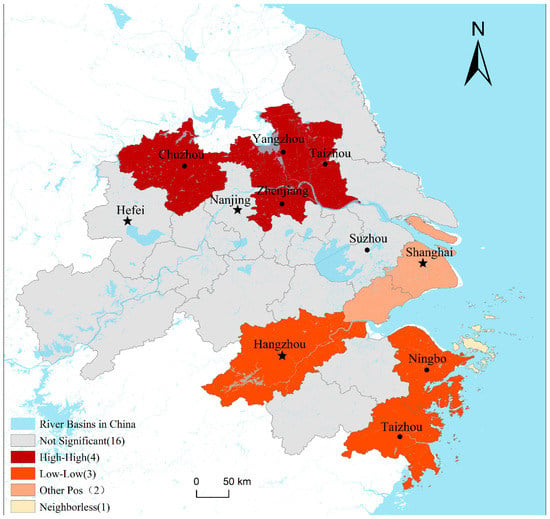
Figure 9.
Local Geary clustering map of AQI of YRD in 2015.
4. Identification of Factors’ Impact on Haze Pollution
4.1. Empirical Results of Spatial Regression
Since the ordinary least square method (OLS) cannot achieve “unbiased estimation” in the spatial autoregressive model, the spatial lag model and spatial error model are introduced to conduct in-depth analysis on the impact factors on haze pollution. To avoid multi-collinearity influence, SPSS Statistics 20.0 (IBM, Beijing, China) is used to analyze the correlation among each explanatory variable, and the results show that the variance expansion factor (VIF) is all within 10, suggesting that there is no obvious multi-collinearity problem. The GeoDa1.6.5 (Center for Spatial Data Science of the University of Chicago, https://spatial.uchicago.edu/software, Chicago, Illinois, USA) analysis results show that the model has passed significance test at the 10% level as a whole, and Table 2 shows the results of OLS, SLM, and SEM model estimation.

Table 2.
The estimated results.
After considering the spatial influence, the fitting index (log-likelihood estimate) of SLM and SEM model estimation is larger than the OLS estimation result, indicating that the modified model has a higher fitting degree with the actual data, which proves again that the haze pollution in each region is affected by spatial geographical distribution. By comparing the three indicators of log-likelihood (log-likelihood estimation), AIC (Akaike information criterion), and SC (Schwarz information criterion) (Table 3), it can be seen that the log-likelihood value of the spatial lag model is the maximum while the AIC value is the minimum as well as the SC value, it can be indicated that the spatial lag model is with the highest fitting degree and is the optimal model. Consequently, the following analyses are based primarily on spatial lag model estimation.

Table 3.
The index of fitting degree.
4.2. Analysis of Spatial Spillover Impact on Haze Pollution
The spatial lag term of haze pollution in SLM is positive. When the neighboring area’s AQI increases by 1%, the AQI of adjacent areas increases by 0.477%, indicating that there is a significant spatial spillover effect of haze pollution in the Yangtze River Delta; meanwhile, the haze pollution in the vicinity has a deteriorating effect on haze pollution in the region. The main reasons are as follows: First, the GDP performance appraisal mechanism encourages local governments to pursue economic growth blindly, adopting a series of preferential policies to compete for more projects, and introducing or undertaking a large number of industries, which leads to high pollution emission demands [31]. Second, there is a “demonstration effect” in the inter-regional development model. If a region gains rapid economic growth by vigorously developing industries, neighboring regions tend to relax their pollution standards, rather than trying to keep up to keeping pace or maintaining leading position [32]. Third, under the influence of scale economy, industries tend to be spatially agglomerated, and pollution emissions are more concentrated. In addition, there are also climatic and meteorological conditions that cause pollutants to migrate to the air of surrounding areas [33].
4.3. Analysis of the Conduction Effect between Economic Agglomeration and Haze Pollution
Three groups of estimation results showed that the magnitude and direction of the regression coefficients of the influencing factors did not change significantly. The regression coefficient of economic agglomeration (ag) is negative, indicating that the larger the non-agricultural output per unit area, the lower the AQI value. In other words, the spatial agglomeration of economic activities has an inhibitory effect on haze pollution, which also indicates that the economic development of the region is relatively sustainable. On the one hand, economic agglomeration can promote the spatial distribution and portfolio optimization of input factors, such as labor, capital, technology, and environment, etc., while these factors have a certain substitution effect on environment, and this substitution will slow down the environmental consumption and reduce pollution emission to some extent [34]. Moreover, economic agglomeration can share pollution control infrastructure, minimize the cost of pollution control, and facilitate centralized supervision by government departments, providing the possibility to centralize pollution control [35].
4.4. Identification of Factors Affecting Haze Pollution
According to the model estimation results, among the set of control variables that affect haze pollution, the regression coefficients which are positive and larger are followed by population density (pden), R&D investment (rd), industrial structure (secondary industry), other pollutants (dust), and urban construction (con), indicating that these are the main factors exacerbating haze pollution. The negative and significant regression coefficients are, in turn, the economic development level (pgdp), energy consumption (pene), and investment intensity of FDI, suggesting that such factors can restrain haze pollution and improve air quality. In addition, although the industrial structure (tertiary industry), green level (park, green), and meteorological factors (rain) are not statistically significant, the estimated results can help to understand the direction of their impact on haze pollution.
Population agglomeration expands energy demand and vehicle ownership through consumption and travel, resulting in more energy consumption and automobile exhaust emissions. Meanwhile, excessive population sizes cause land shortages in the downtown areas and lead to an increase of building density, which can easily lead to traffic jams and poor urban air circulation, thus, creating conditions for haze generation. In addition, the local consumer market within large populations is robust, and the labor force is abundant, so companies and enterprises will take this opportunity to expand production scale, invest to set up factories, and create more employment opportunities to attract more population, thus, causing more resource consumption and aggravating environmental pollution. The increase in R&D investment has a negative impact on air quality rather than improving it. There are two main reasons for this: First, although scientific research results have increased, there is a lack of technology that can be applied to the production process and achieve sustainable development. Second, most of the investment is focused on expanding production scale and increasing labor productivity, and rarely used directly in air pollution control, which indirectly leads to an increase in haze pollution emissions.
The secondary industry is dominated by manufacturing. The greater the proportion of manufacturing accounts for in the secondary industry, the greater the pollution emissions. China’s urbanization and industrialization are inseparable. With the acceleration of urbanization, more and more industries are concentrated in cities, resulting in serious pollution problems. At present, a large number of high-pollution and high-emission industries have been transferred to small cities or eliminated by cities altogether in an effort to control the emission of harmful pollutants. For example, Beijing has adjusted and exited numerous industrial polluting industries and enterprises from its city limits. Meanwhile, on the basis of industrial upgrading and product structure adjustment, it has cooperated and docked with neighboring Hebei, Tianjin, and other regions. The coefficient of other pollutants (dust) is positive, indicating that emissions of industrial smoke and dust have seriously exacerbated haze pollution. The coefficient of urban construction (con) is positive, showing that there is a positive correlation between haze pollution and the current rapid development of the construction industry and the real estate industry. This is mainly because a large amount of dust is generated during the construction process, which directly leads to increased haze pollution. Second, the prosperity of the construction industry and the real estate industry has driven the development of high-pollution and high-energy industries, such as chemicals, steel, and cement, and in doing so have indirectly caused an increase in pollutant emissions. The coefficient of the green level (park, green) is positive, although not significant. The estimated results can help to understand the direction of influence that the green level exerts on haze pollution. The results show that the per capita park green area and the green coverage rate of the built-up area have not had a favorable impact on the air quality. It can be seen that green space has not played a good role in air purification in the city, which is closely related to the problems of inadequate management and maintenance of urban green space, green coverage rate, and per capita green space.
The coefficient of economic development (pgdp) is negative while its square coefficient (pgdp2) is positive, which means that as the per capita income increases, the concentration of haze pollution decreases non-linearly, the concentration of haze pollution will experience a process of first falling and then rising. There is no inverted U-shaped relationship between the economic development level and haze pollution, indicating that there is no environmental Kuznets curve in the haze pollution and economic development level in the Yangtze River Delta. It may be because the economic development level is far from the turning point of environmental quality improvement [10], or the selected Yangtze River Delta region has a high level of social and economic development and urbanization rate, which is beyond the scope of environmental Kuznets curves. However, both situations indicate that the current level of haze pollution in the cities of the Yangtze River Delta has been continuously rising along with the level of economic development. Actually, the increase of per capita income has not improved the environmental quality but has worsened it, which may serve as a useful warning to developed regions.
The energy consumption coefficient (pene) is negative, indicating that the current energy consumption structure in the Yangtze River Delta region is relatively environmentally friendly, and the low share of electricity generation by fossil energy has a greater inhibitory effect on haze pollution than the promotion effect. This is mainly related to the prevention and control of atmospheric pollution in the Yangtze River Delta region, actively adjusting the power structure, replacing the burnt coal and fossil fuels with electric energy, continuously improving the proportion of electric energy in the terminal energy consumption, and reducing the proportion of coal in the energy structure. The negative coefficient of opening-up (open) indicates that foreign direct investment (FDI) will improve air quality to a certain extent. On the one hand, the increase in foreign investment and international trade may improve investment in environmental governance, thus, reducing local haze pollution [36]. Multinational companies, advanced in technology and management experience, are more inclined to implement the environmental regulatory standards of source countries, thereby, reducing resource consumption and pollution emissions, improving environmental quality through the "demonstration" and "spill" effects to improve the local environmental technology level, thereby, creating what is known as a "pollution halo" [37,38]. The coefficient of meteorological factors is negative, indicating that precipitation has a positive impact on haze pollution and precipitation can wash away airborne pollutants, thus, improving air quality, which is consistent with the research conclusion of Yoo (2014) et al. [39,40].
In this paper, two spatial econometric models are used to empirically study the relationship between economic agglomeration and haze pollution in 26 core cities of the Yangtze River Delta. Taking geographical space as the carrier, multi-dimensional factors affecting haze pollution are analyzed, and the results show the spatial lag model (SLM) is superior to the spatial error model (SEM). Haze pollution has a significant spatial spillover effect, that is, haze pollution in neighboring cities will affect the air quality in the region. At the same time, the results of SLM model estimation show that most variables pass the significance test and conform to reality. Economic agglomeration has a strong inhibitory effect on haze pollution in this region through the conduction effect, optimizing energy consumption structure and increasing the level of investment intensity of FDI to the outside will also reduce haze pollution, while the level of greening has little effect on improving air quality. The coefficient of population density in the control variable has the largest absolute value and is positive, indicating that population agglomeration is the primary cause of haze pollution. Additionally, the increase in R&D investment, industry-based industrial structure, industrial smoke dust emissions, and urban construction progress have all contributed to haze pollution.
5. Conclusions and Discussion
Utilizing Ciccone and Hall’s output density model, a theoretical model was developed to describe the relationship between economic agglomeration and haze pollution using 26 core cities’ relevant data in the Yangtze River Delta from 2015 to 2017. Thereafter, the paper analyzed the temporal and spatial distribution characteristics, and spatial correlation of haze pollution in accordance with spatial interpolation and exploratory data. Finally, the spatial analysis method was used to empirically analyze the theoretical model. The results show as follows: (1) Haze pollution does have seasonal variation characteristics, and the haze pollution situation in various regions has gradually improved in recent years. (2) Haze pollution has significant local agglomeration characteristics and spatial heterogeneity; Hangzhou, Ningbo, and Taizhou presented significant low-level agglomerations, and Chuzhou, Yangzhou, Zhenjiang, and Taizhou were high agglomerations. The polluted area is concentrated at the provincial boundary, and the pollution level gradually decreases from northwest to southeast. (3) There is a significant spatial positive correlation and spatial spillover effect of intercity haze pollution, and the haze pollution in surrounding areas will have a negative impact on the region. (4) The population growth, R&D investment, industrial structure, industrial smoke–dust emission, and urban construction in the Yangtze River Delta have positive impacts on haze pollution, while the factors, such as investment intensity of FDI, energy consumption, and precipitation, have a negative impact on haze pollution. Moreover, there is no Kuznets curve relationship between haze pollution and economic growth. By optimizing the spatial distribution and combination of production factors, sharing pollution control infrastructure, etc., economic agglomeration can effectively curb haze pollution.
(1) Haze pollution issues do not only require governance but what also matters more is controlling the sources of pollution. Therefore, we should change the end treatment to the source prevention and control according to the conduction effect of the factors affecting the haze pollution. The study results reveal that the population growth, R&D investment, industrial structure, industrial smoke–dust emissions, and urban construction are the main causes of haze pollution, while the factors, such as investment intensity of FDI, lower energy consumption, and precipitation, have a negative impact. The recommendations are proposed as follows: The first is to adopt the policy of population control, population size control in large cities and to cultivate small and medium towns during the process of urban planning and to lift the urban environment carrying capacity by improvement infrastructure construction. The second is to rationally allocate R&D investment, strengthen research on pollution control technology, and independently develop and popularize the green production technology so as to improve the clean production level and reduce pollution emissions. The third is to promote the adjustment and upgrading of industrial structures, guiding the transformation of extensive and inefficient high-pollution industries to knowledge-intensive and capital-intensive industries, while vigorously developing strategic emerging industries, such as energy conservation and environmental protection industries. The fourth is to promote green and energy-saving buildings construction, and implement the industrialization of residential buildings, so as to minimize the dust generated by construction sites. The fifth is to reduce the proportion of coal in the energy structure and promote clean energy use, so as to reduce pollution emissions from sources.
(2) There is a significant spatial spillover effect on haze pollution, which indicates that the “independence” treatment method in each region cannot effectively solve the haze pollution between regions. As a result, a joint prevention and control policy should be promulgated according to the spatial correlation of haze pollution. The main source of haze pollution lies in economic activities. Therefore, regional joint prevention and control should start with coordinated economic development, supplemented by necessary policy management tools. What should be done first is to coordinate the industrial structure among different regions, break down industrial barriers and give full play to the effect of the regional division of labor and cooperation according to the development level and resource endowment of different cities. Second, it is necessary to strengthen the implementation of air quality planning and existing solutions, such as the emission trading market, which can effectively allocate the emission rights of pollution through the market and realize the internalization of pollution to achieve the goal of limiting pollution emissions. In addition, as the transfer of inter-regional polluting industries can affect the spatial pattern of haze pollution and economic activities, the transboundary movement of haze pollution will adversely affect adjacent areas, thus, it is necessary to construct a corresponding ecological compensation mechanism where the ecological compensation should be provided by the polluting areas, and the two jointly bear the cost of pollution control in the production process by accounting for the economic value of the ecological environment.
Author Contributions
R.M. and C.W. designed and simulated scenarios, analyzed the data and wrote this manuscript draft; C.W. and X.Z. contributed in the Econometric module runs; R.M. and Y.J. supervised the whole process of data analysis and figure design.
Funding
This research was funded by the National Natural Science Foundation of China (grant number 41771174).
Acknowledgments
We thank the editor and referees for their insightful and constructive comments, and this research was supported in part by the K.C. Wong Magna Fund of Ningbo University.
Conflicts of Interest
The authors declare no conflict of interest.
References
- Hu, J.L.; Wang, Y.G.; Ying, Q.; Zhang, H.L. Spatial and temporal variability of PM2.5 and PM10 over the North China Plain and the Yangtze River Delta, China. Atmos. Environ. 2014, 95, 598–609. [Google Scholar] [CrossRef]
- Wu, D.; Bi, X.Y.; Deng, X.J.; Li, F.; Tan, H.B.; Liao, G.L.; Huang, J. Effect of atmospheric haze on the deterioration of visibility over the Pearl River Delta. Acta Meteorol. Sin. 2007, 21, 215–223. [Google Scholar]
- Gao, M.; Guttikunda, S.K.; Carmichael, G.R.; Wang, Y.S.; Liu, Z.R.; Stanier, C.O.; Saide, P.E.; Yu, M. Health impacts and economic losses assessment of the 2013 severe haze event in Beijing area. Sci. Total Environ. 2015, 511, 553–561. [Google Scholar] [CrossRef] [PubMed]
- Zhang, Q.Y.; Yan, R.C.; Fan, J.W.; Yu, S.C.; Yang, W.D.; Li, P.F.; Wang, S.; Chen, B.X.; Liu, W.P.; Zhang, X.Y. A heavy haze episode in shanghai in December of 2013: Characteristics, origins and implications. Aerosol. Air Qual. Res. 2015, 15, 1881–1893. [Google Scholar] [CrossRef]
- Akimoto, H. Global air quality and pollution. Science 2003, 302, 1716–1719. [Google Scholar] [CrossRef]
- Cao, C.; Lee, X.H.; Liu, S.D.; Schultz, N.; Xiao, W.; Zhang, M.; Zhao, L. Urban heat islands in China enhanced by haze pollution. Nat. Commun. 2016, 7, 12509. [Google Scholar] [CrossRef]
- Zhang, Z.L.; Wang, J.; Chen, L.H.; Chen, X.Y.; Sun, G.Y.; Zhong, N.S.; Kan, H.D.; Lu, W.J. Impact of haze and air pollution-related hazards on hospital admissions in Guangzhou, China. Environ. Sci. Pollut. Res. 2014, 21, 4236–4244. [Google Scholar] [CrossRef] [PubMed]
- Chen, Y.Y.; Ebenstein, A.; Greenstone, M.; Li, H.B. Evidence on the impact of sustained exposure to air pollution on life expectancy from China’s Huai River policy. Proc. Natl. Acad. Sci. USA 2013, 110, 12936–12941. [Google Scholar] [CrossRef]
- Lamichhane, D.K.; Kim, H.C.; Choi, C.M.; Shin, M.H.; Shim, Y.M.; Leem, J.H.; Ryu, J.S.; Nam, H.S.; Park, S.M. Lung cancer risk and residential exposure to air pollution: A Korean population-based case-control study. Yonsei Med. J. 2017, 58, 1111–1118. [Google Scholar] [CrossRef]
- Markku, K. China’s choking cocktail. Nature 2015, 526, 497–499. [Google Scholar]
- Huang, R.J.; Zhang, Y.L.; Bozzetti, C.; Ho, K.F.; Cao, J.J.; Han, Y.; Daellenbach, K.R.; Slowik, J.G.; Platt, S.M.; Canonaco, F.; et al. High secondary aerosol contribution to particulate pollution during haze events in China. Nature 2014, 514, 218–222. [Google Scholar] [CrossRef] [PubMed]
- Li, W.J.; Zhou, S.Z.; Wang, X.F.; Xu, Z.; Yuan, C.; Yu, Y.C.; Zhang, Q.Z.; Wang, W.X. Integrated evaluation of aerosols from regional brown hazes over northern China in winter: Concentrations, sources, transformation, and mixing states. J. Geophys. Res. 2011, 116, D09301. [Google Scholar] [CrossRef]
- Wang, H.Q.; He, Q.S.; Chen, Y.; Kang, Y.M. Characterization of black carbon concentrations of haze with different intensities in Shanghai by a three-year field measurement. Atmos. Environ. 2014, 99, 536–545. [Google Scholar] [CrossRef]
- Pu, Z.N. Time-Spatial Convergence of Air Pollution and Regional Economic Growth in China. Sustainability 2017, 9, 1284. [Google Scholar] [CrossRef]
- Zhao, P.S.; Dong, F.; He, D.; Zhao, X.J.; Zhang, X.L.; Zhang, W.Z.; Yao, Q.; Liu, H.Y. Characteristics of concentrations and chemical compositions for PM2.5 in the region of Beijing, Tianjin, and Hebei, China. Atmos. Chem. Phys. 2013, 13, 4631–4644. [Google Scholar] [CrossRef]
- Zhao, X.J.; Zhao, P.S.; Xu, J.; Meng, W.; Pu, W.W.; Dong, F.; He, D.; Shi, Q.F. Analysis of a winter regional haze event and its formation mechanism in the North China Plain. Atmos. Chem. Phys. 2013, 13, 5685–5696. [Google Scholar] [CrossRef]
- Cai, W.J.; Li, K.; Liao, H.; Wang, H.J.; Wu, L.X. Weather conditions conducive to Beijing severe haze more frequent under climate change. Nat. Clim. Chang. 2017, 7, 257–262. [Google Scholar] [CrossRef]
- Zou, Y.F.; Wang, Y.H.; Zhang, Y.Z.; Koo, J.H. Arctic sea ice, Eurasia snow, and extreme winter haze in China. Sci. Adv. 2017, 3, e1602751. [Google Scholar] [CrossRef] [PubMed]
- Sun, Y.L.; Jiang, Q.; Wang, Z.F.; Fu, P.Q.; Li, J.; Yang, T.; Yin, Y. Investigation of the sources and evolution processes of severe haze pollution in Beijing in January 2013. J. Geophys. Res. Atmos. 2014, 119, 4380–4398. [Google Scholar] [CrossRef]
- Lin, G.; Fu, J.Y.; Jiang, D.; Hu, W.S.; Dong, D.L.; Huang, Y.H.; Zhao, M.D. Spatio-Temporal Variation of PM2.5 Concentrations and Their Relationship with Geographic and Socioeconomic Factors in China. Int. J. Environ. Res. Public Health 2014, 11, 173–186. [Google Scholar] [CrossRef] [PubMed]
- Afroz, R.; Hassan, M.N.; Ibrahim, N.A. Review of air pollution and health impacts in Malaysia. Environ. Res. 2003, 92, 71–77. [Google Scholar] [CrossRef]
- Hao, Y.; Peng, H.; Temulun, T.; Liu, L.Q.; Mao, J.; Lu, Z.N.; Chen, H. How harmful is air pollution to economic development? New evidence from PM2.5 concentrations of Chinese cities. J. Clean. Prod. 2018, 172, 743–757. [Google Scholar] [CrossRef]
- Du, L.M.; Wei, C.; Cai, S.H. Economic development and carbon dioxide emissions in China: Provincial panel data analysis. China Econ. Rev. 2012, 23, 371–384. [Google Scholar] [CrossRef]
- Fang, C.L.; Wang, Z.B.; Xu, G. Spatial-temporal characteristics of PM2.5 in China: A city-level perspective analysis. J. Geogr. Sci. 2016, 26, 1519–1532. [Google Scholar] [CrossRef]
- Ciccone, A.; Hall, R. Productivity and the density of economic activity. Am. Econ. Rev. 1996, 86, 54–70. [Google Scholar]
- Grossman, G.M.; Krueger, A.B. Economic growth and the environment. Q. J. Econ. 1995, 110, 353–378. [Google Scholar] [CrossRef]
- Krugman, P. Increasing returns and economic geography. J. Political Econ. 1991, 99, 483–499. [Google Scholar] [CrossRef]
- Zhan, D.S.; Kwan, M.P.; Zhang, W.Z.; Yu, X.F.; Meng, B.; Liu, Q.Q. The driving factors of air quality index in China. J. Clean. Prod. 2018, 197, 1342–1351. [Google Scholar] [CrossRef]
- Pu, H.X.; Luo, K.L.; Wang, P.; Wang, S.B.; Kang, S. Spatial variation of air quality index and urban driving factors linkages: Evidence from Chinese cities. Environ. Sci. Pollut. Res. 2017, 24, 4457–4468. [Google Scholar] [CrossRef]
- Zhao, C.X.; Wang, Y.Q.; Wang, Y.Y.J.; Zhang, H.L.; Zhao, B.Q. Temporal and Spatial Distribution of PM2.5 and PM10 Pollution Status and the Correlation of Particulate Matters and Meteorological Factors During Winter and Spring in Beijing. Environ. Sci. 2014, 35, 418–427. [Google Scholar]
- Hu, Z.Q.; Miao, Z.Q.; Miao, C.H. Spatial Characteristics and Econometric Test of Industrial Spatial Characteristics and Econometric Test of Industrial Agglomeration and Pollutant Emissions in China. Sci. Geogr. Sin. 2018, 38, 168–176. [Google Scholar]
- Verhoef, E.T.; Nijkamp, P. Externalities in urban sustainability environmental versus localization-type agglomeration externalities in a general spatial equilibrium model of a single-sector monocentric industrial city. Ecol. Econ. 2002, 40, 157–179. [Google Scholar] [CrossRef]
- Li, F.; Sun, X.D.; Zhang, L.L. Industrial agglomeration, technological innovation and environmental pollution. Technol. Econ. 2017, 36, 1–7. [Google Scholar]
- Wang, X.S.; Yu, C.Y. Impact of spatial agglomeration on industrial pollution emissions intensity in China. China Environ. Sci. 2017, 37, 1562–1570. [Google Scholar]
- Cheng, Z.H. The spatial correlation and interaction between manufacturing agglomeration and environmental pollution. Ecol. Indic. 2016, 61, 1024–1032. [Google Scholar] [CrossRef]
- Liu, Q.Q.; Wang, S.J.; Zhang, W.Z.; Zhan, D.S.; Li, J.M. Does foreign direct investment affect environmental pollution in China’s cities? A spatial econometric perspective. Sci. Total Environ. 2018, 613–614, 521–529. [Google Scholar] [CrossRef] [PubMed]
- Muhammad, S.; Daniel, B.L.; Avik, S. Foreign direct Investment–CO2 emissions nexus in Middle East and North African countries: Importance of biomass energy consumption. J. Clean. Prod. 2019, 217, 603–614. [Google Scholar]
- He, J. Pollution haven hypothesis and environmental impacts of foreign direct investment: The case of industrial emission of sulfur dioxide (SO2) in Chinese provinces. Ecol. Econ. 2006, 60, 228–245. [Google Scholar] [CrossRef]
- Yoo, J.; Lee, Y.; Kim, D.; Jeong, M.; Stockwell, W.R.; Kundu, P.K.; Oh, S.; Shin, D.; Lee, S. New Indices for Wet Scavenging of Air Pollutants (O3, CO, NO2, SO2 and PM10) by Summertime Rain. Atmos. Environ. 2014, 82, 226–237. [Google Scholar] [CrossRef]
- Ma, R.F.; Wang, T.F.; Zhang, W.Z.; Yu, J.H.; Wang, D.; Chen, L.; Jiang, Y.P.; Feng, G.Q. Overview and progress of Chinese geographical human settlement research. J. Geogr. Sci. 2016, 26, 1159–1175. [Google Scholar] [CrossRef]
© 2019 by the authors. Licensee MDPI, Basel, Switzerland. This article is an open access article distributed under the terms and conditions of the Creative Commons Attribution (CC BY) license (http://creativecommons.org/licenses/by/4.0/).