1. Introduction
Many watershed challenges can be associated with the increased impervious cover that accompanies urban development. As impervious cover increases, rainwater infiltration decreases, and pollutant accumulation and transport increase. Much of the existing research on this topic focuses on the increased imperviousness produced from the transformation of undeveloped to developed regions. A topic that is not as widely understood is the incremental redevelopment within urbanized areas and its impacts on watershed imperviousness.
Urban land use can vary in both its type and intensity of use. A parcel’s designated land use type can be classified by many terms including, but not limited to, single family residential, industrial, commercial, and open space. The intensity of land use can be described by classifications such as vacant, undevelopable, or developed. In urbanized areas, where there is limited vacant land available for new development, infill and redevelopment strategies are often employed to increase the utility of the land. The land can either be completely redeveloped or the utilization of a parcel can increase due to additions to the already developed structure. Infill redevelopment is the process of renovating or restoring a previously developed parcel through demolition and construction activities, resulting in higher density land use after construction activity.
This is rapidly occurring in many urban areas, where low density single-family properties are being redeveloped with larger and higher density multi-family units. Many urban planners advocate for infill redevelopment because of its many benefits. It increases walkability and access to public transportation, while decreasing urban sprawl and the dependency on the automobile. However, there are also many challenges that result from this unique type of rapid redevelopment.
The challenges and strategies to mitigate the negative impacts of redevelopment are being investigated by individuals across many disciplines in the private and public sector. Developers may be interested in understanding parcels that are likely candidates of infill redevelopment for lucrative reasons. Planners may be concerned with evaluating its impact on transportation, mobility, and quality of life. While hydrologists and engineers may be interested in understanding how it impacts the civil infrastructure. As land use is the foundation of the urban environment, the way that it is modified is of interest to many different stakeholders and, as a result, is currently being investigated nationwide by major municipalities and research centers.
1.1. Study Site: Berkeley Neighborhood in West Denver, Colorado
Many Denver neighborhoods are experiencing infill redevelopment. In Denver, these redevelopment projects are only required to incorporate stormwater detention and treatment systems if they are greater than one acre. Since most of the redevelopment in Denver (86%) is occurring on sites less than one acre, the burden of stormwater treatment and detention ultimately falls on the city.
In 2014 the City and County of Denver became interested in the development of a tool that could help them identify the hydrologic and hydraulic impacts of the rapid infill redevelopment that was occurring around the city. The Berkeley neighborhood was selected as the test basin for this evaluation because of the rapid infill redevelopment underway, both commercial and residential, and because of the potential for creating a centralized stormwater treatment facility on city parks and recreation land.
The Berkeley neighborhood is in the far northwestern section of the City of Denver’s boundary. Currently, the stormwater that runs off the Berkeley neighborhood is largely captured in storm drains and delivered untreated to Clear Creek, a tributary of the South Platte River (the primary drinking water source for Denver). The total area of the urban drainage basin is 1114 acres (1.74 sq. mi.). The impervious cover in 2014 was about 46%. The neighborhood contains 4710 parcels.
Much of the Berkeley neighborhood is classified as low-density residential, where single-family homes (41.2%) reside on 6000 square foot lots. However, zoning allows a range of uses, from single unit to mixed use, with the highest density development occurring closest to Tennyson Street, a trendy area with many new shops, restaurants, businesses, and multi-use buildings.
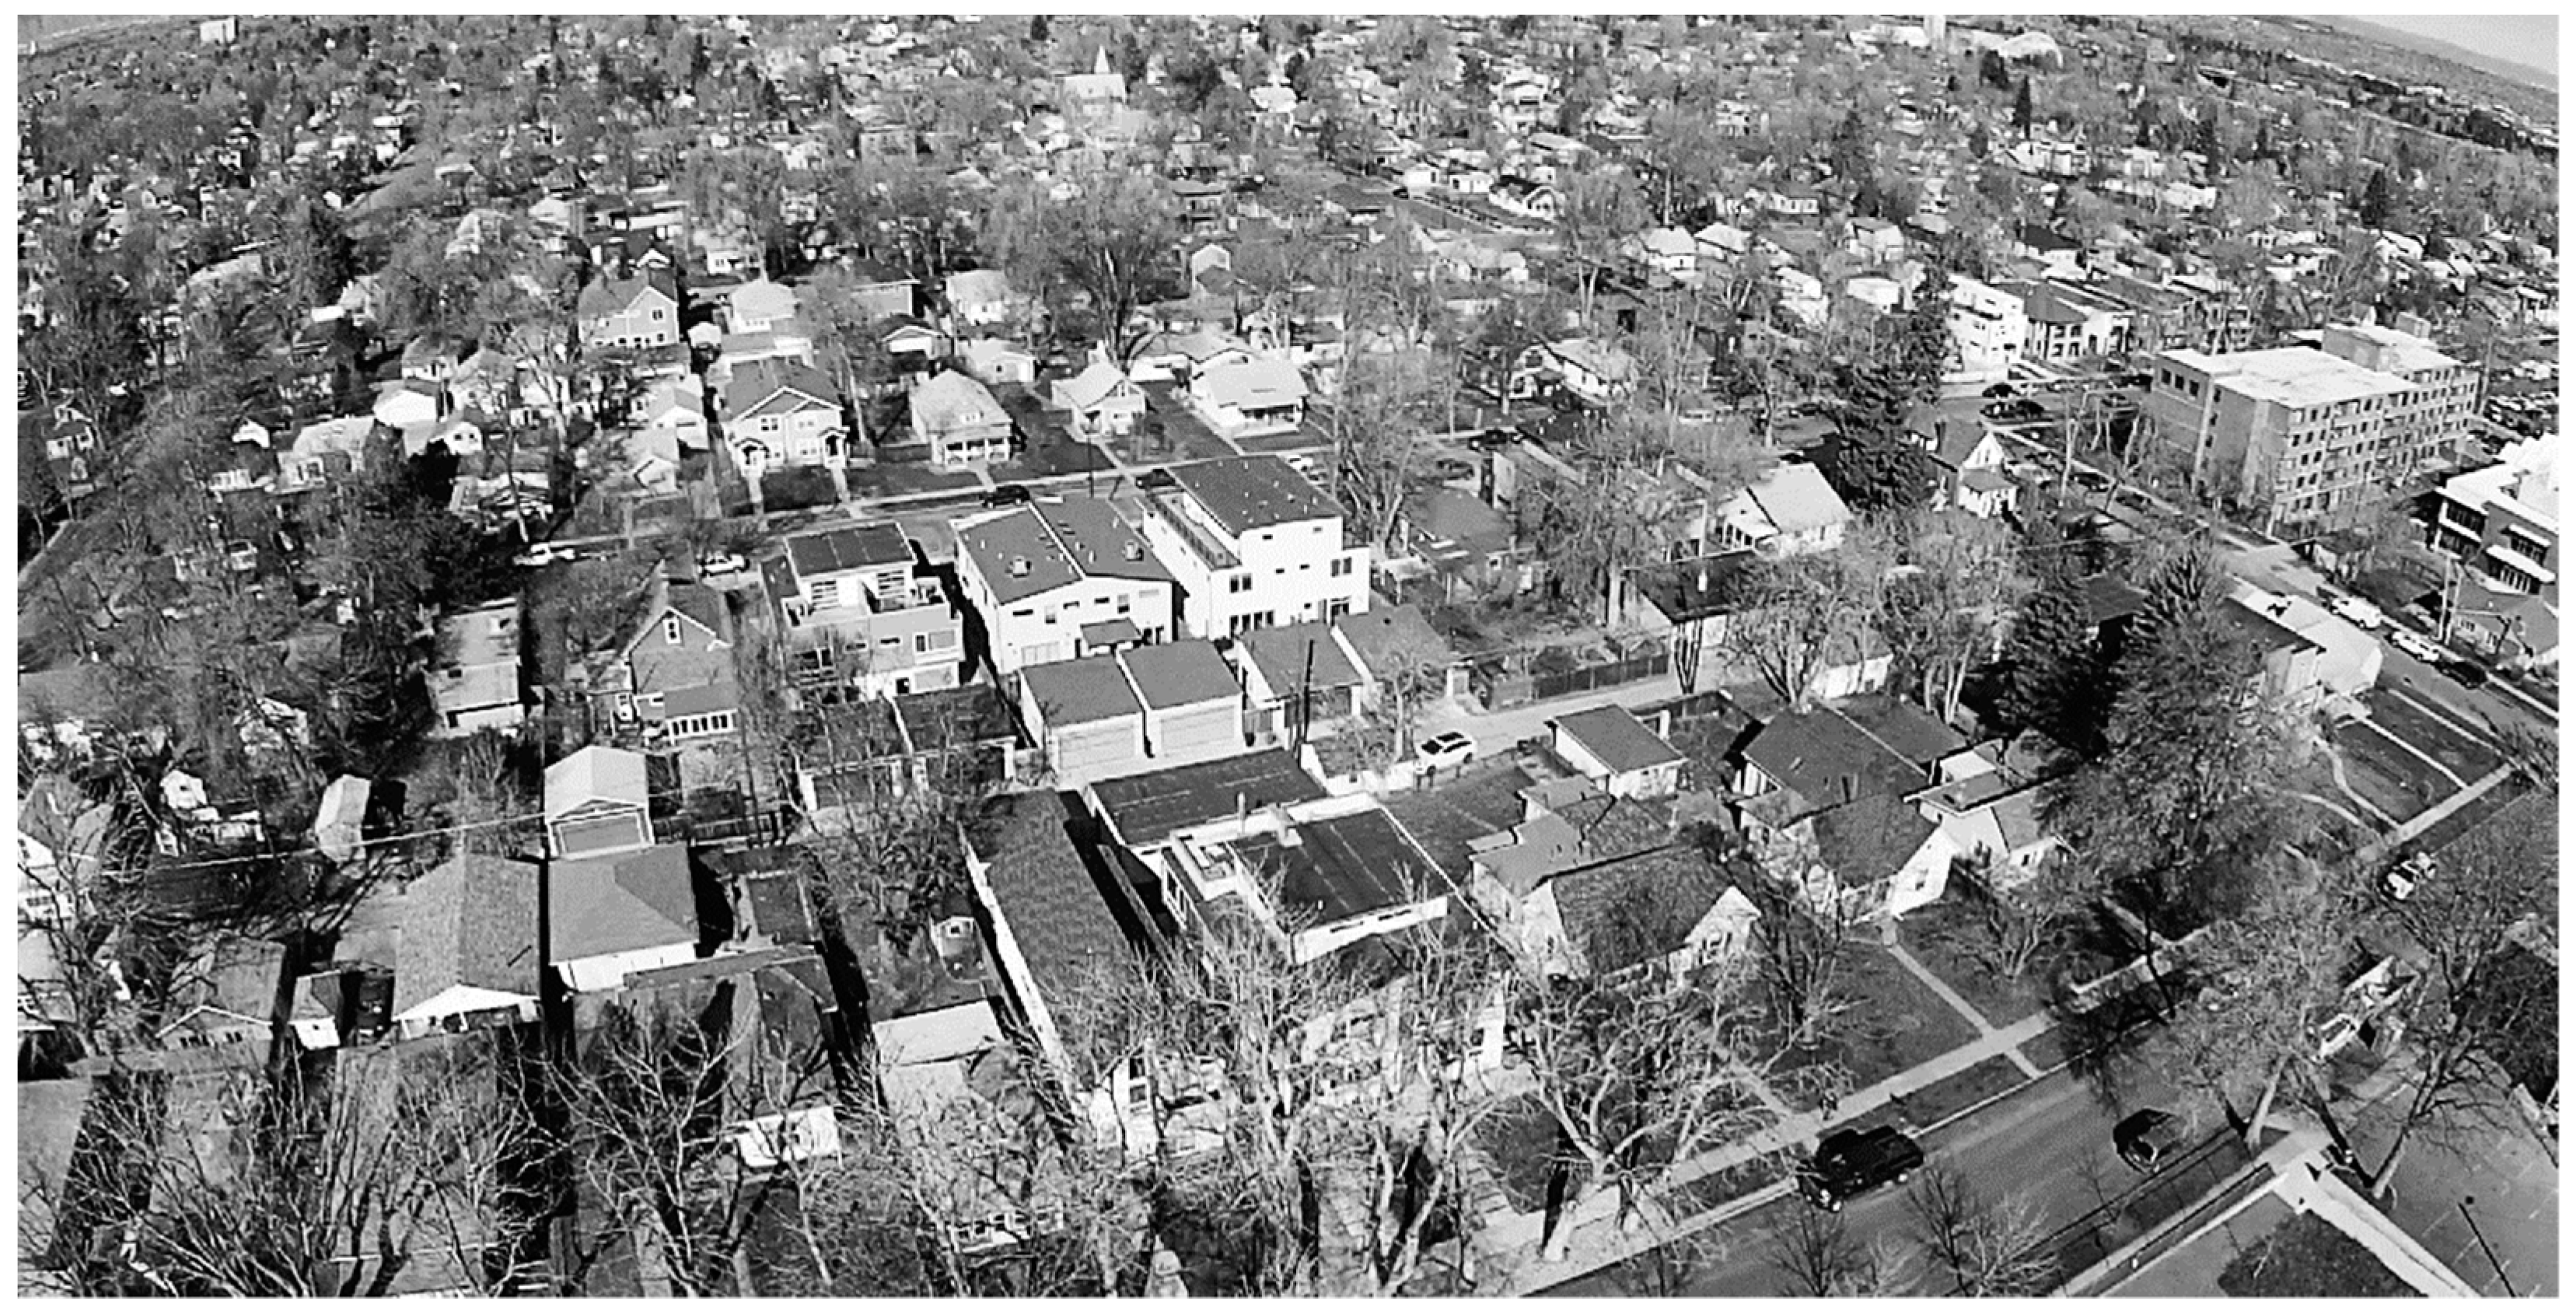
The Berkeley neighborhood is currently in a state of rapid infill redevelopment. Properties that once held small single-family cottages are being replaced by larger single and multifamily units (
Figure 1). Over the past ten years, urban growth has begun to convert the neighborhood into higher density apartments, row homes, and condominiums that can house multiple families on one parcel. Large projects currently in the pipeline, include a Natural Grocer and two large apartment complexes with over 50 apartments per building [
1,
2].
1.2. Research Objective
The overarching goal of this research is to evaluate the recent infill redevelopment and enable estimation of future redevelopment within the Berkeley neighborhood. The primary hypothesis is that future impervious cover in parcels (i.e., properties) with urban infill development in west Denver can be predicted using a combination of linear and logistic regression, where the independent variables in logistic regression are factors found in county assessor’s data. This research is intended to develop a reproducible method that can be used by municipalities to forecast spatial and temporal change in impervious cover, at the parcel scale, for urban neighborhoods experiencing infill redevelopment using public available urban planning data.
A parcel scale resolution was selected to inform future water quality regulation and water quality enhancement due to redevelopment, which is occurring at the parcel scale. Additionally, urban stormwater Best Management Practices (BMPs) are placed at smaller scales and locations.
Results from this research will be used as inputs for additional research outside the scope of this project, that evaluates the impacts of infill redevelopment on stormwater quality and quantity within the Berkeley neighborhood drainage basin.
2. Literature Review
2.1. Urban Land Use Change Models
There are many models available to assist researchers and professionals in investigating land use change within the urban environment. The models can either be spatial, temporal, or a combination of both. In addition to the spatial and temporal aspects of a model, land use change models can also include a human decision-making component. These three categories are the primary attributes of model classification. Land use change models can also be grouped with regards to their spatial resolution and temporal duration, otherwise known as scale, and their complexity. Fine scale models evaluate small areas of land, like a watershed or a sub watershed, and shorter time steps, while broad scale models evaluate areas larger in size, like an entire region or continent, and over longer periods of time [
3]. As the model complexity increases, the model considers more interactions. According to Agarwal et al., all land use change models can be categorized according to these following five attributes: Spatial, temporal, human decision making, scale, and complexity [
3].
In order to simulate infill redevelopment, a fine scale model is necessary. The US Forest Service reviewed 19 of the most representative land use change models, including the California Urban Futures model (CUF) and the Land Use Change Analysis System (LUCA). Among these models, the minimum spatial scale was around 10,000 ha [
3]. This eliminates the majority of land use change models from consideration for infill redevelopment modeling, since their spatial extent is much broader than what is required for redevelopment forecasting.
UrbanSim is a land use change model with a parcel scale resolution giving it the ability to simulate infill redevelopment processes. It was developed by Paul Waddell from the University of California, Berkeley. The model has a land development tool that simulates developer behavior and can estimate the amount of vacant or developed land converted to a greater density. This tool completes this task by evaluating a parcel’s profitability and constraints. The UrbanSim model has been accepted as one of the best land use change models available [
4]. However, the model input requirements are too large for in house municipality analysis.
2.2. Municipality Tools
The high spatial resolution required by redevelopment models and the limited resources for data collection and synthesis limit the options that are available to municipalities. As a result, it seems that the majority of municipalities and city planning groups have created their own methods of redevelopment capacity estimation and forecasting [
5,
6,
7,
8,
9,
10,
11,
12,
13].
Three strategies that were commonly incorporated in the municipality studies were analysis of a parcel’s floor area ratio (FAR), its improvement to land-value ratio (ILV), and its residual land value (RLV). The FAR is the ratio of building to total land area. The ILV is the ratio of improvement value of a parcel to its land value. The land improvement value used in the ILR calculation is the result of capital value, including building, minus the land value. The RLV is the value of completed development subtracted by the cost of development and profit earned by the developer [
14].
The FAR can help municipalities determine if a parcel is being utilized to its full potential. A FAR of 1 indicates that the building floor area is equal to the parcel area. A FAR greater than one means that the floor space is greater than the parcel, thus a multiple story building. Anything less than 1 would imply that the building is smaller than the total parcel area [
15]. The maximum FAR value is the same for all parcels within a zoning type. For this reason, it is another useful tool in determining if a parcel is employing its full density allotment.
During the ILV evaluation, all the developed land is ranked per its improvement to land value ratio. The City of Bellingham, Washington sets the improvement to land value threshold at 10%, where if the structural value is less than or equal to 10% of the total land value, then redevelopment will occur within 20 years [
13]. Parcels with low improvement to land value ratios are considered “underutilized”. The city of Portland states that a parcel is considered underutilized if the ILR is 0.5 or less [
7]. Eagle Point, Oregon has an ILR redevelopment threshold of anything less than 1:1. Eugene, Oregon uses a method that determines the low, moderate, and high development potential. Low redevelopment potential exhibits an ILR between 0.3 and 0.5 with the building coverage at less than 20% of the land area. Moderate redevelopment potential is characterized by an ILR of 0.3–0.5 with building coverage accounting for less than 10% of the total parcel. Lastly, they determine high redevelopment potential as any IRL less than 0.3, regardless of the building utilization [
16].
The RLV Method evaluates the redevelopment likelihood based on residual land value analysis. This method compares the market price of the parcel post redevelopment to the residual land value, which is the purchased value of the land subtracted by the redevelopment costs and desired profit [
9]. This method requires knowledge of construction costs, projected profits, and selling price after redevelopment. The method was designed and tested on two Pierce County, Washington cities, Tacoma and Puyallup. They found that the model was successful and only needed to adjust baseline calculations for a few “unique” parcels [
9].
Many municipalities used these three techniques as a way of locating potential locations for future redevelopment. While these methods are a great way to get a basic understanding of parcels with a potential for redevelopment, the literature regarding their accuracy is limited.
2.3. Logistic Regression
One method with the ability to balance complexity with user friendliness is logistic regression. Logistic regression is type of generalized linear model (GLM) that fits an equation between one or more independent variables, both continuous and categorical, and a binary dependent variable. The main outcomes of this process are an estimation of the effect of the independent variables on the dependent variable and the predicted probability of the dependent variable from unseen observations.
Logistic regression has been widely used to answer research questions where the outcome of interest is binary. Unlike the methods currently employed by many municipalities, logistic regression is able to evaluate the effects of multiple variables, distinguish which of these variables has the greatest influence on redevelopment, and predict future building coverage change. As a result, this method was selected as the most suitable tool for modeling infill redevelopment because of its ability to evaluate redevelopment drivers and predict future redevelopment.
3. Methods
To evaluate and predict infill redevelopment within the Berkeley neighborhood, a combination of linear and logistic regression was utilized, using open source information obtained from the City and County of Denver’s Assessors Office. A regression model was employed to predict the future building cover growth. Once the building cover increase was determined, a logistic regression model was developed, using 2004 parcel attributes as independent variables to predict which parcels would redevelop between 2004 and 2014. The projected building cover increase was then distributed to the parcels that were predicted to be redeveloped in the future, resulting in an impervious cover forecast for the Berkeley neighborhood for the year 2024.
3.1. Data Organization
The best available data for parcel scale modeling in the Berkeley neighborhood was determined to be the City of Denver Assessor’s Office parcel data and the current zoning code (
Table 1).
The Assessor’s Office parcel data is released every two years and was available for this study from 2004 to 2014. To prepare this data for the linear and logistic regression modeling, considerable quality assurance and control needed to be performed.
The 2014 data was missing building coverage for all apartments. As a result, the building coverage had to be calculated manually using Google Earth’s calculated geometry feature. Additionally, the parcels that were classified as condominiums were individual units within the condominium building. Since the goal was to determine redevelopment on a parcel scale, the individual units had to be joined into one observation category for each condominium building. Units with the same address and year built were joined. Once the condominium units were grouped, they were combined into a single parcel through the addition of the individual unit’s assessor’s parcel information.
Another data organization process performed was the grouping of the parcel’s “current use” categories. The current use describes a parcel’s primary function. Some of the most common uses within the Berkeley neighborhood are single family and row homes. Less common uses were churches, car washes, and schools. As the original data included over 45 different use categories, sometimes with only one parcel in some categories, they were grouped into larger more encompassing categories that would reduce the total number of independent variables and allow for better model fitting and prediction. The resulting categories were vacant, single family, business, apartment, other, row house, and condominium (see
Table 1 above).
The parcel redevelopment indicator that was used as the outcome variable in the logistic regression model (discussed in more detail below) was determined by evaluating a parcel’s change in building coverage between 2004–2014. In order to track this change, the parcel’s schedule number, which is an ID that is unique for each parcel, was used. Parcels that had a change in building coverage during the study period were labeled as 1 for redeveloped and 0 for not redeveloped.
Finally, during the ten-year period that was investigated, 4% of the parcels were subdivided. When the subdivision occurred the parcels schedule number was either changed to two completely new schedule numbers or one was arbitrarily kept as the old number while the other was given a new schedule number. To accurately track the building cover change resulting from a subdivision, all of the parcels resulting from the spilt had to be connected with the original 2004 parcel. This task was completed by spatially joining, in ArcGIS, the parcels in 2004 with the parcels in 2014 and determining where the 2004 parcel overlapped with new subdivided 2014 parcels so that the 2004 and 2014 total building change could be calculated.
After performing this quality assurance and control on the raw data in the assessor data base, the linear and logistic regression modeling was performed.
3.2. Linear Regression
The first step to quantifying the spatial extent of redevelopment within the Berkeley neighborhood was to identify and choose an informed growth scenario. Building coverage was deemed the most appropriate variable to use because it is an actual indicator of redevelopment and is also a good measure of increased impervious area. Sheds, detached garages, or driveways were not included in this calculation because of the lack of available data for these structures over time.
Building coverage projections were determined by fitting a linear regression trend line to the building coverage change between 2004 and 2014 and using the resulting equation to predict the total building cover at a future point in time. Initial observation of the data reflected that linear regression provided a good fit with the observed building cover over time, despite the 2008–2010 recession period. The year 2004 was selected as the starting date, because of data availability and that rapid infill-redevelopment began in Berkeley neighborhood in 2003–2004, and 2014 was selected as the end date because it was the most recent data available when the study was conducted.
3.3. Logistic Regression
After developing a growth scenario that could be used to determine future building cover increase, the next step in the process was to determine which parcels would be redeveloped in the future. This was completed using logistic regression.
Logistic regression has promise to improve urban land cover forecasting because of its ability to evaluate the effects of multiple variables on land cover change due to redevelopment, distinguish which of these variables has the greatest influence on redevelopment, and finally to predict the probability that a parcel will be redeveloped in the future [
3,
17]. Thus, this method was selected as the most suitable tool for this research because of its ability to incorporate complexity (i.e., include numerous redevelopment drivers), maintain relative user friendliness, while meeting the primary goal of predicting future redevelopment at the parcel scale.
A logistic regression model uses causative factors to estimate the probability of a desired outcome, in this case, whether or not a parcel will develop (the causal factors chosen are presented in
Table 1 above).
The logistic regression equations can be solved to determine the probability of each parcel developing, which could be used to rate a parcel’s affinity for development (i.e., low, medium, high, etc.) (Equation (3)). However, for this research, we were interested in forecasting whether a parcel will develop (yes or no) for direct comparison to the observed outcomes. That is, for model performance evaluation the only metric we could reasonably employ is whether or not property actually developed and if the model could predict that outcome. Thus, this probability was be dichotomized to express whether a parcel had been redeveloped (Y = 1) or not redeveloped (Y = 0) between the years 2004 and 2014.
The procedure for the logistic regression model was to use assessor data (independent variables, see
Table 1) from 2004 along with outcome data from 2014 to “calibrate” the model (i.e., optimize the values of the coefficients in Equation (1), which relate the relative importance of each independent variable, on the outcome of whether or not a property developed). A standard approach used in the statistics literature is to calibrate the logistic regression equation to one set of data, called the calibration data set, and evaluate the model performance for its predictive ability using another data set, called the validation data set [
18,
19,
20].
For the redevelopment period between 2004 and 2014, the independent (assessor’s data) and outcome data (developed or not) was spilt into two groups, a calibration set and a validation set. A total of 75% of the 2004 parcel data was randomly selected in R to be used for the calibration set (n = 2790) and the other 25% was used to compose the validation data set (n = 930).
3.4. Model Calibration
The first step in the logistic regression modeling process was to fit the model using the independent variables from the calibration data. This process involved identifying and removing correlated independent variables (
Table 1), and then evaluating all possible models (i.e., with every possible combination of independent variables) to yield a model that had the best predictive power, yet was as simple as possible.
To determine the best subset of variables to use as model input, each variable in
Table 1 was tested for collinearity and correlated variables were removed. Including variables that are correlated with one another into the logistic regression model is unnecessary because they provide redundant information with regards to their relationship to the dependent variable, redevelopment. Moreover, including two correlated variables in a model can result in a model calibration producing non-unique results that can preclude prediction [
21]. Including unnecessary variables can also unnecessarily complicate the model, thus each variable in the 2004 parcel data was evaluated individually for its correlation with the other independent variables.
To evaluate variable correlation, Spearman’s rank correlation coefficient (rs), which is a measure of correlation between non-normally distributed continuous variables, and the chi square values (X), for categorical variables, were used. If two variables were highly correlated (i.e., rs > 0.6 or X < 0.05), only one was included in the final analysis. The variable that was selected was the one with the greatest correlation with the dependent variable. To evaluate the strength of correlation between each independent variable and the dependent variable, the R squared value was used. Variables that were not found to have a reasonably significant R value (i.e., R2 < 0.5) when fitted to the outcome of redevelopment on their own were not considered in the multinomial logistic regression model. This process resulted in 7 of the variables being eliminated (see Results section).
Once the potential issue of collinearity was addressed, the variables were further evaluated to determine which combination of variables created the best model. The goal of this process was to develop a model with the least number of variables with the ability to accurately predict the parcels that had redeveloped between 2004 and 2014.
However, as there are too many possible model variable combinations, testing each manually would be a time prohibitive endeavor. For example, a model with just 10 variables has
or 1024, different candidate models that could be used. Because it would be extremely tedious to manually test each one of these combinations, the ‘
Glmulti’ R software was utilized to select the top models for analysis and prediction. The software produces all possible variable combinations, fits them with logistic regression, and returns the best models based on the Akaike Information Criterion, which measures the quality of the logistic regression model relative to the other candidate models [
22,
23]. This was performed as part of the model training (sometimes called calibration). After this process was completed, the best performing model was selected and used in the model testing process.
3.5. Model Validation
To evaluate the ability of the selected model to accurately predict redevelopment, its predictive ability was evaluated using the validation data. This is typically determined based on the sensitivity, and specificity and overall model accuracy [
24,
25,
26]. The model accuracy considers both the true positive and true negative classification abilities of the model and is often considered the best overall measure of logistic regression model accuracy. The equations associated with these measures are provided below and the terms a, b, c, and d are defined in
Table 2 below (Equations (4)–(6)).
The logistic regression model outputs probabilities of redevelopment between 0 and 1. However, because the desired model output was simply the redevelopment outcome for each parcel, these probabilities needed to be dichotomized so that the predicted vales could be compared to the true outcomes. This was completed by either rounding the predicted probability up or down, depending on a predefined cutoff value [
27,
28,
29]. The cutoff value that is selected can impact the sensitivity, specificity, and model accuracy values. To determine the best cutoff, all cutoffs between 0.1 and 0.9, at 0.1 increments, were tested and evaluated. The final model cutoff maximized the model accuracy, as the City of Denver was primarily interested in both the model’s ability to identify true negatives as well as true positives.
3.6. Probability of Future Redevelopment
Following the model calibration and validation processes, which included selecting the variable and redevelopment cutoff, the parcels within the 2014 dataset expected to be redeveloped in the future could be determined. To complete this task, the top fitted model was applied to the 2014 parcel data and the probabilities of future redevelopment for each parcel were produced. The probabilities were then dichotomized using the selected cutoff point, as explained above. This step resulted in each of the 2014 parcels being classified as either candidates for future redevelopment or not. The 2014 parcels that were predicted to be candidates for future redevelopment could then be incorporated into the business as usual growth scenario.
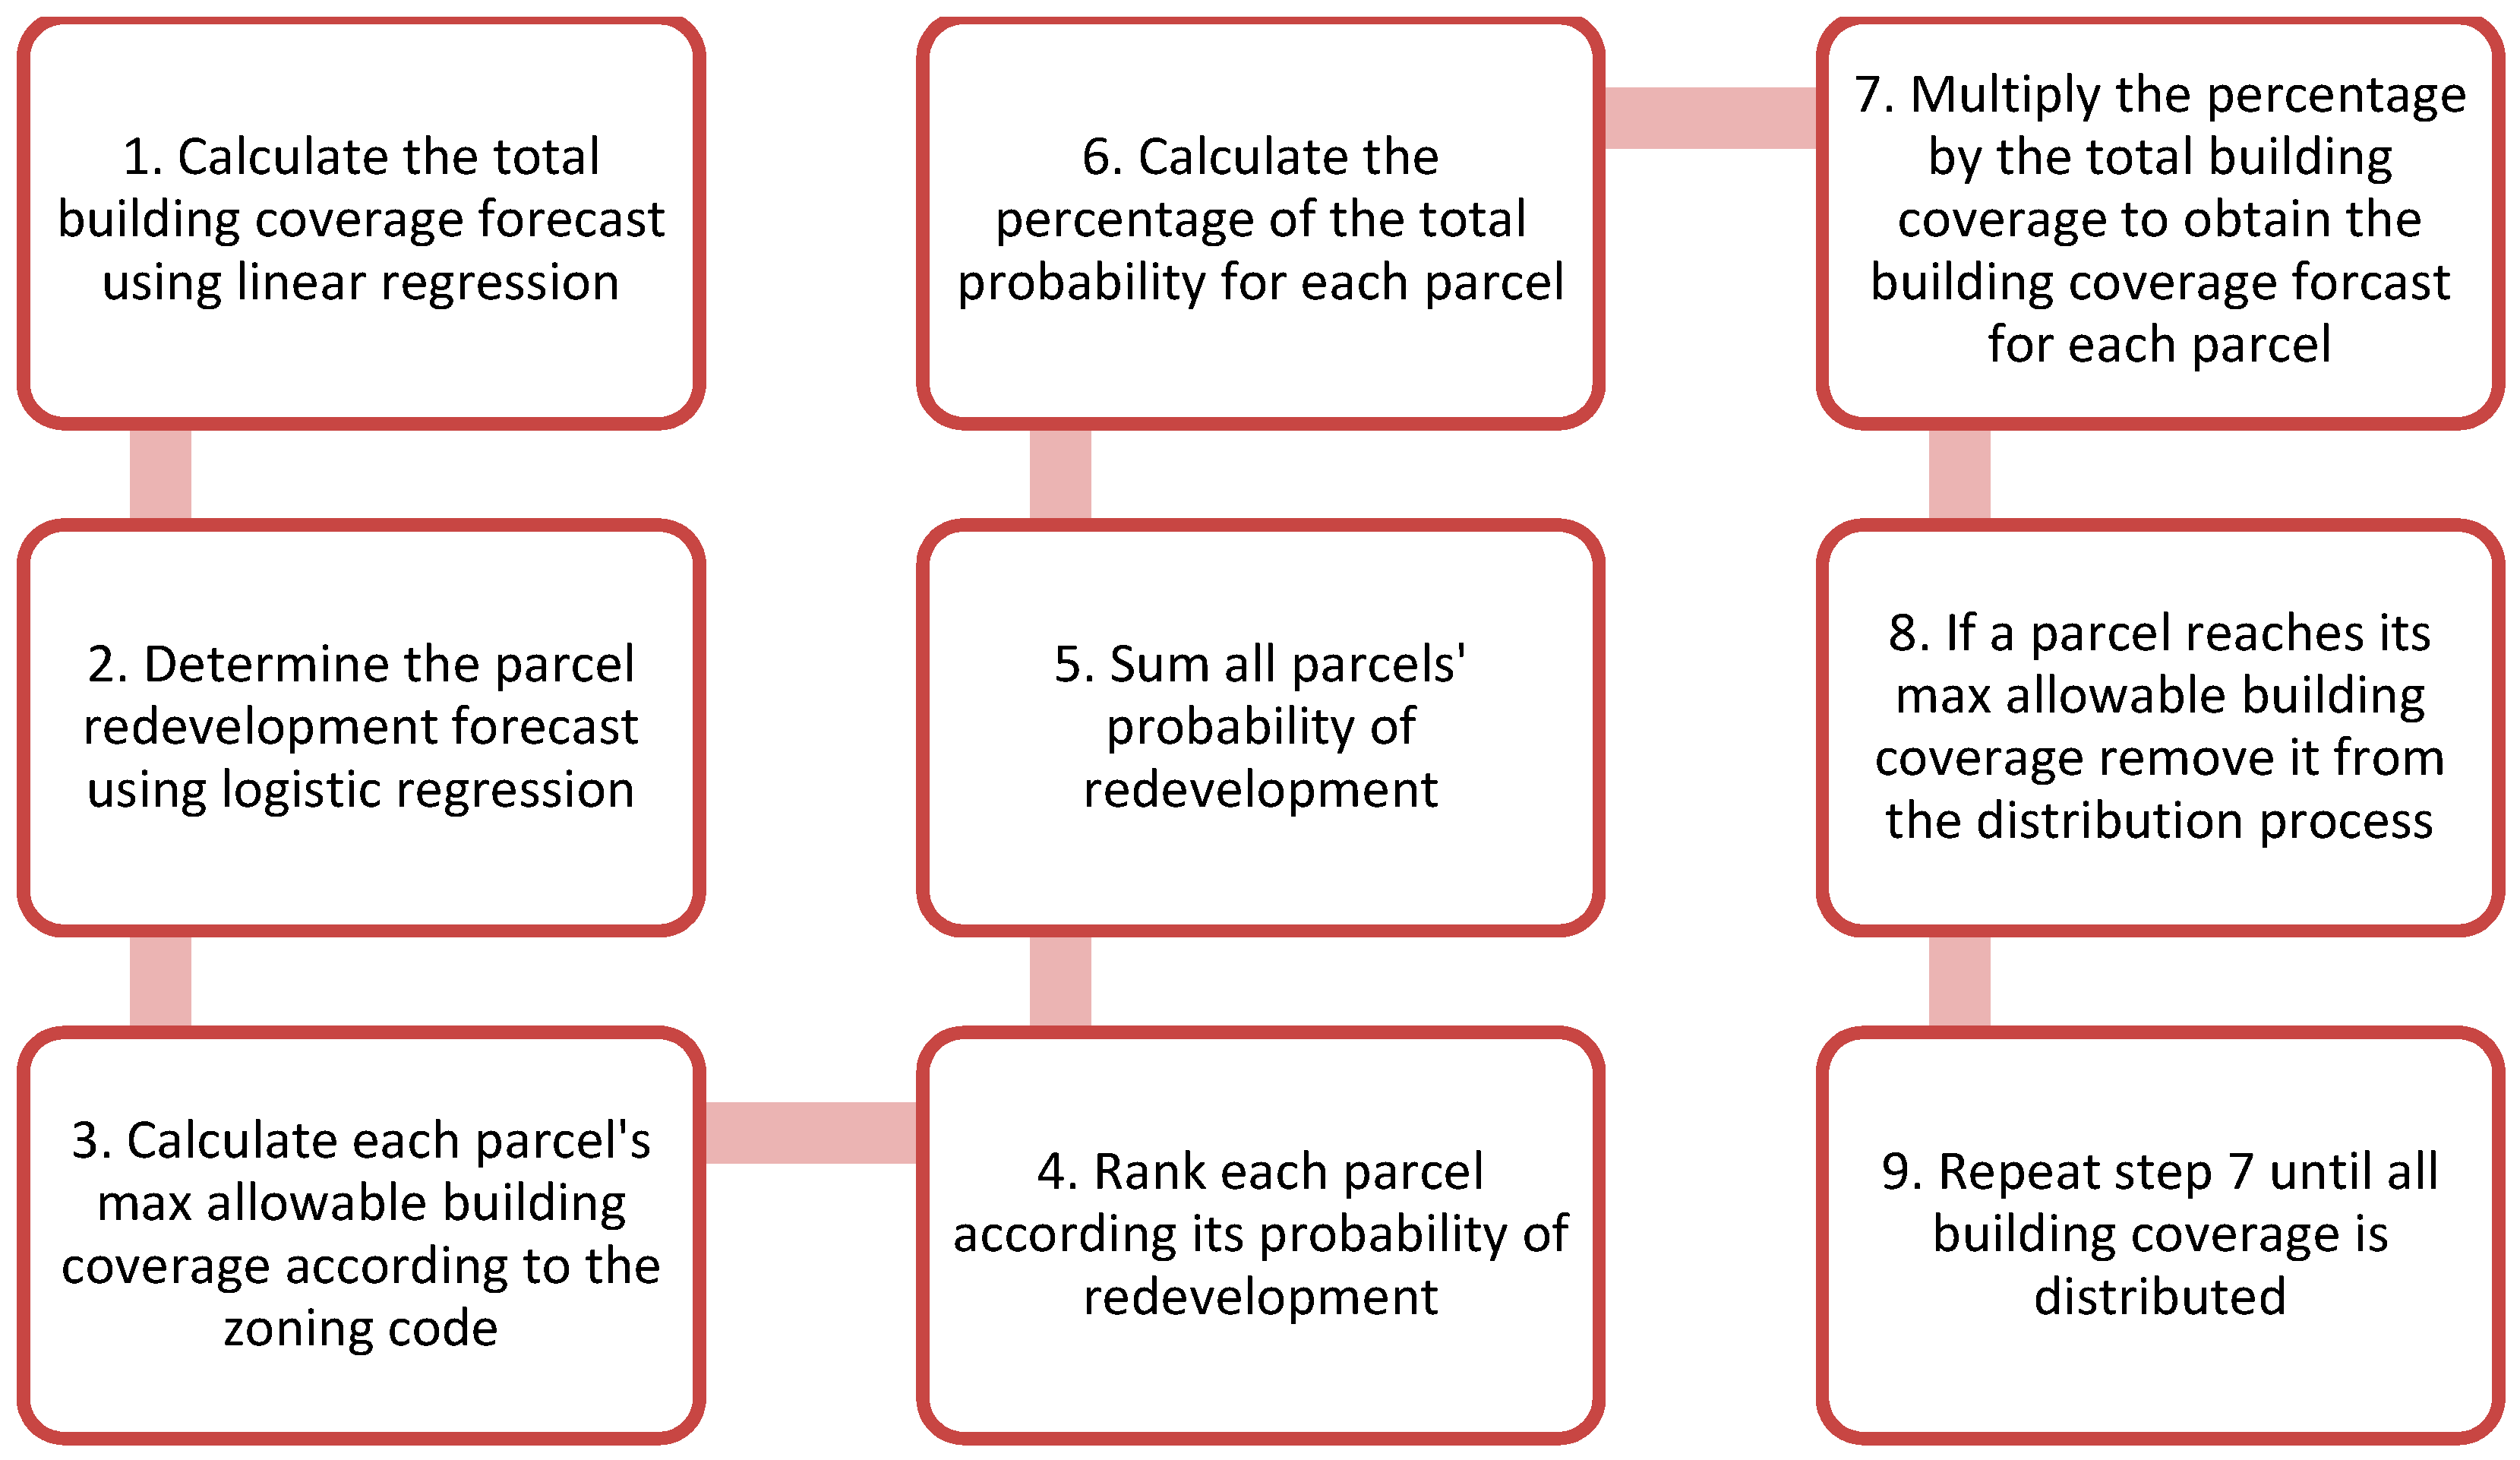
3.7. Redevelopment Forecast
Once the parcels expected to redevelop were determined, the forecasted increase in building cover was distributed to these parcels (see
Figure 2). However, because the total building cover increase was based on the linear regression equation, a future year needed to be selected to determine the total expected increase. Since a ten-year period was used for model testing and training, a ten-year period into the future would be used for the model forecast.
The projected additional building coverage was then distributed to the predicted parcels. This was completed by distributing the building coverage according to the predicted probability of redevelopment (i.e., properties with a larger fractional probability of redevelopment received a larger fractional portion of the increased building coverage). This approach is realistic in that the properties most likely to redevelop are often the candidates for razing the current building (usually small with low value) and building a larger multi-use or multi-family structure or single-family home. The properties with lower fractional probability are most likely properties that already have relatively larger buildings on them and, thus, are more likely to be remodeled (adding rooms, etc.) rather than razed and thus building coverage is a lower percentage of the property area. This assumption is, of course, speculative yet reasonable, but an assumption of this type was needed to enable the development of the model.
Using this method, the expected growth of building coverage was distributed among each parcel that was forecasted for future redevelopment. If a parcel reached the max development based upon the zoning requirements for the parcel, the balance was redistributed amongst the parcels that had available development capacity. This process was completed until all the projected building cover was distributed to the predicted parcels, resulting in the final model output, expected impervious growth due to redevelopment for each parcel [
30].
4. Results and Discussion
4.1. Linear Regression
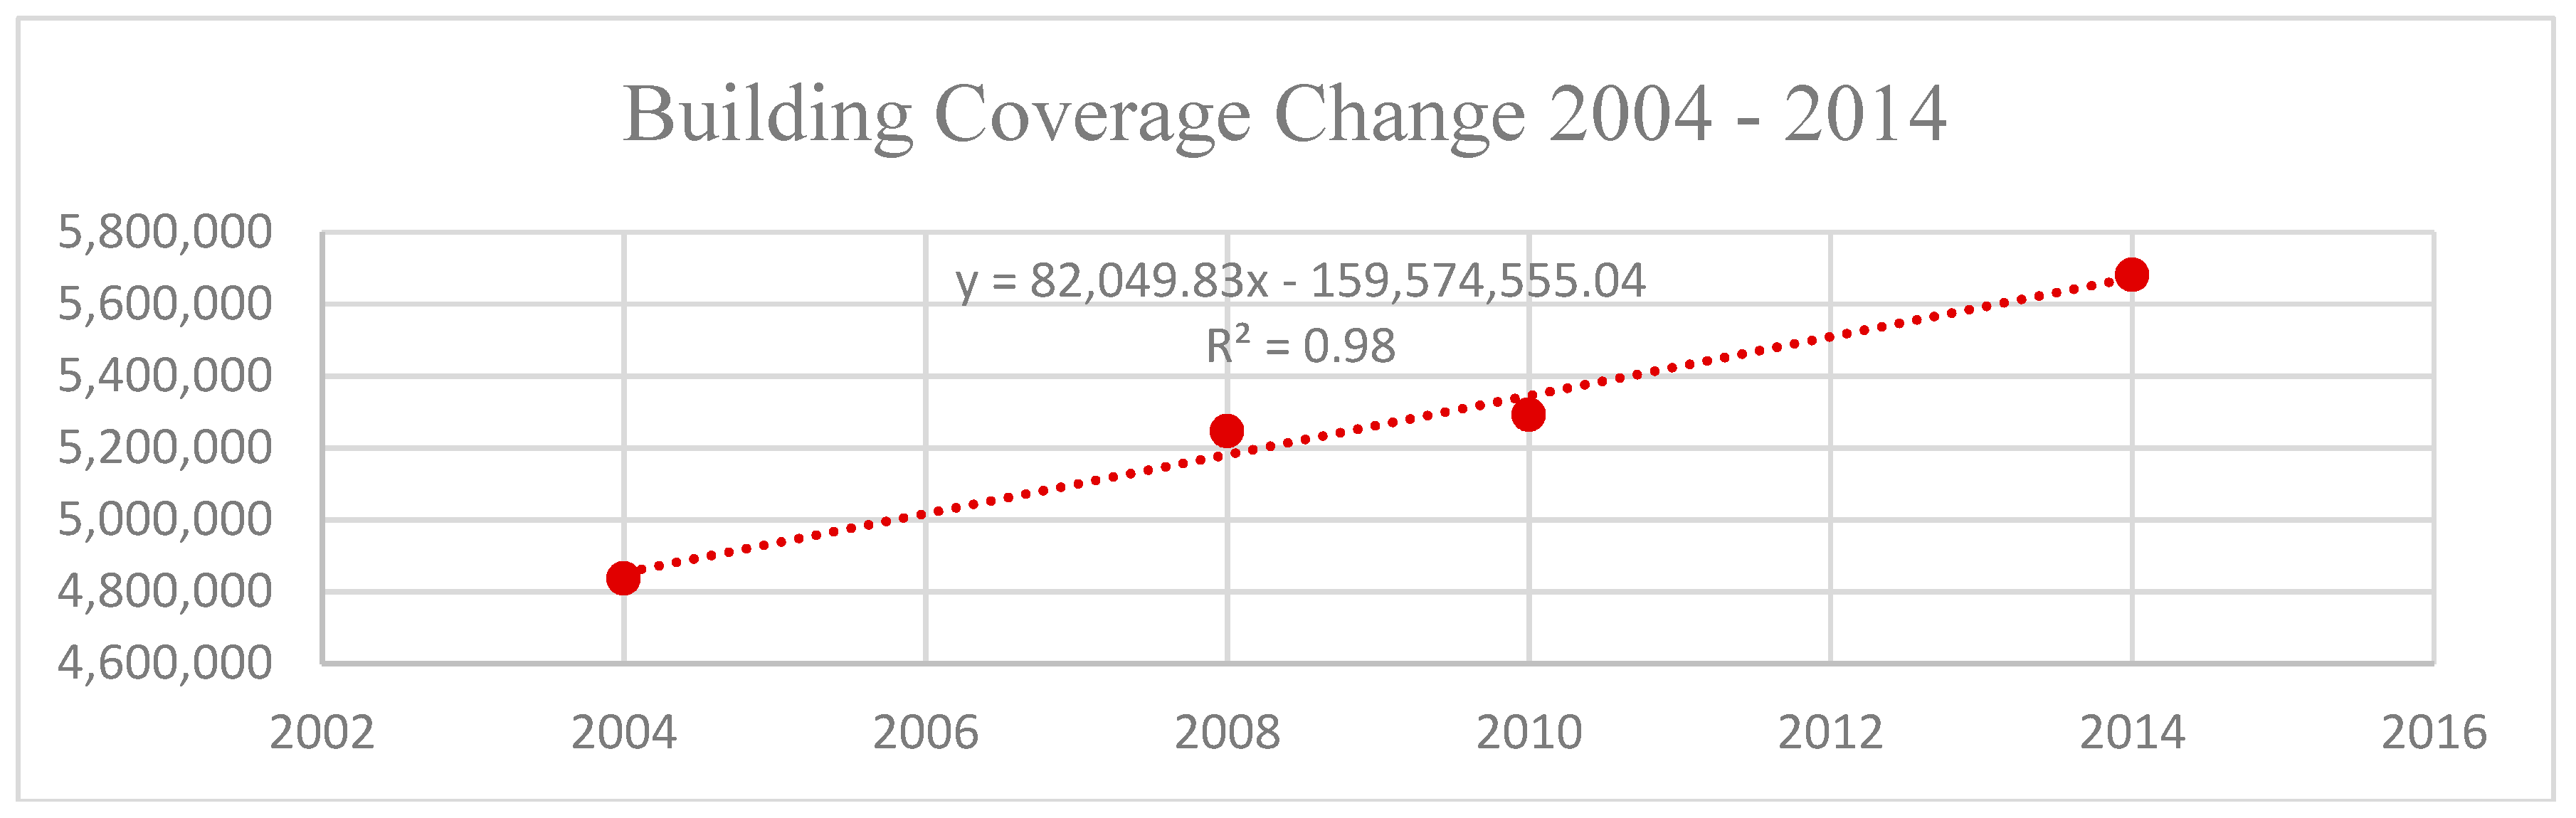
The total building cover from 2004 to 2014 was plotted and fit with a linear regression trend line (
Figure 3). Regardless of the 2008 recession, the total neighborhood building cover linearly increased over the ten-year period, with a total increase of 17% or 820,498 square feet (19 acres). The fitted linear equation had an R
2 value of 0.98 (Equation (7)). Unlike previously assumed, the spatial distribution was fairly uniform across the entire neighborhood (see
Figure 3).
Using the linear regression equation and the maximum allowable building coverage in the zoning code (18,783,107 sq. ft.), it was determined that, at the current rate of development, maximum build out of the neighborhood would not occur over the next ten years (see
Figure 4).
4.2. Logistic Regression
4.2.1. Model Calibration
Calibrating the model using 2004 assessor’s office data was the first step in this process, which included testing for collinearity and multivariate analysis.
4.2.2. Collinearity Analysis
The collinearity analysis of the 2004 parcel data gave great insight into the variables that needed to be discarded from the model fitting process. Results indicate that the following variable pairs were correlated with each other: Total parcel value—improvement value; building coverage—land cover type; and improvement to land value ratio (ILV)—building to land area ratio (BLA). Of these pairs, we eliminated the variable that showed the weakest correlation to redevelopment during the univariate analysis, leaving the following variables: The total parcel value, building coverage, and the BLA (See the SI). Additionally, the parcels’ current use classification of vacant, other, condo, and businesses did not show statistical significance with redevelopment, so they were removed from the analysis. Based on this information, 9 variables remained for the logistic regression testing and training (
Table 3).
The multivariate analysis, described above, determined the top model from the 512 candidate models. This model included the following 4 independent variables: Total value, year Built, PD, row house, and apartment (
Table 4).
Equation (8) displays the intercept and coefficient values for this model. By taking the natural log of this equation, the odds ratio was determined for each variable coefficient to understand how the odds of being redeveloped were influenced by a one-unit change in each of the variables individually. Evaluation of the coefficients, in the form of the odds ratio, for each variable indicated that as the total value, year built, and percent difference increase, so do the odds of a parcel being redeveloped (
Table 4). A one unit increase in the PD variable, or the amount of land available for development, increases the odds of being redeveloped by 2.27. This indicates that parcels with small footprints on large lots are desirable candidates for redevelopment. Similarly, a parcel with a use classification of row home or apartment has a higher likelihood of redevelopment than the other use classifications in the neighborhood. Regardless of the magnitude of influence the variables selected in the final model have with the dependent variable of redevelopment, they all have a p value below 0.05 (
Table 4).
4.2.3. Model Validation
The fitted logistic regression equation was then used to test the model’s predictive ability. The model accuracy remains stable (around 84%) for all cutoff values, the point that the predicted probability is rounded up or down to produce a dichotomized prediction above 0.5. This indicates that the selected model variables can predict redevelopment effectively, regardless of the cut off used. It is not until the cutoff value is set below 0.3 that the model accuracy falls below 80%. The model sensitivity was below 50% for all cutoff values greater than 0.2. Conversely, the model specificity remained high (above 80%) for all cutoff values above 0.2. The predicted number of parcels remained low (<9%) for all cutoff values greater than 0.4. The cut off that best represented actual % of parcels redeveloped (22%) was between 0.2 and 0.3. Based on these considerations, it was determined that a cutoff between 0.2 and 0.3 would be appropriate because a natural break is evident in model accuracy between 0.2 and 0.3.
Thus, a cutoff value of 0.25 was selected as the model performance evaluation criteria. This model cutoff displayed 81% accuracy with a specificity of 92% and a sensitivity of 39% (
Table 5). This optimized the specificity, without causing a large reduction in accuracy or sensitivity, and best matched the observed parcel development rate during that time period. This cutoff is used in the logistic regression model to forecast parcels’ redevelopment from 2014 into the future.
4.2.4. Model Forecast
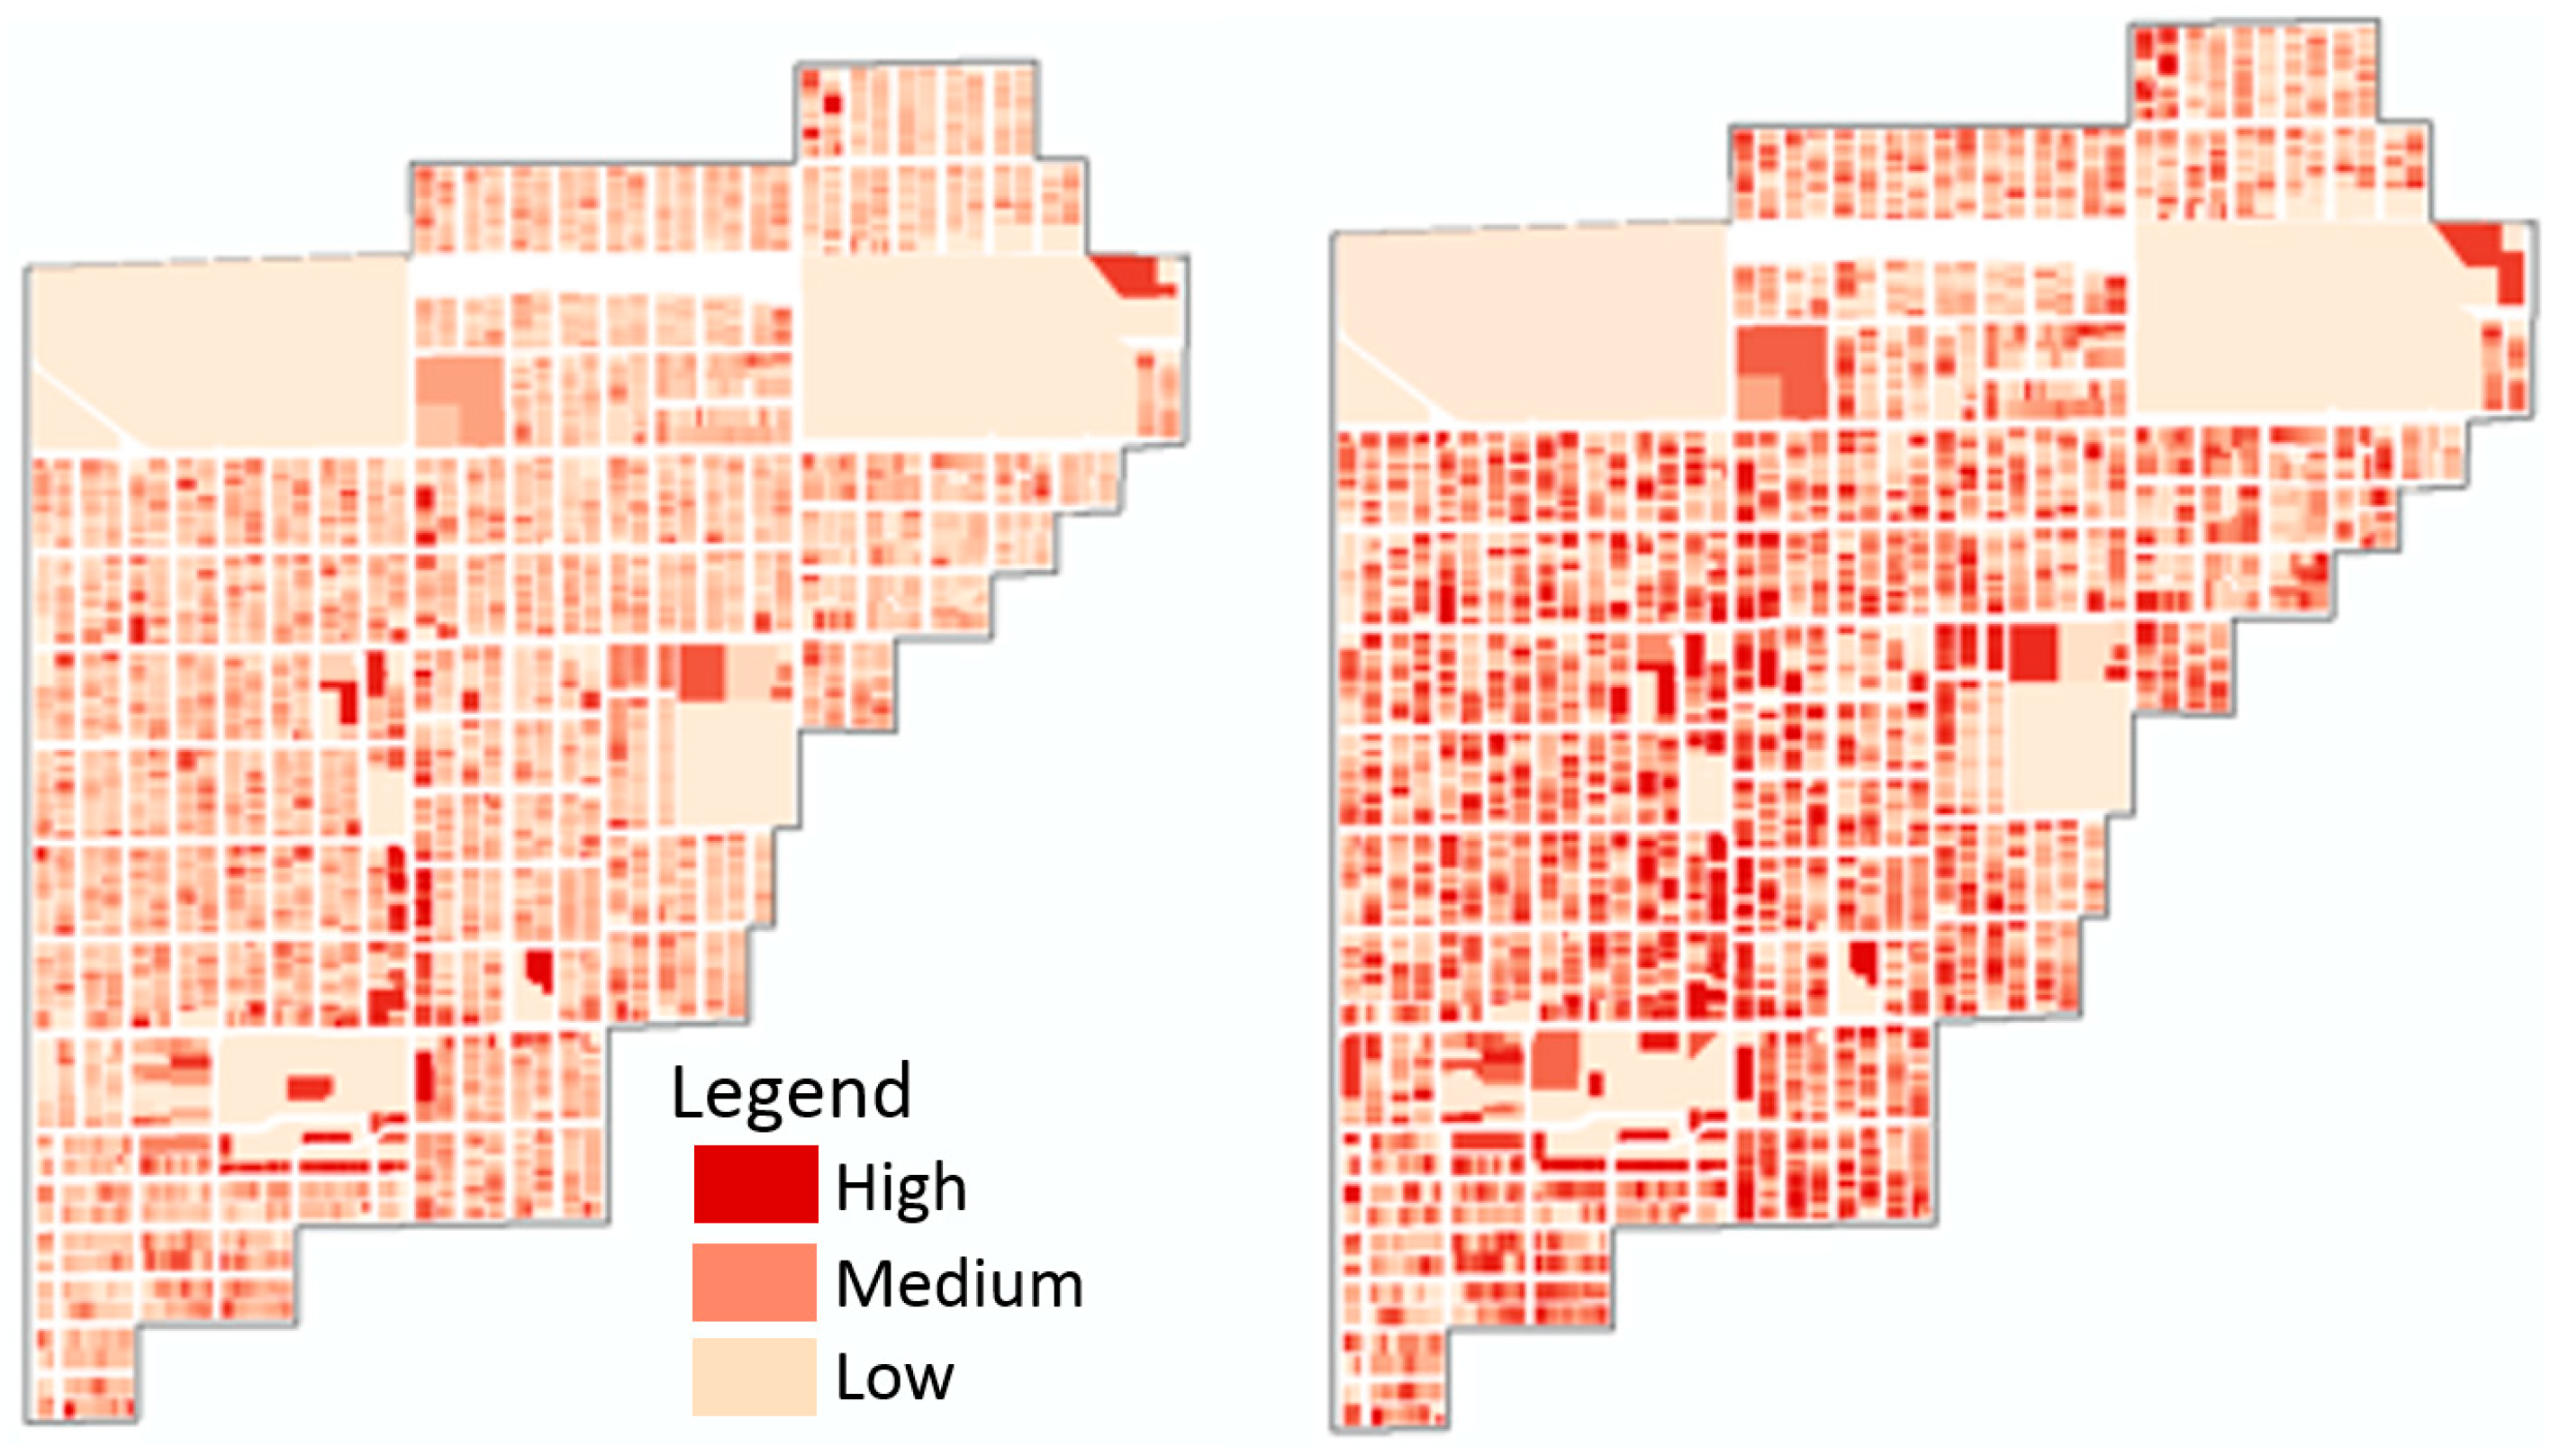
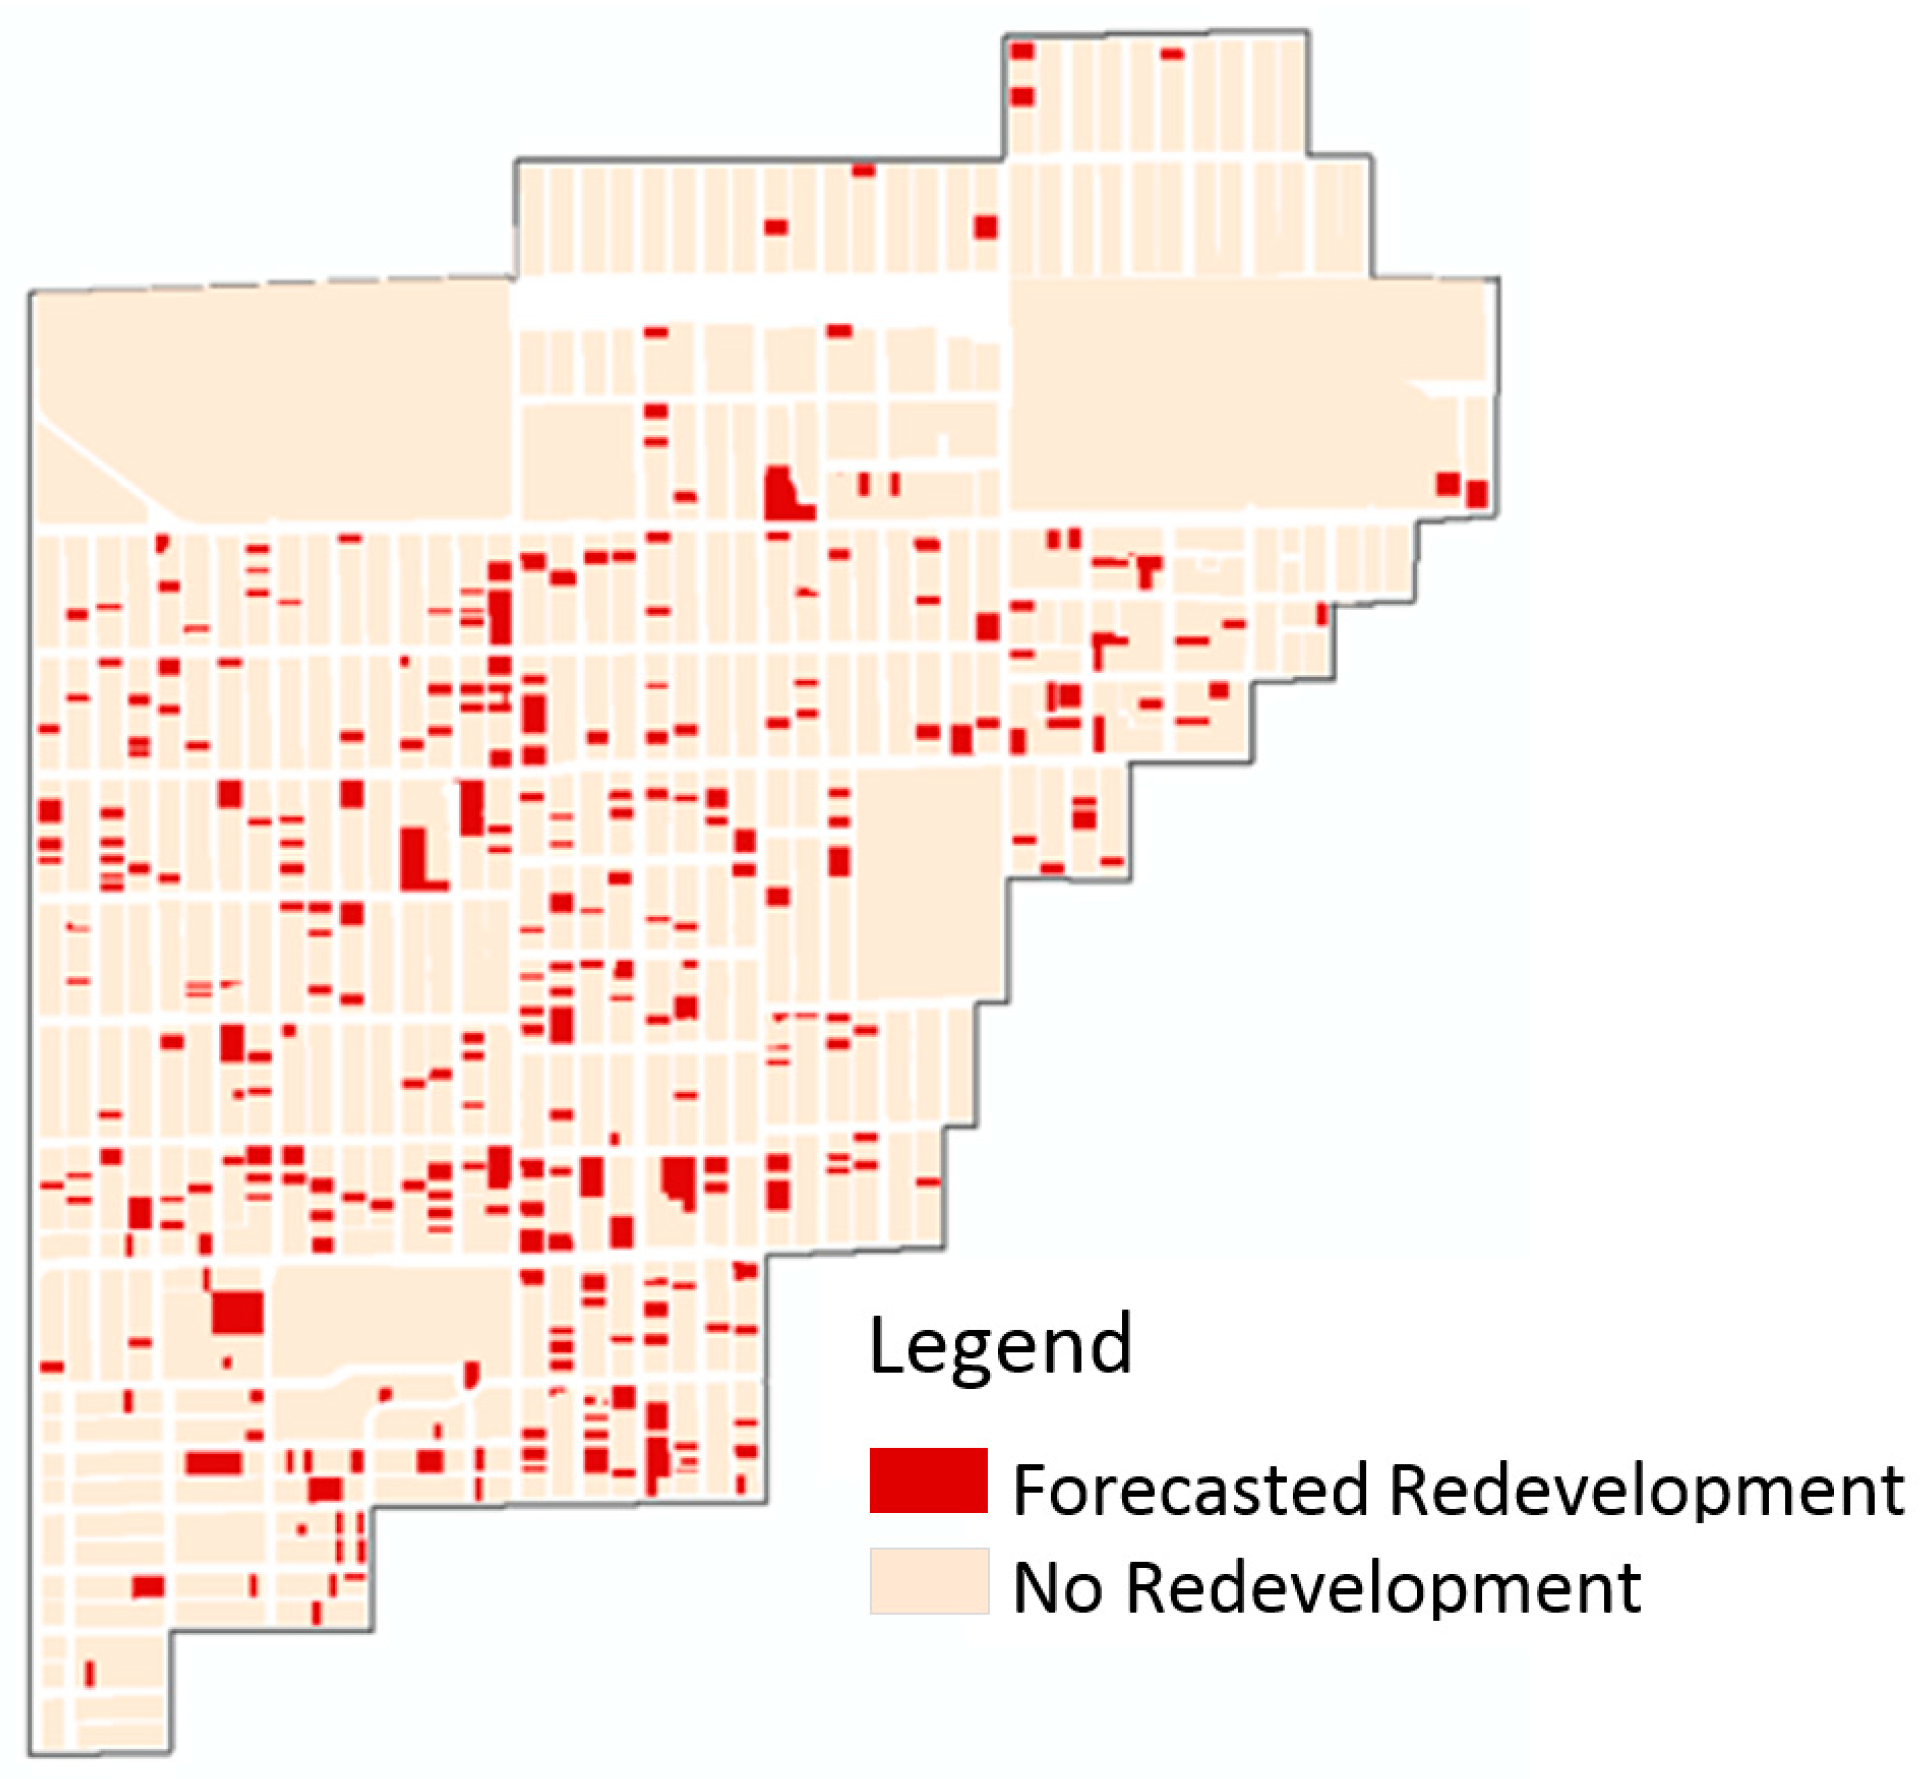
The fitted logistic regression equation with the 0.25 cutoff was applied to the 2014 parcel testing data set to predict redevelopment at the parcel scale in the future. The model predicted that 135 parcels were likely to be redeveloped at some time in the future (see
Table 6 and
Figure 5).
Similar to the historic redevelopment, the parcels that were predicted for redevelopment were distributed evenly across the entire neighborhood. Out of the parcels that were projected for redevelopment, the average size of the parcel was 103,412 sq. ft. or 0.24 acres, which is much less than the current 1-acre post construction stormwater facility requirement in the City and County of Denver.
The predicted probability of redevelopment for each parcel can be used by stormwater modelers to create more informed future sub basin imperviousness scenarios. Most of the predicted probabilities of redevelopment, prior to the dichotomization process, were below 0.25 which explains the high specificity of the model.
4.3. Redevelopment Forecast
As mentioned above, since a ten-year period was used for model testing a training, a ten-year period into the future would be used for the model forecast. Between 2014 and 2024 it is estimated that there would be about 820,498 sq. ft. (18.8 acres) of new building square footage within the watershed, equal to a 14% increase in building imperviousness, which was distributed to the to the predicted parcels using the method described above. The implications of this increase on stormwater quality can be evaluated using a hydrologic model, such as EPA SWMM.
4.4. Limitations
There are a number of assumptions, uncertainties, and limitations worth emphasizing with the method presented above. One limitation, associated with the linear regression model, is that the linear trend in building coverage was determined using relatively few data points (
Figure 3). Additionally, this model assumes that a projected building cover increase will result in an equal impervious area increase without taking into consideration the existing imperviousness. For example, it does not account for the difference in imperviousness resulting from properties that redevelop with new building coverage over previous imperviousness like patios, outbuildings, and within-lot paved pathways. We project the contribution of this type of imperviousness per parcel to be between 10%–20%, based on experience, but that this should be evaluated in more detail in future research. Finally, while the cutoff points in the logistic regression model predictions were based on careful reasoning, it was still somewhat arbitrary and different priorities of the user (i.e., more importance place on sensitivity vs. specificity) could result in a different cutoff, which could result in a somewhat different development scenario. For future research, different cutoffs could be evaluated depending on the end goal (i.e., future development, future impervious area, future infrastructure needs, etc.). Cutoffs values could also be included as variables in a model calibration with 2016 or 2018 data to better determine a cutoff value.
5. Conclusions
The results indicate that building cover change, within the study site from 2004–2014, followed a linear pattern. During this period the total building cover increased by 17% or 1.7% per year, on average. The logistic regression model determined that the assessor factors of total value, year built, percent difference between current and max building cover, the current use classification—rowhomes, and the current use classification—apartments to be the greatest predictors of redevelopment, resulting in a model that was 81% accurate. The building to land area ratio (BLA) variable was found to be highly correlated with the improvement to land value ratio (ILV) and, according to univariate analysis, the BLA was found to be a better predictor of redevelopment. While this variable was excluded from the final logistic regression equation, it is an important finding because it suggests that municipalities may be able to use or at least interchange the BLA and ILV variables to understand redevelopment potential, depending on data availability. The variables, identified in the final model, can be used by municipalities to understand the patterns impacting redevelopment in their area of interest and to tailor policy/regulation to limit or promote redevelopment, by focusing on the variables identified.
The final model forecasted an increase of 820,498 sq. ft. (18.8 acres) in building coverage between 2014 and 2024. The average size of the parcels expected to be redeveloped in the future was 0.24 acres, which is far less than the required 1-acre threshold for the implementation of a permanent stormwater detention and treatment facility. This indicates that Denver, like many other municipalities, may not be accounting for the incremental impacts that infill redevelopment has on impervious increase.
Both the linear and logistic regression models can be used to better understand the extent and location of redevelopment on a parcel scale. The logistic regression model had high accuracy and specificity. However, because the models were only fit using ten years of historic data, the presented methods may be better used for the planning and evaluation of watershed projects within a 10-year period.
As this research was inspired by a City of Denver Department of Public Works request, the results of this study were used to inform the Berkeley Neighborhood Stormwater Feasibility Study. The results of this study were used to inform the hydraulic modeling, future conditions modeling, and, ultimately, to make inferences regarding infill redevelopment’s impact on stormwater quality and quantity [
31]. The City of Denver is currently using the results of the larger investigation to justify discussions regarding water quality requirements for (re)development on parcels less than one acre, which are currently not mandated to implement water quality measures. As a result, to completely understand the impacts of redevelopment on watershed health, it is recommended that the methodology presented in this study be coupled with a future-conditions hydraulic analysis.
Through this strategy, municipalities interested in understanding locations of likely future development using easily obtainable open source data can implement this tool, coupled with hydraulic modeling, to help the city plan for infrastructure upgrades, determine optimal locations of grey or green infrastructure, and to justify a change in post construction stormwater management requirements.
Author Contributions
Conceptualization, L.C., D.M. and J.E.M.; Data curation, L.C. and K.P.; Formal analysis, L.C.; Funding acquisition, D.M. and J.E.M.; Investigation, L.C.; Methodology, L.C.; Project administration, J.E.M.; Supervision, D.M., B.E., T.S.H. and J.E.M.; Validation, L.C.; Writing—original draft, L.C.; Writing—review and editing, L.C., B.E., T.S.H. and J.E.M.
Funding
Support for this work was provided by the National Science Foundation Engineering Research Center for Reinventing the Nation’s Urban Water Infrastructure (ReNUWIt) (EEC—1028968), the Colorado Higher Education Competitive Research Authority (CHECRA), and the City and County of Denver.
Acknowledgments
Without the support and assistance of countless individuals affiliated with both the ReNUWIt research center and the City and County of Denver this research would not have been made possible. I owe an enormous thank you to my thesis advisor, John McCray, for his role in my success. The wealth of knowledge and genuine interest in my research that he provided was an endless source of support and encouragement. Secondly, I would like to thank Darren Mollendor, the City and County of Denver project champion. His mentorship has vastly expanded my perspective on urban storm water management and has greatly impacted my research. I would also like to thank my committee members, Terri Hogue and Bill Eisenstein, for their insightful recommendations throughout this process. Finally, I would like to thank my family and close friends for their constant encouragement and emotional support.
Conflicts of Interest
The authors declare no conflict of interest.
References
- Rolett, B. Tennyson apartment rush adding $ 23M project. 2015. Available online: https://businessden.com/2015/05/26/tennyson-apartment-rush-adding-23m-project/ (accessed on 25 September 2018).
- Rolett, B. New Apartments Headed to Tennyson. 2015. Available online: https://businessden.com/2015/03/09/new-apartments-headed-tennyson/ (accessed on 25 September 2018).
- Agarwal, C.; Green, G.M.; Grove, J.M.; Evans, T.P.; Schweik, C.M. A Review and Assessment of Land-Use Change Models: Dynamics of Space, Time, and Human Choice. 2006. Available online: https://www.fs.usda.gov/treesearch/pubs/5027 (accessed on 25 September 2018).
- Zhao, F.; Chung, S. A Study of Alternative Land Use Forecasting Models. 2006. Available online: https://www.trbappcon.org/2007conf/files/138%20Chung%20final.pdf (accessed on 26 October 2015).
- Son, B.J.; County, F. Residential Build-Out Analysis Based on Zoning Meeting infrastructure demand using GIS. ArcUser. 2009. Available online: https://www.esri.com/news/arcuser/0109/buildout.html (accessed on 25 September 2018).
- Maryland Department of Planning. Estimating Residential Development Capacity: A Guidebook for Analysis and Implementation in Maryland; Maryland Department of Planning: Baltimore, MD, USA, 2005.
- Portland Bureau of Planning and Sustainability. City of Portland Development Capacity Analysis; Portland Bureau of Planning and Sustainability: Portland, OR, USA, 2010.
- Janowicz, E. Predicting Redevelopment: Modeling Building Demolition; Urbansim Conference at UC Berkeley: Berkeley, CA, USA, 2010. [Google Scholar]
- Community Attributes. Identifying Redevelopable Lands: Application of a Land Value Potential (LVP) Approach in Urban Centers; Community Attributes: Seattle, WA, USA, 2009. [Google Scholar]
- Tashman Associates Planners and Policy Consultants. Infill and Redevelopment Strategies. Portland, 1994. Available online: https://core.ac.uk/download/pdf/36683501.pdf (accessed on 25 September 2018).
- Watt, T.; Solimar Research Group. California Infill Estimation Methodology Project. 2004. Available online: http://www.solimar.org/pdf/cainfillmethod.pdf (accessed on 25 September 2018).
- Community Planning Workshop. Eagle Point Buildable Lands Analysis. 2001. Available online: https://pages.uoregon.edu/rgp/PPPM613/downloads/EP%20Housing%20and%20Economy%20Final.pdf (accessed on 25 September 2018).
- Washington State Department of Community Trade & Economic Development. City of Bellingham. Land Supply Methodology; Washington State Department of Community Trade & Economic Development: Washington, DC, USA, 2006.
- Torrens, P.M. How Land-Use-Transportation Models Work; Centre for Advanced Spatial Analysis (UCL): London, UK, 2000. [Google Scholar]
- American Society of Planning Officials. Floor Area Ratio; The Society: Chicago, IL, USA, 1958. [Google Scholar]
- Envision Eugene Technical Resource Group. Commercial Redevelopment Methodology. 2011. Available online: https://www.eugene-or.gov/DocumentCenter/View/1622 (accessed on 25 September 2018).
- Charles, S.L. Understanding the Determinants of Single-family Residential Redevelopment in the Inner-ring Suburbs of Chicago. Urban Stud. 2013, 50, 1505–1522. [Google Scholar] [CrossRef]
- Xing, E.P.; Jordan, M.I.; Karp, R.M. Feature Selection for High-Dimensional Genomic Microarray Data. In Proceedings of the Eighteenth International Conference on Machine Learning, Williamstown, MA, USA, 28 June–1 July 2001. [Google Scholar]
- Steyerberg, E.W.; Eijkemans, M.J.; Harrell, F.E., Jr.; Habbema, J.D. Prognostic modeling with logistic regression analysis: in search of a sensible strategy in small data sets. Med. Decis. Mak. 2001, 21, 45–56. [Google Scholar] [CrossRef] [PubMed]
- Pradhan, B.; Lee, S. Landslide susceptibility assessment and factor effect analysis: backpropagation artificial neural networks and their comparison with frequency ratio and bivariate logistic regression modelling. Environ. Model. Softw. 2010, 25, 747–759. [Google Scholar] [CrossRef]
- Geza, M.; Murray, K.; McCray, J. Watershed-Scale Impacts of Nitrogen from On-Site Wastewater Systems: Parameter Sensitivity and Model Calibration. J. Environ. Eng. 2010, 136, 926–938. [Google Scholar] [CrossRef]
- Calcagno, V. Glmulti: An R Package for Easy Automated Model Selection with (Generalized) Linear Models. J. Stat. Softw. 2010. [Google Scholar] [CrossRef]
- Burnham, K.P.; Anderson, D.R. Multimodel Inference: Understanding AIC and BIC in Model Selection. Sociol. Methods Res. 2004, 33, 261–304. [Google Scholar] [CrossRef]
- Coughlin, S.S.; Trock, B.; Criqui, M.H.; Pickle, L.W.; Browner, D.; Tefft, M.C. The logistic modeling of sensitivity, specificity, and predictive value of a diagnostic test. J. Clin. Epidemiol. 1992, 45, 1–7. [Google Scholar] [CrossRef]
- Pearce, J.; Ferrier, S. Evaluating the predictive performance of habitat models developed using logistic regression. Ecol. Model. 2000, 133, 225–245. [Google Scholar] [CrossRef]
- Blacher, J.; Asmar, R.; Djane, S.; London, M.; Safar, M.E. Aortic Pulse Wave Velocity as a Marker of Cardiovascular Risk in Hypertensive Patients. Hypertension 1999, 33, 1111–1117. [Google Scholar] [CrossRef] [PubMed]
- Eberhart, L.H.J.; Geldner, G.; Kranke, P.; Morin, A.M.; Scha, A.; Treiber, H.; Wulf, H. The Development and Validation of a Risk Score to Predict the Probability of Postoperative Vomiting in Pediatric Patients. Anesth. Analg. 2004, 99, 1630–3167. [Google Scholar] [CrossRef] [PubMed]
- Barkhof, F.; Filippi, M.; Miller, D.H.; Scheltens, P.; Campi, A.; Polman, C.H.; Comi, G.; Adèr, H.J.; Losseff, N.; Valk, J. Comparison of MRI criteria at first presentation to predict conversion to clinically definite multiple sclerosis. Brain 1997, 120, 2059–2069. [Google Scholar] [CrossRef] [PubMed]
- Devanand, D.P.; Liu, X.; Tabert, M.H.; Pradhaban, G.; Cuasay, K.; Bell, K.; de Leon, M.J.; Doty, R.L.; Stern, Y.; Pelton, G.H. Combining Early Markers Strongly Predicts Conversion from Mild Cognitive Impairment to Alzheimer’s Disease. Biol. Psychiatry 2008, 64, 871–879. [Google Scholar] [CrossRef] [PubMed]
- Cherry, L.; McCray, J.; Mollendor, D.; Hogue, T.; Peterman, K.; Eisenstein, B. Predicting Parcel-Scale Redevelopment within the Berkeley Neighborhood in Denver Colorado Using Linear and Logistic Regression. Master’s Thesis, Colorado School of Mines, Golden, CO, USA, 2016. [Google Scholar]
- Panos, C.L.; Hogue, T.S.; Gilliom, R.L.; McCray, J.E. High-Resolution Modeling of Infill Development Impact on Stormwater Dynamics in Denver, Colorado. J. Sustain. Water Built Environ. 2018, 4. [Google Scholar] [CrossRef]
© 2019 by the authors. Licensee MDPI, Basel, Switzerland. This article is an open access article distributed under the terms and conditions of the Creative Commons Attribution (CC BY) license (http://creativecommons.org/licenses/by/4.0/).

 ,
, 


