Life Cycle Assessment of SEWGS Technology Applied to Integrated Steel Plants

 ,
,  ,
,  ,
,
Abstract
1. Introduction
2. Materials and Methods
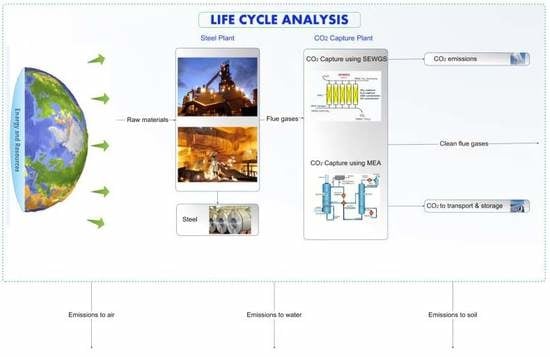
2.1. Case Description
2.2. Life Cycle Assessment (LCA)
2.2.1. Goal and Scope Definition
2.2.2. Life Cycle Inventory Analysis
2.2.3. Life Cycle Impact Assessment (LCIA)
3. Results
4. Discussion
5. Conclusions
- Base Case 1: Conventional steel plant with a high-efficiency steam turbine power plant and without CO2 capture
- Base Case 2: Conventional steel plant with a state-of-the-art GTCC power plant and without CO2 capture
- Reference Case: Integrated steel mill with state-of-the-art GTCC with monoethanolamine-based post-combustion CO2 capture
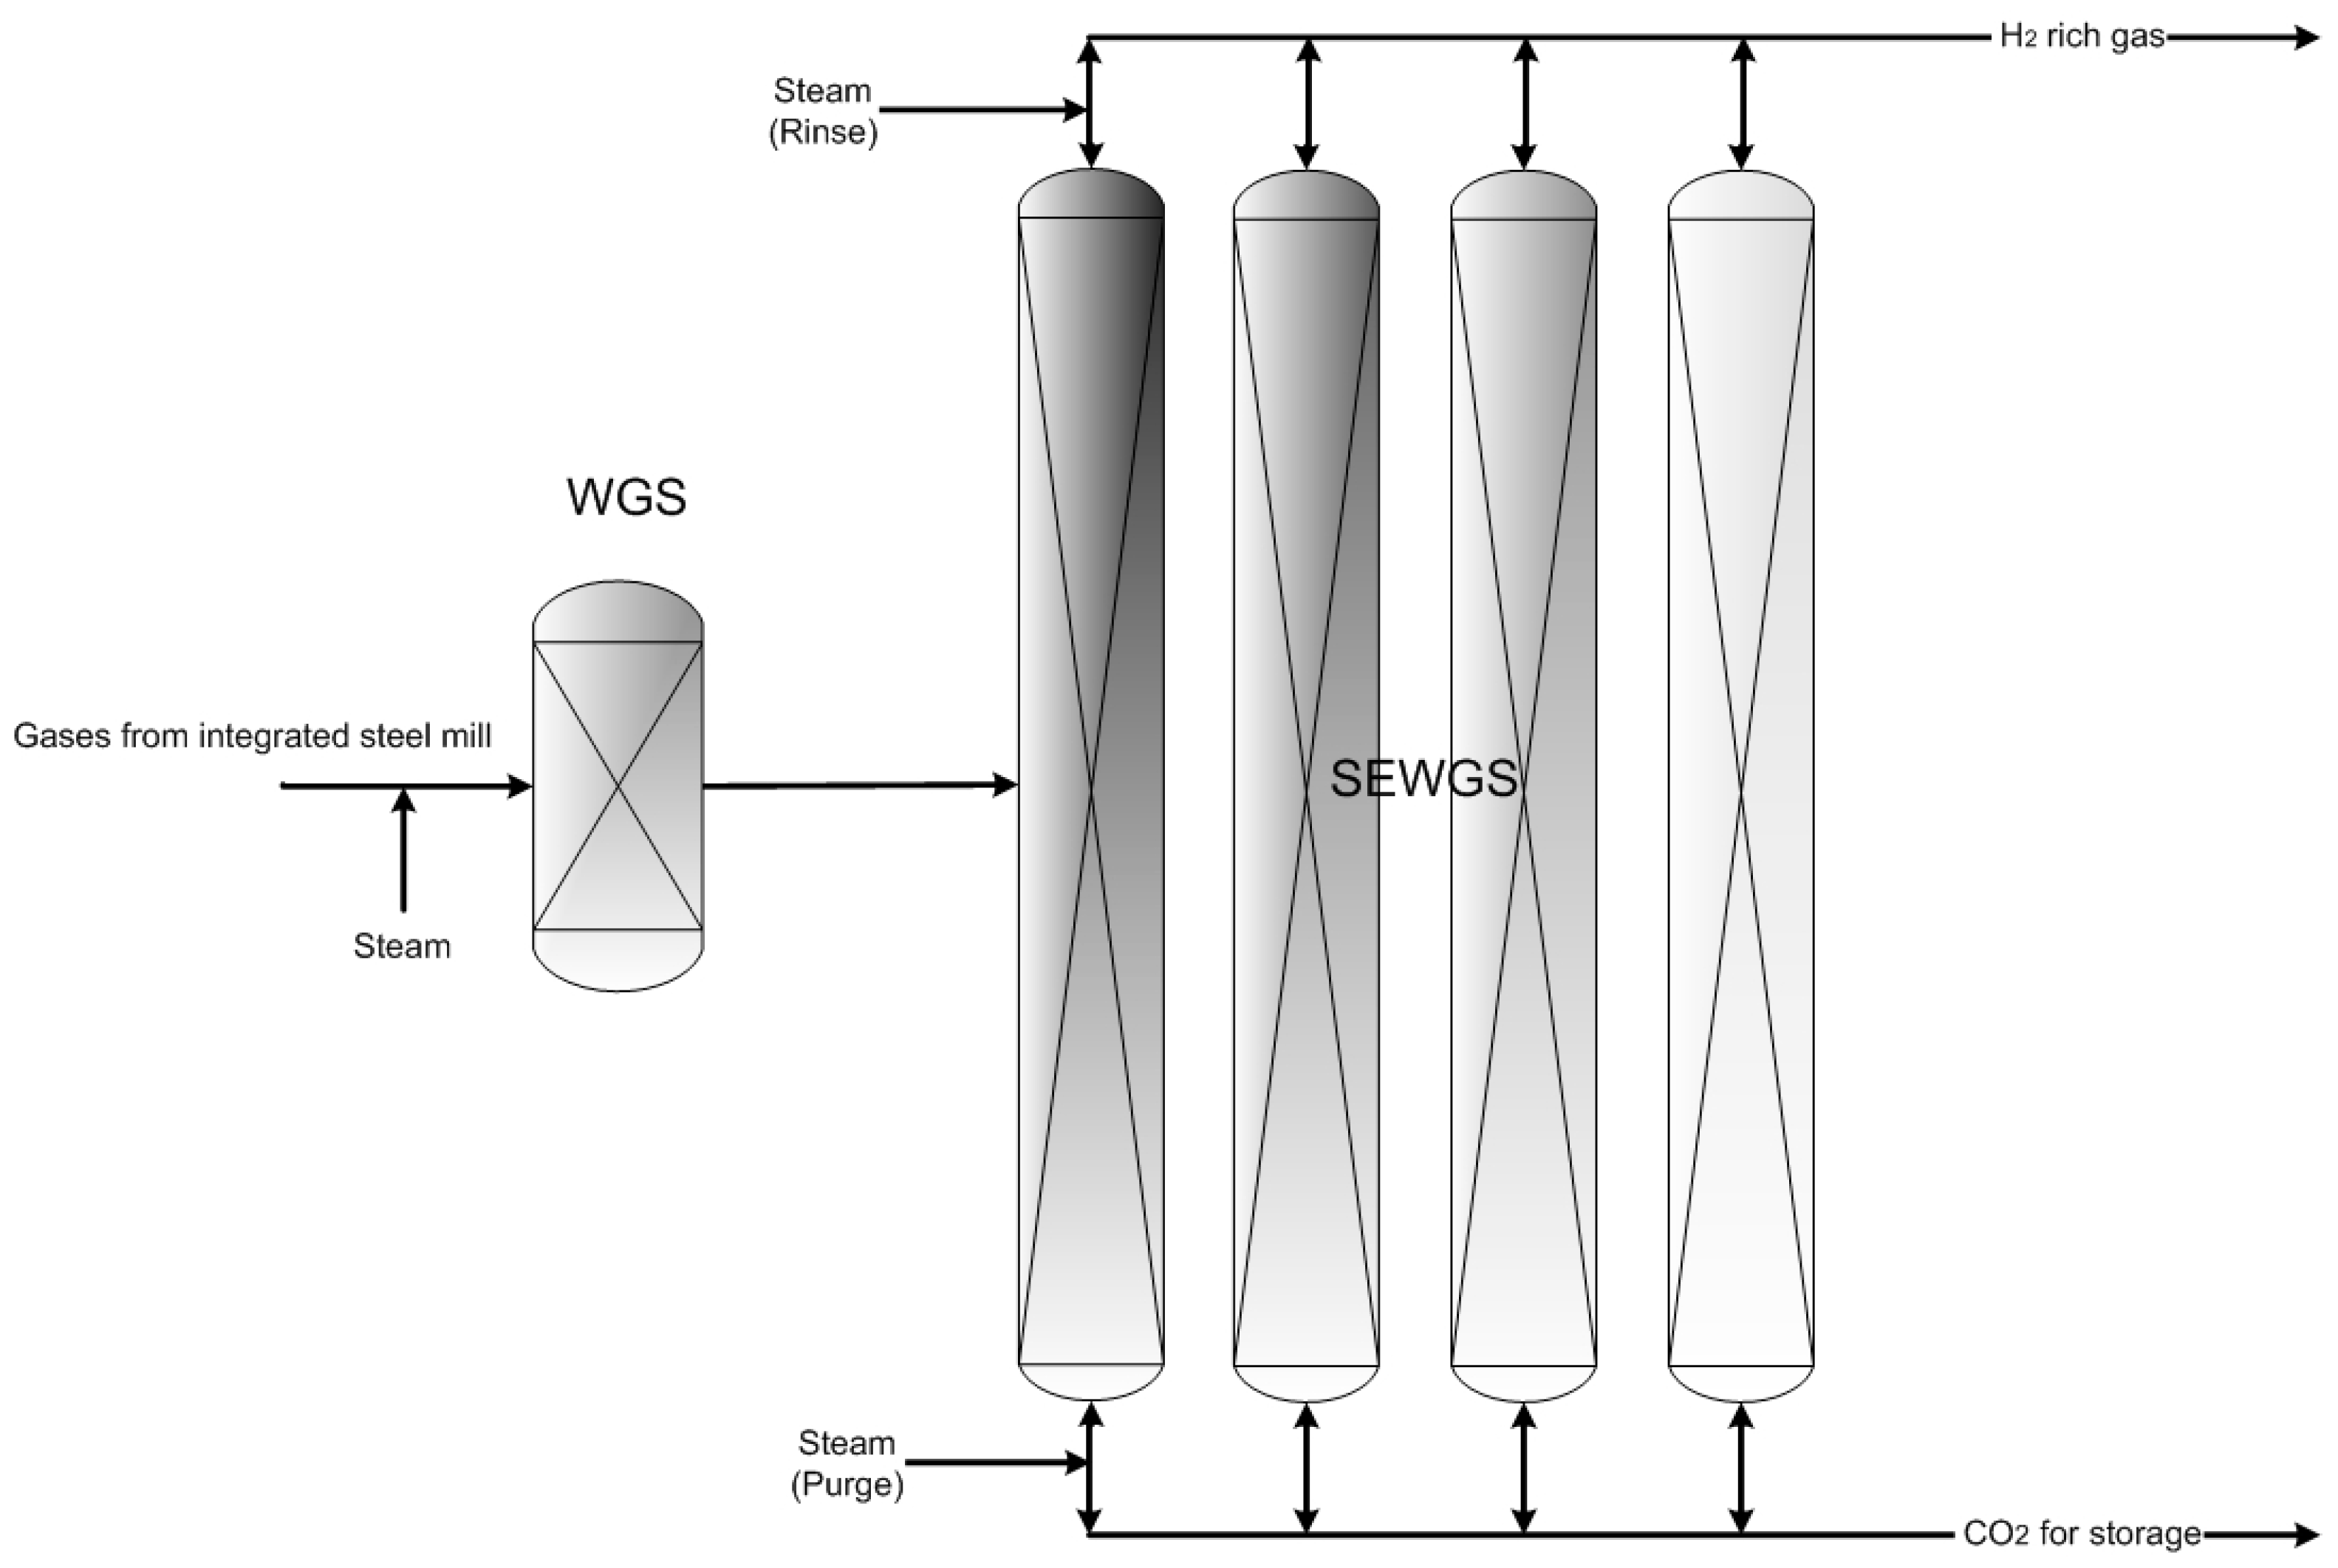
- SEWGS EXP: Integrated steel mill using SEWGS technology with expander for CO2 capture
- SEWGS SAT: Integrated steel mill using SEWGS technology with saturator for CO2 capture
Author Contributions
Funding
Conflicts of Interest
Abbreviations
| ADP | Abiotic Depletion Potential |
| AP | Acidification Potential |
| ASU | Air Separation Unit |
| BF | Blast Furnace |
| BFG | Blast Furnace Gas |
| BOF | Blast Oxygen Furnace |
| BOFG | Basic Oxygen Furnace Gas |
| CCR | Carbon Capture Rate |
| CCS | Carbon Capture and Storage |
| COG | Coke Oven Gas |
| CML | Institute of Environmental Science Leiden University |
| (i.e., Centrum voor Milieuwetenschappen Leiden) | |
| EAF | Electric Arc Furnace |
| EP | Eutrophication Potential |
| FAETP | Freshwater Aquatic Ecotoxicity Potential |
| GWP | Global Warming Potential |
| HRC | Hot Rolled Coil |
| HRSG | Heat Recovery Steam Generator |
| HTP | Human Toxicity Potential |
| IEAGHG | International Energy Agency Greenhouse Gas |
| ISO | International Organization and Standardization |
| LCA | Life Cycle Assessment |
| LCI | Life Cycle Inventory |
| MAETP | Marine Aquatic Ecotoxicity Potential |
| MEA | Monoethanolamine |
| ODP | Ozone Layer Depletion Potential |
| PCOP | Photochemical Ozone Creation Potential |
| PP | Power Plant |
| PSA | Pressure Swing Adsorption |
| PCI | Pulverized Coal Injection |
| SEWGS | Sorbent Enhanced Water Gas Shift |
| TETP | Terrestrial Ecotoxicity Potential |
| WGS | Water Gas Shift |
References
- Wang, L.K.; Shammas, N.K.; Hung, Y.-T. Waste Treatment in the Metal Manufacturing, Forming, Coating, and Finishing Industries; CRC Press: Boca Raton, FL, USA, 2016; ISBN 1420072242. [Google Scholar]
- IEA (International Energy Agency). Energy Technology Perspectives 2010 Scenarios and Strategies to 2050; IEA: Paris, France, 2010. [Google Scholar]
- Ramírez-Santos, Á.A.; Castel, C.; Favre, E. A review of gas separation technologies within emission reduction programs in the iron and steel sector: Current application and development perspectives. Sep. Purif. Technol. 2018, 194, 425–442. [Google Scholar] [CrossRef]
- Ho, M.T.; Bustamante, A.; Wiley, D.E. Comparison of CO2 capture economics for iron and steel mills. Int. J. Greenh. Gas Control 2013, 19, 145–159. [Google Scholar] [CrossRef]
- García, S.G.; Montequín, V.R.; Fernández, R.L.; Fernández, F.O. Evaluation of the synergies in cogeneration with steel waste gases based on Life Cycle Assessment: A combined coke oven and steelmaking gas case study. J. Clean. Prod. 2019, 217, 576–583. [Google Scholar] [CrossRef]
- IEAGHG Iron and Steel CCS Study (Techno-Economics Integrated Steel Mill); 2013/04; IEAGHG: Cheltenham, UK, 2013.
- Huang, Z.; Ding, X.; Sun, H.; Liu, S. Identification of main influencing factors of life cycle CO2 emissions from the integrated steelworks using sensitivity analysis. J. Clean. Prod. 2010, 18, 1052–1058. [Google Scholar] [CrossRef]
- WSA (World Steel Association). Steel’s Contribution to a Low Carbon Future and Climate Resilient Societies—Worldsteel Position Paper; WSA: Brussels, Belgium, 2017; ISBN 978-2-930069-83-8. [Google Scholar]
- IEA (International Energy Agency). Tracking Industrial Energy Efficiency and CO2 Emissions; IEA: Paris, France, 2007. [Google Scholar]
- Leeson, D.; Fennell, P.; Shah, N.; Petit, C.; Dowell, N. Mac A Techno-economic Analysis and Systematic Review of Carbon Capture and Storage (CCS) Applied to the Iron and Steel, Cement, Oil Refining and Pulp and Paper Industries. Energy Procedia 2017, 114, 6297–6302. [Google Scholar] [CrossRef]
- Xu, K.D. Low carbon economy and iron and steel industry. Iron Steel 2010, 45, 1–12. [Google Scholar]
- Bo, C.; Yang, J.; Ouyang, Z. Life cycle assessment of internal recycling options of steel slag in Chinese iron and steel industry. J. Iron Steel Res. Int. 2011, 18, 33–40. [Google Scholar]
- Manso, M.; Castro-Gomes, J.; Paulo, B.; Bentes, I.; Teixeira, C.A. Life cycle analysis of a new modular greening system. Sci. Total Environ. 2018, 627, 1146–1153. [Google Scholar] [CrossRef] [PubMed]
- Ortiz, O.; Castells, F.; Sonnemann, G. Sustainability in the construction industry: A review of recent developments based on LCA. Constr. Build. Mater. 2009, 23, 28–39. [Google Scholar] [CrossRef]
- Teixeira, C.A.; Russo, M.; Matos, C.; Bentes, I. Evaluation of operational, economic, and environmental performance of mixed and selective collection of municipal solid waste: Porto case study. Waste Manag. Res. 2014, 32, 1210–1218. [Google Scholar] [CrossRef] [PubMed]
- Wolf, M.-A.; Chomkhamsri, K.; Brandao, M.; Pant, R.; Ardente, F.; Pennington, D.W.; Manfredi, S.; de Camillis, C.; Goralczyk, M. ILCD Handbook—General Guide for Life Cycle Assessment—Detailed Guidance; European Commission—Joint Research Center—Institute for Environment and Sustainability: Ispra, Italy, 2010. [Google Scholar]
- Gazzani, M.; Romano, M.; Manzolini, G. Application of Sorption Enhanced Water Gas Shift for Carbon Capture in Integrated Steelworks. Energy Procedia 2013, 37, 7125–7133. [Google Scholar] [CrossRef]
- Gazzani, M.; Romano, M.C.; Manzolini, G. CO2 capture in integrated steelworks by commercial-ready technologies and SEWGS process. Int. J. Greenh. Gas Control 2015, 41, 249–267. [Google Scholar] [CrossRef]
- Burchart-Korol, D. Life cycle assessment of steel production in Poland: A case study. J. Clean. Prod. 2013, 54, 235–243. [Google Scholar] [CrossRef]
- Olmez, G.M.; Dilek, F.B.; Karanfil, T.; Yetis, U. The environmental impacts of iron and steel industry: A life cycle assessment study. J. Clean. Prod. 2016, 130, 195–201. [Google Scholar] [CrossRef]
- World Steel Association. Life Cycle Assessment Methodology Report; World Steel Association: Brussels, Belgium, 2011; ISBN 978-2-930069-66-1. [Google Scholar]
- Chisalita, D.-A.; Petrescu, L.; Cobden, P.; van Dijk, H.E.; Cormos, A.-M.; Cormos, C.-C. Assessing the environmental impact of an integrated steel mill with post-combustion CO2 capture and storage using the LCA methodology. J. Clean. Prod. 2019, 211, 1015–1025. [Google Scholar] [CrossRef]
- Boon, J.; Cobden, P.D.; van Dijk, H.A.J.; van Sint Annaland, M. High-temperature pressure swing adsorption cycle design for sorption-enhanced water–gas shift. Chem. Eng. Sci. 2015, 122, 219–231. [Google Scholar] [CrossRef]
- Gazzani, M.; Macchi, E.; Manzolini, G. CO2 capture in integrated gasification combined cycle with SEWGS—Part A: Thermodynamic performances. Fuel 2013, 105, 206–219. [Google Scholar] [CrossRef]
- The International Standards Organization. Environmental Management—Life Cycle Assessment—Principles and Framework; The International Standards Organization: Geneva, Switzerland, 2006; Volume 2006. [Google Scholar]
- PE International GaBi thinkstep. Available online: https://www.thinkstep.com/ (accessed on 25 February 2019).
- Curran, M.A. (Ed.) Life Cycle Assessment Handbook: A Guide for Environmentally Sustainable Products; John Wiley & Sons: Hoboken, NJ, USA, 2012. [Google Scholar]


| Case Name | Case Description |
|---|---|
| Base Case 1 | Conventional steel plant with a high-efficiency steam turbine power plant and without CO2 capture |
| Base Case 2 | Conventional steel plant with state-of-the-art gas turbine combined cycle (GTCC) power plant without CO2 capture |
| Reference Case | Integrated steel mill with state-of-the-art gas turbine combined cycle (GTCC) with monoethanolamine-based post-combustion CO2 capture |
| SEWGS EXP | Integrated steel mill using SEWGS technology with an expander for CO2 capture |
| SEWGS SAT | Integrated steel mill using SEWGS technology with saturator for CO2 capture |
| Process | Inputs | All Cases | Units | Outputs | All Cases | Units |
|---|---|---|---|---|---|---|
| Raw materials handling | Coke | 366.73 | kg/tHRC | BF | 23.45 | kg/tHRC |
| Iron ore 65% | 130.83 | kg/tHRC | Raw materials to BF | 1965.81 | kg/tHRC | |
| Limestone | 13.26 | kg/tHRC | ||||
| Quartzite | 10.89 | kg/tHRC | ||||
| Sinter | 1111.39 | kg/tHRC | ||||
| Pellet | 356.17 | kg/tHRC | ||||
| Coal preparation | COG | 0.59 | kg/tHRC | Metallurgical coal dried | 152.34 | kg/tHRC |
| Air | 0.50 | kg/tHRC | CO2 emissions | 0.98 | kg/tHRC | |
| Metallurgical coal | 163.93 | kg/tHRC | Water vapour | 11.61 | kg/tHRC | |
| Blast furnace | Metallurgical coal dried | 152.34 | kg/tHRC | Hot metal | 992.19 | kg/tHRC |
| Raw materials to BF | 1965.81 | kg/tHRC | BFG | 2181.13 | kg/tHRC | |
| Nitrogen | 963.15 | kg/tHRC | BF slag | 315.69 | kg/tHRC | |
| Nitrogen | 6.20 | kg/tHRC | ||||
| Oxygen | 359.52 | kg/tHRC | ||||
| Water | 0.87 | kg/tHRC | ||||
| Compressed air | 43.8 | Nm3/tHRC | ||||
| Electricity | 370.33 | MJ/tHRC | ||||
| Hot stoves | Air from compression plant | 455.18 | kg/tHRC | CO2 (to air for the case without capture; to CCS for the CCS cases) | 414.67 | kg/tHRC |
| Air | 1265.19 | kg/tHRC | Nitrogen | 963.15 | kg/tHRC | |
| Clean BFG | 639.42 | kg/tHRC | Nitrogen to air | 633.26 | kg/tHRC | |
| COG | 3.08 | kg/tHRC | Oxygen | 359.52 | kg/tHRC | |
| Oxygen | 67.86 | kg/tHRC | Oxygen to air | 8.84 | kg/tHRC | |
| Steam | 7.89 | kg/tHRC | Water vapor | 39.64 | kg/tHRC | |
| Water vapor to air | 16.68 | kg/tHRC | ||||
| BF gas cleaning | BFG | 2181.13 | kg/tHRC | Clean BFG (to coke plant, power plant, hot stoves) | 2140.67 | kg/tHRC |
| Freshwater | 5.19 | kg/tHRC | BFG to flare | 30.56 | kg/tHRC | |
| BFG dust | 14.88 | kg/tHRC | ||||
| Sludge | 4.41 | kg/tHRC | ||||
| BF flare | BFG to flare | 30.56 | kg/tHRC | CO2 emissions | 19.72 | kg/tHRC |
| Air | 19.95 | N2 emissions | 29.54 | kg/tHRC | ||
| Water emissions | 1.23 | kg/tHRC |
| Process | Inputs | All Cases | Units | Outputs | All Cases | Units |
|---|---|---|---|---|---|---|
| BOF unit | Iron ore | 5.50 | kg/tHRC | BOF gas | 142.97 | kg/tHRC |
| Argon | 0.84 | kg/tHRC | BOF slag | 123.46 | kg/tHRC | |
| Hot metal | 973.56 | kg/tHRC | Crude steel | 1080.83 | kg/tHRC | |
| Dolomite | 11.91 | kg/tHRC | ||||
| Lime | 70.06 | kg/tHRC | ||||
| Nitrogen | 0.41 | kg/tHRC | ||||
| Oxygen | 79.63 | kg/tHRC | ||||
| Internal scarp | 78.98 | kg/tHRC | ||||
| Steel scrap (purchased) | 126.37 | kg/tHRC | ||||
| Electricity | 77.82 | MJ/tHRC | ||||
| BOF gas recovery unit | BOF gas | 142.97 | kg/tHRC | BOF gas | 142.97 | kg/tHRC |
| Boiler feed water | 76.32 | kg/tHRC | Steam to coke production | 61.14 | kg/tHRC | |
| Steam to iron making | 7.89 | kg/tHRC | ||||
| Steam to ASU | 7.28 | kg/tHRC | ||||
| BOF cleaning unit | BOF gas | 142.97 | kg/tHRC | BOF gas | 157.49 | kg/tHRC |
| Electricity | 77.82 | MJ/tHRC | BOF sludge | 42.29 | kg/tHRC | |
| Water | 56.82 | kg/tHRC | ||||
| Gas holder unit | BOF gas | 157.49 | kg/tHRC | BOF to power plant | 112.04 | kg/tHRC |
| BOF waste to flare | 45.45 | kg/tHRC | ||||
| BOF to flare | BOF waste to flare | 45.45 | kg/tHRC | CO2 emissions | 50.25 | kg/tHRC |
| Air | 72.62 | kg/tHRC | Nitrogen emissions | 63.57 | kg/tHRC | |
| Water vapor | 4.27 | kg/tHRC | ||||
| Slag processing unit | Slag | 123.46 | kg/tHRC | Slag waste on landfill | 32.10 | kg/tHRC |
| Slag to sinter | 34.57 | kg/tHRC | ||||
| Sag to sale | 56.79 | kg/tHRC |
| Inputs | Units | Evaluated Cases | |||||
|---|---|---|---|---|---|---|---|
| Base Case 1 | Base Case 2 | Reference Case a | SEWGS EXP b | SEWGS SAT b | |||
| Electricity | MJ/tHRC | 59.92 | 235.73 | 400.11 | 867.47 | 754.50 | |
| Air | kg/tHRC | 1285.09 | 2070.69 | 2238.58 | 2445.24 | 2243.23 | |
| Steam to PP | kg/tHRC | 4.73 | 4.73 | 4.73 | |||
| COG | CO2 | kg/tHRC | 0.09 | 0.09 | 0.09 | 0.09 | 0.09 |
| CO | kg/tHRC | 0.23 | 0.23 | 0.23 | 0.23 | 0.23 | |
| C2H6 | kg/tHRC | 0.17 | 0.17 | 0.17 | 0.17 | 0.17 | |
| H2 | kg/tHRC | 0.26 | 0.26 | 0.26 | 0.26 | 0.26 | |
| CH4 | kg/tHRC | 0.79 | 0.79 | 0.79 | 0.79 | 0.79 | |
| N2 | kg/tHRC | 0.35 | 0.35 | 0.35 | 0.35 | 0.35 | |
| O2 | kg/tHRC | 0.01 | 0.01 | 0.01 | 0.01 | 0.01 | |
| H2O | kg/tHRC | 0.15 | 0.15 | 0.15 | 0.15 | 0.15 | |
| BFG | CO2 | kg/tHRC | 401.77 | 401.77 | 401.77 | 401.77 | 401.77 |
| CO | kg/tHRC | 258.48 | 258.48 | 258.48 | 258.48 | 258.48 | |
| H2 | kg/tHRC | 3.02 | 3.02 | 3.02 | 3.02 | 3.02 | |
| N2 | kg/tHRC | 564.40 | 564.40 | 564.40 | 564.40 | 564.40 | |
| H2O | kg/tHRC | 23.44 | 23.44 | 23.44 | 23.44 | 23.44 | |
| BOFG | CO2 | kg/tHRC | 25.02 | 25.02 | 25.02 | 25.02 | 25.02 |
| CO | kg/tHRC | 62.77 | 62.77 | 62.77 | 62.77 | 62.77 | |
| H2 | kg/tHRC | 0.21 | 0.21 | 0.21 | 0.21 | 0.21 | |
| N2 | kg/tHRC | 15.25 | 15.25 | 15.25 | 15.25 | 15.25 | |
| H2O | kg/tHRC | 8.62 | 8.62 | 8.62 | 8.62 | 8.62 | |
| Outputs | |||||||
| Electricity | MJ/tHRC | 1500.33 | 2074.36 | 1774.22 | 1922.87 | 1822.96 | |
| Process Water | kg/tHRC | 4.38 | 4.38 | - | |||
| Emissions to air | Ar | kg/tHRC | 16.38 | 28.55 | 14.23 | 31.19 | 29.40 |
| CO2 | kg/tHRC | 936.81 | 937.31 | 468.69 | 73.62 | 69.41 | |
| N2 | kg/tHRC | 1544.94 | 2260.71 | 1130.43 | 2342.68 | 2208.82 | |
| O2 | kg/tHRC | 79.92 | 299.24 | 149.58 | 360.31 | 339.72 | |
| H2O | kg/tHRC | 71.76 | 50.54 | 25.25 | 255.14 | 240.56 | |
| Gas to capture unit a/Transport and storage b | Ar | kg/tHRC | - | - | 14.23 | ||
| CO2 | kg/tHRC | - | - | 468.69 | 833.12 | 833.12 | |
| N2 | kg/tHRC | - | - | 1130.43 | 18.662 | 18.66 | |
| O2 | kg/tHRC | - | - | 149.58 | |||
| H2O | kg/tHRC | - | - | 25.25 | |||
| Units | Evaluated Cases | |||
|---|---|---|---|---|
| Inputs | Reference Case | SEWGS EXP | SEWGS SAT | |
| CO2 captured | kg/tHRC | 423.14 | 833.12 | 833.12 |
| Electricity for compressors | kWh/tHRC | 0.59 | 1.16 | 1.16 |
| Electricity for injection | kWh/tHRC | 2.96 | 5.83 | 5.83 |
| Outputs | ||||
| CO2 stored | kg/tHRC | 422.08 | 831.70 | 831.70 |
| CO2 losses pipeline | kg/tHRC | 0.09 | 0.17 | 0.17 |
| CO2 losses compressors | kg/tHRC | 0.21 | 0.42 | 0.42 |
| CO2 losses injection | kg/tHRC | 0.42 | 0.83 | 0.83 |
| KPI | Units | Base Case 1 | Base Case 2 | Reference Case | SEWGS EXP | SEWGS SAT |
|---|---|---|---|---|---|---|
| GWP | kg CO2 equivalents/tHRC | 2093.62 | 2045.90 | 1863.29 | 1252.64 | 1248.44 |
| AP | kg SO2 equivalents/tHRC | 0.16 | 0.16 | 11.14 | 0.21 | 0.21 |
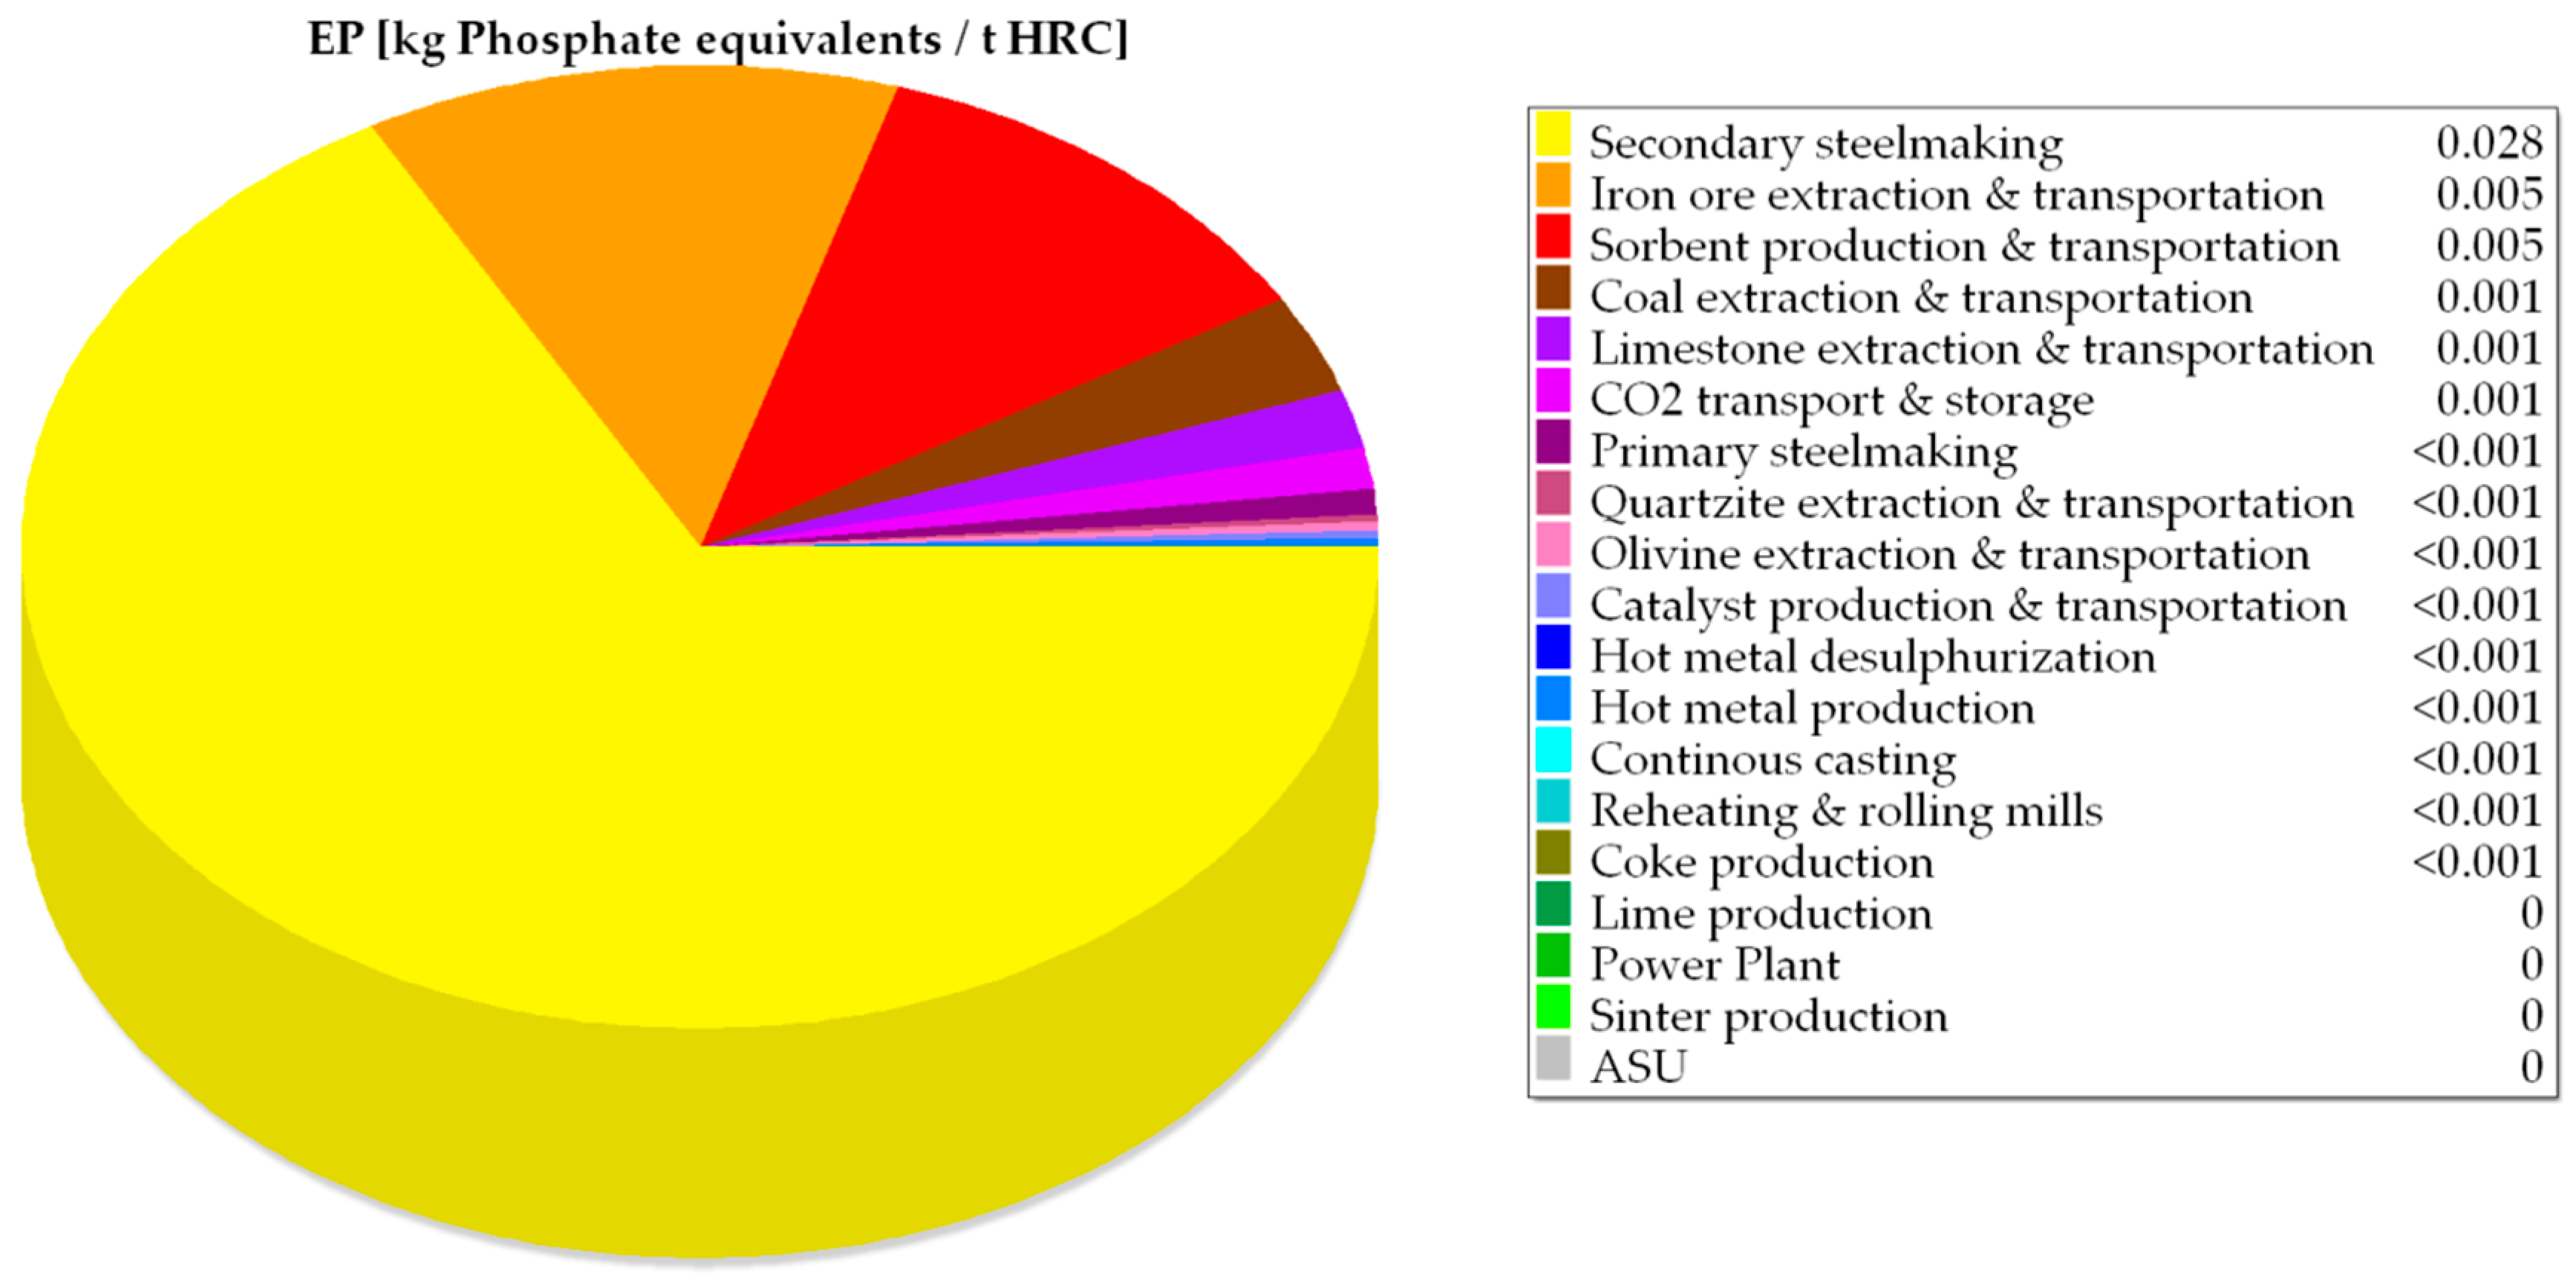
| EP × 102 | kg PO43− equivalents/tHRC | 4.13 | 4.13 | 237.00 | 4.85 | 4.85 |
| ODP × 1010 | kg R11 equivalents/tHRC | 14.38 | 14.38 | 15.82 | 14.11 | 14.11 |
| ADPfossil | MJ/tHRC | 4580.24 | 4580.24 | 6484.70 | 4911.53 | 4911.53 |
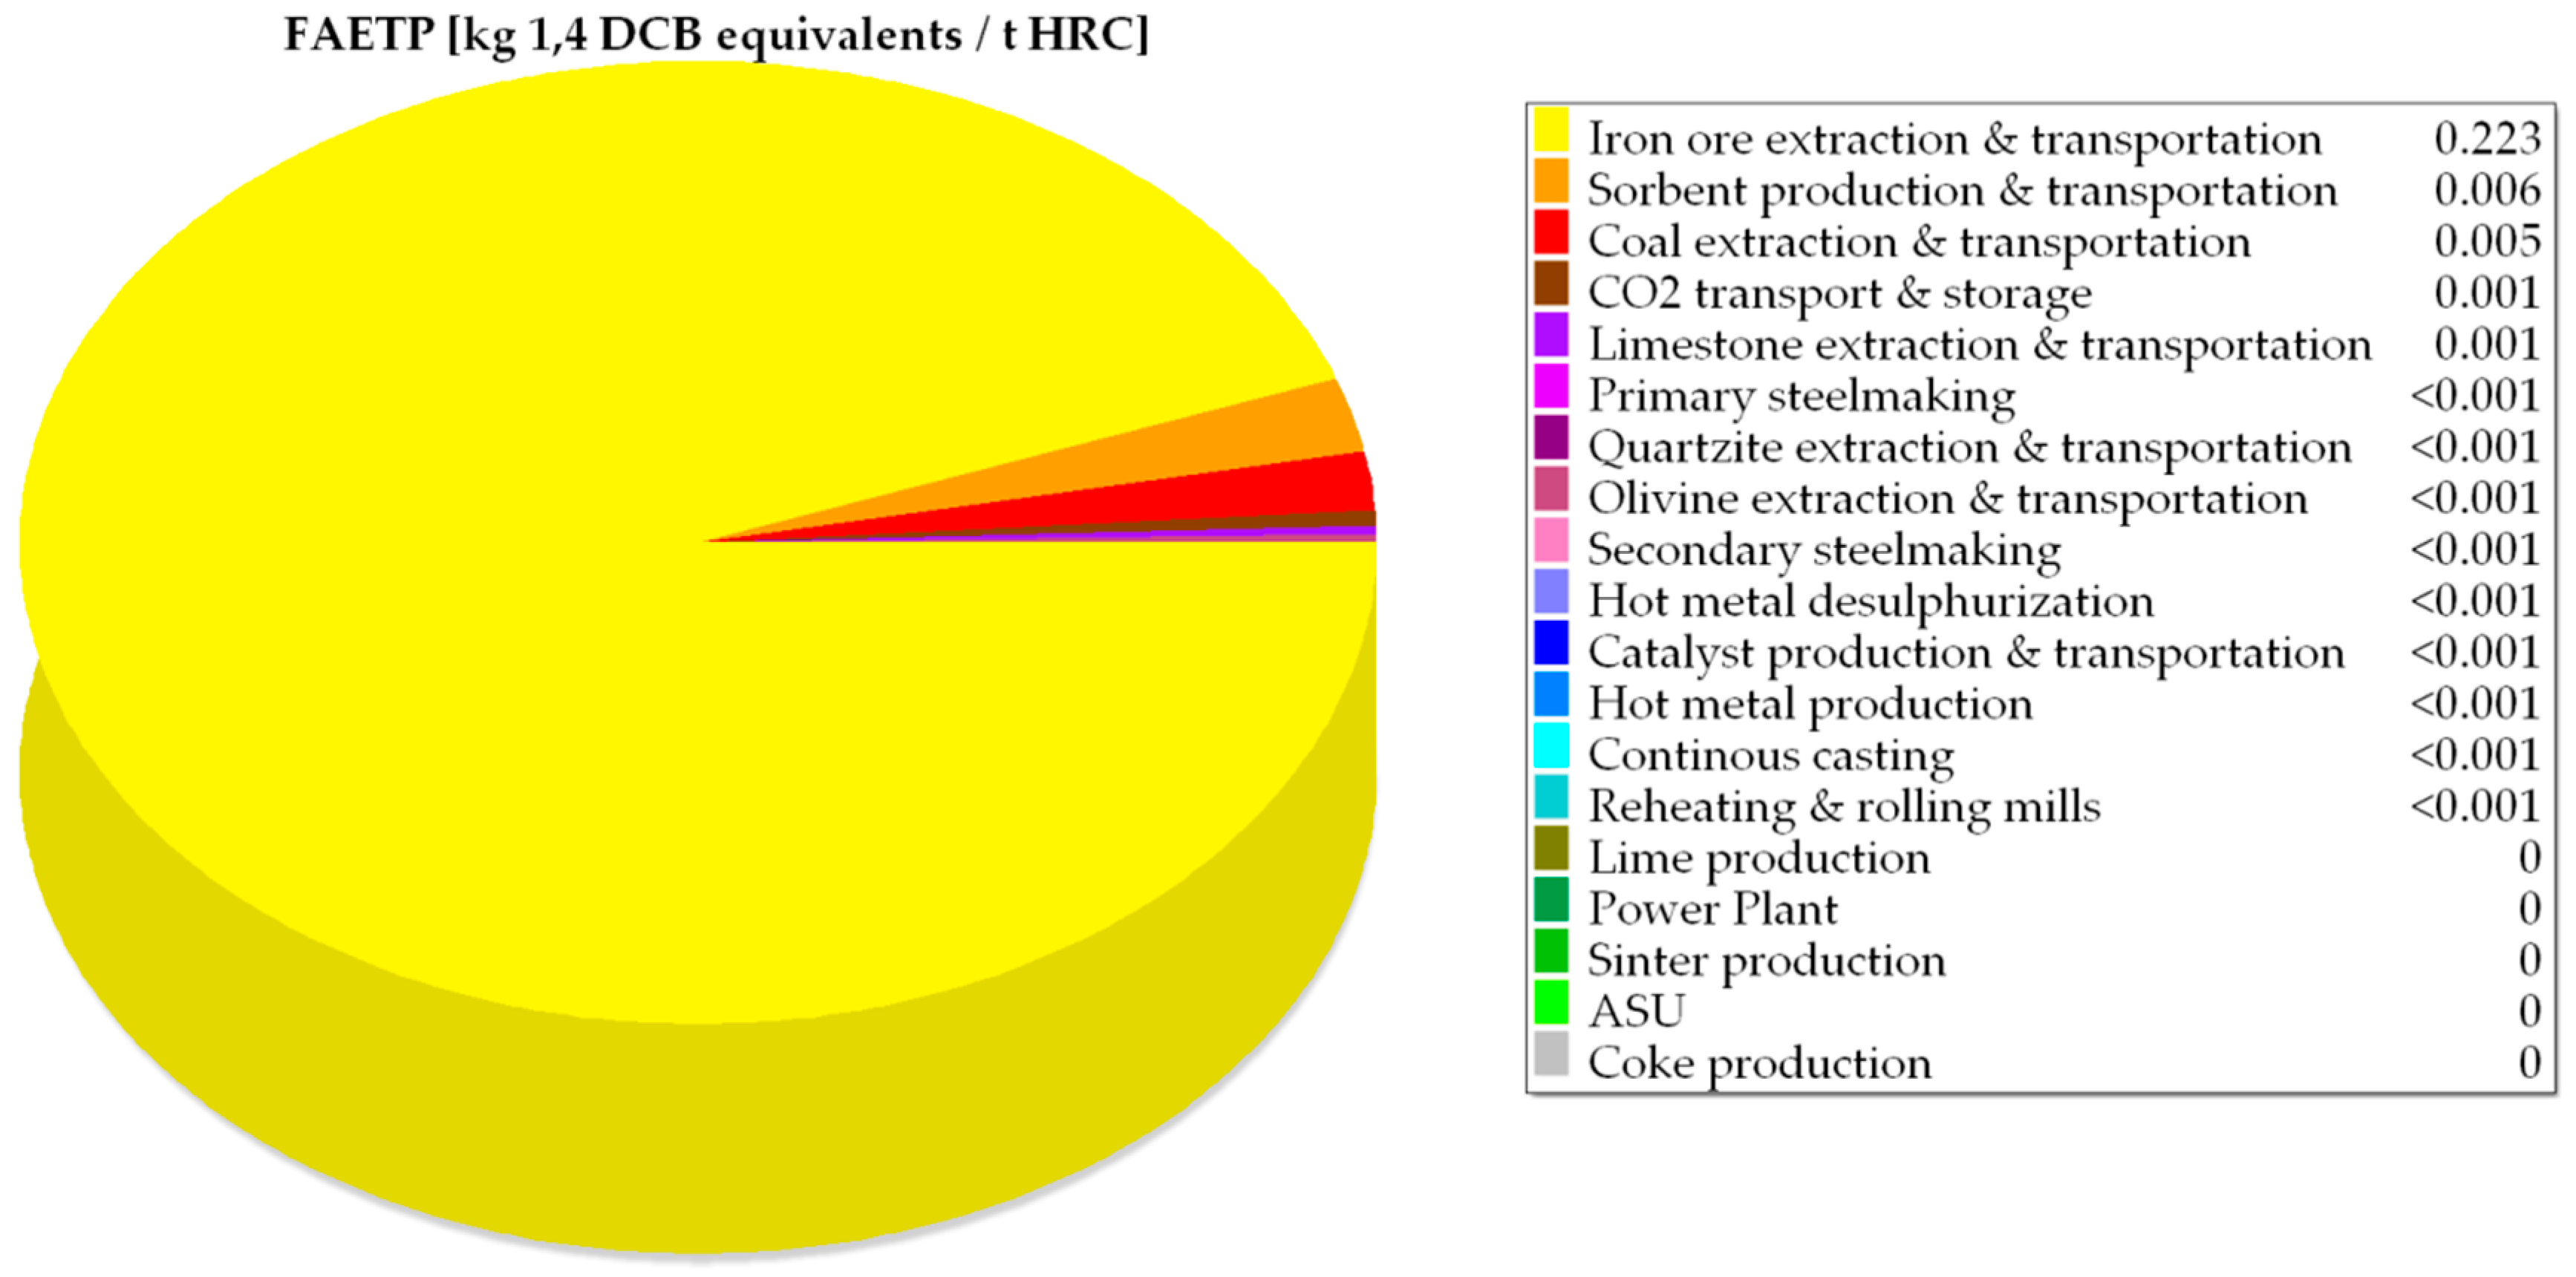
| FAETP × 102 | kg 1,4 DCB equivalents/tHRC | 29.00 | 29.00 | 73.20 | 32.40 | 32.40 |
| HTP | kg 1,4 DCB equivalents/tHRC | 4.43 | 4.43 | 796.60 | 5.52 | 5.52 |
| PCOP × 102 | kg ethylene equivalents/tHRC | 0.92 | 0.92 | 14.80 | 1.27 | 1.27 |
| TEP × 101 | kg 1,4 DCB equivalents/tHRC | 1.29 | 1.29 | 1.6 | 1.44 | 1.44 |
| MAETP | kg 1,4 DCB equivalents/tHRC | 4849.33 | 4849.33 | 10981.91 | 8378.42 | 8378.42 |
| Source of CO2 Emissions | Literature Emissions (kg CO2 eq./tHRC) [6] | LCA Results (kg CO2 eq./tHRC) |
|---|---|---|
| Coke oven (flue gases and flare) | 194.67 | 194.25 |
| Sinter plant (flue gases) | 289.46 | 292.52 |
| Hot stoves (flue gases) | 415.19 | 414.64 |
| Hot metal desulfurization and ancillaries | 7.76 | 5.36 |
| Blast furnace (flare) | 19.73 | 19.72 |
| Blast oxygen furnace (BOF) | 51.02 | 52.35 |
| Continuous casting (diffuse emissions) | 0.80 | 0.80 |
| Reheating furnaces (flue gases) | 57.71 | 57.69 |
| Hot rolling mills (diffuse emissions) | 0.04 | 0.04 |
| Lime plant (flue gases) | 71.62 | 71.53 |
| Power plant (flue gases) | 982.13 | 981.06 |
| TOTAL EMISSIONS | 2090.13 | 2089.96 |
© 2019 by the authors. Licensee MDPI, Basel, Switzerland. This article is an open access article distributed under the terms and conditions of the Creative Commons Attribution (CC BY) license (http://creativecommons.org/licenses/by/4.0/).
Share and Cite
Petrescu, L.; Chisalita, D.-A.; Cormos, C.-C.; Manzolini, G.; Cobden, P.; van Dijk, H.A.J. Life Cycle Assessment of SEWGS Technology Applied to Integrated Steel Plants. Sustainability 2019, 11, 1825. https://doi.org/10.3390/su11071825
Petrescu L, Chisalita D-A, Cormos C-C, Manzolini G, Cobden P, van Dijk HAJ. Life Cycle Assessment of SEWGS Technology Applied to Integrated Steel Plants. Sustainability. 2019; 11(7):1825. https://doi.org/10.3390/su11071825
Chicago/Turabian StylePetrescu, Letitia, Dora-Andreea Chisalita, Calin-Cristian Cormos, Giampaolo Manzolini, Paul Cobden, and H. A. J. van Dijk. 2019. "Life Cycle Assessment of SEWGS Technology Applied to Integrated Steel Plants" Sustainability 11, no. 7: 1825. https://doi.org/10.3390/su11071825
APA StylePetrescu, L., Chisalita, D.-A., Cormos, C.-C., Manzolini, G., Cobden, P., & van Dijk, H. A. J. (2019). Life Cycle Assessment of SEWGS Technology Applied to Integrated Steel Plants. Sustainability, 11(7), 1825. https://doi.org/10.3390/su11071825