Article

The Key Role of Variety and Method of Sowing Selection in Pea Roots’ Parameters Development under Sustainable Practice

1
Institute of Plant Production, University of Agriculture in Kraków, 31-120 Kraków, Poland
2
Institute of Machinery Exploitation, Ergonomics and Production Processes, University of Agriculture in Krakow, 31-149 Krakow, Poland
3
Department of Mathematical Statistics, University of Agriculture in Kraków, 31-120 Kraków, Poland
*
Author to whom correspondence should be addressed.
Sustainability 2019, 11(7), 1824; https://doi.org/10.3390/su11071824
Submission received: 9 January 2019 / Revised: 15 March 2019 / Accepted: 19 March 2019 / Published: 27 March 2019

Abstract

:
The selection of varieties is extremely important for decreasing fertilizer consumption. However, little attention is devoted to assessing the effectiveness of row spacing in tandem with types of varieties of pea on root development in the context of limited nutrition. As essential knowledge in this area is lacking, a study was conducted with two objectives using an ordinal regression model. (i): To determine whether qualitative variables (cultivar, fertilization, and row spacing) or quantitative variables (root parameters) affect the root dry mass density, and (ii): To assess the variation in root architecture of two pea cultivars (fodder vs. edible type) grown under different P supply levels (0, 45, and 90 kg P2O5) and row spacing (narrow—15 cm—and wide—30 cm). The ordinal regression model showed that row spacing and cultivar type are meaningful predictors of root dry mass density (RDMD). The root dry mass density increased at wider row spacing in the fodder pea cultivar. As root surface area density (RSAD) and SRL-specific root length (SRL) most accurately describe root mass, it was concluded that the cultivar type and row spacing are crucial factors for increasing root plasticity, which can improve soil utilization.

1. Introduction

Phosphorus is an essential mineral nutrient for plant growth and development. Low phosphorus availability is one of the major constraints on crop production worldwide [1]. Therefore, the development of P-efficient crop varieties that demonstrate better growth under low soil P availability is crucial to improving crop production [2,3]. Various physiological and biochemical traits factor into the enhancement of crop P efficiency. The most important traits for P acquisition are morphological and architectural root characteristics [4]. Phosphorus is unevenly distributed along the soil profile. Phosphorus availability usually declines substantially with depth in agricultural soils due to the application of fertilizer and cultivation of the topsoil, as well as the inherently poor mobility of P in the soil profile [5]. The root architecture determines the extent of root exploration through the soil profile [6]. Root architectural parameters, such as growth angle and the number of root axes and lateral branches, are closely linked to P efficiency in common bean and wheat [6,7]. Genotypic variation in root architecture significantly affects P acquisition and grain yield of barley in low-P soils [8,9]. In rice, a threefold increase in plant growth was attributed to a 22% increase in root fineness under P deficiency [10]. This demonstrates that large genotypic differences in P acquisition could be caused by fairly small changes in root growth-related traits [10]. Manschadi et al. [6] suggest that selecting for the growth angle and number of root axes may help to identify genotypes with root system architecture that are better adapted to nutrient-deficient conditions.
The advantages of architectural root traits must be interpreted in the context of the environment and management systems in which the crops are grown. The characterization of the crop-growing environment is an important step in evaluating the implications of desirable root traits for improving nutrient acquisition and crop productivity [6]. Soil resource availability affects root growth and belowground resource competition between neighboring plants. Interactions may occur among the roots of an individual plant (interplant or self-competition) or between the roots of different plants (interplant or non-self-competition) [11]. Variation in crop row spacing can strongly affect interplant competition for both aboveground and belowground resources, with wider rows commonly providing individual plants with a larger soil volume and, hence, increased access to mineral nutrients and water. Most studies addressing the effects of interplant reactions focus on root biomass but overlook root architecture. There is much physiological evidence indicating a response of root architecture to P availability [12]. Various root architectural traits increase P acquisition by enhancing topsoil foraging [13] and patch exploitation [14]. These include the basal root growth angle [15,16], production of shoot-borne roots [17], increased axial elongation [18], and reduced lateral branching in low-P domains [19]. Competition for P may elicit changes in the root architecture [20]. Lynch [21] draws attention to the fact that the changes in root architecture induced by low P availability might be interpreted as precision foraging. Such precision foraging by roots could lead to root avoidance, as roots preferentially avoid regions where soil nutrients have been depleted by other roots. This creates a potential tendency towards reduced resource competition among neighboring roots. Nord et al. [22] found that common beans alter their root architecture in the presence of neighboring plants as a result of localized phosphorus depletion.
Due to differences in the growth environment between the greenhouse and the field conditions, cultivars may vary greatly in response to a low P supply, and P efficiency may differ among cultivars. Assessment of selected genotypes in terms of root characteristics which increase uptake of nutrients from varying soil depths under field conditions is essential to food security and the long-term sustainability of soil fertility [4]. Yang et al. [23] sought out morphological root traits indicative of phosphorus deficiency, preliminarily defined root length, root surface area, and root volume as screening indices for low-P tolerant genotypes of maize during the seedling stage. Miguel et al. [24] suggest that (a) a genotype of common bean (Phaseolus vulgaris) can exhibit one or more root traits responsible for P uptake efficiency, and (b) long root hairs increase total P uptake by releasing organic compounds (root exudates) that could help to solubilize P. Special attention should be given to screening plant genotypes which are tolerant to low-P soils under field conditions [23]. Previous studies on differences in root architecture under phosphorus limitation in legumes have focused on the common bean and soybean, which are widespread around the world, while less attention has been given to pea cultivars, which have an important role in Europe.
The aim of this study was to assess (i): Whether qualitative variables (cultivar, fertilization, and row spacing) or quantitative variables (RSAD, RLD, MRD, and SRL) more strongly affect diversification of root dry mass density; and (ii): Variation in the root architecture of two pea cultivars grown under different levels of P supply and row spacing.

2. Materials and Methods Materials and Methods

2.1. Site Description, Experimental Design, and Sampling

A three-factor field experiment was carried out in two seasons in the years 2015 and 2016 in Włoszczowa (50°46 N, 19°50′13 E). The experiment was conducted on sandy soil (960 g·kg−1 sand, 40 g·kg−1 silt). The soil was characterized by a low abundance of nutrients. Phosphorus content per 100 grams soil was determined to be 6.8 mg 100 g−1, potassium 6.0 mg 100 g−1, and magnesium 0.9 g 100 g−1. The soil was acidic, with pHKCl = 3.94. The organic carbon content was 6.3 g C·kg−1.
Treatments included two row-spacing variants (15 cm and 30 cm), three P levels (0, 45 and 90 kg P2O5), and two pea genotypes (edible cv. ‘Tarchalska’ and fodder cv. ‘Protecta’). Plants were cultivated in optimal density (100 pcs·m−2). The experiment was set up as a randomized block design with four replications. The plot size was 10 m2. Before sowing, 30 kg ha−1 of nitrogen and 100 kg ha−1 of potassium were applied to each plot. Phosphate fertilizer was applied in the second decade of March each year. The phosphorus concentration in fertilizer was 40%. Seeds were sown at a depth of 5–6 cm with row spacing of 15 cm and at double row spacing (30 cm).
The root architectural traits of pea plants were determined at mid-vegetative stages (flowering). At the full flowering phase, soil samples were taken from the humus profile of the soil (0–30 cm). 10 soil samples for each treatment, together with pea roots, were collected with a root augur 7.5 cm in diameter and 15 cm long (Eijkelkamp Agrisearch Equipment, Giesbeek, the Netherlands). Individual samples were washed in an automatic hydraulic-pneumatic root washer [25].
The cleaned root samples were preserved in 25% v/v ethanol solution and stored for further detailed root analysis using APHELION software (ADCIS S.A. and Amerinex Applied Imaging, France). The results were used to calculate the following parameters: Root length density (RLD) (cm/cm3) = L/V, where L-root length (cm), V-sample volume (cm3); mean root diameter (MRD) (mm); root dry mass density (RDMD) (μg/cm3); specific root length (SRL) (cm/g), which is the length-to-mass ratio (L/M) of a root fragment; and root surface area density (RSAD) (cm2/cm3).

2.2. Ordinal Regression Model

The root dry mass experiment data were evaluated using an ordinal regression model [26] to predict an ordinal dependent variable. Fitting information (Table 1) shows that the use of predictor variables significantly improves the model’s ability to adequately predict RDMD. In addition, the fitting results show that RDMD is significant in this role. Based on this information, it was established that the outcome variable is root dry mass density (RDMD), with four ordinal levels: 1 ‘< 0.0003’, 2 ‘0.0003–0.00055’, 3 ‘0.00055–0.0008’, and 4 ‘> 0.0008’. The ordinal regression enables the construction of models to evaluate the importance of prospective predictor variables. The products of the ordinal regression model are cumulative probabilities for outcome variable categories. The result provides a probability of being in a given category of the dependent variable. RDMD is the so-called scale component. It is implemented as a modification of the model to account for differences in variability of the independent variables.

2.3. Statistical Analysis

Analysis of variance (ANOVA) was carried out using STATISTICA 10.0 software (Software Inc). Significant differences between means were determined by Fisher’s Least Significant Difference (LSD) test at a significance level of 0.05.

3. Results

3.1. Model Interpretation

As the aim of the study was to determine potential predictor variables that are expected to influence root dry mass density (RDMD), the analysis commenced by including all the variables considered potentially influential. A stepwise procedure was employed; variables that were not helpful in resolution of the research problem were removed from the analysis, and the model was re-estimated. The variables of fertilization, row spacing, and cultivars were entered as factors in the model, and the variables RSAD, RLD, MRD, and SRL were entered as covariates in the ordinal regression model.
Fitting information (Table 1) shows that the use of predictor variables significantly improves the model’s ability to adequately predict root dry mass. According to McCullagh and Nelder [27], the difference between −2 times the log-likelihood for the intercept-only model and for the final model can be interpreted in terms of chi-square statistics. The significant chi-square statistic indicates that the final ordinal regression model gives better predictions than those based on marginal probabilities for the outcome variable categories. This could be interpreted as a meaningful impact of the variables considered in the final model on root dry mass density (RDMD).
The parameter estimates for the final model are shown in Table 2. According to the ordinal regression model results, the qualitative variables (type of cultivar and row spacing) and quantitative variables (RSAD, MRD, and SRL)—are meaningful predictors of the outcome variable (root dry mass density). The root dry mass increased at wider row spacing (30 cm) and in the case of the Protecta cultivar. The RSAD, MRD, and SRL parameters significantly impact root mass. The effect of the RSAD and MRD variables on the outcome of the experiment is positive. An increase in the SRL variable predisposes root dry mass to be assigned to the lower root dry mass category
Phosphorus fertilization is statistically a marginally significant predictor of root dry mass density. This is indicative of an ambiguous impact on the phenomenon under investigation. Accommodating that marginal effect, estimates of parameters for fertilization factor indicated a positive relationship between these predictors and higher root dry mass categories of the dependent variable. An increase of fertilization from 0 to 90 kg/ha induced marginal enlargement of root dry mass density. However, no enlargement took place for the fertilization increase from 45 to 90 kg/ha.

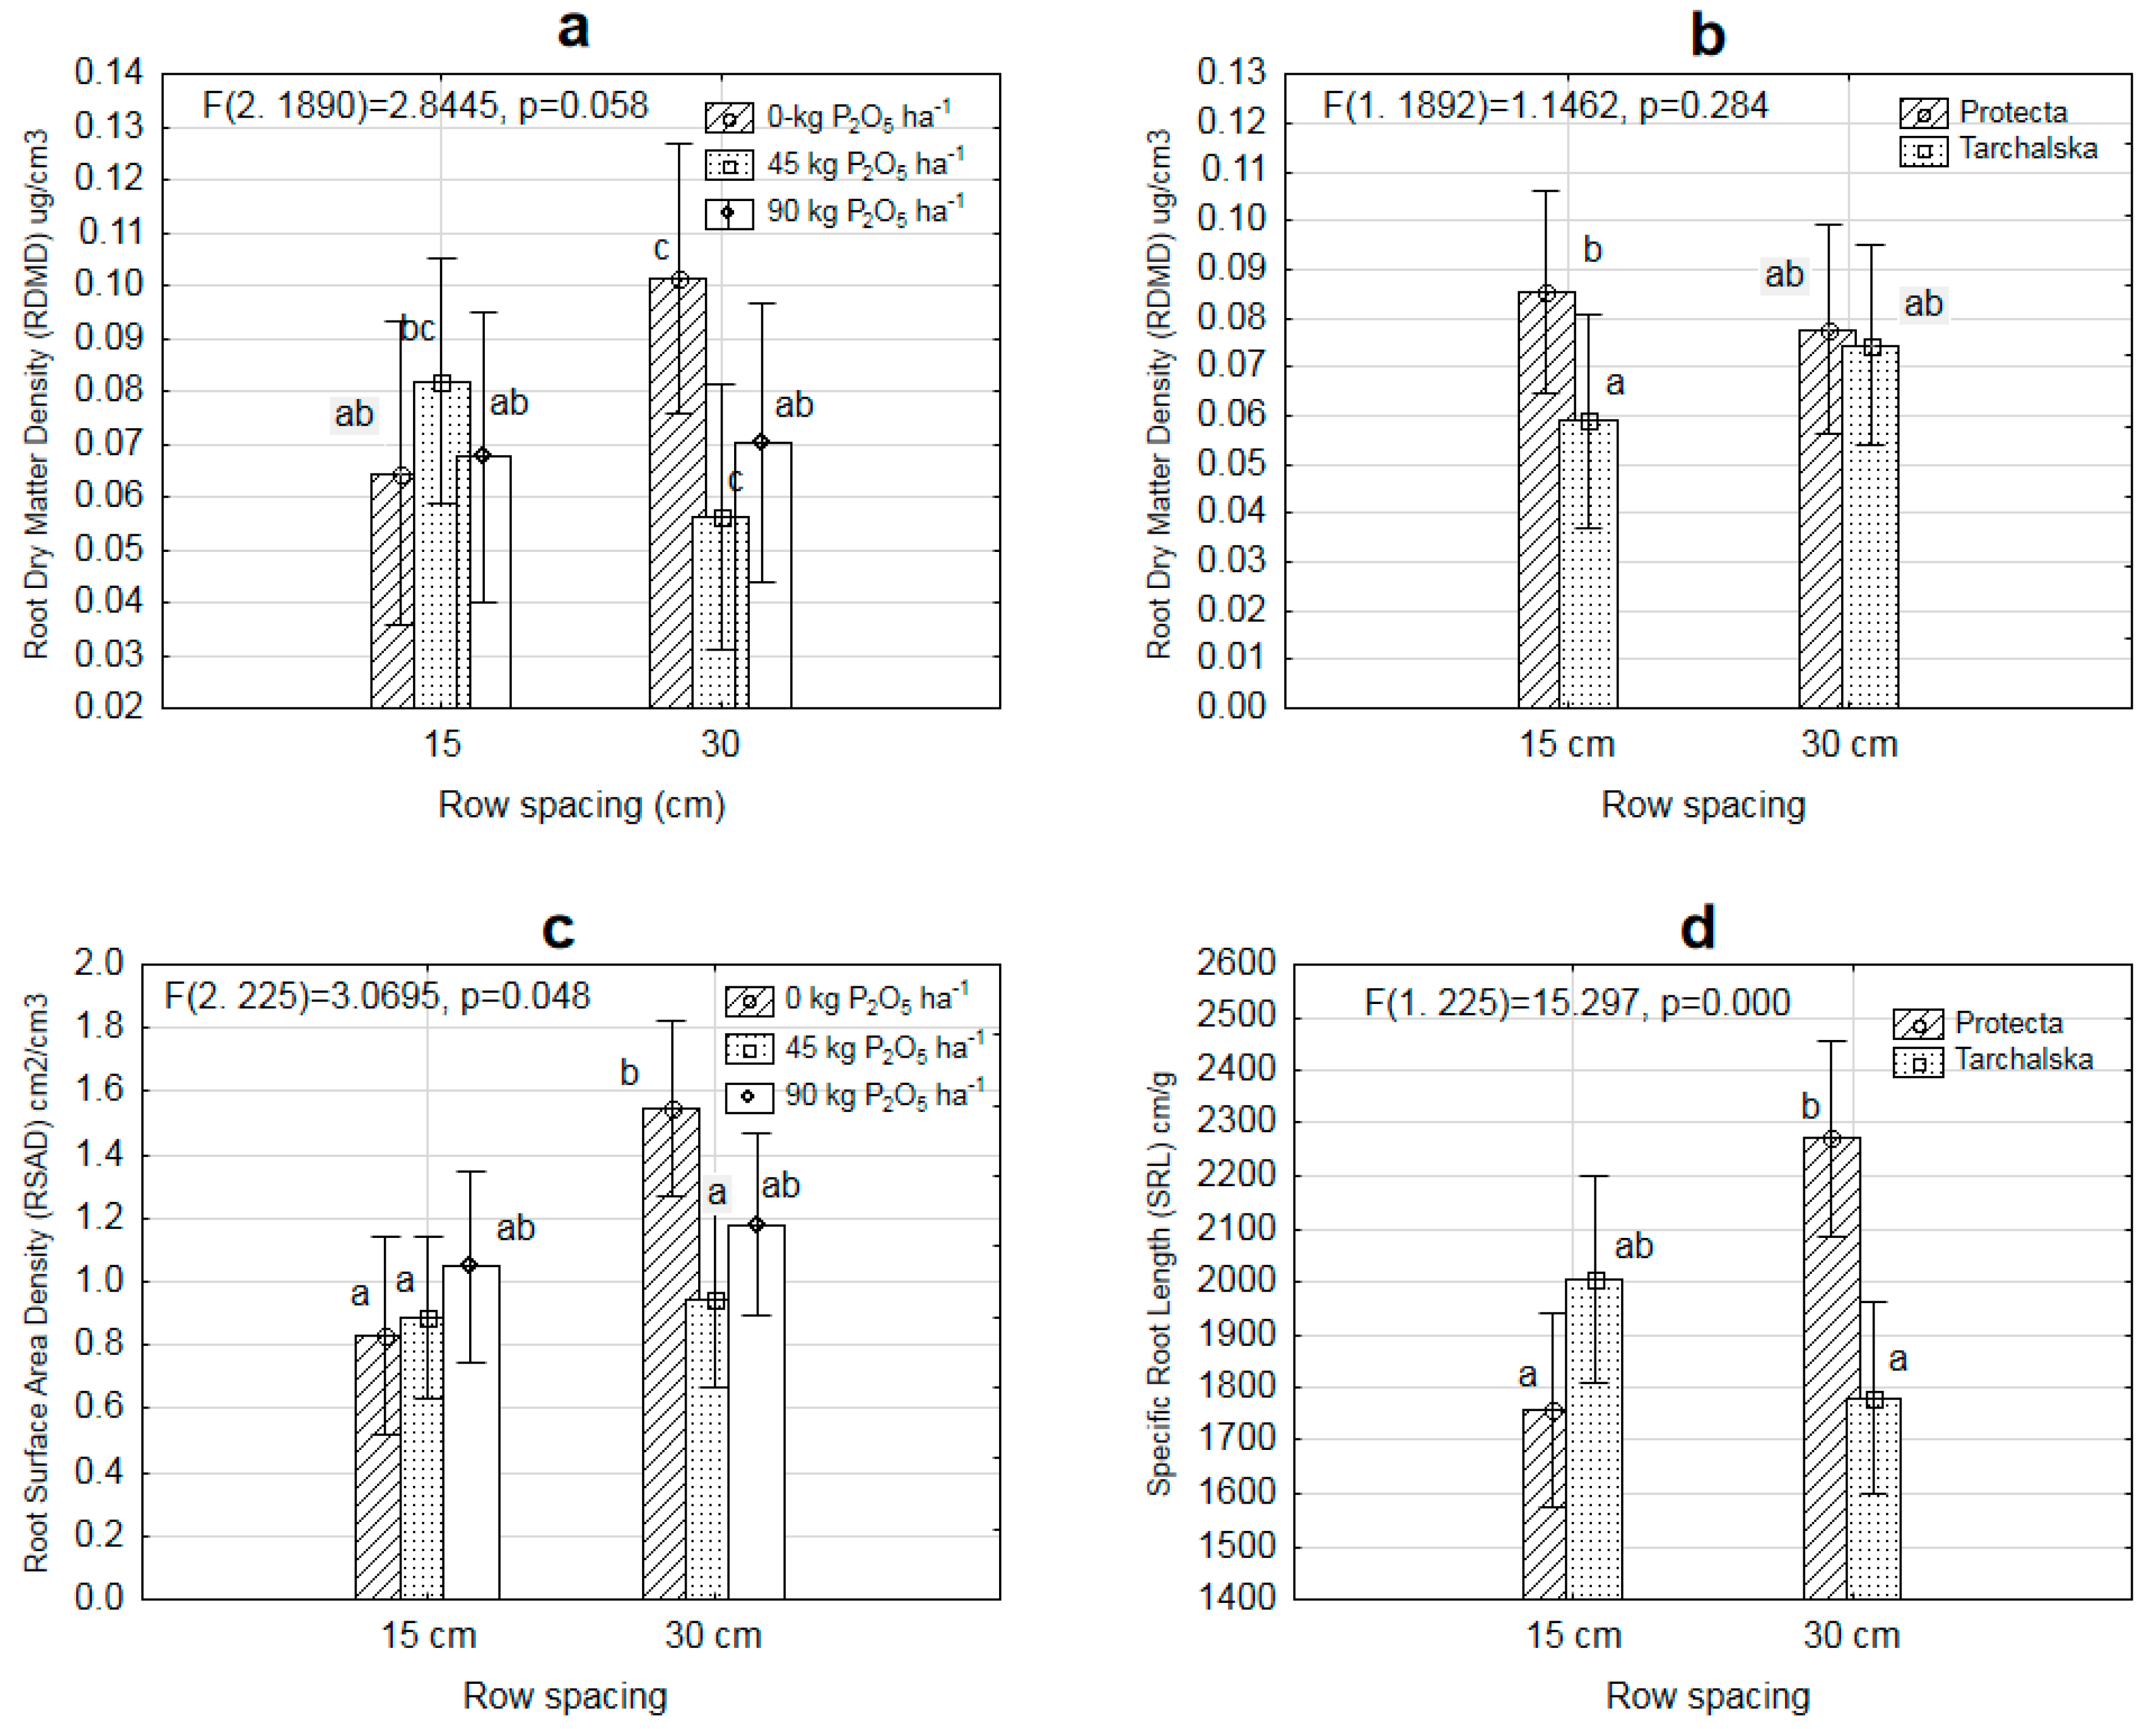
3.2. Diversity in Root Architecture of Two Pea Cultivars Grown under Different Levels of P Supply and Different Row Spacing

Among the factors compared, the selection of cultivars had a major and significant influence on the root architecture. Row spacing and phosphorus fertilization were significantly less important, with a notable effect mainly observed as a result of their interaction with individual cultivars (Table 3 and Table 4). The cultivars reacted strongly to changes in soil properties, manifesting in changes in RLD, RSAD, and RDMD values, while MRD was the least vulnerable to soil changes.
The statistical analysis (ANOVA) indicated a significant impact of all considered factors on RLD (Table 3 and Table 4, Figure 1). The highest RLD was attained in control conditions without phosphorus application and under very high P application (Table 3, Figure 1). This phenomenon proved that roots proliferate not only in deficit nutrient soil conditions, but similar phenomenon is observed when the amount of phosphorus is soil is luxurious. Additionally, there were significant interactions between cultivar and fertilization and between cultivar and row spacing. A higher RLD value was obtained by the Tarchalska cultivar after wide row (30 cm) spacing and without phosphorus application.
The value of RDMD was determined mainly by the cultivars and less so by other factors (Table 3 and Table 4). The Protecta cultivar attained a significantly higher root dry mass density. Additionally, the analysis revealed a significant interaction of factors: Fertilization with row spacing (Figure 2a), cultivar with row spacing (Figure 2b), and cultivar with fertilization (Figure 3a).
The root dry mass density of the Tarchalska cultivar decreased significantly with increased phosphorus fertilization (Figure 3a). In addition, the Tarchalska cultivar responded negatively to narrow row (15 cm) spacing, resulting in a slight reduction in root mass density (Figure 2b). The converse was observed in plants cultivated at wide row spacing. The application of fertilizer low in phosphorus (45 kg) in the case of wide row spacing resulted in a significant reduction in root mass production. Additionally, for treatment without phosphorus fertilization in wider row spacing (30 cm), a significant increase of RDMD was observed (Figure 2a).
The RSAD value was not significantly affected by the phosphorus fertilization (Table 3). However, significant interactions between cultivars and phosphorus fertilization, as well as between fertilization and row spacing, were demonstrated (Figure 3b). Changes in phosphorus application from 0 to 45 kg induced a significant degree of RSAD parameter in the Tarchalska cultivar. Changes of row spacing from 15 cm to 30 cm caused a significant increase of RSAD only in control conditions. This phenomenon proved that selected cultivars are able to develop larger root surface under limited phosphorus soil condition.
In the Protecta cultivar, an increase in root surface area density was observed with increasing phosphorus application (P-90). The opposing phenomenon was observed in the Tarchalska cultivar, where a significant decrease in root surface was observed with increasing phosporus application (P-45) (Figure 3b). The use of wide row spacing (30 cm) resulted in a significant increase in root surface area, mainly under control conditions (Figure 2c).
The value of SRL depended solely on the interactions of the test factors: Between cultivar and phosphorus fertilization, cultivar and row spacing, and phosphorus fertilization and row spacing (Table 3 and Table 4). The value of SRL increased in the Protecta cultivar after the use of wide row spacing (Figure 2d). In addition, a significant interaction of fertilization and row spacing was demonstrated (Figure 3d). At narrow row spacing, low phosphorus application (45 kg ha−1) led to a significantly lower SRL value. The opposing phenomenon was observed at wide row spacing, for which the rate of fertilizer application (from 45 to 90 kg) resulted in a significant increase in this root parameter. High phosphorus application (90 kg ha−1) resulted in a significant decrease in SRL in Protecta, whereas an increase in this parameter was observed in the Tarchalska cultivar. In spite of inconclusive results in the literature for the environmental dependencies determining the size of SRL, it can be presumed that SRL depends on the method of sowing and the level of phosphorus fertilization. Our results have confirmed that SRL depends significantly on the interaction of the analyzed. However, it has also been shown that SRL also depends on other root parameters such as root mass, which may have casual influence depending on the tested pea variety.

4. Discussion

Our research has confirmed that pea exhibits very strong genetic diversification. In the pea cultivars compared in this study, we observed that the plasticity of the root system depended on the amount of available phosphorus in the soil and on the row spacing. Of the two cultivars, Tarchalska was more flexible in phosphorus-deficient conditions. Plant adaptation to phosphorus deficiency depended mainly on changes in RLD, RDMD, and RSA.
Schneider et al. [28] tested soybean root growth and phosphorus uptake at different row spacing. The soybeans were planted in two row spacing variants: Narrow rows (0.35 m) and wide rows (0.70 m). The root density was measured during seed filling (92 days after planting) at several points within the inter-row space to a soil depth of 30 cm. The author reported that the narrow rows of soybeans produced a greater root density than the wide row treatment at 5–10 cm depth, while the roots of the wide-row soybeans had a more lateral growth. The root density on both sides of the row, to a depth of 5 cm, was greater for the wide-row treatment. The average root density for each depth of a section 70 cm wide across the row line indicated that there was no significant difference between treatments at any depth. The smaller number of rows in the wide row spacing was compensated for by a greater lateral extension of roots within the inter-row spacing. This compensation resulted in a similar root density at each depth for planting in both narrow and wide rows.
In the present study, we found that the pea cultivars presented different results in the comparison of row spacing treatments. Across the variation in row spacing, plants grown at the wider spacing had a significantly higher root length density (RLD). Across the variation in phosphorus application, a lack of phosphorus in the soil as well as a high level of phosphorus significantly increased root length density (RLD). This phenomenon proved that roots proliferate not only in deficit nutrient soil conditions, but similar phenomenon has been observed when the amount of phosphorus is soil is luxurious. Grossman and Rice [29] have proved that plants invested more resources to root systems when grown in low-nutrient soils and allocated more roots to higher-nutrient locations.
Similar results were obtained by Thalji [29] in a faba bean experiment, where wide row spacing increased the dry weight of nodules and roots, as well as biomass yield. Ndor et al. [30] indicated that environmental factors such as phosphorus application and row spacing had a significant effect on overall growth and yield parameters in cowpea.
Our study partially confirmed these results, since pea cultivation in wider rows (30 cm) only slightly increased RSA in higher phosphorus dose (90 kg ha−1), whereas it significantly increased the parameter values in control condition (no phosphorous application). In the case of RDM, considering row spacing, the plants cultivated in wider rows presented a significantly higher root length density.
Zhu and Lynch [31] have shown that SRL is an important factor benefiting lateral rooting under low phosphorus availability; they have also proven the ability of some genotypes to maintain lateral root growth under phosphorus limitation. This has been confirmed in our own study, which showed differences in root architecture between pea cultivars. The Protecta cultivar significantly increased SRL in wide row spacing, while Tarchalska responded differently. In low-phosphorus soil, SRL increased in the Protecta cultivar and decreased in Tarchalska. An attempt to explain changes in the value of SRL was discussed many times in the context of nutrient and water deficit [32]. However, there is no clear explanation as to what determines these changes. White and Hammond [33] indicate that the SRL parameter depends on interaction of many environmental factors, which was confirmed in our research.

5. Conclusions

The type of cultivar has a significant influence on the architecture of the pea root. Among the cultivars compared, the edible Tarchalska cultivar exhibited greater plasticity in its ability to grow in phosphorus-deficient soil, as it developed more lateral roots with a higher root surface area. The fodder cultivar did not present similar behavior in root parameters.
The adaptation of peas to phosphorus-deficient soil (lack of additional phosphorus fertilization) was mainly dependent on changes in RLD, RDMD, and RSA.
The SRL index depended on the interactions of fertilization with cultivar and fertilization with row spacing. The Protecta cultivar significantly increased SRL at wide row spacing, while Tarchalska decreased it. In the case of low phosphorus application, SRL increased in the Protecta and decreased in Tarchalska.

Author Contributions

Conceptualization, A.K.-K.; Methodology, A.K.-K., T.G., J.S.; Validation, A.K.-K., T.G., J.S.; Investigation, A.K.-K.; Writing—Original Draft Preparation, A.K.-K.; A.K.-K., Writing—Review & Editing; T.G., J.S., Funding Acquisition; A.K.-K.

Funding

This work was supported by the Polish Ministry of Science and Higher Education as part of the statutory activity of the University of Agriculture in Krakow.

Conflicts of Interest

The authors declare no conflict of interest.

References

  1. Wang, X.; Wang, Y.; Tian, J.; Lim, B.; Yan, X.; Liao, H. Overexpressing AtPAP15 Enhances phosphorus efficiency in soybean. Plant Physiol. 2009, 151, 233–240. [Google Scholar] [CrossRef] [PubMed]
  2. Akhtar, M.S.; Oki, Y.; Adachi, T. Intraspecific variations of phosphorus absorption and remobilization, P forms, and their internal buffering in Brassica cultivars exposed to a P-stressed environment. J. Integr. Plant Biol. 2008, 50, 703–716. [Google Scholar] [CrossRef]
  3. Wang, X.; Yan, X.; Liao, H. Genetic improvement for phosphorus efficiency in soybean: A radical approach. Ann. Bot. 2010, 106, 215–222. [Google Scholar] [CrossRef]
  4. Paez-Garcia, A.; Motes, C.; Scheible, W.R.; Chen, R.; Blancaflor, E.; Monteros, M. Root traits and phenotyping strategies for plant improvement. Plants J. 2015, 4, 334–355. [Google Scholar] [CrossRef]
  5. Katra, I.; Gross, A.; Swet, N.; Tanner, S.; Krasnov, H.; Angert, A. Substantial dust loss of bioavailable phosphorus from agricultural soils. Sci. Rep. 2016, 6, 24736. [Google Scholar] [CrossRef] [Green Version]
  6. Manschadi, A.M.; Manske, G.G.B.; Vlek, P.L.G. Root architecture and resource acquisition—Wheat as a Model Plant. In Plant Roots: The Hidden Half, 4th ed.; Eschel, A., Beeckman, T., Eds.; CRC Press, Taylor and Francis Group: Boca Raton, FL, USA, 2013; pp. 22.1–22.18. [Google Scholar]
  7. Lynch, J. Root architecture and plant productivity. Plant Physiol. 1995, 109, 7–13. [Google Scholar] [CrossRef] [PubMed]
  8. Gahoonia, T.S.; Care, D.; Nielsen, N.E. Root hairs and phosphorus acquisition of wheat and barley cultivars. Plant Soil 1997, 191, 181–188. [Google Scholar] [CrossRef]
  9. Gahoonia, T.S.; Nielsen, N.E. Barley genotypes with long root hairs sustain high grain yields in low-P field. Plant Soil 2004, 262, 55–62. [Google Scholar] [CrossRef]
  10. Wissuwa, M. How do plants achieve tolerance to phosphorus deficiency: Small causes with big effects. Plant Physiol. 2003, 133, 1947–1958. [Google Scholar] [CrossRef]
  11. Gibson, D. Methods in Comparative Plant Population Ecology, 2nd ed.; Oxford University Press: New York, NY, USA, 2015. [Google Scholar]
  12. Jiang, C.F.; Gao, X.H.; Liao, L.; Harberd, N.P.; Fu, X.D. Phosphate starvation root architecture and anthocyanin accumulation responses are modulated by the gibberellin-DELLA signaling pathway in Arabidopsis. Plant Physiol. 2007, 145, 1460–1470. [Google Scholar] [CrossRef]
  13. Lynch, J.P.; Brown, K.M. Topsoil foraging: An architectural adaptation of plants to low phosphorus availability. Plant Soil 2001, 237, 225–237. [Google Scholar] [CrossRef]
  14. Farley, R.A.; Fitter, A.H. The responses of seven co-occuring woodland herbaceous perennials to localized nutrient-rich patches. J. Ecol. 1999, 87, 849–859. [Google Scholar] [CrossRef]
  15. Liao, H.; Rubio, G.; Yan, X.; Cao, A.; Brown, K.M.; Lynch, J.P. Effect of phosphorus availability on basal root shallowness in common bean. Plant Soil 2001, 232, 69–79. [Google Scholar] [CrossRef] [PubMed]
  16. Ho, M.; Rosas, J.; Brown, K.; Lynch, J. Root architectural tradeoffs for water and phosporus acquisition. Funct. Plant Biol. 2005, 32, 737–748. [Google Scholar] [CrossRef]
  17. Walk, T.C.; Jaramillo, R.; Lynch, J.P. Architectural tradeoffs between adventitious and basal roots for phosphorus acquisition. Plant Soil 2006, 279, 347–366. [Google Scholar] [CrossRef]
  18. Ma, Z.; Baskin, T.I.; Brown, K.M.; Lynch, J.P. Regulation of root elongation under phosphorus stress involves changes in ethylene responsiveness. Plant Physiol. 2003, 131, 1381–1390. [Google Scholar] [CrossRef]
  19. Borch, K.; Bouma, T.; Lynch, J.P.; Brown, K.M. Ethylene: A regulator of root architectural responses to soil phosphorus availability. Plant Cell Environ. 1999, 22, 425–431. [Google Scholar] [CrossRef]
  20. Callaway, M.M.; Dawson, T.E.; Richards, J.H. Hydraulic lift: Consequences of water efflux from the roots of plants. Oecologia 1998, 113, 151–161. [Google Scholar]
  21. Lynch, J.P.; Ho, M.D. Rhizoeconomics: Carbon costs of phosphorus acquisition. Plant Soil 2005, 269, 45–56. [Google Scholar] [CrossRef]
  22. Nord, E.A.; Zhang, C.; Lynch, J.P. Root responses to neighbouring plants in common bean are mediated by nutrient concentration rather than self/non-self recognition. Funct. Plant Biol. 2011, 38, 941–952. [Google Scholar] [CrossRef] [Green Version]
  23. Yang, X.; Post, W.M.; Thornton, P.E.; Jain, A. The distribution of soil phosphorus for global biogeochemical modeling. Biogeosciences 2013, 10, 2525–2537. [Google Scholar] [CrossRef]
  24. Miguel, M.A.; Widrig, A.; Vieira, R.F.; Brown, K.M.; Lynch, J.P. Basal root whorl number: A modulator of phosphorus acquisition in common bean (Phaseolus vulgaris). Ann. Bot. 2013, 112, 973–982. [Google Scholar] [CrossRef] [PubMed]
  25. Klimek-Kopyra, A.; Rębilas, K. Dependence of pea root mass distribution on weather conditions under varying levels of phosphorus application. Int. Agrophys. 2018, 32, 365–372. [Google Scholar] [CrossRef]
  26. Klimek Kopyra, A.; Strojny, J.; Zając, T.; Ślizowska, A.; Klimesova, J.; Neugschwandtner, R.W. Ordinal regression model for pea seed mass. Ein ordinales Regressionsmodell für das Samengewicht von Erbse. Die Bodenkul. J. Land Manag. Food Environ. 2017, 68, 81–87. [Google Scholar] [CrossRef]
  27. McCullagh, P.; Nelder, J.A. Generalized Linear Models, 2nd ed.; Chapman and Hall: London, UK, 1989. [Google Scholar]
  28. Schneider, K.; Turrion, M.B.; Gallardo, J.F. A modified method to measure acid phosphatase activities in forest soils with high organic matter content. Commun. Soil Sci. Plant Anal. 2000, 31, 1–17. [Google Scholar] [CrossRef]
  29. Grossman, J.D.; Rice, K.J. Evolution of root plasticity responses to variation in soil nutrient distribution and concenstration. Evol. Appl. 2012, 5, 850–857. [Google Scholar] [CrossRef] [PubMed]
  30. Thalji, T. Impacts of row spacing on faba bean L. growth under Mediterranean rainfed conditions. J. Agron. 2006, 5, 527–532. [Google Scholar]
  31. Ndor, E.; Dauda, N.S.; Abimuku, E.O.; Azagaku, D.E.; Anzaku, H. Effect of phosphorus fertilizer and spacing on growth, nodulation count and yield of cowpea (Vigna unguiculata (L) Walp) in Southern Guinea Savanna Agroecological Zone, Nigeria. Asian J. Agric. Sci. 2012, 4, 254–257. [Google Scholar]
  32. Zhu, J.M.; Lynch, J.P. The contribution of lateral rooting to phosphorus acquisition efficiency in maize (Zea mays) seedlings. Funct. Plant Biol. 2004, 31, 949–958. [Google Scholar] [CrossRef]
  33. White, P.J.; Hammond, J.P. The Ecophysiology of Plant-Phosphorus Interactions; Springer: Berlin, Germany, 2008. [Google Scholar]
Figure 1. Effect of row spacing, phosphorus fertilization and cultivar on root length density (RLD). Vertical bars indicate standard errors of the means (n = 10). Bars with the same letters are not significantly different at p < 0.05 according to Tukey’s multiple range test.
Sustainability 11 01824 g001
Figure 2. Effect of (a) row spacing and phosphorus fertilization and (b) row spacing and cultivar on root dry matter density (RDMD); effect of (c) row spacing and phosphorus fertilization on root surface area density (RSAD) and (d) row spacing and cultivar type on specific root length (SRL). Vertical bars indicate standard errors of the means (n = 10). Bars with the same letters are not significantly different at p < 0.05 according to Tukey’s multiple range test.
Sustainability 11 01824 g002
Figure 3. Effect of phosphorus fertilization and cultivar type on (a) root dry matter density (RDMD), (b) root surface area density (RSAD), and (c) phosphorus fertilization and cultivar type; effect of (d) phosphorus fertilization and row spacing on specific root length (SRL). Vertical bars indicate standard errors of the means (n = 10). Bars with the same letters do not differ significantly at p < 0.05 according to Tukey’s multiple range test.
Sustainability 11 01824 g003
Table 1. Model fitting information.
Model−2 Log LikelihoodChi-SquaredfSig.
Intercept Only655.636
Final Model0.000655.63680.000
Link function: negative.
Table 2. Ordinal regression model parameter estimates.
Model ComponentVariable LevelEstimate Std. Error Wald dfSig. 95% Confidence Interval
Lower BoundUpper Bound
ThresholdRDMD = 1−2.6901.1575.41010.020−4.957−0.423
RDMD = 26.0011.26422.53910.0003.5248.478
RDMD = 311.7381.66949.46110.0008.46715.009
LocationFertilization-01.0010.5882.89310.089−0.1522.154
Fertilization-45−0.0060.5640.01110.916−1.1661.047
Fertilization-900(a)..0...
row spacing = 152.0420.50616.26210.0001.0493.034
row spacing = 300(a)..0...
RSAD8.0552.10814.60410.0003.92412.187
RLD3.2022.2152.08910.148−1.1407.543
MRD17.1713.47024.492 0.00010.37023.971
SRL−0.0070.00166.23010.000 −0.009−0.005
Cv. Tarchalska1.1990.5714.40710.036 0.0082.318
Cv. Proctecta0(a)..0...
Link function: negative loglog.
Table 3. Analysis of variance (ANOVA) results of root parameters under different cultivars, phosphorus fertilization and row spacing.
TreatmentsRLD cm/cm3RDMD ěg/cm3RSAD cm2/cm3MRD cmSRL cm/g
CultivarsProtecta0.154b0. 6b1.228b0.2661991
Tarchalska0.120a0. 5a0.918a0.2621856
Phosphoruslevel
(kg P2O5 ha−1)
00.161b0. 740.2370.2761958
450.114a0. 630.9010.2711826
900.142ab0. 531.1130.2442010
Row spacing150.124a0. 530.927a0.2731833
300.150b0. 641.215b0.2572011
* Means ± standard errors (n = 10). Means followed by different letters within each column are significant at p < 0.05 according to Tukey’s multiple range test.
Table 4. p-values obtained via three-way analysis of variance to determine the effects of fertilization with row spacing and cultivar type on root parameters.
TreatmentsRLD cm/cm3RDMD ěg/cm3RSAD cm2/cm3MRD cmSRL cm/g
Cultivar-C0.000 *0.007 *0.007 *0.9890.200
Fertilization-F0.004 *0.0550.1280.4490.390
Row-R0.009 *0.3170.011 *0.4990.125
C × F0.000 *0.000 *0.022 *0.4320.023 *
C × R0.4340.039 *0.4750.3780.000 *
F × R0.008 *0.000 *0.048 *0.8570.002 *
C × F × R0.032 *0.0990.2520.5430.325
*, **, *** Significant at p < 0.05, p < 0.01, and p < 0.001, respectively.

