Article

Using RISKPLAN for Earthquake Risk Assessment in Sichuan Province, China

1
School of Engineering, Northeast Agricultural University, Harbin 150030, China
2
Department of Environmental Systems Science, Swiss Federal Institute of Technology, Zurich (ETHZ), Sonneggstrasse 33, 8092 Zürich, Switzerland
*
Author to whom correspondence should be addressed.
Sustainability 2019, 11(6), 1812; https://doi.org/10.3390/su11061812
Submission received: 9 December 2018 / Revised: 18 March 2019 / Accepted: 20 March 2019 / Published: 26 March 2019

Abstract

:
Sichuan Province of China is a prominent population and economic growth center as well as an earthquake-stricken region. A sound understanding of the seismic risk that Sichuan Province is facing is useful to raise risk awareness, achieve disaster risk reduction (DRR), and guarantee sustainable socio-economic development. Earthquake risk assessment is the first step in these efforts. This study strives to demonstrate the feasibility of applying an integrated earthquake risk assessment in Sichuan Province of China using RISKPLAN, a risk evaluation tool of natural hazards developed by the Swiss Federal Office for the Environment (FOEN). The time and location of seismic events in Sichuan were incorporated into three scenarios and calculated with respect to expected losses under different assumed conditions of earthquake occurrence, such as the recurrence interval and magnitude. Furthermore, cost-effectiveness calculations were made regarding the various possible scenarios to assess the ratio of expected losses and the required financial means for prevention and mitigation measures against the effects of seismic activities in Sichuan. Our results show that when the magnitude of the seismic event is greater than expected, reduction and mitigation investments for a possible earthquake risk will be all the more rewarding.

1. Introduction

Earthquakes in China are characterized by high frequency and intensity, shallow focal depth, and wide distribution across the country. Over the past two decades, 238 damaging earthquakes have occurred in China and more than 73,000 people died in these quakes, accounting for nearly 10% of global deaths from earthquakes between 1998 and 2017 [1,2,3,4]. From 2007 to 2016, the direct economic losses of earthquakes account for about 24% of a 10-year average of all losses created by all natural catastrophes in China [5].
Sichuan Province of China is located in the southwestern seismic region, one of China’s five major earthquake zones [6], which is characterized by high seismicity as well as high population density and significant industrial importance. Over the last two decades, three major earthquake activities with a magnitude higher than 6.5 happened in Sichuan Province, the most destructive one having occurred on 12 May 2008. The devastating consequence, the most serious in China in the early 21st century, drew tremendous attention from all over the world. This horrific tragedy demonstrated the need for more effective and efficient disaster risk reduction (DRR) measures to cope with China’s rapid economic and population growth over the past 40 years. DRR is significant for maintaining the current socio-economic development and thus achieving sustainable development [7,8], the importance of which is fully illustrated in the Sendai Framework [9]. However, a sound understanding of earthquake risk is a necessary prerequisite for DRR.
The Intergovernmental Panel on Climate Change (IPCC) [10] defines disaster risk as “the likelihood over a specified time period of severe alterations in the normal functioning of a community or a society due to hazardous physical events interacting with vulnerable social conditions, leading to widespread adverse human, material, economic, or environmental effects that require immediate emergency response to satisfy critical human needs and that may require external support for recovery.” Based on this definition, though earthquake risk can be defined in many ways, earthquake risk assessment is basically decided by the combined interactions of three main factors: (i) the potential earthquake hazard at a given place, (ii) the people and property exposed to the threat, and (iii) the vulnerability of the exposed people and property to seismic hazard [11,12,13,14].
Substantial studies of earthquake risk assessment have been carried out in recent decades in the fields of earthquake engineering [14]. Earthquake hazard assessment calculates the probability of ground shaking across a region primarily in deterministic or probabilistic approaches. Deterministic approaches are scenario-based without uncertainties such as ground motion, in which a single seismic event is identified, whereas the development of probabilistic seismic hazard assessment (PSHA) takes possible uncertainties into account besides all potential deterministic earthquake scenarios with their likelihood of occurrence [15,16,17]. A PSHA may be carried out for a given region to reveal various levels of ground shaking with a corresponding exceedance probability within a time interval or a return period [18,19], by which an earthquake hazard map can be plotted based on the standard building codes in most countries, usually for the ground shaking to be reached or exceeded with a 10% probability in 50 years or an average recurrence of such ground motions every 475 years [13,20,21].
In addition, the exposure and vulnerability of people and property are also essential for earthquake risk assessment. Exposure evaluation captures the spatial distribution of the people and property exposed to the seismic hazards as well as their value, the development of which mainly focuses on the data collection and measurement of exposure [7,16,22]. Vulnerability generally describes the susceptibility of the exposed building stock to adverse seismic impacts expressed as the probability of loss ratio conditional on a group of ground-shaking levels [14,16] and existing studies develop around physical or structural seismic vulnerability [23,24]. Based on the studies focused on the above three main components, achievements have been further made in the creation of software tools and platforms (i.e., HAZUS, OpenQuick, RISKPLAN, and EconoMe) to perform earthquake hazard and risk assessment at a national, continental, or global scale [19,25,26]. In terms of earthquake risk assessment in China, scholars mainly focus their studies on seismic hazard assessment [27] and seismic fragility or vulnerability of buildings [28,29]. Therefore, previous studies provide necessary bases for earthquake risk assessment from the perspective of earthquake engineering. However, given serious exposure to earthquake disaster accompanied by rapid socio-economic development in China, there is a particular lack of an integrated and holistic evaluation of earthquake risk combining social-economic vulnerability with the physical impacts and loss of life [12,26,30,31,32,33].
A survey conducted by General Reinsurance has shown that catastrophe insurance is still seriously underdeveloped in China and one of the most important reasons is insufficient natural catastrophe management tools [5], This, in turn, has an adverse impact on raising public perception about disaster risk, especially the people and property stakeholders exposed to seismic risks, thus impeding the improvement of catastrophe insurance compensation levels [5,7]. Consequently, in order to change this status quo, a pragmatic and comprehensive earthquake risk assessment approach is required to undertake risk planning and take mitigation measures for the people and assets exposed in an earthquake-prone region of China.
In this context, our purpose here is to demonstrate the feasibility of performing an integrated earthquake risk assessment conditional on different scenarios and return periods for Sichuan Province using the open access methodology RISKPLAN using available historical data. The results of this work are not intended to support related earthquake experts for decision-making and inter-regional comparisons of seismic risk, but aim to establish a risk dialogue platform by which (i) the knowledge, experiences, and opinions can be communicated in a pragmatic way between related experts, decision makers, and the people threatened by potential earthquakes; (ii) the public are facilitated to have a sound understanding of earthquake risk so as to take effective and efficient DRR measures; and (iii) earthquake risk is made tangible to decision-makers who must evaluate disaster risk reduction and mitigation measures against the political and economic rationale of cost–benefit considerations.
According to IPCC’s definition, disaster risk is decided by the combined action of hazard, exposure, and vulnerability. For this study, hazard denotes the potential occurrence of a natural or man-made physical event that may cause loss to life and material and recurrence interval is used to express its potential occurrence. Exposure refers to the presence of people and material in places that could be adversely affected by physical events and is roughly estimated using probabilities in different scenarios. Finally, vulnerability represents a propensity to be adversely affected by the occurrence of a physical event and as a result of the physical event’s impact on people and assets; vulnerability in the context of this paper is expressed as the extent of death toll and material damage. These components are input into RISKPLAN (a pragmatic risk management tool developed for conducting risk analysis with respect to natural hazards in Switzerland supported by the Swiss Federal Office for the Environment (FOEN) and the Swiss Federal Office for Civil Protection (FOCP)), in order to apply it to earthquake scenarios in Sichuan Province of China. The next section analyzes the socio-economic situation of Sichuan Province, provides a brief account of its earthquake history to date, and describes the history, development, and methodology of RISKPLAN. Section 3 applies RISKPLAN to evaluate the integrated earthquake risk in Sichuan and its cost-effectiveness of risk reduction and mitigation measures. Section 4 reports on the results and Section 5 discusses the potential of RISKPLAN to assess earthquake risk and presents concluding remarks.

2. Materials and Methods

2.1. Research Region

Sichuan Province is located in Southwest China, upstream of the Changjiang River at a latitude of 26°03′–34°19′ and a longitude of 92°21′–108°12′ with an area of 486,000 km2, and is the fifth largest province in the country with 5.1% of the overall Chinese territory. It has a remarkable topographical diversity from east to west. Plateaus and mountains are mostly located in the west at more than 4000 m above sea level (m asl), whereas basins and hills are mostly situated in the east ranging from 1000 to 3000 m asl [34]. The gross domestic product (GDP) of Sichuan Province was 3698.02 billion CNY (538.44 billion US$ at 1 $ = 6.868 CNY) in 2018, and its population was 83.02 million. Sichuan with its long cultural history, abundant energy resources, and a developed tourism industry is a highly important region as well as an important industrial base for China [35].
Sichuan also has a long history of major earthquakes. The geological and seismic research literature categorize Sichuan earthquake activities into eight main seismic zones according to the distribution and characteristics of earthquake activities and their relation to geological structure, especially in their relationship between earthquake and active fault zone. These are Songpan-Longmenshan, Litang, Mingshan-Mabian-Zhaotong, Xianshuihe, An’ninghe-Zemuhe, Yanyuan, and Jinshajiang seismic zones. The Songpan-Longmenshan seismic zone has been particularly active. The more recent events were the Jiuzhaigou earthquake and Lushan earthquake that struck the region on 8 August 2017 and 20 April 2013 with Ms 7.0, respectively. Wenchuan Ms 8.0 earthquake (12 May 2008) was the most destructive event on record. Moreover, Diexi earthquake with Ms 7.5 (25 August 1933) and Pingwu earthquake with Ms 7.2 (16 August 1976) also occurred in the Longmenshan Fault. The seismic zone of Litang has had 10 earthquakes with a magnitude more than 5.0 since 1727. In nine of them, the magnitude was between 5.0 and 5.9 and one with magnitude 7.5 happened on 25 May 1948. Over the past 800 years, there have been eight earthquakes with a magnitude of more than 6.0 in the Mingshan-Mabian-Zhaotong seismic zone, including one with magnitude 7.0 on 17 March 1216. The other earthquakes of this seismic zone happened mostly in the adjacent Yunnan Province. Earthquakes in the seismic zones of Yanyuan and Jinshajiang ranged from magnitude 6.0 to 7.0, but most of them were less than Ms 6.0 [36,37,38,39].

2.2. Data on the History of Earthquakes in Sichuan Province

The scope of data collection in this study is as follows:
  • The lower limit of an earthquake magnitude is set at Ms = 6.5 [40], a level where the destructive extent of earthquakes starts to be significant;
  • In order to discern the main behavior of strong earthquake recurrence, the foreshocks and aftershocks were not treated as independent events; and
  • If the earthquakes in any of the above seismic zones occurred outside Sichuan Province, it would be not included in this study; likewise, any damages from an earthquake would be taken into account only if they happened inside Sichuan Province.
The next qualification to consider was whether the scale of historical earthquake data could meet the requirements of this study. According to the above conditions, three seismically active zones were chosen: Xianshuihe, Songpan-Longmenshan, and An’ninghe-Zemuhe.
Sichuan Province was further classified into three object-related reference data points—historical earthquake numbers, death toll, and material damages—with respect to the three seismic zones (see Table 1). In this study, historical earthquakes happening in the three seismic zones were counted since there are historical records available. Because of data scarcity, the values of death toll were mostly available after 1816, whereas the numbers for material damages were only available after the foundation of the People’s Republic of China in 1949. In this study, material damages are defined as property loss or direct loss. The results of data collection are shown in Table 1.
The available data of material damage and death toll are all in the respective event year, and in order to make a comparison, they need to be normalized to 2017 standards. Given the level of data collection and the possible normalization methodologies [43,44,45], a simplified method of normalizing material damage and death toll to the 2017 level are proposed by Equations (1) and (2), respectively.
N M D y , 2017 = M D y · C 2017 , y · G 2017 , y · P 2017 , y ,
where N M D y , 2017 is the material damage value normalized to the year 2017; M D y is the material damage value in the event year (Table 1); C 2017 , y is the CPI factor calculated by the ratio of the consumer price index (CPI) of Sichuan Province in 2017 to that of the event year; G 2017 , y is the gross domestic product (GDP) factor determined by the ratio of per capita GDP of Sichuan Province in 2017 to that of the event year; P 2017 , y is the population factor determined by the ratio of the population of Sichuan Province in 2017 to that of the event year.
N D T y , 2017 = D y · P 2017 , y ,
where N D T y , 2017 is the death toll normalized to 2017; D y is the death toll in the event year (Table 1).
Because the study area comprises several intact administrative divisions, Sichuan provincial per capita GDP and population data are used for the whole study region to calculate the GDP and the population factor. Due to the lack of per capita GDP data for 1955, 1967, 1973, and 1976, the estimated per capita GDP values were the average values of available data in the most adjacent years of the Sichuan Statistical Yearbook 2005 [46]. The data collection is shown in Table 2, then the factor values and normalized values are shown in Table 3. In the absence of population data for 1850, 1904, 1923, 1955, 1967 and 1973, the estimated population values are the average values of available data in the most adjacent years of the Sichuan Statistical Yearbook 2005 [46]. The population data collection, estimation, and normalization are shown in Table 2.

2.3. Method and History of RISKPLAN

RISKPLAN is a calculation and management tool for the practical assessment of the risks posed by hazard processes in defined areas and for ascertaining the cost-effectiveness of protective measures. This approach makes it possible to directly assess and, if necessary, correct estimates based on implicit knowledge, as well as carry out a sensitivity analysis. It is based on a scientifically recognized concept of risk calculation that allows for the systematic and transparent assessment of hazards and their associated risks, and of the cost-effectiveness of measures for prevention, protection, or mitigation against these hazards.
RISKPLAN is based on four methodological elements that are evaluated on a step-by-step basis:
  • definition of the assessment area (system) with the hazards to be analyzed and the persons and material assets at risk from these hazards (damage potential);
  • definition or estimation, calculation, and presentation of the risks posed by these hazards (initial situation);
  • identification and definition of possible measures and packages of measures in the assessment area; and
  • estimation, calculation, and presentation of the risks following the implementation of measures and the calculation and assessment of their cost-effectiveness.
RISKPLAN, which was developed in the context of the 1992 Swiss Federal Law on Forests, was first used to evaluate the risk of snow avalanches, rock fall, and flood hazards in Switzerland. The introduction of such a risk assessment tool became obligatory in the aftermath of the federal forest legislation for all hazard protection projects to be undertaken and to be approved by the respective Swiss canton. The purpose was to develop a strategy for “testing the cost-effectiveness of mitigation measures funded by the state, based on the level of risk reduction provided” and to promote risk management cooperation between scientific research institutes, administrations, and the private sector [50]. Since then several versions have been made available at no cost in English, German, French, Italian, Thai, and Chinese.
Now, for the first time, RISKPLAN will be adapted in this paper to the calculation of earthquake risks on the initiative of the authors in accordance with the respective department of the Swiss Federal Office for the Environment (FOEN) and, also for the first time, it will be used to analyze earthquake risks in China. In order to apply RISKPLAN to earthquake risk assessment, some adaptations of the tool and its applications were necessary, including the detailed meaning and definition of recurrence interval, probability of exposure, and extent of damage.
Figure 1 shows the conceptual framework of this study using the RISKPLAN method. Based on the data collection above and the definition of disaster risk elements in Section 1, the recurrence interval is classified by different earthquake magnitudes which represent three different scenarios. The earthquake risk of each seismic zone is defined in three dimensions, including the recurrence interval for a specific earthquake magnitude, the extent of damage on people and material assets, and the probability of exposure for different courses. The following section will give a detailed description of the conceptual framework in Figure 1.

3. Application of RISKPLAN for Sichuan Earthquake Risk Assessment

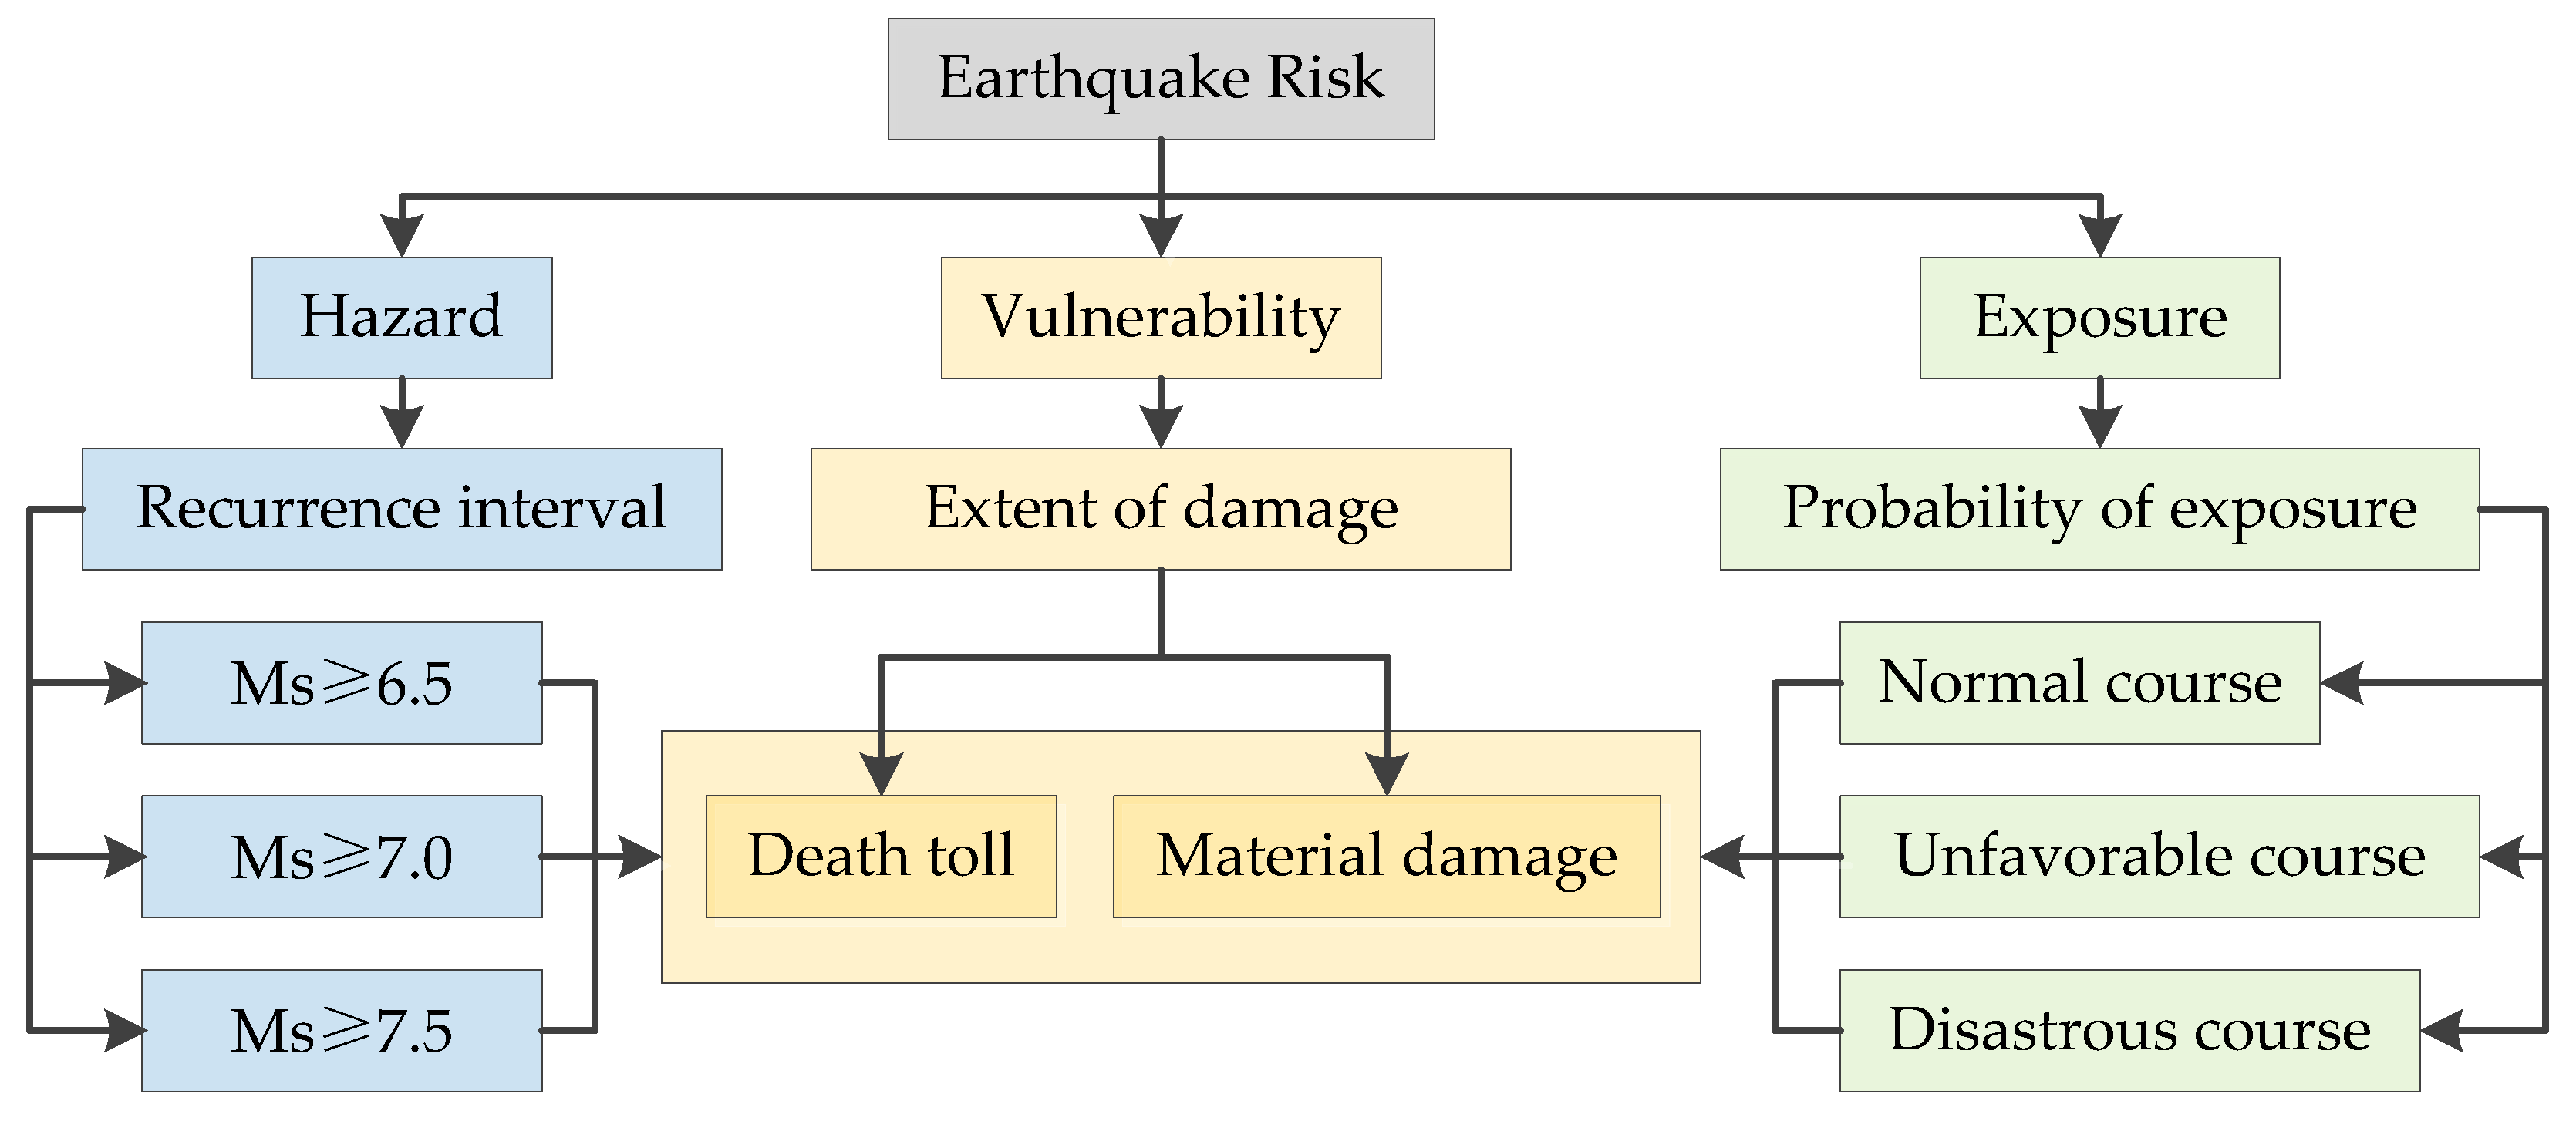
3.1. Definition of Scenarios and Recurrence Intervals

The term scenario is used in RISKPLAN to define the caliber and possible course of events associated with a hazard process. Each scenario is classified in terms of its frequency or probability. Each of the three object areas in the three seismic zones have three scenarios, which are categorized by the average recurrence interval with Ms ≥ 6.5, Ms ≥ 7.0, and Ms ≥ 7.5 in every seismic zone. Moreover, References [51,52] defined recurrence interval as the mean value of the time intervals between each historical earthquake event for a given region with a magnitude more than a specified value. However, as the magnitude increases, it becomes more apparent that the seismic data are not complete enough, by which the length of the return period cannot be correctly reflected. In Anninghe-Zemuhe, for example, when the Ms is more than or equal to 7.5, there were only two earthquake events during the period between 814 and 2017, happening in 1536 and 1850, respectively. Obviously, it is difficult to designate the time interval (314 years) between these two earthquakes as the recurrence interval of earthquakes at or above Ms 7.5. For this reason, and similarly to what was done in [53], the average recurrence interval is adjusted to the time length of the data used divided by the number of earthquakes which happened during this time period at or above a certain Ms. Taking the Xianshuihe seismic zone as an example, 10 earthquakes happened between 1725 and 1981. The time length is 256 years (1981 minus 1725), thus the average recurrence interval is about 26 years with Ms ≥ 6.5. Likewise, the recurrence interval of each scenario for different object areas can be calculated, as shown in Table 3.

3.2. Exposure and Probability of Exposure

RISKPLAN defines the term exposure with respect to different levels of damage to human lives and material assets in a given hazard process and the scenarios defined on this basis. The exposure to disaster risks is usually measured by the population number and the GDP of the disaster-prone area data [11,54,55,56], with the most basic socio-economic statistical indicators. In this study, however, RISKPLAN offers the possibility to distinguish several exposure situations in which the number of exposed persons varies over time.
In order to calculate the probability of hazard exposure as a percentage, especially for an earthquake risk, the spatial factors indoor or outdoor are the most important indicators for earthquake risk assessment. The probability of being indoors or outdoors is affected by temporal factors as shown in Figure 2. Usually, the probability is higher that people are indoors than outdoors. At night, people are usually sleeping and cannot immediately respond to an earthquake disaster. Furthermore, it is relevant whether an earthquake happens on a working day, a weekend, or a holiday. This will have an influence on the probability that people are either more or less affected.
Based on the above analysis, this study examines the population in urban areas and the following assumptions and descriptions are elaborated as the basis for calculating the probability of exposure to earthquake risks:
  • The amount of time people spend working is considered to be eight hours per day plus two hours for commuting. The amount of daytime is assumed to be 10 h, while nighttime is taken as 14 h. Therefore, daytime accounts for 41.57% of one day and nighttime accounts for 58.33%.
  • Daytime is divided into two categories: daytime on workdays and daytime on weekends and holidays. During the week, people will work indoors during eight hours and commute outdoors for about two hours. The probability that people are indoors on workdays at daytime is 80%, while that of being outdoors is 20%. For daytime on weekends and holidays, people are assumed to be indoors or outdoors at 50%.
  • At night, most people will be indoors, no matter whether it is a workday or weekend, or holiday. Generally, when people are indoors at nighttime, they will take more time to respond to an abrupt earthquake disaster than during the daytime.
  • National legal holidays in China comprise New Year’s Day (1 day), Spring Festival or Lunar New Year Holiday (3 days), Tomb-sweeping Day (1 day), International Labor Day (1 day), Dragon Boat Festival (1 day), Mid-autumn Festival (1 day), and National Day (3 days), adding up to 11 days per year. As there are 52 weeks in a year, and a weekend has two holidays, Saturday and Sunday, that makes 104 days a year. In all, there are 115 days of weekends and holidays a year in China and that accounts for 31.5%, while that of workdays accounts for 68.5%.
The probability of different situations can be calculated and the results are summarized in Table 4.
Random variable X describes the probability that people are exposed at daytime (X1) or nighttime (X2) when the earthquake happens, whereas Y represents the probability that people are indoors (Y1) or outdoors (Y2).
In Table 5, the extent of exposure or the probability of exposure goes from low to high: outdoors at daytime, indoors at daytime, and indoors at nighttime. It is easier for people to leave their rooms and houses than to be evacuated outdoors, and people will be more clear-headed at daytime than at nighttime to respond more quickly to an earthquake disaster. However, the above analysis is suitable for the exposure of the population but not for the assets. The exposure of assets mostly depends on the seismic resistance capacity of the building, but this cannot be taken into account methodologically in RISKPLAN.
The probability of exposure needs to be measured by the extent of exposure, depending on the time and location that may not have an impact on the exposure probability of assets. As a result, this study only takes the exposure probability of people into account. Thus, the higher the probability or extent of exposure, the higher the risk would be when facing the same earthquake magnitude. Based on the statements given above, the three exposure courses in RISKPLAN are defined as follows:
  • Normal course: people are outdoors during daytime; warnings and evacuations are successful, and probability of exposure and risk is lower
  • Unfavorable course: people are indoors at daytime; warning and evacuation are only partly successful, resulting in an increased probability of exposure and increased risk
  • Disastrous course: people are indoors at nighttime; warning and evacuation fail, leading to a higher probability of exposure and higher risk
The defined exposures apply for all scenarios associated with a hazard process. A relative probability of exposure must be specified as a percentage for each defined exposure. This expresses how often the defined exposures may be expected. The sum of the probabilities of the defined scenarios must add up to 100%. Thus, the exposure probability of assets of each of these three courses accounts for the same percentage, that is 33%.

3.3. Defining the Extent of Damages

Because there is a lack of historical data, only the most recent earthquake death toll and material damage data were taken into account, going back only as far as the founding of the People’s Republic of China in 1949 (Table 1). For each area, the minimum and maximum numbers of the death toll and the cost of material damages were calculated and are shown in three categories, corresponding to the three scenarios: 0 to minimum value; minimum value to average value; and average value to maximum value, as shown in Table 5.
The minimum and maximum values of every exposure that correspond to all three scenarios were input into RISKPLAN and further calculated by multiplying the corresponding probability of normal, unfavorable, and disastrous risk exposure courses.

3.4. Definition of Risk Reduction and Mitigation Measures

RISKPLAN aims to measure the cost-effectiveness of risk reduction and mitigation measures and to decide whether the measures taken can effectively reduce a potential risk so that decisions can be made once the possible earthquake happens in the future. Due to the lack of detailed data, a simple analysis was made to measure earthquake risk reduction and mitigation. After the Wenchuan earthquake, Sichuan Province invested CNY 644 million to establish an Integrated Disaster Relief and Emergency Command System (IDRECS) to be put into operation in 2012. Another CNY 834 million were spent to build a Disaster Relief Material Reserve System (DRMRS), comprising 89 disaster relief material reserve warehouses. An additional CNY 1334 million were invested in building 89 disaster emergency shelters (DESs) [57]. The application was depicted as follows:
  • The lifecycle of each measure is assumed to be 30 years, which corresponds to the average service life of each measure;
  • The annual maintenance and operating costs account for 50% of the total depreciation expense, respectively;
  • The depreciation rate is calculated by the reciprocal value of anticipated service life (30 years in this study) multiplied by 100%, that is 3.33%.
The total costs are normalized to year 2017 and are shown in Table 6.

4. Study Results

4.1. Earthquake Risk in Sichuan Province

In this study, willingness to pay for an averted fatality is valued at CNY 5 million [58]. A willingness to pay for saving a human life is defined as the maximum sum that society is prepared to invest to prevent a fatality. This amount does not refer to the value of life itself, but to society’s willingness and financial capacity to calculate a possible death toll. Based on the assumed values, the total risk, including death toll and loss of material assets, can be measured in monetary terms. Figure 3 shows that the total annual earthquake risk of Songpan-Longmenshan, including both death toll and material asset losses, accounts for 90.22% of the total annual risk of Sichuan Province, which is the highest of the three seismic zones of Sichuan Province, followed by that of Xianshuihe and Anninghe-Zemuhe. Moreover, the results in Figure 3 indicate that there are big gaps in earthquake risks between Songpan-Longmenshan and the other two zones. This is due to active seismic activities in recent years (e.g., Wenchuan, Lushan, and Jiuzhaigou earthquakes happened in 2008, 2013 and 2017, respectively), while the population and economy experienced a rapid development over the past 40 years. In Anninghe-Zemuhe and Xianshuihe, the last earthquake events happened before the early 1980s, when the province was not as economically developed. Furthermore, Figure 4 shows the composition of total annual earthquake risk in Sichuan Province. For Xianshuihe and Anninghe-Zemuhe, the human damage is higher than the material damage, whereas the opposite holds for Songpan-Longmenshan. It is the same for Sichuan Province because of the highest proportion of annual earthquake risk indicated by Songpan-Longmenshan, as shown in Figure 3.
Figure 5 shows a frequency-number diagram representing the relationship between the annual probability of occurrence and the extent of damage of a certain region. This diagram is generated by ranking the hazard scenarios and the associated extent of damage. The presentation of the sum of the probabilities of the scenarios (cumulative probability) with the associated extent of damage produces a step function. It is possible to derive from this probability scale diagram the probability with which a certain extent of damage will be reached or exceeded [50]. Figure 5a–c represents the probability scale diagrams of each seismic zone, respectively; Figure 5d describes the relationship between annual probability of occurrence and extent of damage in Sichuan Province. In the diagram of Sichuan Province, the probability of occurrence that the extent of damage reaches CNY 1000 billion is approximately 0.3%. Similarly, when the extent of damage reaches 10 million CNY, the probability of occurrence is approximately 7%. All the diagrams also indicate that the probability of occurrence is decreasing with the increasing extent of damage.

4.2. Cost-Effectiveness of Reduction and Mitigation Measures

The cost-effectiveness is the ratio of the degree of risk reduction of mitigation measures and the costs of these measures. The higher the value of the cost-effectiveness, the more effective the measures may be. Other factors that alter the effectiveness of risk-reduction decisions include the probability of exposure and the extent of damage after risk reduction and mitigation measures have been taken. If the occurrence interval is changed, the effectiveness of the risk reduction decisions will be different.
With regard to the three risk reduction and mitigation measures, IDRECS could implement comprehensive emergency command work as soon as the earthquake occurs; DRMRS could guarantee to carry out the rescue work in a timely and efficient manner to a certain extent, and indirectly reduce the vulnerability of the exposed people and property in the case of the limited seismic capacity of buildings; with respect to the DESs, when an earthquake occurs, people could know the safe evacuation points to avoid the injuries and deaths caused by the collapse of buildings, which would reduce the exposure of people. The three measures may be helpful in reducing the probability of exposure; however, it is difficult to get empirical data to verify the effect of implementing the three measures. Therefore, in this study, the probability of disastrous and unfavorable courses are roughly assumed to be lower than that of the initial situation, whereas the probability of the normal course is roughly assumed to increase to a percentage that is equal to the sum of the probability reduction of the former two courses (e.g., if the probabilities of disastrous and unfavorable courses decrease by 2%, respectively, then the probability of the normal course increases by 4%). When the earthquake risk reduction and mitigation measures are the same in the three seismic zones, risk reduction and benefit/cost ratio can be calculated (see Table 7). In Table 7, the annual costs are calculated by RISKPLAN using the input data in Table 6. The study results show that the higher the zone risk, the more beneficial it is to take risk reduction and mitigation measures, and the most effective zone for these investments is Songpan-Longmenshan, followed by Xianshuihe and An’ninghe-Zemuhe. Moreover, among the three risk reduction and mitigation measures, IDRECS is more cost-effective than the other two, followed by DRMRS and DES. This points out the direction for decision makers that integrated and systematic risk management may be more favorable than single measures to reduce and mitigate disaster risk.

5. Discussion and Conclusions

The recent debate among the scientific community on the assessment of risk or loss using earthquake modeling software has highlighted the methodological divide between probabilistic and deterministic seismic hazard analyses which are mostly used worldwide. Decision-making processes are a societal necessity and one form of institutional adaptation to increase risk perception and concern about the detrimental effects of natural disasters like earthquakes [14,59,60]. The recent history of major earthquakes in Sichuan Province deserves greater political attention and a respective mitigation investment debate. The simple cost-effectiveness calculations that we made for the three seismic zones of Sichuan provide a possibility to show whether the measures or risk reduction strategies are economically viable, and this economic criterion is one of probably several decision-making factors that have to be taken into account to determine concrete administrational actions and the costs involved. In addition, the results of the earthquake risk assessment are affected by a variety of uncertainties present in the whole risk assessment process. These uncertainties inevitably originate from many assumptions (e.g., assumptions used for deriving monetary values of death toll and probability of exposure) and input data choices (e.g., processing of incomplete GDP and population data) that had to be made in order to complete earthquake risk analysis in Sichuan. The uncertainties are not considered in RISKPLAN; however, it will be certainly be beneficial to include uncertainty in future research.
Hazards are caused by nature, but are amplified by the increasing socio-economic exposure to risks with costly assets. As an ongoing process of economic development and growth, it will inevitably lead to high investments in risk reduction and mitigation measures in a technology-based industrial or post-industrial society. It has become imperative that the societal robustness to seismic risks and natural hazards be substantially improved, and if ever so, by readily available decision-making tools, such as RISKPLAN, which allow for pragmatic decisions that reduce the complexity of natural hazard events.
Sichuan Province is located in an earthquake-prone area of China; meanwhile, its booming regional economy of great national importance and high population growth rate exacerbate its exposure to earthquake risk. Decision-making authorities are faced with the need to justify huge risk prevention investments in population security and the built environment with the help of a simple and readily available decision-making tool. What they need is a macro-economic risk assessment instrument that tackles the expected losses of an earthquake event at a rather high level of abstraction.
Compared to many other probabilistic or deterministic approaches that are currently applied in the scientific hazard and risk assessment modeling debate, RISKPLAN is more of a multi-criteria process that tries to generate operational solutions. Its value, according to their inventors, lies in its simplicity and ability to reduce complex problems for regional and local decision makers, politicians, and senior administrators who must cope with earthquake calamities at an often down-to-earth pragmatic level. The results obtained by the RISKPLAN calculation tool may perhaps help them to convince the public of the high degree of cost-effectiveness in implementing necessary coping measures at costs which are acceptable to decision makers at all levels and the wider public.

Author Contributions

Y.S. designed the study, performed the research, and analyzed all the data; Y.S. wrote the major parts of the manuscript; and K.S. conducted the analysis of the research results, prepared the concluding remarks and discussion, and edited and revised the manuscript.

Funding

This research received no external funding.

Acknowledgments

We would like to thank P. Greminger for guidance and help with using RISKPLAN.

Conflicts of Interest

The authors declare no conflict of interest.

References

  1. Zheng, T.Y.; Zheng, Y. Review of earthquake damage losses in mainland China in 2011. J. Nat. Disasters 2012, 21, 88–97. (In Chinese) [Google Scholar]
  2. Chen, T.; Zheng, T.Y. Review of Earthquake Damage Losses in Mainland China in 2015. J. Catastrophol. 2016, 31, 133–137. (In Chinese) [Google Scholar]
  3. Lin, X.Y.; Zheng, T.Y.; Wen, X.T. Review of Earthquake Losses in Mainland China in 2017. J. Inst. Disaster Prev. 2018, 20, 52–58. (In Chinese) [Google Scholar]
  4. United Nations Office for Disaster Risk Reduction (UNISDR); Centre for Research on the Epidemiology of Disasters (CRED). Economic Losses, Poverty and Disasters 1998–2017; UNISDR: Geneva, Switzerland, 2018; pp. 6–13. [Google Scholar]
  5. Qiu, T. General Reinsurance (GenRe), Shanghai. A Decade of Direct Economic Losses from NatCat Perils in China: What Does the Future Hold? 2017. Available online: http://media.genre.com/documents/pmint1709-2-en.pdf (accessed on 12 November 2018). (In Chinese).
  6. Ministry of Natural Resources of the People’s Republic of China (MNRPRC). China’s Major Seismic Zones. 2010. Available online: http://www.mlr.gov.cn/wskt/zykx/201004/t20100415_715225.htm (accessed on 18 September 2018). (In Chinese)
  7. United Nations Office for Disaster Risk Reduction (UNISDR). Making Development Sustainable: The Future of Disaster Risk Management; 2015 Global Assessment Report on Disaster Risk Reduction; UNISDR: Geneva, Switzerland, 2015. [Google Scholar]
  8. Thomalla, F.; Boyland, M.; Johnson, K.; Ensor, J.; Tuhkanen, H.; Swartling, Å.G.; Han, G.Y.; Forrester, J.; Wahl, D. Transforming development and disaster risk. Sustainability 2018, 10, 1458. [Google Scholar] [CrossRef]
  9. United Nations Office for Disaster Risk Reduction (UNISDR). Sendai Framework for Disaster Risk Reduction 2015–2030; UNISDR: Geneva, Switzerland, 2015. [Google Scholar]
  10. Allen, S.K.; Barros, V.; Burton, I.; Campbell-Lendrum, D.; Cardona, O.-D.; Cutter, S.L.; Dube, O.P.; Ebi, K.L.; Field, C.B.; Handmer, J.W.; et al. Section II: Summary for Policymakers. In Managing the Risks of Extreme Events and Disasters to Advance Climate Change Adaptation. A Special Report of Working Groups I and II of the Intergovernmental Panel on Climate Change (IPCC); Field, C.B., Barros, V., Stocker, T.F., Qin, D., Dokken, D.J., Ebi, K.L., Mastrandrea, M.D., Mach, K.J., Plattner, G.-K., Allen, S.K., et al., Eds.; Cambridge University Press: Cambridge, UK; New York, NY, USA, 2012; p. 5. ISBN 978-1-107-02506-6. [Google Scholar]
  11. United Nations Office for Disaster Risk Reduction (UNISDR). Terminology on Disaster Risk Reduction; UNISDR: Geneva, Switzerland, 2009; pp. 9–30. [Google Scholar]
  12. Burton, C.G.; Silva, V. Assessing Integrated Earthquake Risk in OpenQuake with an Application to Mainland Portugal. Earthq. Spectra 2016, 32, 1383–1403. [Google Scholar] [CrossRef]
  13. Corbane, C.; Hancilar, U.; Ehrlich, D.; De Groeve, T. Pan-European seismic risk assessment: A proof of concept using the Earthquake Loss Estimation Routine (ELER). Bull. Earthq. Eng. 2017, 15, 1057–1083. [Google Scholar] [CrossRef]
  14. Erdik, M. Earthquake risk assessment. Bull. Earthq. Eng. 2017, 15, 5055–5092. [Google Scholar] [CrossRef]
  15. Abrahamson, N. Seismic hazard assessment: Problems with current practice and future developments. In Proceedings of the 1st European conference on earthquake engineering and seismology, Geneva, Switzerland, 3–8 September 2006. [Google Scholar]
  16. Crowley, H. Earthquake Risk Assessment: Present Shortcomings and Future Directions. In Perspectives on European Earthquake Engineering and Seismology; Ansal, A., Ed.; Springer: Cham, Germany, 2014; Geotechnical, Geological and Earthquake Engineering; Volume 34, pp. 515–532. ISBN 978-3-319-07117-6. [Google Scholar]
  17. United Nations Office for Disaster Risk Reduction (UNISDR). Words into Action Guidelines: National Disaster Risk Assessment; UNISDR: Geneva, Switzerland, 2017. [Google Scholar]
  18. Cornell, C.A. Engineering seismic risk analysis. Bull. Seism. Soc. Am. 1968, 58, 1583–1606. [Google Scholar]
  19. Silva, V. Critical issues on probabilistic earthquake loss assessment. J. Earthqu. Eng. 2018, 22, 1683–1709. [Google Scholar] [CrossRef]
  20. Ministry of Housing and Urban-Rural Development of the People’s Republic of China (MOHURD). GB 50011-2010 Code for Seismic Design of Buildings; China Architecture & Building Press: Beijing, China, 2010; p. 146. ISBN 1511228896. (In Chinese) [Google Scholar]
  21. China Earthquake Administration (CEA). GB18306-2015 Seismic Ground Motion Parameters Zonation Map of China; Standards Press of China: Beijing, China, 2016; p. 2. ISBN 155066.1-51970. (In Chinese) [Google Scholar]
  22. Yepes-Estrada, C.; Silva, V.; Valcarcel, J.; Acevedo, A.B.; Tarque, N.; Hube, M.A.; Coronel, G.; Santa Maria, H. Modeling the residential building inventory in South America for seismic risk assessment. Earthq. Spectra 2017, 33, 299–322. [Google Scholar] [CrossRef]
  23. Bal, İ.E.; Crowley, H.; Pinho, R.; Gülay, F.G. Detailed assessment of structural characteristics of Turkish RC building stock for loss assessment models. Soil Dyn. Earthq. Eng. 2008, 28, 914–932. [Google Scholar] [CrossRef]
  24. Maio, R.; Ferreira, T.M.; Vicente, R.; Estêvão, J. Seismic vulnerability assessment of historical urban centres: Case study of the old city centre of Faro, Portugal. J. Risk Res. 2016, 19, 551–580. [Google Scholar] [CrossRef]
  25. Federal Emergency Management Agency (FEMA). Using HAZUS-MH for Risk Assessment; HAZUS-MH Risk Assessment and User Group Series; FEMA: Washington, DC, USA, 2004.
  26. Bruendl, M.; Romang, H.E.; Bischof, N.; Rheinberger, C.M. The risk concept and its application in natural hazard risk management in Switzerland. Nat. Hazards Earth Syst. Sci. 2009, 9, 801–813. [Google Scholar] [CrossRef] [Green Version]
  27. Lv, D.G.; Liu, T.T.; Li, S.Y.; Jia, X.L.; Pang, J.; Yu, X.H. Probabilistic seismic hazard analysis, deaggregation and scenario earthquakes with applications to Xi’an region. Earthq. Eng. Eng. Dyn. 2018, 38, 12–21. (In Chinese) [Google Scholar]
  28. Lin, S.B.; Xie, L.L.; Gong, M.S.; Li, M. Methodology for estimating seismic capacity of city building. J. Nat. Disasters 2011, 20, 31–37. (In Chinese) [Google Scholar]
  29. Wu, W.P.; Li, L.F.; Hu, S.C.; Xu, Z.J. Research review and future prospect of the seismic fragility analysis for the highway bridges. Earthq. Eng. Eng. Dyn. 2017, 37, 85–96. (In Chinese) [Google Scholar]
  30. Nie, G.Z.; Gao, J.G.; Ma, Z.J.; Gao, Q.H.; Su, G.W. On the risk of earthquake disaster in China in the coming 10–15 years. J. Nat. Disasters 2002, 11, 68–73. (In Chinese) [Google Scholar]
  31. Wen, J.H.; Yan, J.P.; Yin, Z.E.; Meng, Q.J.; Ye, X.L. Mainstreaming Disaster Risk Management in China. Prog. Geogr. 2010, 29, 771–777. (In Chinese) [Google Scholar]
  32. Wang, X.; Zhou, H.J. Scenario analysis of regional annual earthquake disaster risk assessment. J. Catastrophol. 2015, 30, 70–74. (In Chinese) [Google Scholar]
  33. Li, M.; Zou, Z.H.; Shi, P.J.; Wang, J.A. World earthquake disaster risk assessment. J. Nat. Disasters 2015, 24, 1–11. (In Chinese) [Google Scholar]
  34. Sichuan Provincial People’s Government (SPPG). The Basic Situation of Sichuan Province. Available online: http://www.sc.gov.cn/10462/wza2012/scgk/scgk.shtml (accessed on 19 September 2018). (In Chinese)
  35. Sichuan Provincial Bureau of Statistics (SPBS). 2017 National Economy and Social Development Statistical Bulletin of Sichuan Province. Available online: http://www.sc.stats.gov.cn/sjfb/tjgb/201802/t20180228_254426.html (accessed on 6 October 2018). (In Chinese)
  36. Qu, Z.J. Historical Seismic Zones in Sichuan Province. J. Lit. Hist. 2008, 4, 106–108. (In Chinese) [Google Scholar]
  37. Tang, R.C.; Wen, D.H.; Huang, Z.Z.; Wu, X.G.; Lin, W.F.; Chen, G.X.; Wu, G. The Quaternary Activity Characteristics Several Major Active Faults in the Songpan-Longmenshan Region. Earthq. Res. China 1991, 7, 64–71. (In Chinese) [Google Scholar]
  38. Jiang, M.X. The Series of Large Earthquakes in the Chinese Longmenshan Mountain. J. Inst. Disaster-Prev. Sci. Technol. 2009, 11, 133–135. (In Chinese) [Google Scholar]
  39. Wen, X.Z.; Yi, G.X. Re-zoning of statistic units of seismicity in Sichuan-Yunnan region. J. Seismol. Res. 2003, 26, 1–9. (In Chinese) [Google Scholar]
  40. Yi, G.X.; Wen, X.Z.; Xu, X.W. Study on recurrence behaviors of strong earthquakes for several entireties of active fault zones in the Sichuan-Yunnan region. Earthq. Res. China 2002, 18, 267–276. (In Chinese) [Google Scholar]
  41. Lou, B.T. Compilation of Ancient and Modern Earthquake Disasters in China; Seismological Press: Beijing, China, 1996; ISBN 9787502813093. (In Chinese) [Google Scholar]
  42. China Earthquake Administration (CEA). 2008 China’s Land Seismic Disaster Losses Review. Available online: http://www.cea.gov.cn/publish/dizhenj/468/549/20120209143200890980157/index.html (accessed on 20 September 2018). (In Chinese)
  43. Pielke, R.A.; Rubiera, J.; Landsea, C.; Fernandez, M.L.; Klein, R. Hurricane vulnerability in Latin America and the Caribbean: Normalized damage and loss potentials. Nat. Hazards Rev. 2003, 4, 101–114. [Google Scholar] [CrossRef]
  44. Vranes, K.; Pielke, R. Normalized earthquake damage and fatalities in the United States: 1900–2005. Nat. Hazards Rev. 2009, 10, 84–101. [Google Scholar] [CrossRef]
  45. Daniell, J.E.; Wenzel, F.; Khazai, B. The Normalisation of socio-economic losses from historic worldwide earthquakes from 1900 to 2012. In Proceedings of the 15th World Conference on Earthquake Engineering (15WCEE), Lisbon, Portugal, 24–28 September 2012. Paper No. 2027. [Google Scholar]
  46. Sichuan Provincial Bureau of Statistics (SPBS); Sichuan Provincial Bureau of Statistics and National Bureau of Statistics Survey Office in Sichuan (NBSSOS). Sichuan Statistical Yearbook 2005; China Statistics Press: Beijing, China, 2005. (In Chinese)
  47. Department of Comprehensive Statistics of National Bureau of Statistics (DCSNBS). China Compendium of Statistics 1949–2008; China Statistics Press: Beijing, China, 2010; ISBN 978-7-5037-5894-2. (In Chinese)
  48. Sichuan Provincial Bureau of Statistics (SPBS). 2009–2016 National Economy and Social Development Statistical Bulletin of Sichuan Province. Available online: http://www.sc.stats.gov.cn/sjfb/tjgb/index.html (accessed on 6 October 2018). (In Chinese)
  49. Sichuan Provincial Bureau of Statistics (SPBS); Sichuan Provincial Bureau of Statistics and National Bureau of Statistics Survey Office in Sichuan (NBSSOS). Sichuan Statistical Yearbook 2017; China Statistics Press: Beijing, China, 2017. (In Chinese)
  50. Greminger, P.J.; Balmer, J.; Federal Office for the Environment (FOEN); Federal Office for Civil Protection (FOCP). RiskPlan–Identify and Assess Risks, Planning of Safety Measures. Available online: www.riskplan.admin.ch (accessed on 21 September 2018).
  51. Sieh, K.E. A review of geological evidence for recurrence times of large earthquakes. In Earthquake Prediction: An International Review; Maurice Ewing Series; Simpson, W., Rechard, G., Eds.; American Geophysical Union: Washington, DC, USA, 1981; Volume 4, pp. 181–207, ISBN-10: 0875904033. [Google Scholar]
  52. Abaimov, S.G.; Turcotte, D.L.; Shcherbakov, R.; Rundle, J.B.; Yakovlev, G.; Goltz, C.; Newman, W.I. Earthquakes: Recurrence and Interoccurrence Times. Pure Appl. Geophys. 2008, 165, 777–795. [Google Scholar] [CrossRef]
  53. Chen, P.S.; Bai, T.X.; Li, B.K. b-Value and Earthquake Occurrence Period. Chin. J. Geophys. 2003, 46, 510–519. (In Chinese) [Google Scholar] [CrossRef]
  54. Wenzel, F. Earthquake risk reduction: Obstacles and opportunities. Eur. Rev. 2006, 14, 221–231. [Google Scholar] [CrossRef]
  55. Peduzzi, P.; Dao, H.; Herold, C.; Mouton, F. Assessing global exposure and vulnerability towards natural hazards: The Disaster Risk Index. Nat. Hazards Earth Syst. Sci. 2009, 9, 1149–1159. [Google Scholar] [CrossRef]
  56. Zhang, J.Q.; Okada, N.; Tatano, H. Integrated natural disaster risk management: Comprehensive and integrated model and Chinese strategy choice. In Proceedings of the Fifth Annual IIASA-DPRI Forum on Integrated Natural Disaster Risk Management, Beijing, China, 14–18 September 2005; pp. 115–128. [Google Scholar]
  57. Sichuan Invested Nearly 30 Billion Chinese Yuan to Enhance Disaster Response Capabilities. Available online: http://www.chinanews.com/gn/2012/03-01/3710709.shtml (accessed on 6 October 2018). (In Chinese).
  58. Mei, Q.; Lu, Y.M. Assessment of the Value of Life Based on Conditional Value Method. Manag. World 2008, 6, 174–175. (In Chinese) [Google Scholar] [CrossRef]
  59. Olson, D.L.; Wu, D.D. Earthquakes and risk management in China. Hum. Ecol. Risk Assess. 2010, 16, 478–493. [Google Scholar] [CrossRef]
  60. Wang, Z.M. Seismic hazard assessment: Issues and alternatives. Pure Appl. Geophys. 2011, 168, 11–25. [Google Scholar] [CrossRef]
Figure 1. The conceptual framework of RISKPLAN for earthquake disaster risk in Sichuan.
Sustainability 11 01812 g001
Figure 2. The structure of the earthquake exposure probability analysis.
Sustainability 11 01812 g002
Figure 3. The composition of total annual risk in Sichuan Province.
Sustainability 11 01812 g003
Figure 4. The composition of total annual earthquake risks in Sichuan Province. XSH, Xianshuihe; SL, Songpan-Longmenshan; AZ, Anninghe-Zemuhe.
Sustainability 11 01812 g004
Figure 5. The annual probability of occurrence per year/extent of damage (probability scale diagram).
Sustainability 11 01812 g005
Table 1. History of earthquakes over Ms ≥ 6.5 in Sichuan Province.
Seismic ZoneHistorical EarthquakeDeath Toll
(person)
Material Damages (CNY/million at Current Prices)Data Sources
YearMs
Xianshuihe17257.2--[39]
17867.75--[41]
18167.52945-[39,41]
18937.2211-[39,41]
19047.0565-[41]
19237.254500-[41]
1955a7.5940.405[41]
19676.8390.06[41]
1973a7.621990.889[41]
19816.912632.28[41]
Songpan-Longmenshan16306.7--[39]
16576.5--[39]
17137.0--[39]
17486.5--[39,41]
19337.56865-[41]
19606.75-0.385[41]
1973b6.5--[39,41]
19767.2410.046[41]
20088.069,227845,100[42]
20137.019842,113.76EM-DAT
20177.0293375.9EM-DAT
An’ninghe-Zemuhe8147.0--[39,41]
14896.7--[39]
15367.5--[39,41]
17326.7--[39]
18507.523,860-[41]
19526.752362.206[41]
1955b6.757288.44[41]
Note: The data of death toll and material damages in 2013 and 2017 are from an international disaster database, EM-DAT (https://www.emdat.be/, accessed on 8 October 2018). The estimated damage is 6.8 US$ billion in 2013 at current prices, which is roughly 42,113.76 million CNY with an annual average exchange rate of 6.1932 CNY per U.S. dollar; similarly, in 2017, the material damage is 500 US$ million and roughly 3375.9 million CNY with an annual average exchange rate of 6.7518 CNY per U.S. dollar. The a and b are used to distinguish two different earthquake disasters that occurred in the same year.
Table 2. Normalized material damage and death toll in 2017.
Event YearCPI 1 (1952 = 100)Per capita 2 GDP/CNYPopulation 3
/million
Material Damage Normalized to 2017 CNY/billionDeath Toll Normalized to 2017/person
1816 21.436 11,406
1850 44.164 44,852
1893 47.761 367
1904 48.227 973
1923 52.547 7110
1933 55.897 10,196
1952100.06946.28526.164423
1955a105.19048.5873.338161
1955b105.19048.58769.560 1244
1960119.411848.8862.117 -
1967134.016956.0730.180 58
1973a137.919164.6361.978 2824
1973b137.919164.636--
1976140.523869.7330.075 49
1981164.133772.15630.641 145
2008830.815,49581.3803055.499 70,622
2013958.932,61781.07062.911 203
20171021.844,65183.0203.376 29
1 CPI (1952 = 100) in 1952, 1955, 1960, 1967, 1973, 1976, 1981, and 2008 are calculated based on CPI (preceding year = 100) data between 1952 and 2008 from [47]; similarly, CPI (1952 = 100) in 2013 and 2017 are calculated based on CPI (preceding year = 100) data between 2009 and 2017 from [48] and [35], respectively. 2 Per capita GDP data of Sichuan Province for 1952 and 2017 are from [48] and [35], respectively; in the absence of per capita GDP data for 1955, 1960, 1967, 1973, and 1976, the values are estimated by the available per capita GDP values between the most adjacent years from [46]; those for 1981, 2008, and 2013 are from [49]. 3 Sichuan population data for 1786, 1816, 1850, 1893, 1904, 1923, and 1933 are estimated by the values in the most adjacent year from [41]; Sichuan population data for 1952 and 1981 are from [48]; those for 2008 and 2013 are from [49]; those for 2017 are from [35]; due to the lack of population data for 1955, 1960, 1967, 1973, and 1976, the values are estimated by the available population data between the most adjacent years from [48]. The a and b are used to distinguish two different earthquake disasters that occurred in the same year.
Table 3. Average recurrence interval (years) and scenario categories of seismic zones.
Seismic ZoneScenario
1 (Ms ≥ 6.5)2 (Ms ≥ 7.0)3 (Ms ≥ 7.5)
Xianshuihe263264
Songpan-Longmenshan3565194
An’ninghe-Zemuhe163380571
Table 4. Probability of earthquake exposure.
YX
X1X2
Y10.300.58
Y20.120
Table 5. Extent of death toll (person) and material damage (billions in CNY).
Seismic ZonesDamagesScenario
Min of S1Max of S1/Min of S2Max of S2/Min of S3Max of S3
XianshuiheDeath Toll058228011,406
Material Damage00.180 9.034 30.641
Songpan-LongmenshanDeath Toll02916,22070,622
Material Damage00.075 624.796 3055.499
An’ninghe-ZemuheDeath Toll042315,50744,852
Material Damage026.164 47.862 69.560
Table 6. Costs of earthquake risk reduction and mitigation measures (CNY in 2017).
MeasureCosts (millions in CNY)
Investment Costs (IC)Annual Maintenance Costs (Cm)Annual Operating Costs (Co)
IDRECS705.43 11.75 11.75
DRMRS913.55 15.23 15.23
DES1461.24 24.35 24.35
Table 7. Cost-effectiveness of risk reduction and mitigation measures.
Seismic ZonesCost-EffectivenessRisk Reduction and Mitigation Measures
DESDRMRSIDRECS
XianshuiheAnnual costs
(millions in CNY)
1127054
Risk reduction
(millions in CNY)
1469782
Benefit/cost ratio1.301.391.51
Songpan-LongmenshanAnnual costs
(millions in CNY)
1127054
Risk reduction18211791
Benefit/cost ratio1.621.671.69
An’ninghe-ZemuheAnnual costs
(millions in CNY)
1127054
Risk reduction1167462
Benefit/cost ratio1.031.061.16

