Article

Modeling the Consumers Opinion Influence in Online Social Media in the Case of Eco-friendly Products

by
Camelia Delcea
1,*,
Liviu-Adrian Cotfas
1,
Carmen Lenuța Trică
2,
Liliana Crăciun
3 and
Anca Gabriela Molanescu
3
1
Department of Economic Informatics and Cybernetics, Bucharest University of Economic Studies, 010552 Bucharest, Romania
2
Department of Agro-Food Economics and Environment, Bucharest University of Economic Studies, 010374 Bucharest, Romania
3
Department of Economics and Economic Policies, Bucharest University of Economic Studies, 010374 Bucharest, Romania
*
Author to whom correspondence should be addressed.
Sustainability 2019, 11(6), 1796; https://doi.org/10.3390/su11061796
Submission received: 25 February 2019 / Revised: 13 March 2019 / Accepted: 21 March 2019 / Published: 25 March 2019
(This article belongs to the Section Economic and Business Aspects of Sustainability)

Abstract

:
Social influence has a positive impact on the purchase intention for eco-friendly products along with other subjective and objective aspects related to environmental attitude, product attitude, and subjective and objective knowledge. Also, exposure to media has been proven to have a significant positive affect on environmental attitude, with effect on the purchase intention. Several recent studies have shown the importance of consumers’ influence in online social networks, underlying the role played by the online environments over consumers’ attitude. As a result, the current research tries to analyze the influence exerted on consumers’ decision to purchase eco-friendly products by their activity in online social environments. Using a questionnaire, filled-in by 409 respondents, a series of variables have been extracted with regard to the eco-friendly products. An agent-based model has been created, fed with the values of the variables extracted from the questionnaire, and used for simulations. As a result, it has been observed that an increase in online media exposure can have a high positive impact on the eco-friendly product adoption. Depending on the type of product—soft or durable good—different times for the eco-friendly product adoption have been determined relatively to the considered variables. Last, the possible limitations of using an agent-based modeling approach are discussed, along with possible extensions and improvements.

1. Introduction

Environmental protection has attracted considerable attention worldwide due to the tremendous economic and population growth recorded within the last century. The need to keep a clean environment is widely acknowledge with academia and the papers analyzing the measures to be done in this context are numerous [1,2,3]. Additionally, a series of papers have addressed consumers’ attitudes towards recycling and the adoption and use of eco-friendly products [4,5,6]. Among the causes that might influence the consumers’ behavior in adopting the use of eco-friendly products, social influence is mentioned along with other subjective and objective aspects related to environmental attitude, product attitude, and subjective and objective knowledge, etc [7].
Starting from the paper written by Chen et al. [7] which proves that social influence positively affects the purchase intention in the case of green (eco-friendly) products and taking into account that the exposure to media has a significant positive affect on environmental attitude, with an effect on the purchase intention, the present study tries to analyze the consumers’ opinion influence in online social media with the respect to the purchase and use of these products. This research aims to extend the current approaches in the area of consumers’ influence by also considering the influence exerted by the “friends” a person has in online social media over that person’s intention to buy a product. Figure 1 provides an example of a post published on Facebook related to a Mexican company which produces plastic cutlery and straws from avocado seeds that are completely biodegradable in 240 days.
Several recent studies have shown the importance of consumers’ influence in online social networks [8,9,10,11,12,13]. In this context, the present study develops and validates a questionnaire for better extracting the influence exerted by online social networks’ users on the consumers’ purchase intention depending on the subjective characteristics of each person in terms of how easy to influence that person is and how much he/she can further influence other peoples’ purchase decisions. Considering the results gathered through a study which divides the purchased goods into durable and soft goods [14], which underlines different purchasing behavior depending on the type of good (soft or durable), we have divided the eco-friendly products in these two main categories and we have extracted the possible influence in each case. An agent-based model has been created in order to determine the adoption of the eco-friendly products based on their type. Additionally, we have considered the presence of different promoting campaigns for the use of the eco-friendly products in online social media and we have analyzed how this can further influence eco-friendly products’ adoption time.
The paper is organized as follows: Section 2 presents a short literature review on both recycling and eco-friendly product adoption, Section 3 presents the main characteristics of the agent-based modeling along with some models developed in different fields using this type of modeling, Section 4 highlights some of the main questions used in the questionnaire, along with the answers received and their interpretation. Also, the questionnaire’s validation is performed in Section 4. Section 5 underlines the agent-based model’s parameters and provides the simulation results. The paper ends with concluding remarks, references and an annex containing the research questionnaire.

2. Literature Review

The global population growth recorded over the past century corroborated with the rapid technological changes due both to the population growth and to the advancement made in the electronics industry had a major impact on the increased amount of solid waste. As a result, throughout the world, there have been recorded cities facing serious environmental problems. In this context, reducing waste has become one of the major solutions proposed both by the literature and by the every-day practice. Therefore, a series of researches have addressed the different types of waste and have proposed different approaches in order to minimize it.
Food waste is another area which has attracted a series of researchers related to consumers’ behavior. Over time, it has been observed that there are cases in which the consumers are buying more food than needed and are storing it incorrectly [15]. Mattar et al. [16] believe that employment, education, number of household members, and income may affect food waste volume, while Nikolaus et al. [17] analyzed the believes and behavior of young adults in relation with the food waste and concluded that this category provides evidence of heterogeneity in perceptions, believes and behaviors. Also, Corrado et al. [18] have shown that one third of the food produced globally is wasted along the food chain, while a series of studies made over different countries in the European Union, such as Italy, Germany, or Switzerland [19,20,21,22], have indicate that the households are the main contributors to food waste [19]. The environmental impacts of food waste have been studied by Scherhaufer et al. [23], while the importance of the food rituals in preventing food waste have been analyzed by Revilla and Salet [24]. Thus, the general conclusion made here is that: food waste matters [25] and environmental protection is a global concern [7].
As the volume of the studies dealing with the recycling problem is beyond a summarily literature review, we encourage the reader interested in the recycling process to read some of the review studies [26,27,28,29,30].
On the other hand, rather than focusing only on the recycling process, the consumers can also be thought to manifest a positive attitude towards buying and using eco-friendly (green) products. Although the literature has not reached a general consensus on whether consumers are considering eco-friendly products’ attributes before buying them [7,31], or whether they are willing to pay more for the eco-friendly products [32,33,34,35], these aspects are still one of the main research directions in the field. Along with them, a series of papers have addressed several issues related to investigate the factors that may influence the consumer decision over choosing the green products. Maniatis [31] states that even if consumers are informed about the concept of eco-friendly products through green marketing, green consumers are sophisticated buyers and the marketers need to pay an additional attention when defining the product specification. In his study, the author has analyzed the indicators determining the customers’ knowledge of the existence of green products and the general awareness attached to these products. Among the key influencers of customers’ selection, it can be mentioned the following: purchase price benefits, promotions, the product features, operating price benefits, and environmental awareness [31,36]. Thøgersen [36] carried a study on consumers in four European countries and concluded that consumers value common benefits of the green products in addition to their selfish benefits.
In a recent study, Chen et al. [7] analyzed the main triggers to purchasing green products and concluded that environmental attitude, product attitude, perceived monetary value, and social influence affect positively the purchase intention. The positive connection between the social influences and the intention to purchase green products has been also underlined by [37,38].
With respect to the factors influencing consumer behavior related to the purchase of green products, Khan and Mohsim [39] mentioned social value in addition to brand awareness, conditional and functional value, and environmental and knowledge value. Social value is defined, in this context, as “the perceived utility of product or service associated with specific social, demographic, socioeconomic, or cultural groups” [40]. Sweeney and Soutar [41] believe that the social value of a green product is related to self-image.
Other studies in the area of consumers’ intention to purchase eco-friendly products are the ones conducted by Hussain et al. [42] and Akbar et al. [43], while a more in-depth analysis of the papers in this area can be found in Khan and Mohsin [39].

3. Agent-Based Modeling

While a model is defined as a “simplified representation of the reality” [44], modeling is the process through which one can create mathematical and /or conceptual frameworks for describing the analyzed phenomenon / phenomena. In literature, there are basically two approaches with regard to the modeling process: equation-based modeling (EBM) and agent-based modeling (ABM).
Over the time, the EBM approach has been extensively used in economic applications as it allows a straight-forward causality in which some variables within the model directly influence or cause another variable in the model. In this case, the interactions among the main actors within the model were seen as continuous and the use of EBM has been strictly connected to a good knowledge of the differential equations along with a good understanding of the aggregate behavior [45].
Recently, the ABM approach has received increasing interest in the area of economic modeling as, through the means and tools it provides, if offers a proper framework for shaping the indirect causation that might appear within a model due to the presence of the emergence phenomenon. Another advantage brought by the ABM approach is that it only requires the knowledge of the commonsense behavior of the entity under investigation and does not require an advanced calculus knowledge. Regarding the type of interactions, these are discrete in the case of ABM and this can be considered a plus brought by this type of modeling rather than as a disadvantage as it is considered to better summarize the interactions from the real world [44].
The well-known “nano-wolf” problem is solved through the use of the ABM. This approach is preferred instead of the classical use of EBM combined with the assumptions of large population size and unimportant special effects [44,46,47,48].
Even outside academia, the importance and usefulness of ABM was acknowledged. In 2010, Trichet, the former president of the European Central Bank said: “When the crisis came, the serious limitations of existing economic and financial models immediately became apparent. Arbitrage broke down in many market segments, as markets froze, and market participants were gripped by panic. Macro models failed to predict the crisis and seemed incapable of explaining what was happening to the economy in a convincing manner. As a policy-maker during the crisis, I found the available models of limited help. In fact, I would go further: in the face of the crisis, we felt abandoned by conventional tools. The atomistic, optimizing agents underlying existing models do not capture behavior during a crisis period. We need to deal better with heterogeneity across agents and the interaction among those heterogeneous agents. We need to entertain alternative motivations for economic choices. Behavioral economics draws on psychology to explain decisions made in crisis circumstances. Agent-based dispenses with the optimization assumption and allows for more complex interactions between agents. Such approaches are worthy of our attention” [44].

3.1. Examples of Agent-Based Modeling Applications

As the ABM models proposed over the time are covering a large array of research fields, we have selected in the following only the papers which have created and simulated ABM using NetLogo.
The decision to present papers addressing only the use of NetLogo platform is strictly related to the fact that the model developed in our paper is using the same platform. Nevertheless, there are a series of other platforms both free and with payed license which can be used for this type of modeling, each of them having a series of advantages and disadvantages. For a complete picture and a comparison in terms of pros and cons of some of the most well-known ABM software, one can read more in [44,49,50,51,52].
In the area of environmental sciences, West et al. [53] have analyzed the importance of cost increase and revenue decrease in the case of agriculture and deforestation. The authors have presented a case study on a land located near an old deforestation frontier in the Brazilian Amazon. As a result, the authors have stated that without the payments, the land-use at equilibrium will show a complete conversion of forest to agricultural land.
The dynamic of soil organic matter has been modeled and simulated in NetLogo by Banitz et al. [54]. In their paper, the authors have considered the the mineralization of soil carbon and nitrogen, with direct effects in increasing the understanding level in the field.
Other papers from the environmental sciences area have featured elements related to: agro diversity in agro-ecosystems [55], indirect effect of climate change [56], complex human–aquifer interactions in managed groundwater systems [57], relationship between industrial firms, high-carbon, and low-carbon energy [58], modeling effectiveness of management practices for flood mitigation [59], the fire effect on a forest ecosystem [60], studying the population–environment relationship in the Galapagos Islands [61].
In the area of transportation management, ABM has been used by Gao et al. [62] for evaluating the carrying capacity of a high speed railway and based on the simulations it has been determined that using an adjustment strategy based on the delay times of each train, the carrying capacity of the considered route, namely Beijing–Shanghai, can be increased from 55 to 77 trains per day. Riaz et al. [63] have proposed a collision avoidance scheme for autonomous vehicles inspired by human social norms which has underlined the advantages brought by the use of an autopilot. Also, related to the car movement in a parking lot, Vo et al. [64] have proposed an ABM in NetLogo and have concluded that pedestrians, drivers’ experience and expectations, parking location, speed limit, and maximum parking duration have direct effects on the parking efficiency and safety. Airplane boarding techniques have been studied extensively through a series of models developed in NetLogo [65,66].
Population dynamics is a common field in which the advantages brought by the ABM have been intensively used. Some papers from this area are addressing the issue of: tsunami-evacuation modeling [67], crowd and household evacuation [68,69,70], and classroom and hospital evacuation [71,72,73].
Other applications include: consumers’ behavior in online social networks [45,74] and consumers’ satisfaction [75], information diffusion in social networking [76], learning [77,78,79,80,81,82,83,84], management and decision making [85], and resources allocation [86].

3.2. The Properties of the Agents

At the base of any ABM model, there is the agent, a computational entity that “possess the state variables and values which enables it to act similar to the entities it models” [44].
According to Wooldridge and Jennings [87], the main properties of the agents can be summarized through eight characteristics:
  • Autonomy—the agents’ property of performing most of their tasks without human direct intervention;
  • Social ability—the agents interact with other agents and humans;
  • Responsiveness—the agents perceive the environment and act accordingly;
  • Proactiveness—the agents should be able to exhibit goal-directed behavior and, if needed, they should take action;
  • Adaptability—the agents are able to modify their behavior in response to the changes in environment;
  • Mobility—the agents are able to explore the environment;
  • Veracity—once created, the agents cannot communicate false information;
  • Rationality—the agents act for achieving their goals.
Later on, Getchell [88] put under question some of the above properties and stated that rather than a “rationality” property, the agents should have a “bounded-rationality” characteristic which will allow them to act more “humanly”. Thus, the experimental evidence in different fields has showed that the non-optimal decisions are often closer to reality [44] and, in order to increase the predictive power of the ABM models, the agents should be constraint in “terms of resources or analytical ability” [44,88].

4. Consumer Influence

In order to build the agent-based model in NetLogo, a questionnaire has been conducted on the purpose of extracting the humans’ characteristics which will allow us to make the model as close as possible to the actual consumers’ behavior.
Briefly, the steps considered in the research have been:
Step 1: understanding the main triggers consumers are using when deciding the type of product they are buying based on the current literature;
Step 2: creating and validating the questionnaire used for the extracting the consumers’ behavior in the case of eco-friendly products;
Step 3: extracting and analyzing the data gathered through the questionnaire;
Step 4: determining the main characteristics of the agents based on the analyzed data in Step 3;
Step 5: creating, calibrating, and validating the agent-based model in NetLogo;
Step 6: simulating the consumers’ behavior using the agent-based model and analyzing the data with respect to the types of eco-friendly products considered.

4.1. Gathering the Data Throught a Questionnaire

A questionnaire has been created and made available online in order to extract the needed data for creating the agents in NetLogo. The questionnaire has considered the research conducted by Chen et al. [7] which have used a questionnaire for exploring the Belt and Road countries customers’ intention to purchase green products. A series of questions presented in our questionnaire have followed the guidelines proposed by Chen et al. [7], while others have been created from the scratch on the purpose of better extracting the influence faced by the consumers from online social networks.
Besides the questions related to age, gender, social status, a series of questions related to perception and attitudes towards eco-friendly products and environment have been addressed, along with questions related to social influence in online environments.
The questions have been grouped in 7 categories: Knowledge Degree (KD), Environmental Awareness (E-AW), Environmental Attitude (E-AT), Online Media Exposure (OME), Online Social Influence–Power to Influence (OSI–PI), Online Social Influence–Susceptibility to be Influenced (OSI–SI) and Buying Intention and Decision (BID). The Appendix A, at the end of the paper, is presenting the questions from each of the mentioned category. For each question belonging to one of the seven considered categories, the answers have been counted using a 5-point Likert scale (with 1 = strongly disagree and 5 = strongly agree).
As mentioned at the beginning of the paper, we have divided the eco-friendly products into two main categories: durable and soft goods, each one of these categories containing specific products such as:
  • Durable goods: electronics, intelligent lighting systems, intelligent heating systems, electric cars, green houses, etc.;
  • Soft goods: natural cosmetics, natural laundry, compostable cutlery, eyewear made from natural materials, natural cleaning products, watches made out of sustainable materials, dish towels, reusable coffee filters, reusable tea bag, rechargeable batteries, fabrics colored with vegetable dye or with natural paintings, products made out of recycled material, etc.
Considering these two categories, the respondents have been asked to think of a product belonging to any of them and to answer to the some additional questions as follows (this has been done in order to extract the influences exhibited in each of the two considered cases): first, the respondents have been asked to record how many times during a month they have been engaged in conversation on social networks related to the eco-friendly products and how often in a month, on average, they read or see advertises in online social space related to the use and advantages of the eco-friendly products. Second, the respondents have been asked with how many friends (who advocate the use of a particular good or service) they have to discuss, before they decide to buy that product and how many commercials or articles related to a particular good they have to see before deciding to buy it. The answers to all these questions are analyzed in the second part of this section.
A number of 409 valid questionnaires have been filled-in between 10 December 2018—20 January 2019.
For validating the questionnaire, a confirmatory factor analysis has been performed in IBM SPSS AMOS 22.0.0. The construction under analysis is presented in Figure 2.
The questionnaire has passed the content validity test as the measures within the questionnaire are expressed in the same unit of measure (Likert-scale in our case) and they are in accordance with the literature attached to this field [89].
The construct validity has been tested through a series of aspects as presented in the following:
  • Uni-dimensionality—is tested through the values recorded for the standardized regression weights. In order to validate the construct uni-dimensionality, all the values for these factor loading should be at least 0.5. A value closer to 0.7 or greater is preferred. Table 1 presents the values for the standardized regression weights. It can easily be observed that all the values are greater than 0.5, most of them being greater than 0.7. Thus, the uni-dimensionality is fulfilled.
  • Feasibility and convergent validity—is tested through the values determined for average variance extracted (AVE) and construct reliability (CR). As IBM SPSS Amos 22.0.0 does not provide the values for these indicators, we have determined them manually based on the formulas provided by Spanos and Lioukas [90]. Usually, a CR greater than 0.7 suggests a good feasibility (in some cases, even a value between 0.6 and 0.7 is considered acceptable) [91]. In our case, all the values recorded for CR are above 0.877 (see Table 1), indicating a good feasibility. As for the AVE, a value of 0.5 or greater indicates a good convergent validity. If the value is significantly under the threshold of 0.5, then the error in each factor is greater than the variance explained by that factor and the model does not present a good convergent validity. In our case (Table 1) the smallest value recorded for AVE is 0.529, which is above the imposed threshold of 0.5, demonstrating a good convergent validity.
  • Similarity validity—is performed through the goodness of fit (GOF). In order to validate the similarity, first, the residuals covariances matrix is considered—all the values within this matrix should be under the value of 4.0. In our case, the highest value in this matrix is 3.524, which is below the threshold of 4.0, indicating a good validity. Second, the indicators listed by IBM SPSS AMOS 22.0.0 under the “Model fit summary” output section are investigated in order to confirm that the similarity validity is passed. Table 2 presents the values calculated for the minimum discrepancy over the degrees of freedom (CMIN/DF). This value should be smaller than 5.0, a smaller value being preferred. In our case (Table 2) the CMIN/DF is equal to 2.220 < 5.0, which makes us believe that the model similarity is validated.
Also, the comparative fit index (CFI), which is an adjustment incremental index should be above the threshold of 0.9 in order to validate the questionnaire. In our case, a value of 0.951 is recorded, confirming the questionnaire validity (see Table 3). Additionally, the values of the normed fit index (NFI), relative fit index (RFI), and incremental fit index (IFI) can be considered for double-check. As the values of these indicators are approaching 1, it can be concluded that the questionnaire is valid. In our case, we have good values for these indicators, namely 0.915, 0.888 and 0.951, underlying once more the validity of the questionnaire (see Table 3). Brown [92] and Byrne [93] recommend a supplementary analysis of the Tucker–Lewis index (TLI) which should be as close as possible to the value of 0.95. In our case the TLI is 0.935, which is close to the recommended value and sufficient with regard to the dimension of the questionnaire.
The last set of indicators from the goodness-of-fit category are represented by the root mean square error of approximation (RMSEA) and the values of LO90 and HI90. According to Hu and Bentler [94], Harrington [95], and Paswan [96] a RMSEA below 0.06 signifies a good model fit. In our case, RMSEA is 0.055 < 0.06 (see Table 4), showing a good model fit. Even more, the confidence interval for RMSEA (of 90%) is located between LO90: 0.048 and HI90: 0.061, none of these values overpassing the threshold value of 0.085 imposed by Paswan [96].
Based on all the elements described above, we can conclude that the questionnaire is validated.
Next, we shall analyze some of the answers received to the questions.

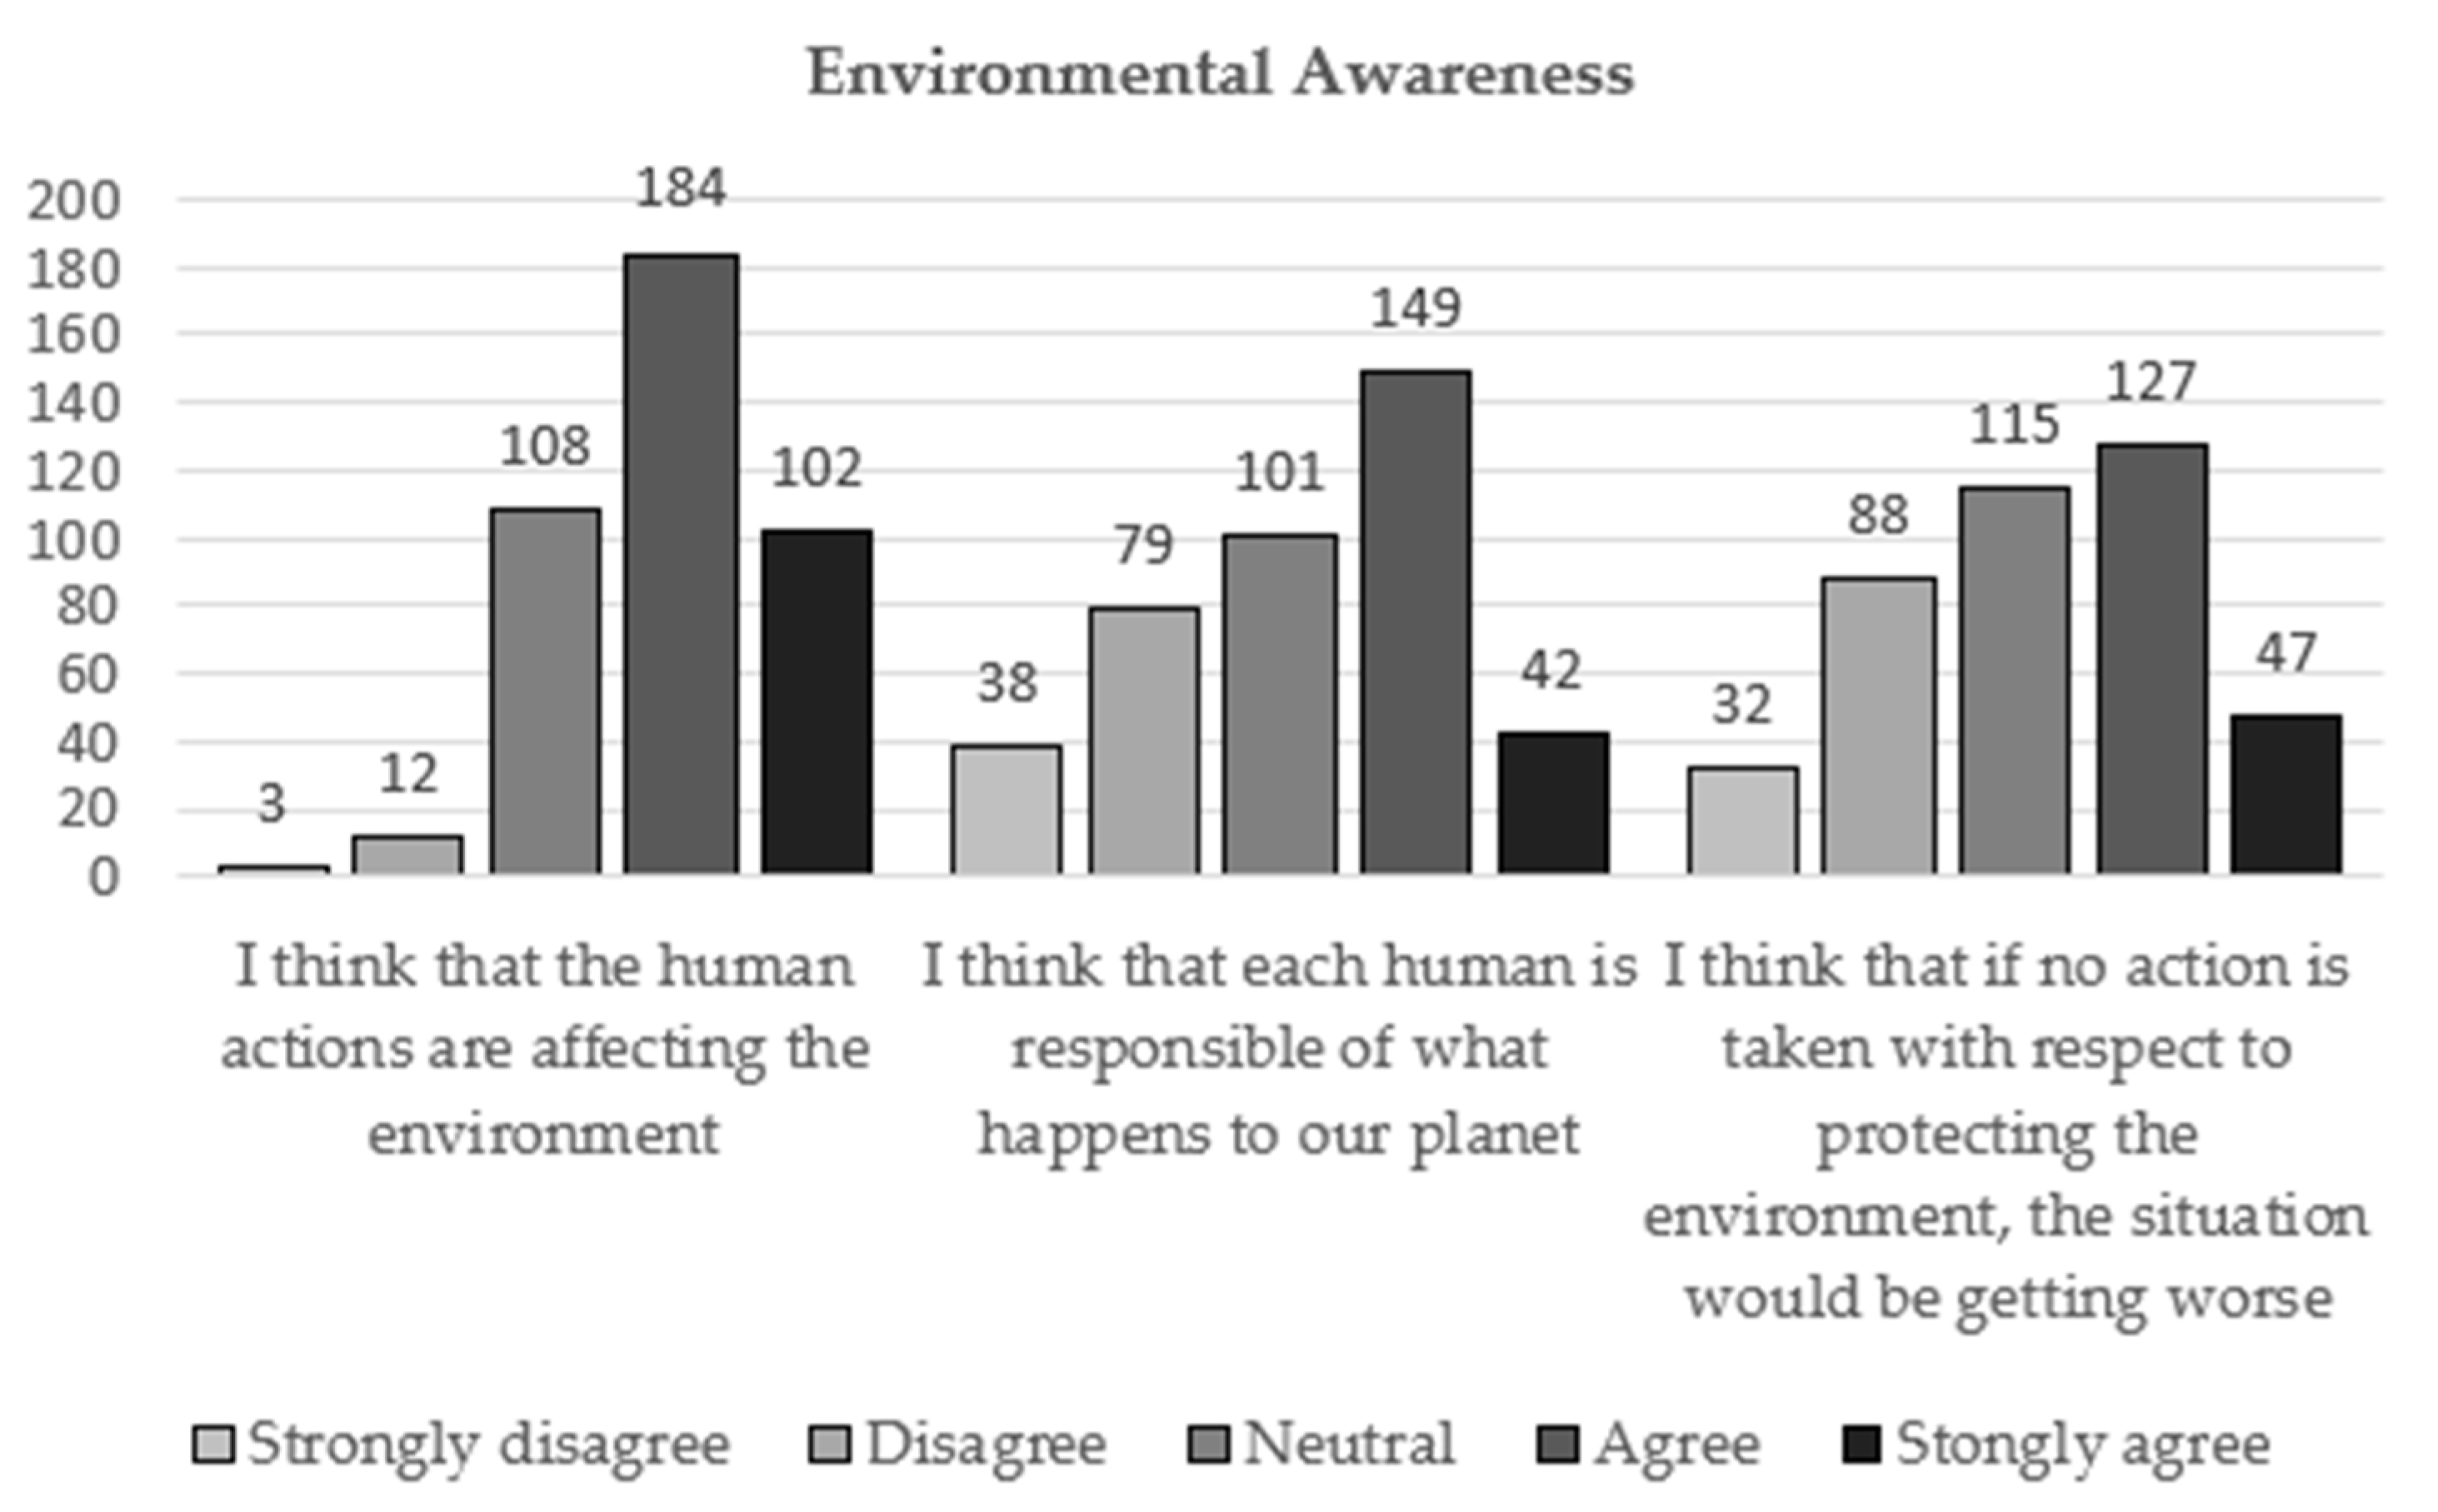
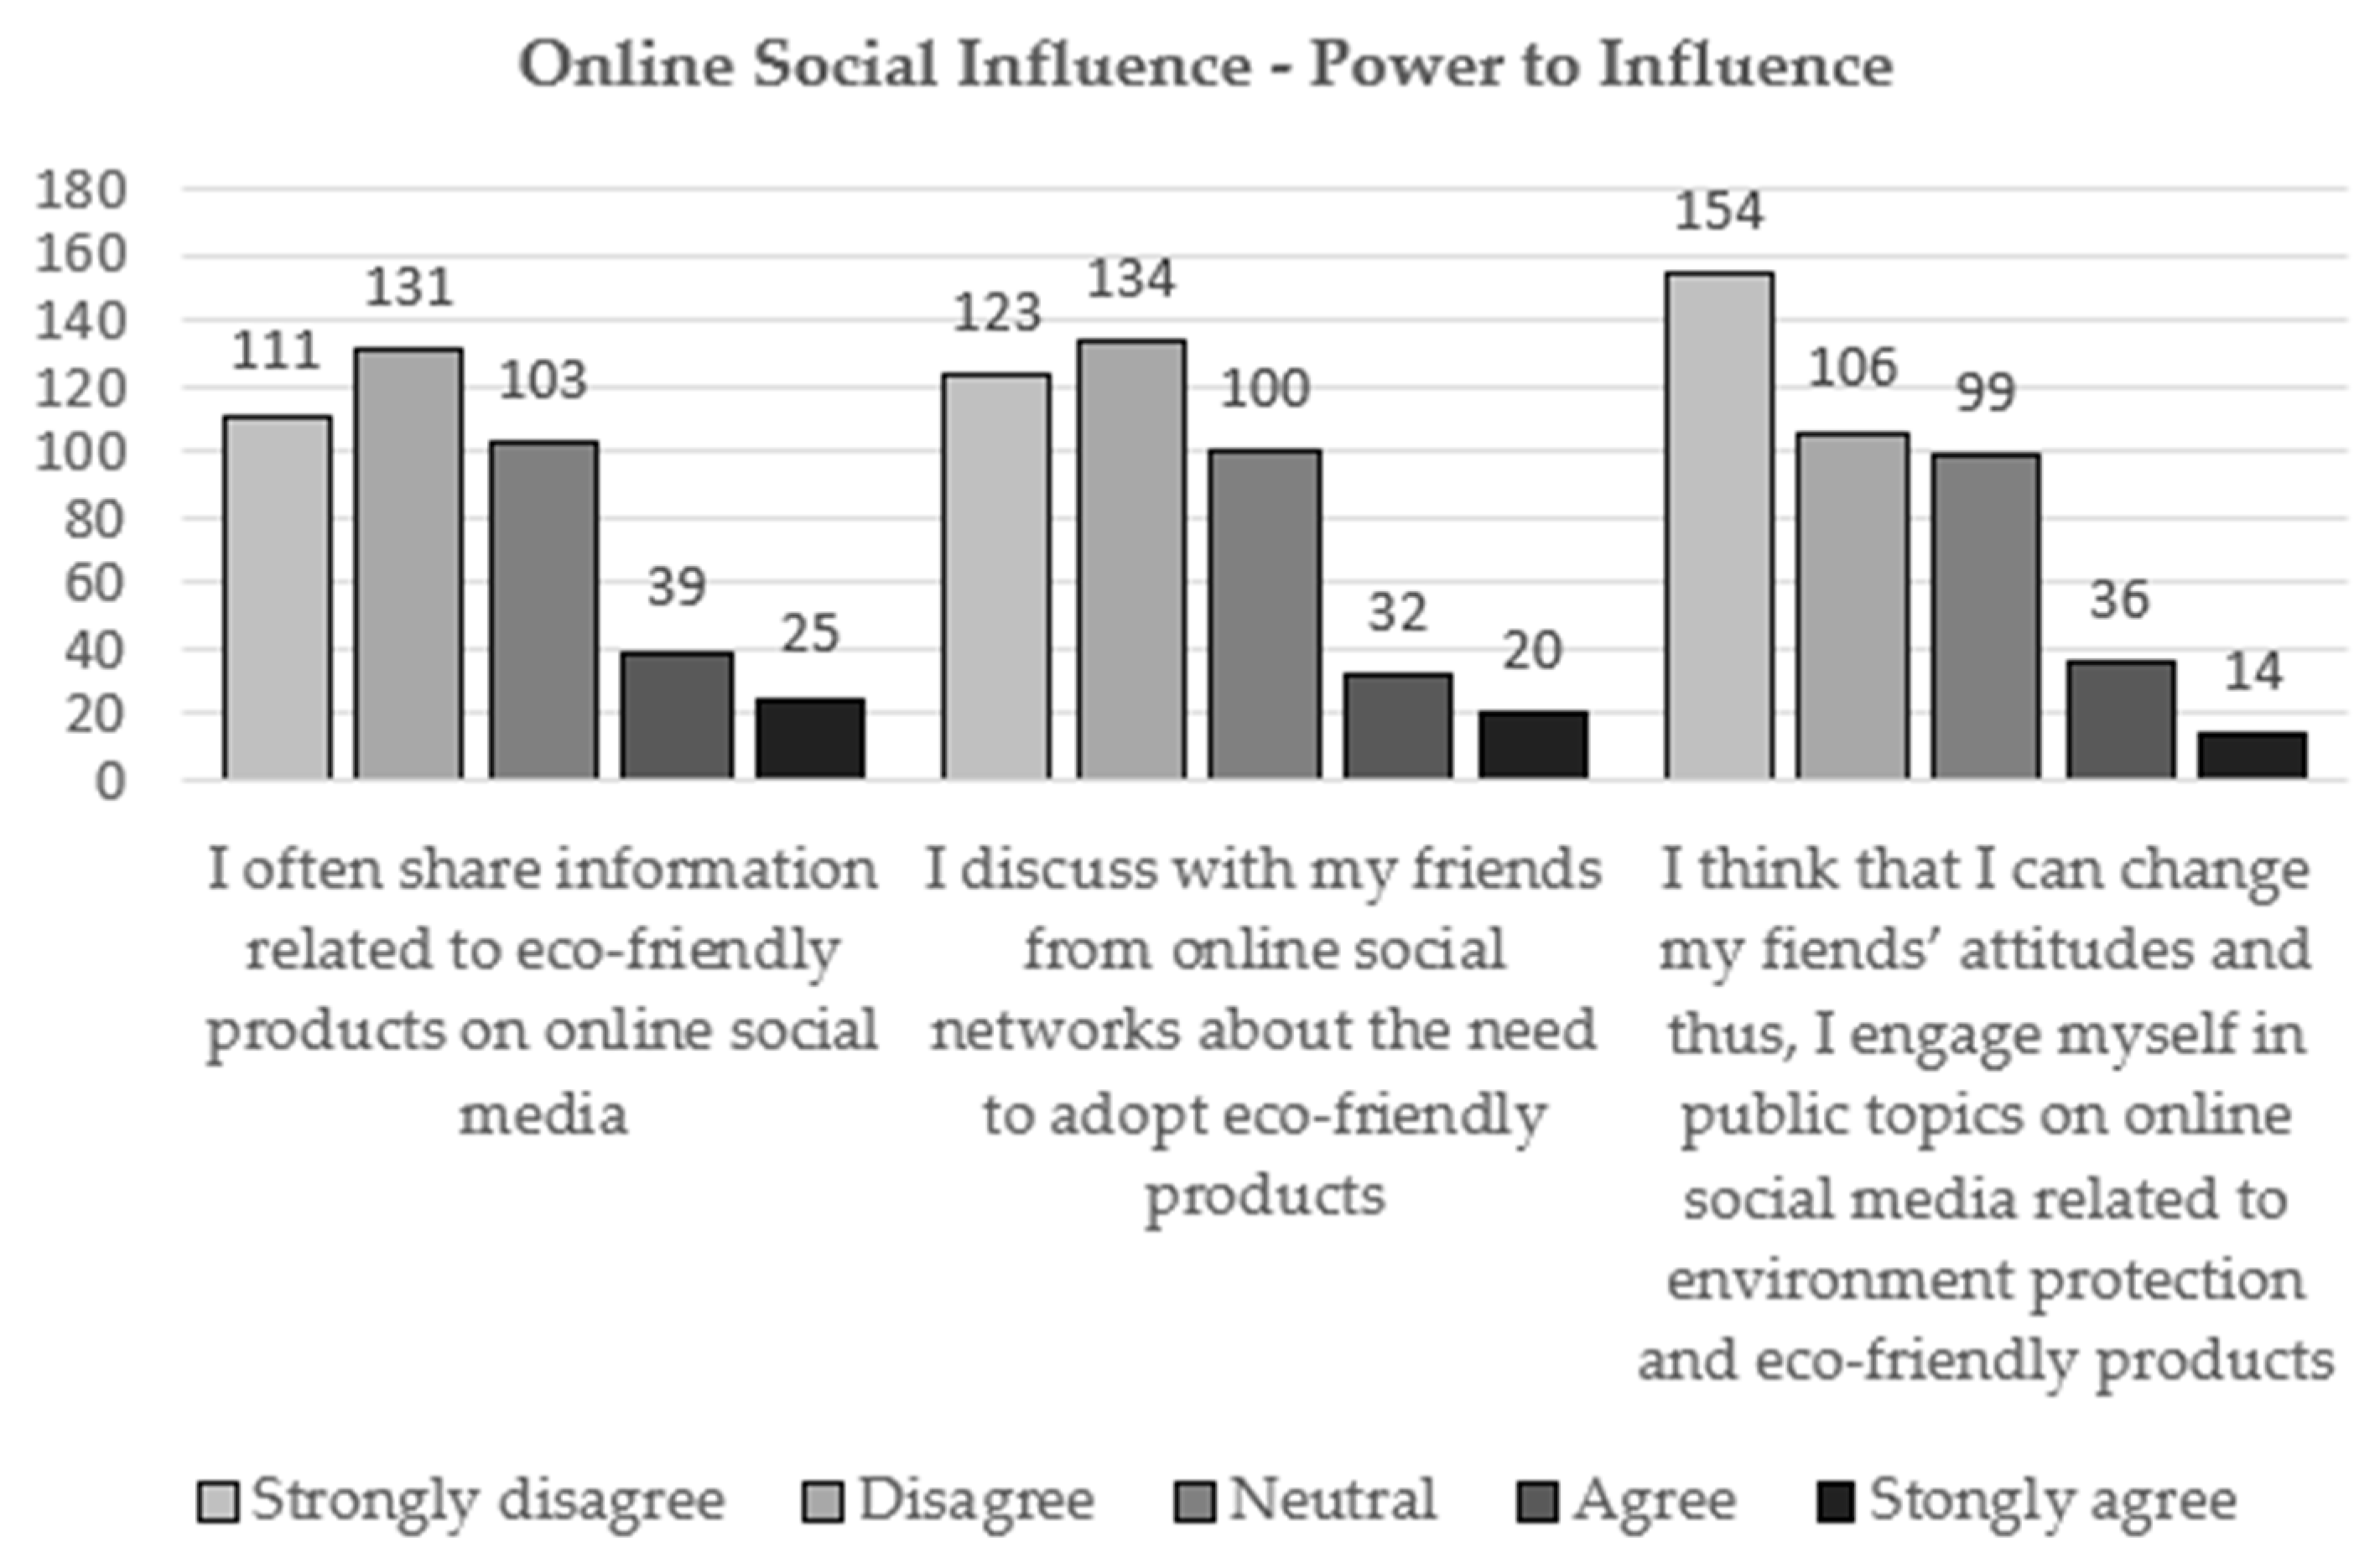
4.2. Analyzing the Data

Regarding the demographic characteristics of the respondents, 39.61% were male and 60.39% were female, having the age between 18–30 (43.03%), 31–40 (31.54%), 41–50 (19.80%), and over 51 years old (5.62%).
Considering the main constructions of the questionnaire, it can be observed that, on average, 65.83% respondents lacked sufficient knowledge regarding the eco-friendly products (38.69% of them marking a “strongly disagree” or “disagree” answer, while 27.14% have no particular opinion over this matter, marking the answers as “neutral”).
Figure 3 presents the distribution of the answers recorded for the knowledge degree component of the questionnaire. It can be observed that a large number of respondents acknowledged the lack of knowledge related to recognizing an eco-friendly product (77.26% of them marking “strongly disagree”, “disagree”, or “neutral” as answers), along with the lack of knowing that some of the durable goods can also be eco-friendly goods (76.28%) or knowing to provide an alternative eco-friendly product to a non-eco-friendly one (77.51%). As for the last question, most of the respondents stated that they are aware of the fact that an eco-friendly product can reduce the damage caused to the environment (67.73%).
For the environmental awareness (E-AW), most of the respondents believed that the human actions are affecting the environment (69.93%). Also, the number of respondents believing that each human is responsible of what happens to our planet (46.70%) surpassed the number of persons believing the contrary (28.61%). The need for taking actions received a considerable number of positive reactions (42.54%), while the persons having no opinion represented 28.12% of the respondents—Figure 4.
The environmental attitude (E-AT) answers pointed out that 62.84% of the respondents believed that it is important to take actions and to limit the damages caused to the environment, 66.99% of them thought that an eco-friendly attitude towards environment is needed, while 63.81% said that it is very important to promote the consumer’s attention to environmental issues through online social media platforms. On average, a percentage of 25.92% took a neutral attitude towards the questions in the E-AT section.
On the other hand, online media exposure (OME) recorded a high number of low values (“strongly disagree” and “disagree”) for the questions related to how often the respondents see messages (54.03%) or read posts (53.06%) written by friends in online social networks—Figure 5. Thus, only 20.05% of the respondents affirmed that they often see messages in online and 19.56% of the respondents stated that they read posts in online. As a result, we can conclude that the online media exposure with regard to the eco-friendly products is relatively low and it can be enhanced through the use of the advantages brought by the online social networks.
The power to influence (OSI-PI) has been determined through three questions as presented in Figure 6. Based on the collected answers, it can be observed that the number of persons which share information or discuss about the eco-friendly products in online social networks is reduced comparatively to the ones not taking any of these actions. On average, only 13.53% of the respondents are actively promoting the eco-friendly products in online social networks.
On contrary, the susceptibility to be influenced (OSI–SI) recorded high values for the interest the respondents manifest in discussing in online social media about the benefits of the eco-friendly products (60.64%), the interest in buying the products promoted by the friends in the online environment (60.88%) and the interest to start reading about the eco-friendly products after seeing many advertisements in social media (64.55%)—Figure 7.
The buying decision (BID) recorded, on average, a rounded number of 287 respondents who will read about/replace/buy eco-friendly products even though they are less appealing than the non-eco-friendly products (representing 70.71% of the respondents), 52 are neutral related to this decision (12.71%), while 70 (17.11%) believe that is unlikely or very unlikely to make this change.
As for the additional questions asked related to the frequency (in a month) of the conversations had in online social networks related to the eco-friendly products, an average frequency of 0.214 for the soft goods and an average of 0.107 for the durable goods has been observed, while the frequency of seeing advertises in online social space related to the advantages or to the existence of new eco-friendly products, the average frequency was of about 0.166 for the soft goods and 0.077 for the durable goods.
Regarding the question “with how many friends they have to discuss, who advocate the use of a particular good or service, before you decide to buy that product?”, an average of 1.12 friends have been pointed out in the case of soft goods and 3.05 friends in the case of durable goods, while for the question “how many commercials or articles related to a particular good you have to see before deciding to buy it?” an average of 6.29 has been reached for the soft goods and 9.83 in the case of durable goods.

5. Consumers’ Influence Model in NetLogo

In this section, the model’s parameters are presented in accordance with the data extracted through the questionnaire and the simulations’ results are analyzed.

5.1. Model’s Parameters

Each agent within the model is seen as a heterogenous individual, having its own characteristics. As the aim of building the agents was to keep in the model the characteristics of the respondents and their way of thinking and interacting, we have used the percentages presented in Section 4.2. when deciding how many of the agents possess a certain level for each characteristic.
As the answers received for the OSI-PI and OSI-SI differ among the two considered categories of products, a chooser has been placed in the interface which allow us to run independent simulations for each case.
Thus, in the simulation part we will consider 4 cases:
  • Case 1: Soft goods—only interactions between agents;
  • Case 2: Soft goods—both interactions between agents and online media exposure;
  • Case 3: Durable goods—only interactions between agents;
  • Case 4: Durable goods—both interactions between agents and online media exposure.
In terms of properties, each agent has its own value for the power to influence (PInf) and susceptibility to be influenced (SInf) variables. In order to keep the population within the model as much as possible similar to the respondents set, we have maintained the same numerical values (as in the questionnaire) for each of these variables, namely, they can take integer values between 1 and 5. As in reality the power to influence and susceptibility to be influenced are not limited to the 5 discrete values in the Likert-scale (1, 2, 3, 4, and 5), we have decided that our agents can also have values located near the designated integer value. For this, a random normal distribution has been used in the program. This choice has been made considering the fact that it is in the human nature not to have a perfectly constant opinion over a product as the opinion may slightly vary due to different other subjective factors. Besides, even if two persons have both chosen the same answer to a question (e.g., 4), it is very unlikely, in reality, that they have the same value for a particular indicator.
Another variable which is recorded for each agent is the intention and decision to purchase the eco-friendly products (we have noted it as ID). The ID variable takes values between 0 and 1 (0 signifying that the agent has no intention to buy the product, while 1 shows the situation in which it will buy for sure the product). At the beginning of the simulation, the considered population will have the same structure as the respondents, namely 6% of agents have 0 for ID, 11% have 0.25 units, 13% will have 0.50, 48% will have 0.75 and 22% will have 1.00 (the values for the percentages are the rounded values calculated based on the number of responses recorded, on average, for each variant: “strongly disagree”, “disagree”, “neutral”, “agree”, and “strongly agree” of the BID construction).
The time step considered in the model is equal with one tick (the “tick” is the name of the time unit in NetLogo) and it has been associated to a time period equal to one month. This choice has been made in accordance to the questions we have addressed to our respondents.
When running the model, at each moment of time, a set of agents are randomly selected from the agent-set depending on the interaction frequency specified for each case (namely, 0.1 interactions for the durable goods and 0.2 interactions for the soft goods—this values are extracted from the respondents answers, which have indicated an active engagement with a period of one month of 0.107 conversations in the case of durable goods and 0.214 in the case of soft goods. These values have been assimilated to 0.1, respectively 0.2 interactions). Randomly, the agents connect to each other and based on the values they have for SI and PI, they may or may not change their opinion related to the purchase of an eco-friendly product. The agents which are not selected to connect in a particular time step remain with the same value for the intention to purchase.
For example, considering two agents noted through X and Y and noting the moment of time with t, the intention to purchase will be determined as:
  • For soft eco-friendly products:
    I D X t = { I D X t 1 , i f   I D Y t 1 I D X t 1 o r   n o   i n t e r a c t i o n   b e t w e e n   X   a n d   Y   a g e n t s 1 , i f   I D Y t 1 > I D X t 1 a n d   S I n f X * P I n f Y > S I n f Y * P I n f X
  • For durable eco-friendly products
    I D X t = { I D X t 1 , i f   I D Y t 1 I D X t 1 o r   n o   i n t e r a c t i o n   b e t w e e n   X   a n d   Y   a g e n t s min ( I D X t 1 + 0.33 , 1 ) , i f   I D Y t 1 > I D X t 1 a n d   S I n f X * P I n f Y > S I n f Y * P I n f X
The values within the formulas have been determined based on the average frequency recorded in the questionnaires for the buying decision. For example, in the case of soft goods, the number of friends to whom the buyer needs to talk before making his/her decision is 1.12 friends, which made us conclude that after just one interaction with an “influencer” (a person having a higher value of the product between the SI and PI than the current agent), the agent will decide to buy the product. On the other hand, for the durable goods, an average number of 3.05 friends are needed, thus, a total decision (equivalent to the value 1 for the ID) will be taken after 3 interactions, which made us add at each interaction the value of 0.33 to the ID variable.
Once an agent reaches the value of 1 for the value of ID, this value can no longer increase. It can also be observed that in the case of eco-friendly products an agent cannot influence negatively the intention to buy an eco-friendly product as, to the best of our knowledge, there are little to no negative messages with regard to the adoption of the eco-friendly products. The same assumption will be kept even in the case of online media exposure as we will consider that all the advertises and news related to the use of an eco-friendly product will make a buyer decide to move towards an environmentally friendly approach. Figure 8 presents an example of a commercial on Facebook related to an eco-friendly toothbrush and several examples of comments made upon that advertise. Based both on the comments presented and also by considering the “reactions” expressed regarding this commercial (using the emoticons), it can be seen that the general feeling over the use of the eco-friendly toothbrush is positive.
For the case in which the agents are also exposed to the online media advertises and news (Cases 3 and 4), the program will randomly select at each time step some agents that will be exposed to online media, which will have an effect in increasing the value of their ID by 0.052 in the case of soft goods and 0.033 in the case of durable goods—this value has been determined by considering the answers the respondents have offered regarding the number of commercials they need to see before deciding to buy a particular type of product (4.29 in the case of soft goods and 6.83 in the case of durable goods). The frequency of exposure to advertises or news is in accordance to the answers received in the questionnaire, namely 0.166 for the soft goods and 0.077 for the durable goods.
The simulation stops when all the agents have an ID equal to 1.

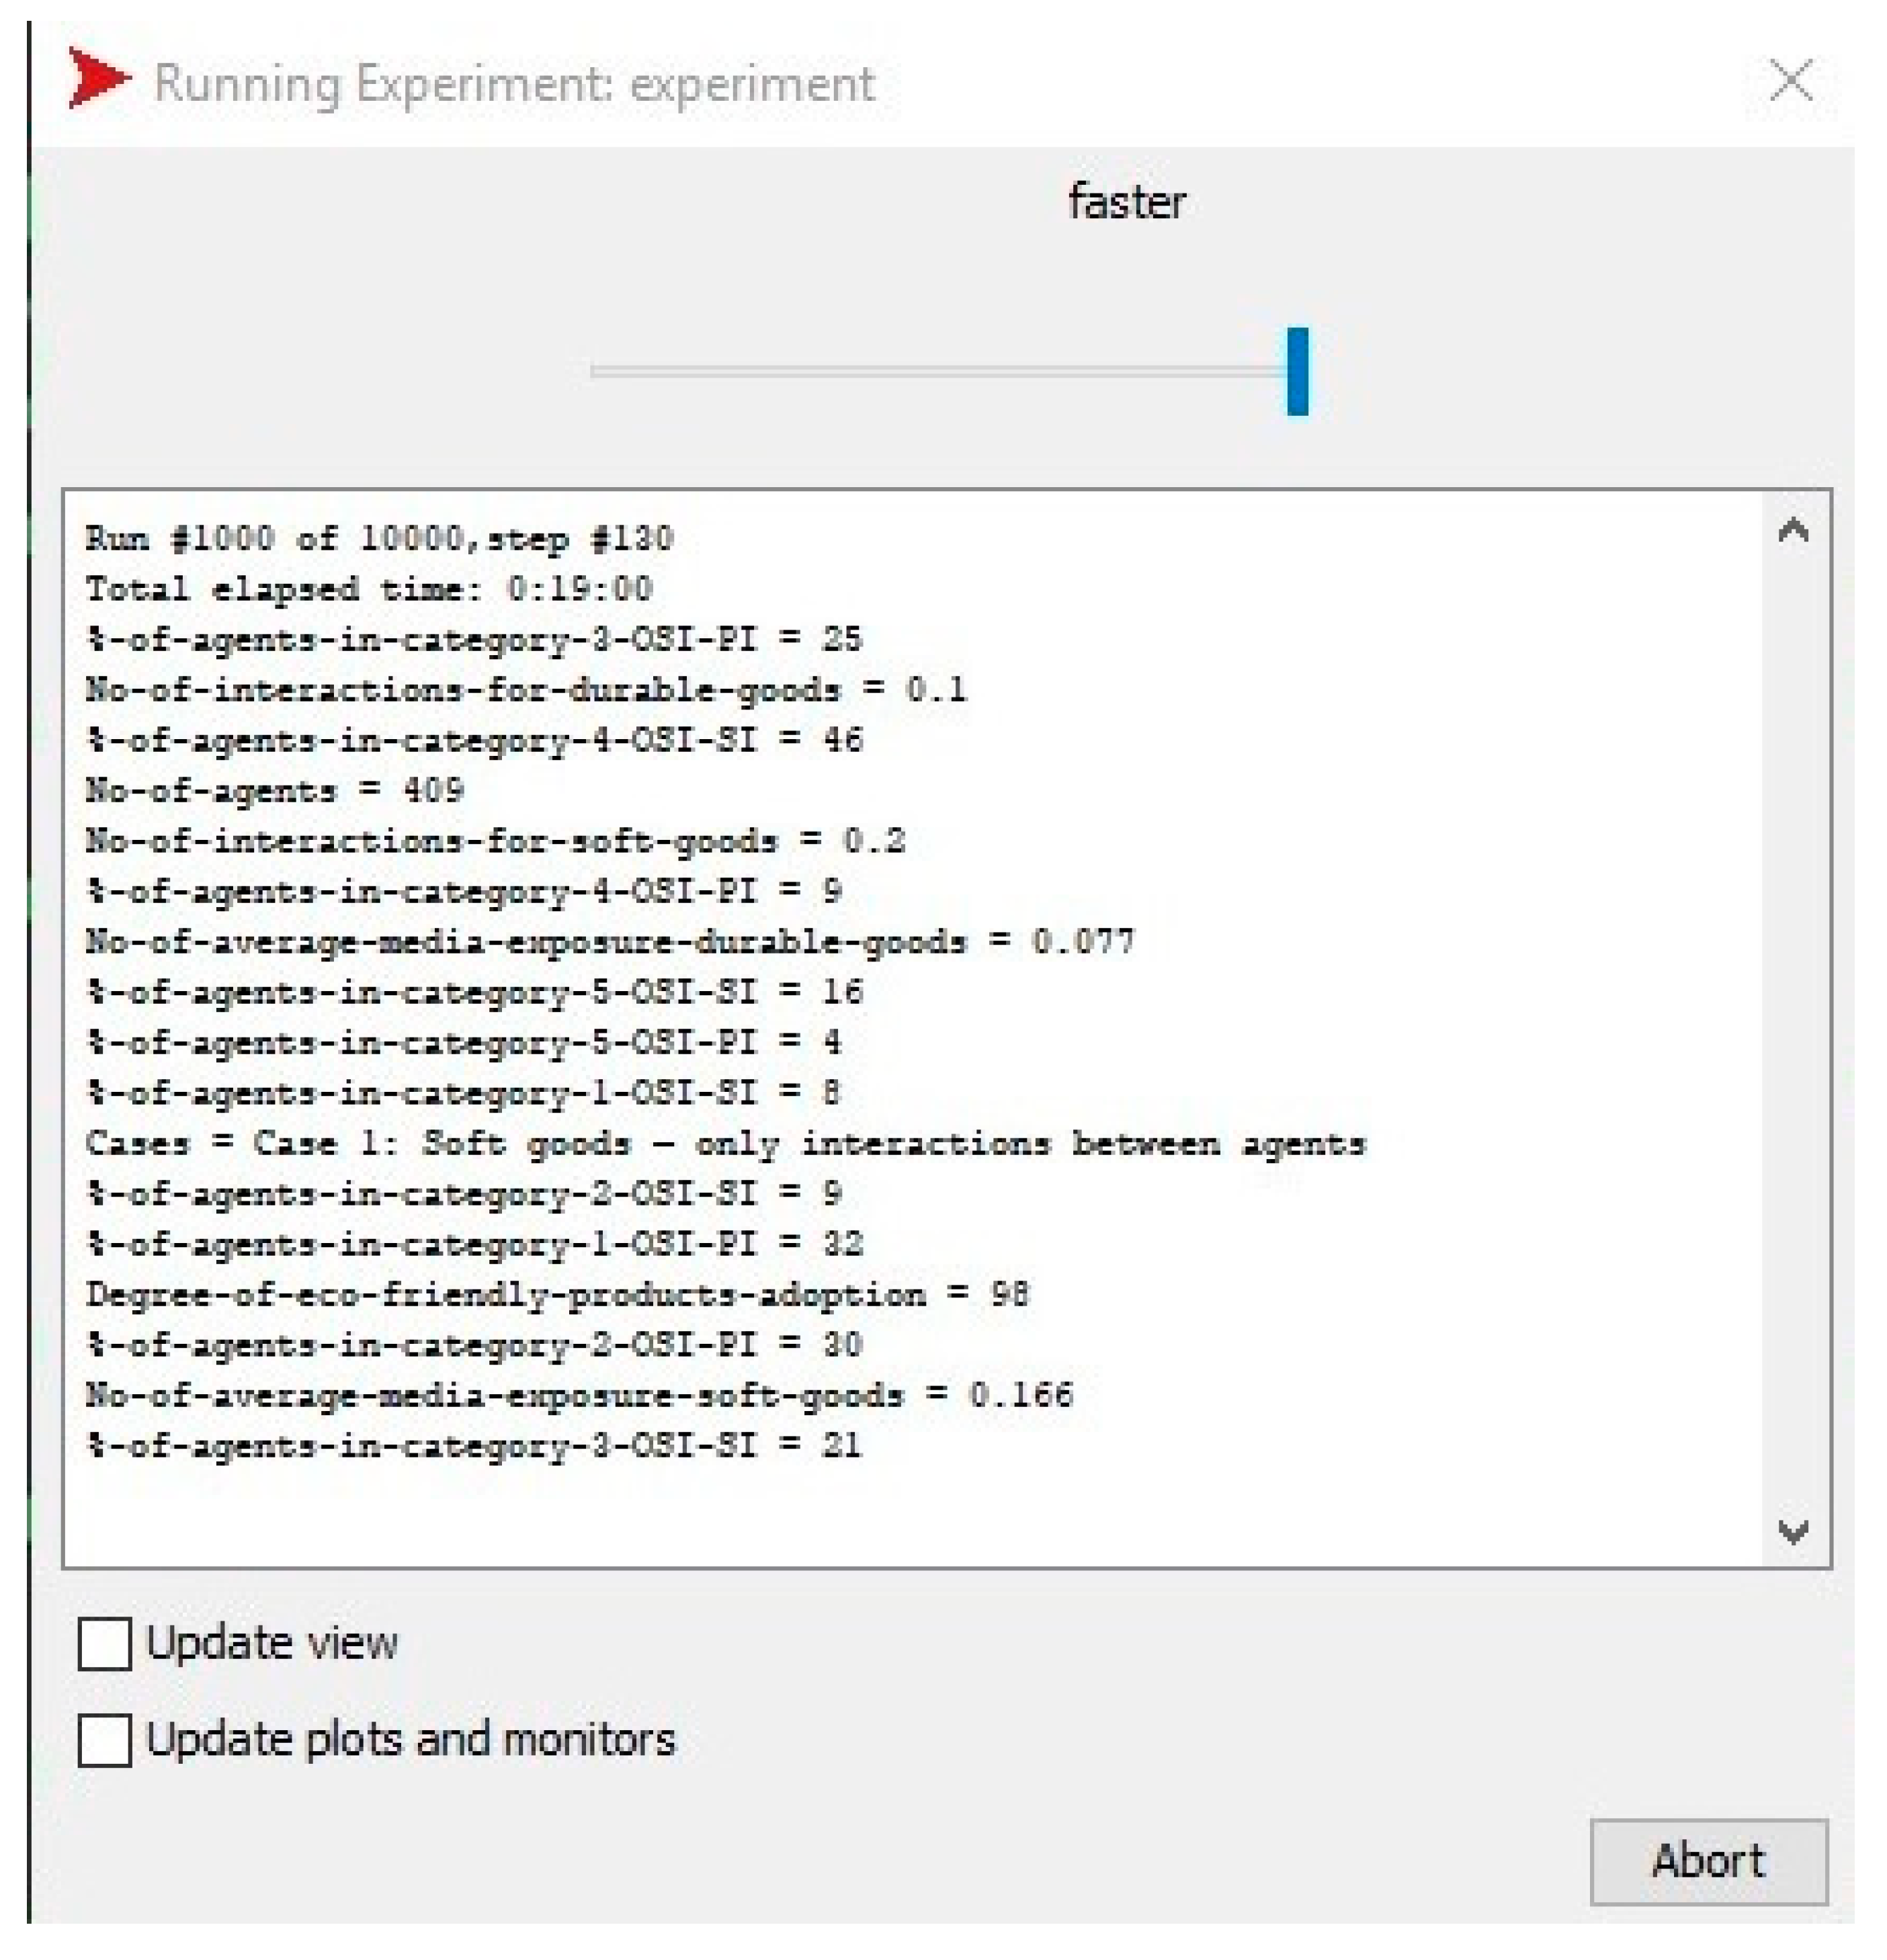
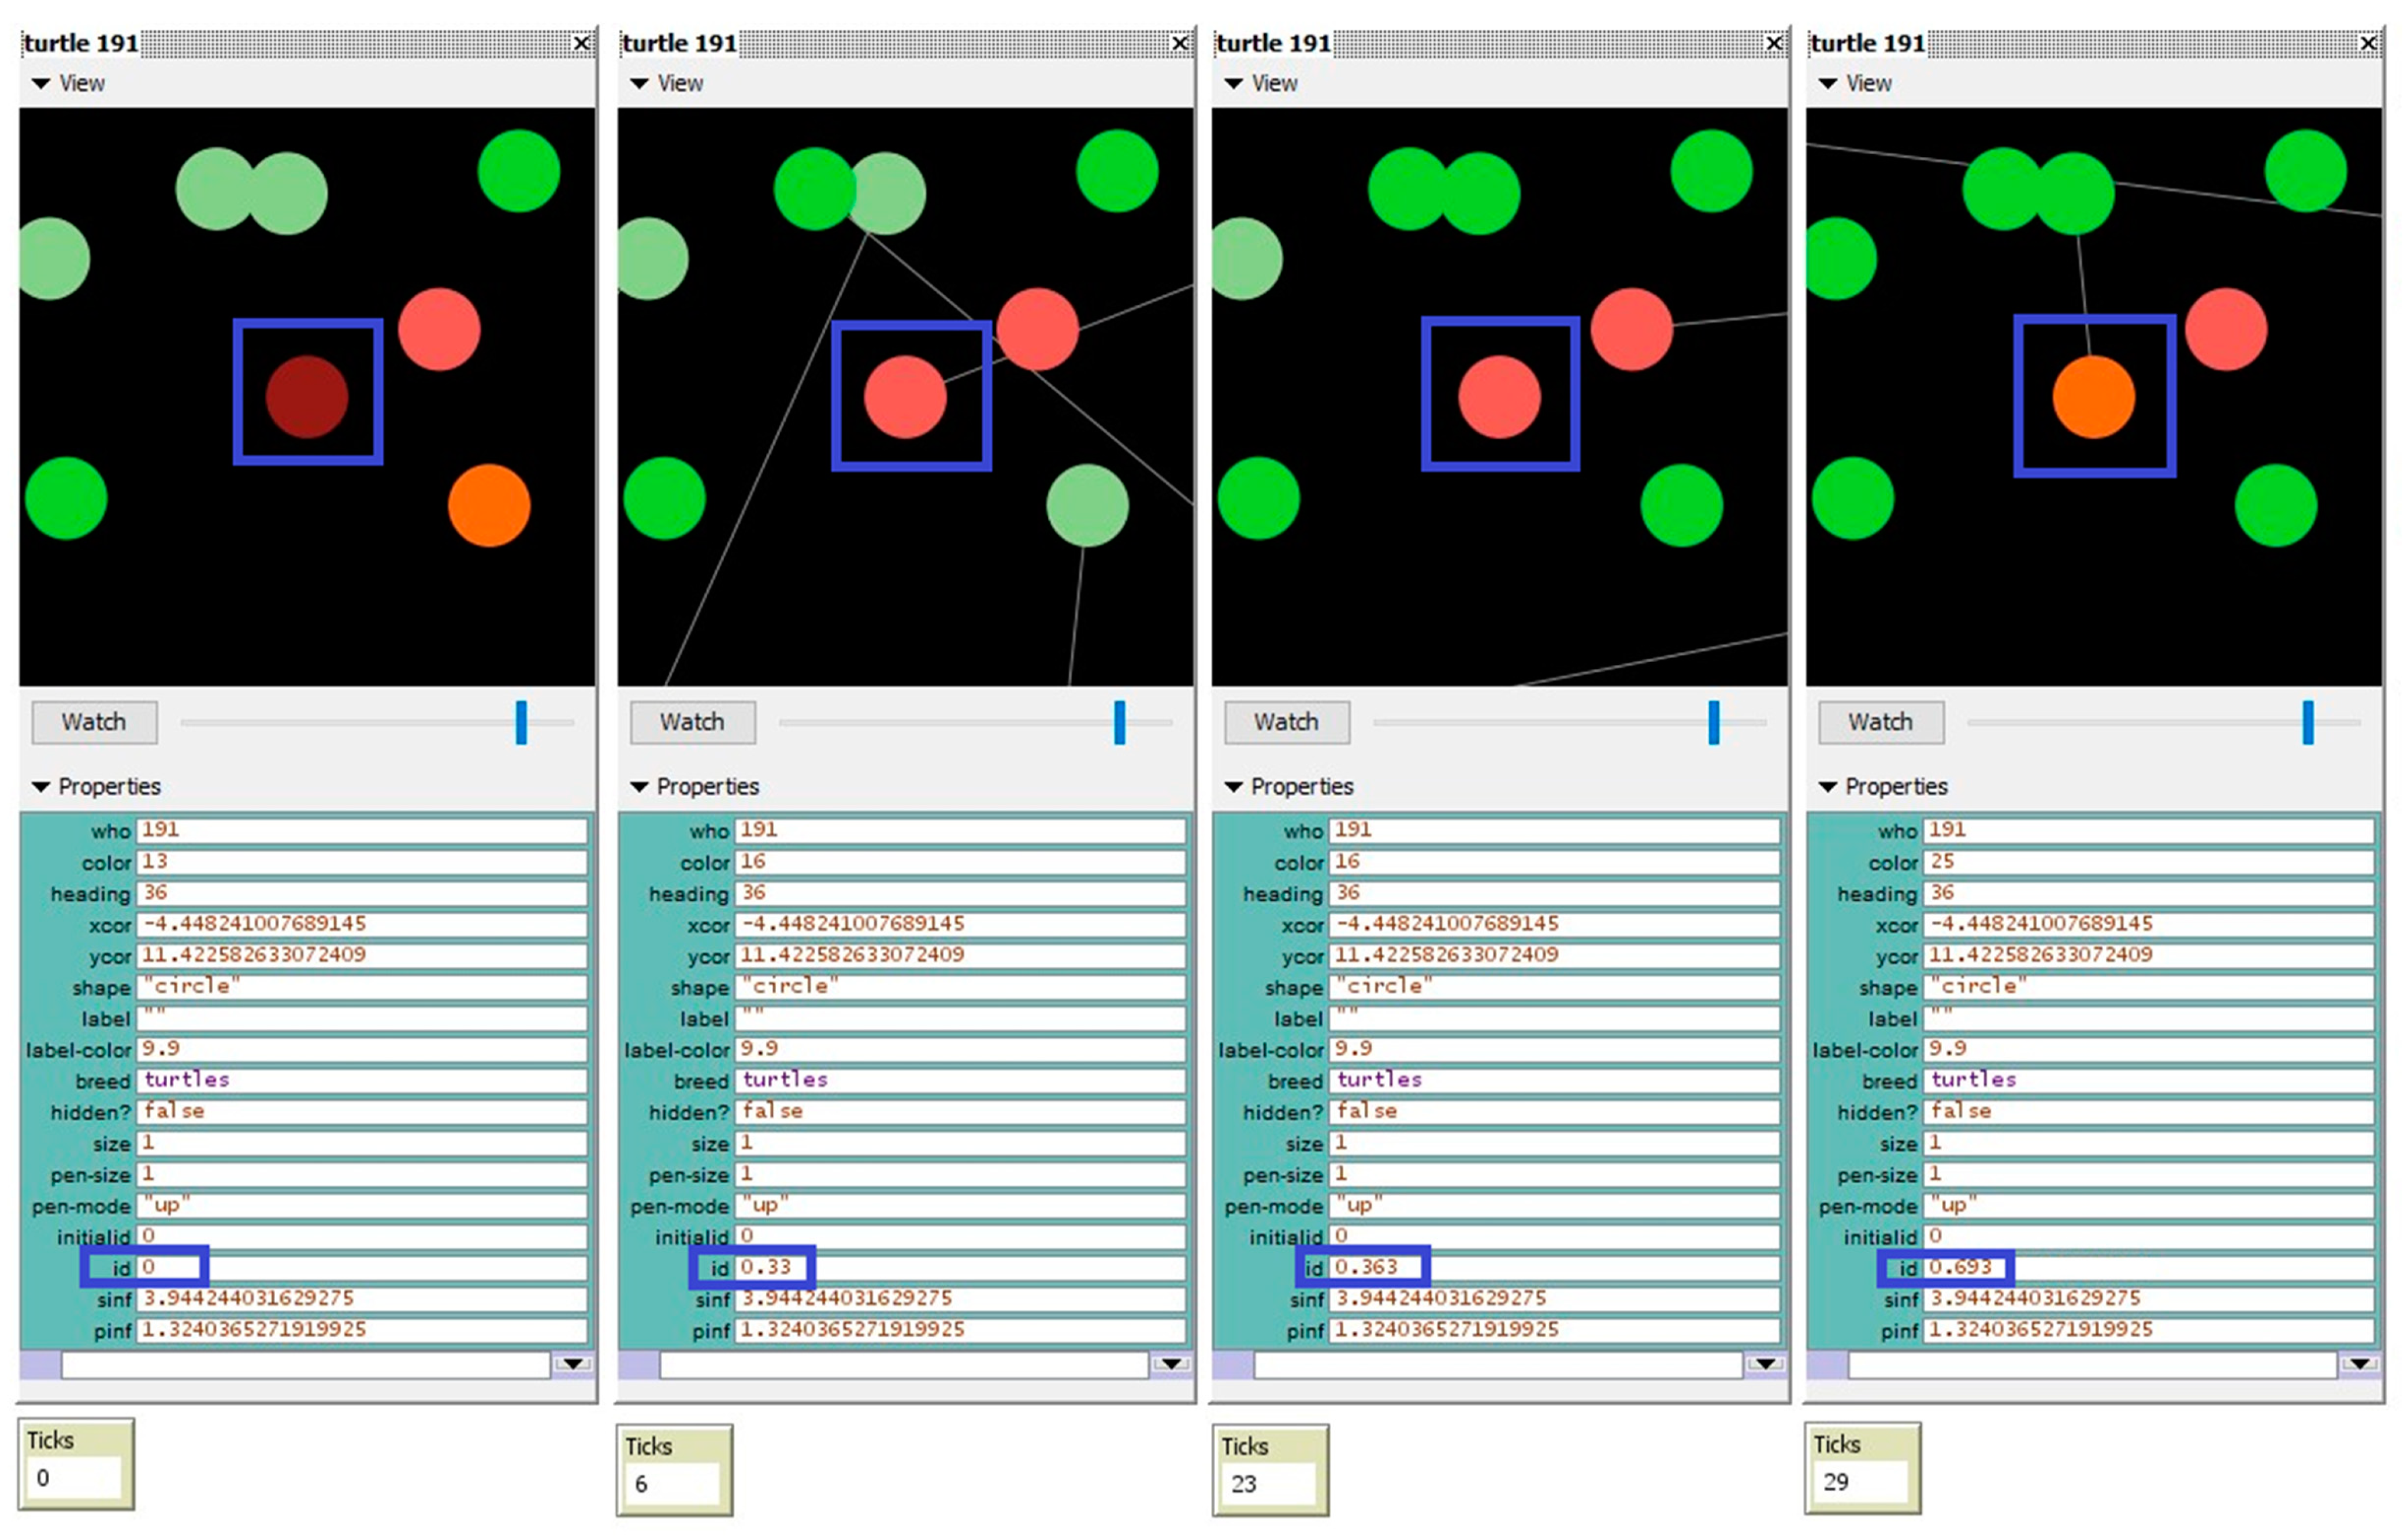
5.2. Simulation and Results

The model created in NetLogo 6.0.4 is configurable and one can easily specify the number of agents considered, the percentages for the five types of influence levels and the percentages for the five types of susceptible to be influenced levels. Also, the number of interactions between agents (for both soft and durable goods) at each tick can be chosen using an input box. In the same manner, the values for the number average media exposure in the case of soft or durable goods can be specified using two other input boxes.
As a 100% percent adoption rate for the eco-friendly products is desirable in any of the four considered cases, we are aware that this often cannot happen in real life due to the subjective characteristics of the humans and their believes. Thus, we have added in the interface, a slider (“Degree-of-eco-friendly-products-adoption”) which offers the possibility to select the desirable percentage of the whole population who should purchase eco-friendly products and adopt an eco-friendly attitude. We thought that in some cases, one can just feel comfortable with a 97% of the population acting eco-friendly.
The graphical user interface (GUI) is presented in Figure 9. Along with the sliders, input boxes and switchers one can use in order to setup his/her own parameters based on his/her own research, there is also available a visual representation of the agents and the way they connect at each iteration (called “world”). For this, we have used the classical “turtles” agents for drawing the customers interacting in online social networks, represented through some small circles colored from dark red (persons with no intention to buy eco-friendly products) to green (persons buying for sure eco-friendly products). Along with the them, a series of agents called “links” have been used for an easy representation, at each time step, of the agents who are randomly connected. After two agents are connected through a link, the program is comparing the intention and decision to purchase (ID) for the two agents and only the agent having the smallest ID can be influenced by the other agent regarding the purchasing of the eco-friendly products. The decision is determined based on the formulas presented in Section 5.1.
An example regarding how the values for the ID are changing for a particular agent (agent 191) is given in Appendix B (Figure A1 and Figure A2). Figure A3 from Appendix B presents a screenshot containing an instance in which the considered agent (agent 191) is connected with another agent (agent 38) having a higher ID and due to the higher value of PInf and lower value of SInf of agent 38, compared to the ones of the agent 191, the latest is changing the valued for the ID.
Also, as we have considered a threshold of 98% of the agents to have a strongly agree opinion related to purchasing eco-friendly products, a situation as the one presented in Figure A4 may appear. Agent 12, highlighted in Figure A4, has a high value for the PInf (4.757) and a relatively small value for SInf (1.742). Due to these values and maybe due to the small interactions with more powerful agents, its opinion hasn’t changed much during the simulations (evolving only from 0 to 0.165). As this situation might appear in real life (not all persons are adopting the eco-friendly products no matter the number of discussions and advertises they take part of), we will maintain the degree of eco-friendly products adoption at this rate (namely, 98%) in the simulations.
In the following, we shall analyse the simulations made in each of the four considered cases.
Given the fact that each simulation run can provide different results due to the agents’ interactions and randomness, it is necessarily to run the simulations multiple times. In order to reduce these differences and get an appropriate overview of the situation, we have decided to run 10.000 simulations on each case. The BehaviorSpace tool provided by NetLogo has been used for running the experiments. Figure 10 presents a screenshot from the simulations’ running process.
Table 5 presents the maximum, minimum and average number of ticks over all the 40.000 simulated cases. In each of these cases, we have kept constant the population and the values retained through the questionnaire. As mentioned before, a tick in NetLogo is equivalent in our case to a month.
It can be observed that in the two cases in which only the interaction with friends in online social media have been considered (Case 1 and Case 3) the amount of time is considerable higher than in the other two cases in which the population has also been exposed to social media advertises (Case 2 and Case 4). Also, both average times obtained for the soft goods situations (Case 1 and Case 2) have recorded smaller values than the situations considering durable goods (Case 3 and Case 4), underlying the need to take action for improving the eco-friendly products adoption.
Comparing the average times obtained in Case 1 and Case 2 it can be observed that in Case 2 the average time is with 84.86% smaller then in Case 1, while Case 4 records an average time which is with 80.10% smaller than the one obtained in Case 3. This might suggest that the efficiency of watching commercials in social media is higher in the case of soft goods than in the case of durable goods—this result is consistent with the answers received from the respondents in which they were suggesting that they need, on average, 3 times more friends to talk to in the case of durable goods than in the case of soft goods before deciding to purchase the eco-friendly products, while the number of commercials, the difference was not as higher between the soft and durable goods.

5.2.1. Sensitivity Analysis Related to the Number of Agents

For making a more in-depth analysis regarding the agent-based model, we have considered different population sizes and we have tried to see if the size of the population has a major impact on the time needed until most of the agents (98% of them) have decided to adopt the eco-friendly products. Thus, we have simulated Case 2 for different population sizes: 100, 200, 400, 600, 800, and 1000.
As it can be observed from Table 6, small differences are encountered when different sizes of population are chosen in the interface. Thus, we can conclude that the model has a small sensitivity to the population size, which can enable us to simulate it on a reduced number of agents and draw the conclusions to the population as a whole.

5.2.2. Sensitivity Analysis Related to the Average Media Exposure

As Case 2 and Case 4 are considering the presence of online media exposure, we have made various simulations in order to observe the effect of social media exposure through commercials on the eco-friendly products adoption time.
First, we have considered the case of the soft goods. The initial average media exposure (as extracted from the respondents’ answers) has been 0.1626, meaning that at each moment of time (tick for the agents and month for real persons) the probability of an agent/person to see such a commercial or to read particular news related to an eco-soft good was 0.1626. In the simulations, we have gradually increased the media exposure, starting from 10% more, until 100%. Basically, in the case of 100%, the media exposure doubles. The results are presented in Table 7.
It can be observed that the increasement in media exposure has a positive effect in reducing the eco-friendly products adoption time. As the number of ticks are equal to the number of months, it can be observed that in the case of doubling the media exposure (100% increasement), the adoption time decreases from 73 months to 43 months, recording a decrease of 40.8%, while maintaining the same levels of agents’ interactions. Figure 11 presents the decrease evolution over different levels of increasement in media exposure.
In the same way, we have analyzed the increasement in media exposure for the case of durable goods. The same levels have been considered as in the previous case, namely increasements starting from 10% until 100%.
Table 8 presents the time reduction for the durable goods. It can be observed that when doubling the media exposure, the adoption time is reduced by 37.20%. Considering the time in months, a diminish from 192 months to 120 months is recorded. The time reduction is also depicted in Figure 12.

6. Conclusions

The present paper tries to model the potential influence online social media has upon the consumers’ decision to purchase the eco-friendly products.
For extracting the influence manifested by conversations with “friends” conducted in online environments and by the frequency of media exposure related to this category of products, a questionnaire has been created and validated using SPSS AMOS 22.0.0. A series of validation criteria have been used, and, as a result, the questionnaire has been validated considering its uni-dimensionality, feasibility, convergent validity, and similarity.
The data recorded for each respondent have been analyzed and the values for the variables needed in the agent-based model have been extracted. Based on them, the agent-based model has been built in NetLogo 6.0.4.
The model has been used for simulating different scenarios related to consumers’ exposure to media in online environment. A sensitivity analysis has been conducted, showing the importance of media exposure for the two types of eco-friendly goods that have been considered: soft and durable goods.
The results have shown that an increasement in media exposure can have a positive impact on the eco-friendly products adoption, in both cases, by doubling the current media exposure, the adoption time is decreased by more than 37%. Knowing the characteristics of a population with respect to their attitudes towards the use of the eco-friendly products, one can easily transpose them into the agent-based model by changing the values of the variables through the use of the graphical user interface. Then, by conducting the simulations, one can observe the needed time for the changes to take place. Based on them, one can decide to increase the online social media advertises frequencies in order to achieve earlier the desired results.
The model can be further improved by also considering other factors that may contribute to consumers’ attitude and purchase decision, such as the intervention of the government. Besides, the model’s parameters are configurable and the model can be used in the particular case in which one wants only to see the online influence to a particular type of eco-friendly product. As mentioned above, we have asked our respondents to think of such an eco-friendly product as we wanted to retain a general opinion about the intention to purchase any category of soft / durable eco-friendly products. In reality, one can only be interested on a particular type of product and based on the characteristics of that product and target audience the results may vary.
Among the limitations of the study we have to mention the fact that the model is parametrized based on the answers we have received from the 409 respondents and for a more in-depth analysis one can select a larger number of respondents and, if interested, can limit the respondents to a particular category based on their age, gender, region, etc. Also, the model considers only the influences made in online environments and does not include other possible influences such as the product’s characteristics, how easily it can be purchased, government’s influence, or other persons’ influence (such as life partner, co-workers, etc.). We aim to address as much as possible of these limitations in further research.
The NetLogo 6.0.4 model can be accessed at the following address: https://github.com/liviucotfas/ase-2019-abm-eco-friendly.

Author Contributions

Conceptualization, C.D. and L.-A.C.; Methodology, C.D.; Software, L.-A.C.; Validation, C.L.T., L.C. and A.G.M.; Formal Analysis, C.D. and L.C.; Investigation, A.G.M. and C.L.T.; Data Curation, L.-A.C. and L.C.; Writing—Original Draft Preparation, C.D.; Writing—Review and Editing, L.-A.C., C.L.T. and A.G.M.; Visualization, L.C. and A.G.M.; Supervision, C.L.T. and C.D.

Funding

This research is funded by the Romanian government through CERTRAN project—The Upgrade of the Research Capacity in Economics through Development of a Transdisciplinary Research Infrastructure, PNCDI III, no. 24PFE/16.10.2018.

Acknowledgments

This research is funded by the Romanian government through CERTRAN project—The Upgrade of the Research Capacity in Economics through Development of a Transdisciplinary Research Infrastructure, PNCDI III, no. 24PFE/16.10.2018. The results included in this work are part of the project FutureWeb, supported by the Romanian Ministry of Research and Innovation, CCCDI—UEFISCDI, project number PN-III-P1-1.2-PCCDI-2017-0800 / 86PCCDI/2018—FutureWeb, within PNCD III.

Conflicts of Interest

The authors declare no conflict of interest.

Appendix A. Research Questionnaire

IssueAcronymQuestionsStrongly DisagreeDisagreeNeutralAgreeStrongly Agree
Knowledge DegreeKDI know how to recognize an eco-friendly product
I know that even the durable goods can be eco-friendly and I know how to recognize them
I know to give an example of reusable-alternatives to non-eco-friendly products
I understand that using an eco-friendly product reduce the damage caused to the environment
Environmental AwarenessE-AWI think that the human actions are affecting the environment
I think that each human is responsible of what happens to our planet
I think that if no action is taken with respect to protecting the environment, the situation would be getting worse
Environmental AttitudeE-ATI think that it is important to take action and limit the damages caused to the environment
An environmentally-friendly attitude towards environment is needed
It is very important to promote consumers’ attention to environmental issues through online social media platforms
Online Media ExposureOMEI often see messages of eco-friendly products on online social media
I often read posts written by my friends in online social networks related to eco-friendly products
Online Social Influence—Power to InfluenceOSI-PII often share information related to eco-friendly products on online social media
I discuss with my friends from online social networks about the need to adopt eco-friendly products
I think that I can change my fiends’ attitudes and thus, I engage myself in public topics on online social media related to environment protection and eco-friendly products
Online Social Influence—Susceptibility to be InfluencedOSI-SII am interested in discussing with the persons in online social media about the benefits of the eco-friendly products and upon these discussions, I decide whether to buy the products or not
If my friends in online social media promote some eco-friendly products, it is very likely to start buying them
If I see many advertisements about some eco-friendly products in social media, I start reading about them and it is very likely to start buying or to recommend them to my fiends
Buying Intention and DecisionBIDIn the future, I think I will read more about the new eco-friendly products and, if I will be content about their advantages, I will buy them
I will buy eco-friendly products even though they will be more expensive than the normal products
I will buy eco-friendly products even though, in some cases, they will be less appealing than the non-eco-friendly products
I will start to buy and replace the non-eco-friendly products with their reusable-alternatives
I plan to buy as many eco-friendly products as possible

Appendix B. Simulation Examples

Figure A1. Example of changing properties for turtle 191 during simulation process at different time moments (1).
Sustainability 11 01796 g0a1
Figure A2. Example of changing properties for turtle 191 during simulation process at different time moments (2).
Sustainability 11 01796 g0a2
Figure A3. Example of changing properties for turtle 191 after connecting with turtle 38.
Sustainability 11 01796 g0a3
Figure A4. Example of agent (turtle 12) who remained with a strongly disagree opinion to purchase at the end of simulation.
Sustainability 11 01796 g0a4

References

  1. El-Mously, H. Innovating green products as a mean to alleviate poverty in Upper Egypt. Ain Shams Eng. J. 2018, 9, 2039–2056. [Google Scholar] [CrossRef]
  2. De Medeiros, J.F.; Ribeiro, J.L.D. Environmentally sustainable innovation: Expected attributes in the purchase of green products. J. Clean. Prod. 2017, 142, 240–248. [Google Scholar] [CrossRef]
  3. Zhang, W.; He, Y. Optimal policies for new and green remanufactured short-life-cycle products considering consumer behavior. J. Clean. Prod. 2019, 214, 483–505. [Google Scholar] [CrossRef]
  4. Wang, Z.; Zhang, B.; Yin, J.; Zhang, X. Willingness and behavior towards e-waste recycling for residents in Beijing city, China. J. Clean. Prod. 2011, 19, 977–984. [Google Scholar] [CrossRef]
  5. Miafodzyeva, S.; Brandt, N. Recycling Behaviour Among Householders: Synthesizing Determinants Via a Meta-analysis. Waste Biomass Valoriz. 2013, 4, 221–235. [Google Scholar] [CrossRef]
  6. Dias, P.; Bernardes, A.M.; Huda, N. Ensuring best E-waste recycling practices in developed countries: An Australian example. J. Clean. Prod. 2019, 209, 846–854. [Google Scholar] [CrossRef]
  7. Chen, C.-C.; Chen, C.-W.; Tung, Y.-C. Exploring the Consumer Behavior of Intention to Purchase Green Products in Belt and Road Countries: An Empirical Analysis. Sustainability 2018, 10, 854. [Google Scholar] [CrossRef]
  8. Doha, A.; Elnahla, N.; McShane, L. Social commerce as social networking. J. Retail. Consum. Serv. 2019, 47, 307–321. [Google Scholar] [CrossRef]
  9. Asim, Y.; Malik, A.K.; Raza, B.; Shahid, A.R. A trust model for analysis of trust, influence and their relationship in social network communities. Telemat. Inform. 2019, 36, 94–116. [Google Scholar] [CrossRef]
  10. Kujur, F.; Singh, S. Engaging customers through online participation in social networking sites. Asia Pac. Manag. Rev. 2017, 22, 16–24. [Google Scholar] [CrossRef]
  11. Lim, H.; Kumar, A. Variations in consumers’ use of brand online social networking: A uses and gratifications approach. J. Retail. Consum. Serv. 2017. [Google Scholar] [CrossRef]
  12. Wang, F.; Jiang, W.; Li, X.; Wang, G. Maximizing positive influence spread in online social networks via fluid dynamics. Fut. Gener. Comput. Syst. 2018, 86, 1491–1502. [Google Scholar] [CrossRef]
  13. Delcea, C.; Popa, C.D.S.; Boloş, M. Consumers’ Decisions in Grey Online Social Networks. J. Grey Syst. 2015, 27. [Google Scholar]
  14. Delcea, C.; Scarlat, E. Grey relational analysis between social media engagement and users’ decisions. In Proceedings of the IEEE International Conference Grey Systems and Intelligent Services (GSIS), Leicester, UK, 18–20 August 2015; pp. 134–138. [Google Scholar]
  15. Fami, H.S.; Aramyan, L.H.; Sijtsema, S.J.; Alambaigi, A. Determinants of household food waste behavior in Tehran city: A structural model. Resour. Conserv. Recycl. 2019, 143, 154–166. [Google Scholar] [CrossRef]
  16. Mattar, L.; Abiad, M.G.; Chalak, A.; Diab, M.; Hassan, H. Attitudes and behaviors shaping household food waste generation: Lessons from Lebanon. J. Clean. Prod. 2018, 198, 1219–1223. [Google Scholar] [CrossRef]
  17. Nikolaus, C.J.; Nickols-Richardson, S.M.; Ellison, B. Wasted food: A qualitative study of U.S. young adults’ perceptions, beliefs and behaviors. Appetite 2018, 130, 70–78. [Google Scholar] [CrossRef]
  18. Corrado, S.; Caldeira, C.; Eriksson, M.; Hanssen, O.J.; Hauser, H.-E.; van Holsteijn, F.; Liu, G.; Östergren, K.; Parry, A.; Secondi, L.; et al. Food waste accounting methodologies: Challenges, opportunities, and further advancements. Glob. Food Secur. 2019, 20, 93–100. [Google Scholar] [CrossRef]
  19. Schmidt, K.; Matthies, E. Where to start fighting the food waste problem? Identifying most promising entry points for intervention programs to reduce household food waste and overconsumption of food. Resour. Conserv. Recycl. 2018, 139, 1–14. [Google Scholar] [CrossRef]
  20. Buchner, B.; Fischler, C.; Gustafson, E.; Reilly, J.; Riccardi, G.; Ricordi, C.; Veronesi, U. Food Waste: Causes, Impacts and Proposals; Codice Edizioni: Torino, Italy, 2012. [Google Scholar]
  21. Lucifero, N. Food Loss and Waste in the EU Law between Sustainability of Well-being and the Implications on Food System and on Environment. Agric. Sci. Proced. 2016, 8, 282–289. [Google Scholar] [CrossRef] [Green Version]
  22. Stenmarck, Å.; Jensen, C.; Quested, T.; Moates, G.; Buksti, M.; Cseh, B.; Juul, S.; Parry, A.; Politano, A.; Redlingshofer, B.; et al. Estimates of European Food Waste Levels. Available online: http://edepot.wur.nl/378674 (accessed on 25 February 2019).
  23. Scherhaufer, S.; Moates, G.; Hartikainen, H.; Waldron, K.; Obersteiner, G. Environmental impacts of food waste in Europe. Waste Manag. 2018, 77, 98–113. [Google Scholar] [CrossRef] [PubMed]
  24. Revilla, B.P.; Salet, W. The social meaning and function of household food rituals in preventing food waste. J. Clean. Prod. 2018, 198, 320–332. [Google Scholar] [CrossRef]
  25. Schanes, K.; Dobernig, K.; Gözet, B. Food waste matters—A systematic review of household food waste practices and their policy implications. J. Clean. Prod. 2018, 182, 978–991. [Google Scholar] [CrossRef]
  26. Hole, G.; Hole, A.S. Recycling as the way to greener production: A mini review. J. Clean. Prod. 2019, 212, 910–915. [Google Scholar] [CrossRef]
  27. Qi, Y.; Xiao, X.; Lu, Y.; Shu, J.; Wang, J.; Chen, M. Cathode ray tubes glass recycling: A review. Sci. Total Environ. 2019, 650, 2842–2849. [Google Scholar] [CrossRef]
  28. Mercante, I.; Alejandrino, C.; Ojeda, J.P.; Chini, J.; Maroto, C.; Fajardo, N. Mortar and concrete composites with recycled plastic: A review. Sci. Technol. Mater. 2018, 30, 69–79. [Google Scholar] [CrossRef]
  29. Horckmans, L.; Nielsen, P.; Dierckx, P.; Ducastel, A. Recycling of refractory bricks used in basic steelmaking: A review. Resour. Conserv. Recycl. 2019, 140, 297–304. [Google Scholar] [CrossRef]
  30. Sandin, G.; Peters, G.M. Environmental impact of textile reuse and recycling—A review. J. Clean. Prod. 2018, 184, 353–365. [Google Scholar] [CrossRef]
  31. Maniatis, P. Investigating factors influencing consumer decision-making while choosing green products. J. Clean. Prod. 2016, 132, 215–228. [Google Scholar] [CrossRef]
  32. Wei, S.; Ang, T.; Jancenelle, V.E. Willingness to pay more for green products: The interplay of consumer characteristics and customer participation. J. Retail. Consum. Serv. 2018, 45, 230–238. [Google Scholar] [CrossRef]
  33. Sanjuán, A.I.; Sánchez, M.; Gil, J.M.; Gracia, A.; Soler, F. Brakes to organic market enlargement in Spain: Consumers’ and retailers’ attitudes and willingness to pay. Int. J. Consum. Stud. 2003, 27, 134–144. [Google Scholar] [CrossRef]
  34. Sakagami, M.; Sato, M.; Ueta, K. Measuring consumer preferences regarding organic labelling and the JAS label in particular. N. Z. J. Agric. Res. 2006, 49, 247–254. [Google Scholar] [CrossRef] [Green Version]
  35. International Marketing and Trade of Quality Food Product; Canavari, M.; Cantore, N.; Castellini, A.; Pignatti, E.; Spadoni, R. (Eds.) Wageningen Academic Publishers: Wageningen, The Netherlands, 2009. [Google Scholar]
  36. Thøgersen, J.; Jørgensen, A.-K.; Sandager, S. Consumer Decision Making Regarding a “Green” Everyday Product. Psychol. Mark. 2012, 29, 187–197. [Google Scholar] [CrossRef]
  37. Sinnappan, P.; Rahman, A.A. Antecedents of Green Purchasing Behavior among Malaysian Consumers. Int. Bus. Manag. 2011, 5, 129–139. [Google Scholar] [CrossRef]
  38. Vikan, A.; Camino, C.; Biaggio, A.; Nordvik, H. Endorsement of the New Ecological Paradigm. Environ. Behav. 2007, 39, 217–228. [Google Scholar] [CrossRef]
  39. Khan, S.N.; Mohsin, M. The power of emotional value: Exploring the effects of values on green product consumer choice behavior. J. Clean. Prod. 2017, 150, 65–74. [Google Scholar] [CrossRef]
  40. Sheth, J.N.; Newman, B.I.; Gross, B.L. Why we buy what we buy: A theory of consumption values. J. Bus. Res. 1991, 22, 159–170. [Google Scholar] [CrossRef]
  41. Sweeney, J.C.; Soutar, G.N. Consumer perceived value: The development of a multiple item scale. J. Retail. 2001, 77, 203–220. [Google Scholar] [CrossRef]
  42. Hussain, M.A.; Khokhar, M.F.; Asad, A. Green Awareness Effects on Consumers Purchasing Decision: A Case of Pakistan. Glob. J. Manag. Bus. Res. 2014, 14, 8–16. [Google Scholar]
  43. Akbar, W.; Hassan, S.; Khurshid, S.; Niaz, M.; Rizwan, M. Antecedents Affecting Customer’s Purchase Intentions towards Green Products. J. Sociol. Res. 2014, 5. [Google Scholar] [CrossRef]
  44. Wilensky, U.; Rand, W. An Introduction to Agent-Based Modeling: Modeling Natural, Social, and Engineered Complex Systems with NetLogo; The MIT Press: Cambridge, MA, USA, 2015. [Google Scholar]
  45. Delcea, C.; Bradea, I.A. Economic Cybernetics. An Equation-Based Modeling and Agent-Based Modeling Approach; Editura Universitara: Bucharest, Romania, 2017. [Google Scholar]
  46. Dyke, H.V. Practical and Industrial Applications of Agent-Based Systems. 1998. Available online: https://pdfs.semanticscholar.org/19b7/11ec0ef8ea4658d557e9354e432eb6e44506.pdf?_ga=2.178723300.1998167298.1553419165-1067836565.1489167981 (accessed on 25 February 2019).
  47. Stonedahl, F.; Wilensky, U. Finding Forms of Flocking: Evolutionary Search in ABM Parameter-Spaces. In Multi-Agent-Based Simulation XI; Bosse, T., Geller, A., Jonker, C.M., Eds.; Springer: Berlin/Heidelberg, Germany, 2011; Volume 6532, pp. 61–75. [Google Scholar]
  48. Wilkerson-Jerde, M.; Wilensky, U. Seeing Change in the World from Different Levels: Understanding the Mathematics of Complex Systems. In Proceedings of the 9th International Conference of the Learning Sciences, Chicago, IL, USA, 29 June–2 July 2010; International Society of the Learning Sciences: Chicago, IL, USA, 2010; Volume 2, pp. 190–192. [Google Scholar]
  49. Chen, L. Agent-based modeling in urban and architectural research: A brief literature review. Front. Archit. Res. 2012, 1, 166–177. [Google Scholar] [CrossRef] [Green Version]
  50. Railsback, S.F.; Lytinen, S.L.; Jackson, S.K. Agent-based Simulation Platforms: Review and Development Recommendations. Simulation 2006, 82, 609–623. [Google Scholar] [CrossRef]
  51. Badham, J. Review of An Introduction to Agent-Based Modeling: Modeling Natural, Social, and Engineered Complex Systems with NETLogo. Available online: http://jasss.soc.surrey.ac.uk/18/4/reviews/2.html (accessed on 31 July 2016).
  52. Klopfer, E.; Scheintaub, H.; Huang, W.; Wendel, D. StarLogo TNG. In Artificial Life Models in Software; Komosinski, M., Adamatzky, A., Eds.; Springer: London, UK, 2009; pp. 151–182. [Google Scholar]
  53. West, T.A.P.; Grogan, K.A.; Swisher, M.E.; Caviglia-Harris, J.L.; Sills, E.; Harris, D.; Roberts, D.; Putz, F.E. A hybrid optimization-agent-based model of REDD+ payments to households on an old deforestation frontier in the Brazilian Amazon. Environ. Model. Softw. 2018, 100, 159–174. [Google Scholar] [CrossRef]
  54. Banitz, T.; Gras, A.; Ginovart, M. Individual-based modeling of soil organic matter in NetLogo: Transparent, user-friendly, and open. Environ. Model. Softw. 2015, 71, 39–45. [Google Scholar] [CrossRef] [Green Version]
  55. Speelman, E.N.; García-Barrios, L.E. Agrodiversity v.2: An educational simulation tool to address some challenges for sustaining functional agrodiversity in agro-ecosystems. Ecol. Model. 2010, 221, 911–918. [Google Scholar] [CrossRef]
  56. DeGregorio, B.A.; Westervelt, J.D.; Weatherhead, P.J.; Sperry, J.H. Indirect effect of climate change: Shifts in ratsnake behavior alter intensity and timing of avian nest predation. Ecol. Model. 2015, 312, 239–246. [Google Scholar] [CrossRef]
  57. Castilla-Rho, J.C.; Mariethoz, G.; Rojas, R.; Andersen, M.S.; Kelly, B.F.J. An agent-based platform for simulating complex human–aquifer interactions in managed groundwater systems. Environ. Model. Softw. 2015, 73, 305–323. [Google Scholar] [CrossRef]
  58. Liu, Y. Relationship between industrial firms, high-carbon and low-carbon energy: An agent-based simulation approach. Appl. Math. Comput. 2013, 219, 7472–7479. [Google Scholar] [CrossRef]
  59. Tarigan, S.D. Modeling effectiveness of management practices for flood mitigation using GIS spatial analysis functions in Upper Cilliwung watershed. IOP Conf. Ser. Earth Environ. Sci. 2016, 31, 012030. [Google Scholar] [CrossRef] [Green Version]
  60. Karsai, I.; Roland, B.; Kampis, G. The effect of fire on an abstract forest ecosystem: An agent based study. Ecol. Complex. 2016, 28, 12–23. [Google Scholar] [CrossRef]
  61. Miller, B.W.; Breckheimer, I.; McCleary, A.L.; Guzmán-Ramirez, L.; Caplow, S.C.; Jones-Smith, J.C.; Walsh, S.J. Using stylized agent-based models for population–environment research: A case study from the Galápagos Islands. Popul. Environ. 2010, 31, 401–426. [Google Scholar] [CrossRef]
  62. Gao, M.; Zhou, L.; Chen, Y. An Alternative Approach for High Speed Railway Carrying Capacity Calculation Based on Multiagent Simulation. Discret. Dyn. Nat. Soc. 2016, 2016, e4278073. [Google Scholar] [CrossRef]
  63. Riaz, F.; Jabbar, S.; Sajid, M.; Ahmad, M.; Naseer, K.; Ali, N. A collision avoidance scheme for autonomous vehicles inspired by human social norms. Compute. Electr. Eng. 2018, 69, 690–704. [Google Scholar] [CrossRef]
  64. Vo, T.T.A.; van der Waerden, P.; Wets, G. Micro-simulation of Car Drivers’ Movements at Parking Lots. Proced. Eng. 2016, 142, 100–107. [Google Scholar] [CrossRef] [Green Version]
  65. Delcea, C.; Cotfas, L.-A.; Salari, M.; Milne, R. Investigating the Random Seat Boarding Method without Seat Assignments with Common Boarding Practices Using an Agent-Based Modeling. Sustainability 2018, 10, 4623. [Google Scholar] [CrossRef]
  66. Delcea, C.; Cotfas, L.-A.; Paun, R. Airplane Boarding Strategies Using Agent-Based Modeling and Grey Analysis. In Computational Collective Intelligence; Nguyen, N.T., Pimenidis, E., Khan, Z., Trawiński, B., Eds.; Springer International Publishing: Cham, Germany, 2018; Volume 11055, pp. 329–339. [Google Scholar]
  67. Wang, H.; Mostafizi, A.; Cramer, L.A.; Cox, D.; Park, H. An agent-based model of a multimodal near-field tsunami evacuation: Decision-making and life safety. Trans. Res. Part C Emerg. Technol. 2016, 64, 86–100. [Google Scholar] [CrossRef]
  68. Gutierrez-Milla, A.; Borges, F.; Suppi, R.; Luque, E. Individual-oriented Model Crowd Evacuations Distributed Simulation. Proced. Comput. Sci. 2014, 29, 1600–1609. [Google Scholar] [CrossRef] [Green Version]
  69. Nagarajan, M.; Shaw, D.; Albores, P. Informal dissemination scenarios and the effectiveness of evacuation warning dissemination of households—A Simulation study. Proced. Eng. 2010, 3, 139–152. [Google Scholar] [CrossRef]
  70. Faroqi, H.; Mesgari, M.-S. Agent-Based Crowd Simulation Considering Emotion Contagion for Emergency Evacuation Problem. ISPRS Int. Arch. Photogramm. Remote Sens. Spat. Inform. Sci. 2015, XL-1-W5, 193–196. [Google Scholar] [CrossRef]
  71. Delcea, C.; Cotfas, L.-A.; Paun, R. Agent-Based Optimization of the Emergency Exits and Desks Placement in Classrooms. In Computational Collective Intelligence; Nguyen, N.T., Pimenidis, E., Khan, Z., Trawiński, B., Eds.; Springer International Publishing: Cham, Germany, 2018; Volume 11055, pp. 340–348. [Google Scholar]
  72. Liu, R.; Jiang, D.; Shi, L. Agent-based simulation of alternative classroom evacuation scenarios. Front. Arch. Res. 2016, 5, 111–125. [Google Scholar] [CrossRef] [Green Version]
  73. Taboada, M.; Cabrera, E.; Iglesias, M.L.; Epelde, F.; Luque, E. An Agent-Based Decision Support System for Hospitals Emergency Departments. Proced. Comput. Sci. 2011, 4, 1870–1879. [Google Scholar] [CrossRef] [Green Version]
  74. Delcea, C.; Bradea, I.A.; Cotfas, L.A.; Scarlat, E. Opinion influence in online social media environments—A grey system theory and agent-based modeling approach. In Proceedings of the 2017 International Conference on Grey Systems and Intelligent Services (GSIS), Stockholm, Sweden, 8–11 August 2017; pp. 349–355. [Google Scholar]
  75. D’Alessandro, S.; Johnson, L.; Gray, D.; Carter, L. Consumer satisfaction versus churn in the case of upgrades of 3G to 4G cell networks. Mark. Lett. 2015, 26, 489–500. [Google Scholar] [CrossRef]
  76. Jung, J.J. Measuring trustworthiness of information diffusion by risk discovery process in social networking services. Qual. Quant. 2014, 48, 1325–1336. [Google Scholar] [CrossRef]
  77. Dubovi, I.; Dagan, E.; Sader Mazbar, O.; Nassar, L.; Levy, S.T. Nursing students learning the pharmacology of diabetes mellitus with complexity-based computerized models: A quasi-experimental study. Nurse Educ. Today 2018, 61, 175–181. [Google Scholar] [CrossRef]
  78. Shiflet, A.B.; Shiflet, G.W. An Introduction to Agent-based Modeling for Undergraduates. Proced. Comput. Sci. 2014, 29, 1392–1402. [Google Scholar] [CrossRef] [Green Version]
  79. Dickes, A.C.; Sengupta, P. Learning Natural Selection in 4th Grade with Multi-Agent-Based Computational Models. Res. Sci. Educ. 2013, 43, 921–953. [Google Scholar] [CrossRef]
  80. Visintainer, T.; Linn, M. Sixth-Grade Students’ Progress in Understanding the Mechanisms of Global Climate Change. J. Sci. Educ. Technol. 2015, 24, 287–310. [Google Scholar] [CrossRef]
  81. Waight, N.; Gillmeister, K. Teachers and Students’ Conceptions of Computer-Based Models in the Context of High School Chemistry: Elicitations at the Pre-intervention Stage. Res. Sci. Educ. 2014, 44, 335–361. [Google Scholar] [CrossRef]
  82. Ginovart, M. Discovering the Power of Individual-Based Modelling in Teaching and Learning: The Study of a Predator-Prey System. J. Sci. Educ. Technol. 2014, 23, 496–513. [Google Scholar] [CrossRef]
  83. Jacobson, M.J.; Kim, B.; Pathak, S.; Zhang, B. To guide or not to guide: Issues in the sequencing of pedagogical structure in computational model-based learning. Interact. Learn. Environ. 2015, 23, 715–730. [Google Scholar] [CrossRef]
  84. Hmelo-Silver, C.E.; Liu, L.; Gray, S.; Jordan, R. Using representational tools to learn about complex systems: A tale of two classrooms. J. Res. Sci. Teach. 2015, 52, 6–35. [Google Scholar] [CrossRef]
  85. Shqair, M.; Altarazi, S.; Al-Shihabi, S. A statistical study employing agent-based modeling to estimate the effects of different warehouse parameters on the distance traveled in warehouses. Simul. Model. Pract. Theory 2014, 49, 122–135. [Google Scholar] [CrossRef]
  86. Kosmann, W.J.; Sarkani, S.; Mazzuchi, T. Optimization of space system development resources. Acta Astronaut. 2013, 87, 48–63. [Google Scholar] [CrossRef]
  87. Wooldridge, M.; Jennings, N.R. Intelligent agents: Theory and practice. Knowl. Eng. Rev. 1995, 10, 115–152. [Google Scholar] [CrossRef]
  88. Getchell, A. Agent-based Modeling. Available online: http://rgdoi.net/10.13140/RG.2.1.2880.8803 (accessed on 7 January 2019).
  89. Koeske, G.F.; Kirk, S.A.; Koeske, R.D.; Rauktis, M.B. Measuring the Monday blues: Validation of a job satisfaction scale for the human services. Soc. Work Res. 1994, 18, 27–35. [Google Scholar] [CrossRef] [PubMed]
  90. Spanos, Y.E.; Lioukas, S. An examination into the causal logic of rent generation: Contrasting Porter’s competitive strategy framework and the resource-based perspective. Strateg. Manag. J. 2001, 22, 907–934. [Google Scholar] [CrossRef]
  91. Delcea, C.; Bradea, I.-A. Patients’ perceived risks in hospitals: A grey qualitative analysis. Kybernetes 2017, 46, 1408–1424. [Google Scholar] [CrossRef]
  92. Brown, T.A. Confirmatory Factor Analysis for Applied Research, 2nd ed.; Methodology in the Social Sciences; The Guilford Press: New York, NY, USA; London, UK, 2015. [Google Scholar]
  93. Byrne, B.M. Structural Equation Modeling With AMOS: Basic Concepts, Applications, and Programming, 3rd ed.; Routledge: London, UK, 2016. [Google Scholar]
  94. Hu, L.; Bentler, P.M. Cutoff criteria for fit indexes in covariance structure analysis: Conventional criteria versus new alternatives. Struct. Equ. Model. Multidiscip. J. 1999, 6, 1–55. [Google Scholar] [CrossRef]
  95. Harrington, D. Confirmatory Factor Analysis; Pocket Guides to Social Work Research Methods; Oxford University Press: Oxford, UK; New York, NY, USA, 2009. [Google Scholar]
  96. Paswan, A.; D’Souza, D.; Zolfagharian, M.A. Toward a Contextually Anchored Service Innovation Typology. Decis. Sci. 2009, 40, 513–540. [Google Scholar] [CrossRef]
Figure 1. Example of a Facebook post related to the existence of cutlery and straws from avocado seeds—posted on 5 February 2019.
Sustainability 11 01796 g001
Figure 2. The considered construction. Knowledge Degree (KD), Environmental Awareness (E-AW), Environmental Attitude (E-AT), Online Media Exposure (OME), OOnline Social Influence–Power to Influence (OSI–PI), Online Social Influence–Susceptibility to be Influenced (OSI–SI), and Buying Intention and Decision (BID).
Sustainability 11 01796 g002
Figure 3. The knowledge degree (KD) answers repartition on each question.
Sustainability 11 01796 g003
Figure 4. The environmental awareness (E-AW) answers repartition on each question.
Sustainability 11 01796 g004
Figure 5. The online media exposure (OME) answers repartition on each question.
Sustainability 11 01796 g005
Figure 6. The online social influence–power to influence (OSI-PI) answers repartition on each question.
Sustainability 11 01796 g006
Figure 7. The online social influence–susceptibility to be influenced (OSI–SI) answers repartition on each question.
Sustainability 11 01796 g007
Figure 8. An online commercial for an eco-friendly toothbrush together with some Facebook users’ comments.
Sustainability 11 01796 g008
Figure 9. The graphical user interface (GUI).
Sustainability 11 01796 g009
Figure 10. Running experiments with BehaviorSpace.
Sustainability 11 01796 g010
Figure 11. Changes in adoption time for different increases in media exposure—the case of soft goods.
Sustainability 11 01796 g011
Figure 12. Changes in adoption time for different increases in media exposure—the case of durable goods.
Sustainability 11 01796 g012
Table 1. Standardized regression weights, average variance extracted (AVE) and construct reliability (CR).
E-AWE-ATOMEOSI-SIOSI-PIBIDKD
E-AW10.661
E-AW20.767
E-AW30.848
E-AT1 0.669
E-AT2 0.926
E-AT3 0.823
OME1 0.872
OME2 0.896
OSI-SI1 0.813
OSI-SI2 0.855
OSI-SI3 0.895
OSI-PI1 0.893
OSI-PI2 0.896
OSI-PI3 0.925
BID1 0.732
BID2 0.888
BID3 0.780
BID4 0.506
BID5 0.676
KD1 0.695
KD2 0.781
KD3 0.772
KD4 0.735
AVE0.5810.6610.7820.7310.8190.5290.557
CR0.8770.9090.9310.9380.9630.9000.897
Table 2. Model fit summary—calculated for the minimum (CMIN). NPAR = number of parameters; CMIN = minimum discrepancy; DF = degrees of freedom; P = probability; CMIN/DF = minimum discrepancy over the degrees of freedom.
ModelNPARCMINDFPCMIN/DF
Default model90464.0802090.0002.220
Saturated model2990.0000
Independence model235455.0902760.00019.765
Table 3. Model fit summary—Baseline comparison. NFI: normed fit index; RFI: relative fit index; IFI: incremental fit index; TLI: Tucker–Lewis index; CFI: comparative fit index.
ModelNFI
Delta1
RFI
rho1
IFI
Delta2
TLI
rho2
CFI
Default model0.9150.8880.9510.9350.951
Saturated model1.000 1.000 1.000
Independence model0.0000.0000.0000.0000.000
Table 4. Model fit summary—root mean square error of approximation (RMSEA). LO 90 = lower end of a 90% confidence interval on this estimate; HI 90 = upper end of a 90% confidence interval on this estimate; PCLOSE = closeness of fit.
ModelRMSEALO 90HI 90PCLOSE
Default model0.0550.0480.0610.122
Independence model0.2140.2100.2190.000
Table 5. The maximum, minimum, and average number of ticks for the 40.000 considered cases.
CaseNo. of Ticks
MinMaxAverage
Case1280699484.19
Case2538373.32
Case35721257963.41
Case4147245191.73
Table 6. The time comparison between different levels of population.
Case 2Population (No. of Agents)
1002004006008001000
No. of ticks73.3473.3173.3273.2973.3073.28
Table 7. The time sensitivity to increases in social media exposure—case of soft goods.
Case 2% of Increasement in Social Media Exposure
10%20%30%40%50%60%70%80%90%100%
No. of ticks68.564.162.160.358.156.453.851.646.243.4
Time reduction (in ticks)4.89.211.21315.216.919.521.727.129.9
Time reduction (in %)6.612.615.317.820.823.126.629.63740.8
Table 8. The time sensitivity to increases in social media exposure—case of durable goods.
Case 4% of Increasement in Social Media Exposure
10%20%30%40%50%60%70%80%90%100%
No. of ticks175.3171.2164.6153.9147.3141.5137.3131.2123.6120.4
Time reduction (in ticks)16.4320.5327.1337.8344.4350.2354.4360.5368.1371.33
Time reduction (in %)8.5710.7114.1519.7323.1726.2028.3931.5735.5337.20

