1. Introduction
The sustainability of cities is threatened by the excessive dependency on automobiles. Therefore, a variety of measures have been implemented to restrain the growing demand for car travel in urban areas [
1]. Public transport is one of the most important measures for reducing car travel. In Japan, local public transport operators have traditionally been required to independently balance their revenue and expenses. The national government policy still considers public transportation to be ‘self-supporting’ [
2]. However, the total costs of most bus companies cannot be covered solely by ticket revenues due to the decline in public transport patronage. In order to cover these deficits, local governments have had to set up public transport subsidy programs funded from their general accounts. Moreover, most cities in Japan simply employ the loss-making subsidy policy, under which the government provides sufficient subsidy to cover the gradually increasing deficits of bus operators. Due to the lack of scientific and operational calculation methods, the financial burden caused by subsidies on local governments is ever-increasing, and it is hard to maintain sustainable finance.
However, subsidizing public transport modes is commonly viewed as a cost-effective policy for encouraging private car drivers to shift towards the environmentally friendly alternative of public transit. In the recent past, designing efficient subsidy schemes to improve the sustainability of urban transport systems has attracted considerable attention. Subsidy schemes usually can be divided into “subsidy based on the loss” and “subsidy based on performance”. The subsidy based on the loss includes direct financial subsidy for policy losses and special subsidy for vehicle renewal and fuel price riseetc [
3]. However, there are many disputes about subsidies. For example, Karlaftis concluded that there is an inverse relationship between system performance and subsidies [
4]. A potentially major problem is the inefficiency induced by the operation of public transport services by some types of subsidies [
5,
6]. Someresearch considered the problem through the subsidy scheme based on performance and the use of service quality indicators in service contracts [
7,
8,
9,
10,
11], action taken by the regulator to enforce penalties for poor performance, and the application of competitive tendering [
12,
13,
14,
15,
16]. The subsidy mechanism in London is payment to the operator of a specified sum of provision of the specified service for a specified period, with all revenue collected being for the account of the government [
17]. Worcman concluded that contract payments of bus services in Curitiba, Brazil, are calculated from an analysis of each operator’s cost structure, and profit margins are set at 10% of turnover [
18]. However, Daraio et al. proposed that the regulator has less information on technology and costs than the bus company itself [
19]. Consequently, local transit systems have an incentive to operate at a deficit, or at least do not have sufficient incentive to reducecosts [
20].
However, since bus operators work as a participant in public transport, they should take responsibility to cut deficits to lessen the financial burden on the government to guarantee the sustainable finance. Eventually, the social benefit is maximized, since the objective of public transport is making the city’s development sustainable.
Therefore, it is important to identifying an appropriate incentive subsidy scheme that considers asymmetric information between bus operators and the government. Such schemes not only enable bus operators to obtain a premium for making efforts to reduce deficits, but also enable the local government to reduce the total amount of subsidies, and eventually the social benefit is maximized. In this case, both bus operators and the local government can reach a win-win solution.
The main purpose of this paper is to propose an incentive subsidy scheme based on the Laffont–Tirole model [
21], which has been widely applied in the regulation of other industries [
22,
23,
24] but has rarely been studied in the field of public transport. Following a brief introduction tothe situation of public transport subsidies in Japan, we provide an overview of the relevant work on public transport subsidies research. We then put forth an incentive subsidy scheme based on the Laffont–Tirolemodel based on perfect information and imperfect information, and show through empirical analysis that it can play a role in reducing the public transport subsidies of Kumamoto, Japan. Finally, according to sensitivity analysis results, we suggest that line lengths should be shortened to avoid the effects of asymmetric information and cost waste.
2. Incentive Subsidy Scheme Model
Public transport subsidies keep fares below operating costs and maintain or expand services regardless of profitability [
25]. However, the present subsidy scheme in Japan requires that local governments pay an amount of subsidy to fully cover the deficits incurred by bus operators, as shown in the left side of
Figure 1. Bus operators have no incentive to make efforts to reduce deficits under this situation, and consequently the amount of subsidies rises year by year. Therefore, it is essential to design a new subsidy scheme to improve the situation to realize financial sustainability.
A new incentive subsidy scheme, as represented in the right side of
Figure 1, is proposed. Under this scheme, local governments will give premiums to bus operators if they make efforts to reduce deficits. A win-win result, in which bus operators receive a premium and the local government lessens its subsidies, is thus possible. The Laffont–Tirole model, put forward by LaffontandTirole, is the classic model of procurement under a state of asymmetric information [
21].The incentive scheme proposed in the present study is based on the Laffont–Tirole model with maximizing social benefit that is the goal of public transport as the object as following, and the service level under the scheme is assumed to be the same as the level under the present situation:
where
social benefit;
net benefit of the passengers;
excess profit (utility level) of the bus operator;
benefit of passengers;
pubic transport subsidies;
shadow cost of public fund;
disutility of effort
(
);
net monetary premiums received from the government;
actual deficit after effort;
deficit without effort to reduce deficit; and
the level of cost reduction or “effort” performance by the bus operator.
The object of the incentive model is to maximize social benefits (Equation (1)), which are comprised of the benefits to passengers and to bus operators. The net benefit to passengers is calculated through Equation (2), while that to the bus operator is calculated through Equation (3). The local government compensates net monetary premiums to bus operators as a reward for their efforts to reduce deficits. Conversely, bus operators will experience a disutility when exerting effort level . Equation (4) is used to calculate the subsidies, which consist of net monetary premiums and reimbursement of deficits. Equation (5) is the deficits of each bus line of the operator. Equation (6) states that the utility level of the bus operator must be non-negative to obtain its participation; this is the firm’s individual rationality constraint.
Information about the deficit and the effort between the local government and bus operators is asymmetric, and the optimal social benefit in terms of different information is different.
2.1. Optimal Social Benefit under Perfect Information
Under a state of perfect information, that is, knowing
and observing
, the local government would solve the following incentive model (Equation (7)) subject to the bus operator’s individual rationality constraint (Equation (8)):
The solution of the model is:
The optimal solution is that the marginal disutility of effort must be equal to marginal cost savings, as Equation (9) shows. This means that there is no distortion for the most efficient bus operator. Furthermore, Equation (10) means that the bus operator receives no excess profit in the optimal solution, that is, premiums should equal the disutility value of optimization efforts.
In order to implement this optimal subsidy scheme, the government will offer bus operators a fixed-subsidy contract. Under such a contract, the total amount of premiums is decided by Equation (11) and the bus operator takes all risk and increases profit by taking efforts to reduce cost:
2.2. Optimal Social Benefit under Imperfect Information
Under a state of imperfect information, the local government does not know the accurate deficit
, but only knows that it belongs to an interval
. Maximizing social benefit is calculated by Equation (12) under the incentive compatibility and individual rationality constraints:
where
is the absolute continuous distribution function which describes the prior of the government to the deficit
in the interval
.
Equation (12) is used to calculate the optimal social benefit under imperfect information. Equations (13) and (14) are incentive compatibility constraints, and Equation (15) is the individual rationality constraint.
Integrating Equation (13), we obtain Equation (16):
Since rents are socially costly, the government sets
. Integrating by parts, the expected rent to be given up by the government is:
Substituting Equation (17) into Equation (12), the optimization problem can be obtained as shown by Equation (18):
Then, the condition required by the optimal
is obtained as Equation (19). The optimal premium is calculated by Equation (20):
3. Empirical Analysis
This paper examines effects of our incentive subsidy scheme by taking the public transport network in the Kumamoto urban area in Japan as the research object. We first introduce the public transport situation of Kumamoto, which in recent years has deteriorated. Bus operators’ desire to maximize profit and the government desire to reduce subsidies and maximize social benefit. Therefore, the incentive subsidy scheme was applied to the bus network to satisfy the above requirements. Due to the existence of hidden information, sensitivity analysis regarding how imperfect information affects the subsidy is performed at the end of this paper.
3.1. Public Transport Situation in Kumamoto
There are three public transport modes in Kumamoto, and they are bus, Japan Railway and Electric Railway. Japan Railway supplies the service from Kumamoto to other cities, and the service of Electric Railway is supplied to connect the central area in the city. The public transit in the Kumamoto between urban area and suburb area is mainly afforded by the bus that is operated by one municipal and three private bus companies. There are 117 lines and the total length of the bus network is 2703 km. Due to the popularity of private cars and to population decline, total bus patronage has fallen by about 30% over the last 10 years. Meanwhile, the bus use ratio by commuters in Kumamoto city is about11.6%, which is lower compared with those of other similar size cities in population and density. This has resulted in dramatic deterioration of the economic and financial performance of local public transport firms. The local public transport sector has been characterized by skyrocketing deficits. Additionally, the city government subsidy reached about 1.065 billion yen of wages to municipal transport in 2017. Therefore, the large subsidies have become a heavy financial burden on the city government.
Deficits
of the bus network can be obtained by the difference between income and expenditure, and the result is shown in
Table 1.
It can be seen from
Table 1 that nearly 74% of bus lines are deficit-making, meaning that the government must supply the same amount of subsidy as the deficit to bus operators to maintain the bus service. Accordingly, it is essential to apply the above incentive subsidy scheme model into public transport in Kumamoto. Since the scheme aims to force bus operators to take efforts to reduce deficits on deficit-making lines, we apply the model to the deficit-making bus lines to examine its effects.
To calculate the incentive model, the users’ benefit and the disutility of effort are required in advance.
3.2. Calculatingthe Benefit of the Patronage
Here, passenger benefit is the saving of money, time, fuel emission, and other aspects caused by the bus network. The public Transport Planning Book of Kumamoto City points out that the benefit to passengers of the whole bus network is 4.523 billion yen [
26]. The parameter, passengers’ benefit, by line
is calculated by distributing the total amount of passengers’ benefit of the reorganized bus network into every deficit-making bus line in proportion to their passenger hours. In this paper, the benefit of passengers is the same under the present scheme as that under the incentive scheme, as the service level is assumed to be constant.
The calculation of
is done with Equation (21):
where,
passengers’ benefit of line
;
passengers of line
between bus stop pair
; and
travel time of line
between bus stop pair
.
3.3. Calculating the Disutility of Effort
The disutility of effort
is very difficult to measure from actual data because it is unforeseeable loss. Although some researchers had assumed it followed a formula
[
27], when studied, this was neither confirmed nor disproved. Here, considering the field we studied, we assume the premium
is used to replace
, since disutility occurs due to bus operators taking efforts to reduce cost to obtain premiums and only bus operators can estimate it through actual operation.
As bus operators are able to obtain premiums equal to the cost they reduced, we use the contingency valuation method (CVM) to estimate
, and contingent valuation surveys should be designed in a yes-or-no format [
28,
29,
30].
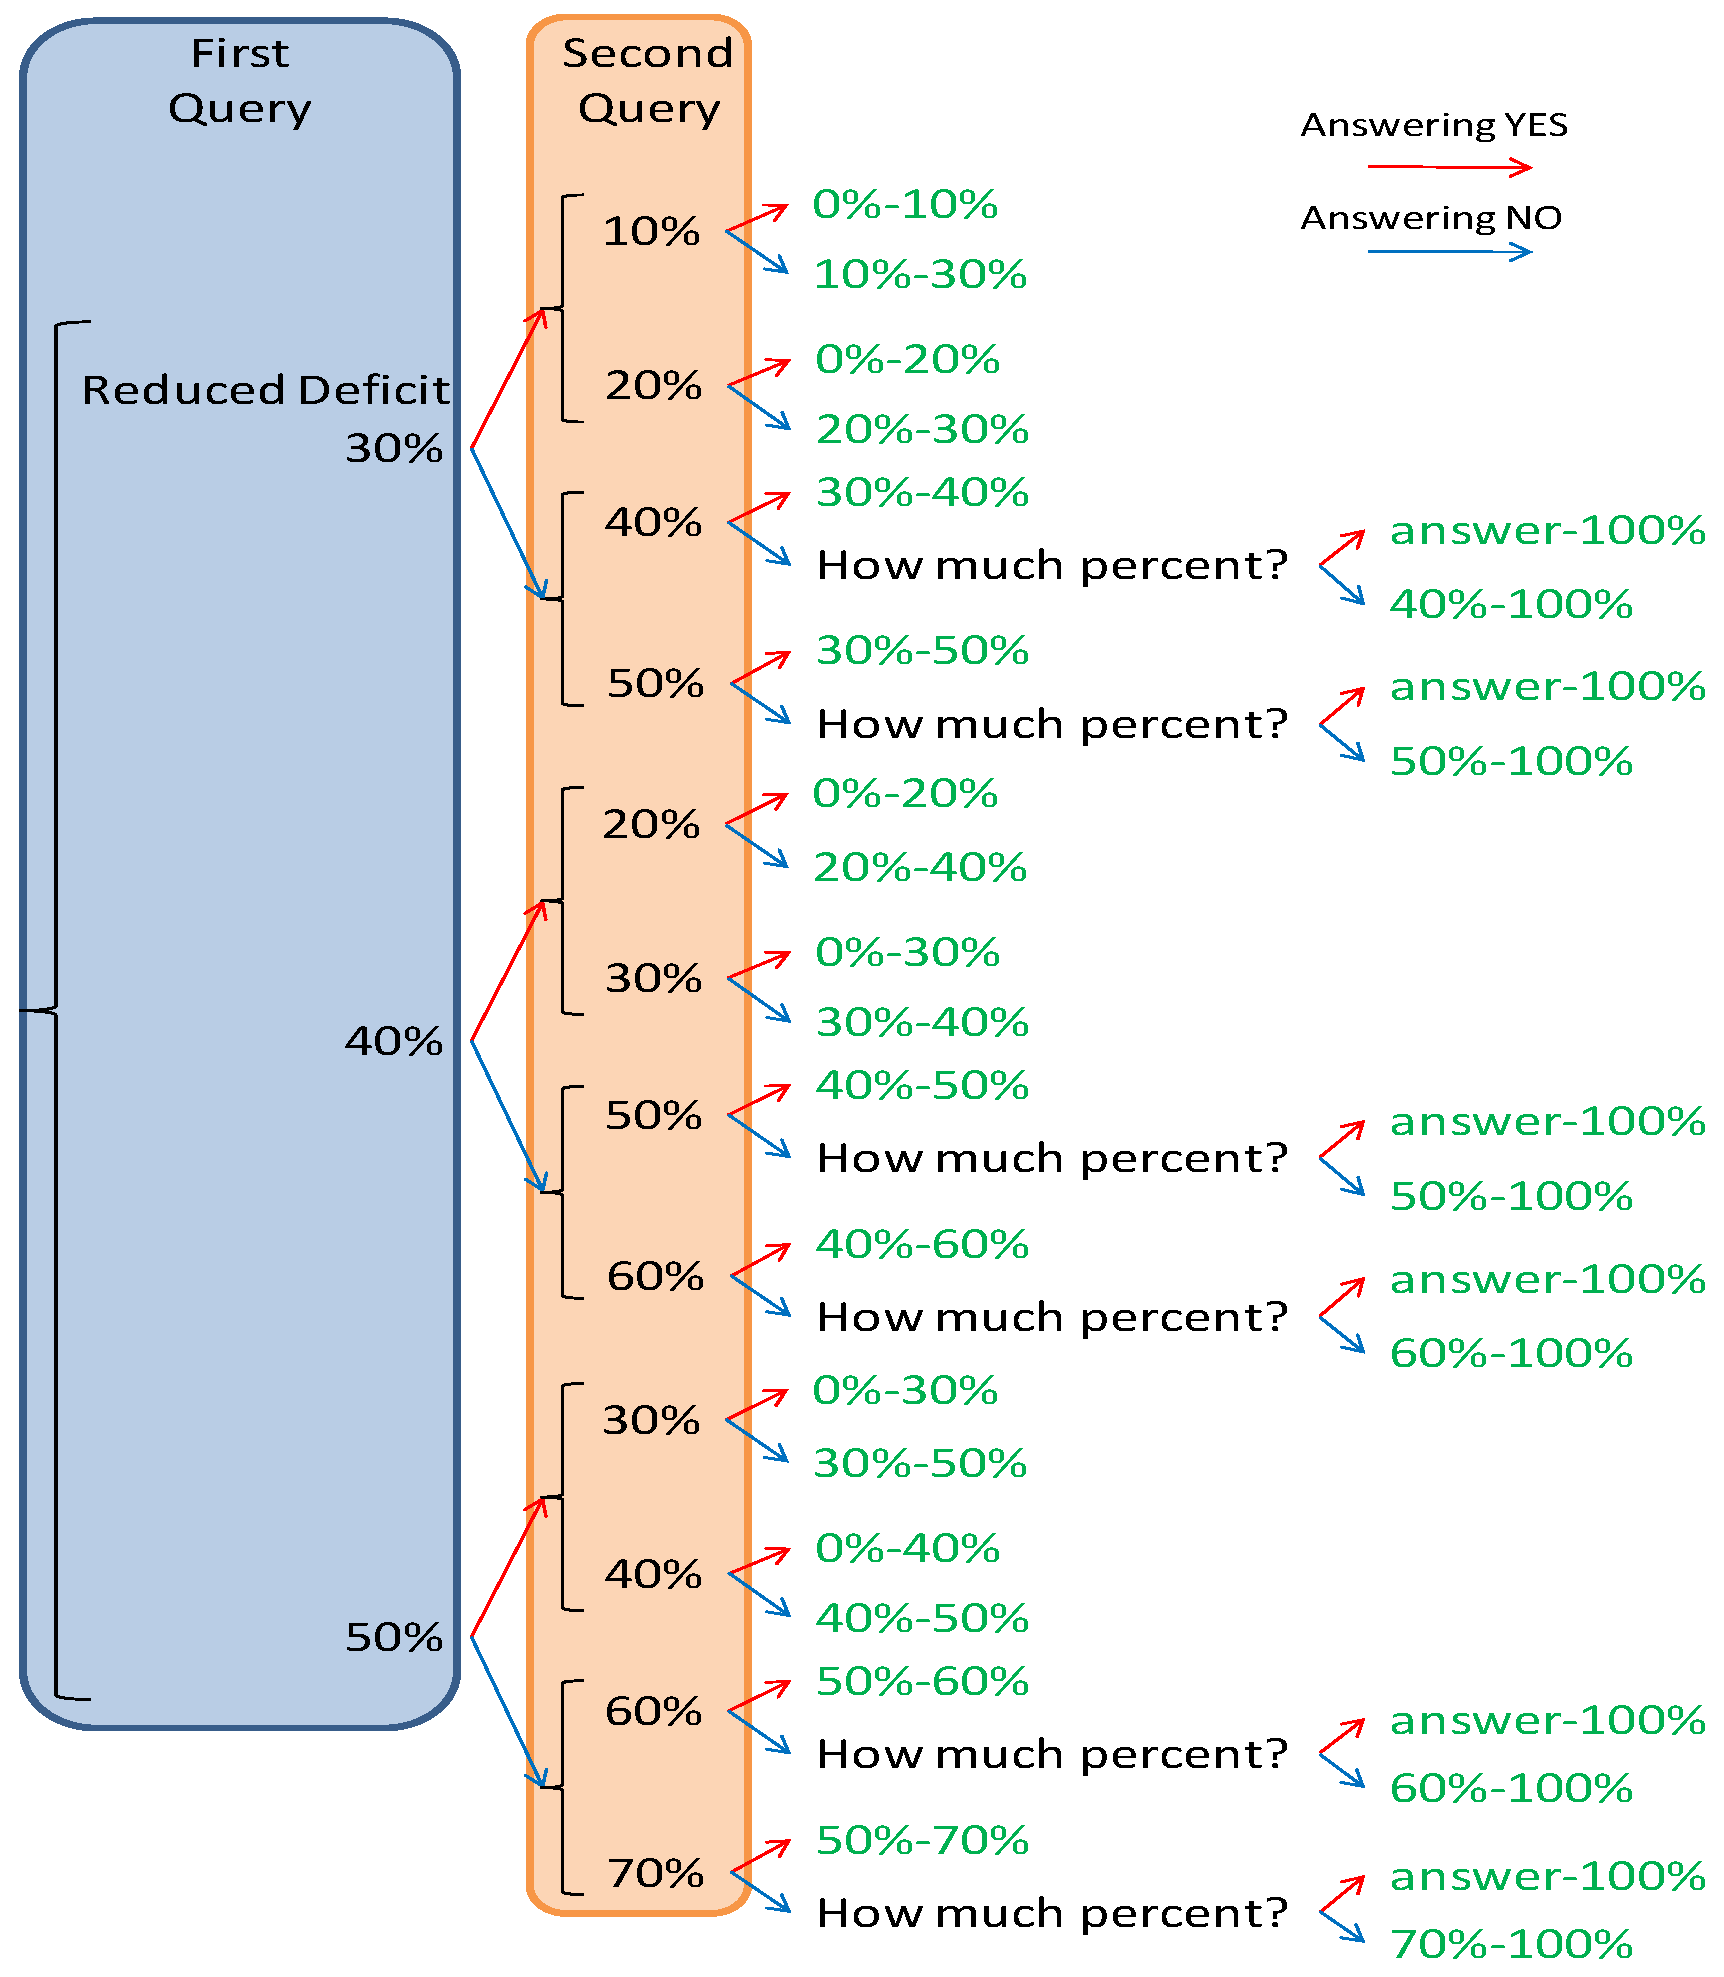
Therefore, the double-bounded dichotomous choice (DBDC) of CVM is used to obtain
through a questionnaire survey. Respondents are asked whether they would accept premiums of
yen when taking efforts to reduce cost. When “yes” is answered, they will be asked whether they would accept lower premiums with the same reduced cost in the next step. Otherwise, they will be asked whether they would accept higher premiums with the same reduced cost.
Figure 2 depicts the questionnaire process.
The survey was conducted using four bus operators regarding10 bus lines with a deficit. There are five levels of effort (5%, 10%, 25%, 50%, and 80% of the total deficit) that can be chosen by bus operators. Through the survey, the range of premiums the operator wishes to receive under some line can be obtained. In order to obtain exact premiums, we assumed that premiums
for bus line
follow the distribution of
. The functions
and
are respectively defined by Equations (22) and (23):
where,
the average premium of bus line
;
maximum effort (
deficit without effort);
characteristic of bus line
; and
unknown parameters.
Therefore, the premium
follows the distribution of
. The probability of the bus operator accepting premiums
for line
under a level of effort is defined by Equation (24):
The unknown parameters
and
are estimated by maximum likelihood function Equation (25) using the surveyed data. The calibrated result is shown in
Table 2.
where
the probability of answering “yes” to both queries for line
;
the probability of answering “yes” to the first query but “no” to the second query for line
;
the probability of answering “no” to the first query but “yes” to the second query for line
; and
the probability of answering “no” to both queries for line
.
3.4. Subsidies under PerfectInformation
Calculating the data of deficit-making lines on the reorganized bus network revealed that the total deficits reached 2.909 billion yen. Under perfect information, the calculation of the optimal effort
and optimal premiums
are respectively shown by Equations (9) and (10).
Table 3 shows a comparison of the present subsidy scheme with the incentive subsidy scheme aiming at the surveyed bus lines. It can be seen that bus operators will take efforts to reduce deficits by1.140 billion yen while accepting 1.002 billion yen in premiums. Meanwhile, the government will reduce subsidies by 0.538 billion yen. This value corresponds to about 18%of the original amount of subsidies. The local government and bus operators achieve a win-win solution in the incentive subsidy scheme, and eventually the social benefit also increases.
3.5. Subsidies under ImperfectInformation
As in the above model, the condition required by the optimal effort under imperfect information is .
We also constructed a formula representing disutility as Equation (22), and the relationship between effort
and deficit
can be obtained through substituting Equation (22) into the above condition:
Under imperfect information, the local government does not know the exact deficits
, only knows that
belongs to the interval
. In order to obtain the optimal effort
to maximize the social benefit, the distribution rule of
should be known. Here, actual deficits
are assumed to respectively follow the unit distribution and the normal distribution to know whether the distribution of
will affect the final result. Also, the range of
is respectively assumed to be 0.1%, 6.0%, and 10% in order to analyze how different degrees of imperfect information affect the result. When the range is 10%, it means that
is 5% smaller than the exact deficit
while
is 5% larger than
. A smaller range of
more closely approximates that under perfect information. A comparison of different subsidy schemes under different degrees of information is shown in
Table 4.
In unit distribution, bus operators will take more efforts compared to in the normal distribution, however the excess profit and the subsidies in the two types of distribution are the same if the range of is smaller. Otherwise, the amount of and in the unit distribution is larger than that in the normal distribution. This means the distribution of also affects the result of the incentive subsidy scheme, however, its effect is less significant than the effect of the range of .
It is seen that bus operators will take less efforts to reduce deficits when the information is more non-transparent, while they will get more excess profit. Taking to follow the normal distribution as an example, the effort gradually decreases from 1.137 billion yen to 1.130 billion yen as the range of increases from 0.1% to 10%. Meanwhile, the excess profit also increases from 0.01 million yen to 1.44 million yen, and the subsidies of the government grow from 2.372 billion yen to 2.515 billion yen. This means that more non-transparent information would help bus operators obtain more excess profit and result in more subsidies. However, regardless of the degree of information, the social benefit under the incentive subsidy scheme is higher than that under the present scheme.
3.6. Sensitivity Analysis under Imperfect Information
As Equation (26) shows, the optimal effort under imperfect information is related to the shadow cost
and the characteristic of bus line
. This means that
and
will affect the optimal subsidy. During the above calculation, the shadow cost
was assumed to be5% in accordance with standard research [
21]. However, whether the value is suitable in our case and whether it significantly affects the result is unknown. Therefore, we performed a sensitivity analysis of
to study its effect. A characteristic of bus lines may also affect results, and the sensitivity analysis under imperfect information was performed based on two situations:
3.6.1. Sensitivity Analysis Aiming at All Deficit-making Bus Lines
As the effect of distribution of
is not significant, here we only assumed that
follows the normal distribution and that the range is 6%. In order to obtain the effect, we assumed two extremes and one normal value of
. The value of
was respectively assumed to be0.1%, 5%, and 20%. Results are shown in
Table 5.
As Equation (26) shows, parameter
has a positive relationship with
. When
increases, there must be an increase in
. When
is greater, it is very difficult to achieve optimal efforts. As shown in
Table 5, bus operators take less effort to reduce deficit and pay less disutility as
increases. However, subsidies under different
change very little due to the effect of the superimposition of C,
and
. Due to the connotation of
, there is a great effect on the net benefit of passengers and society.
3.6.2. Sensitivity Analysis Aiming at Line Characteristic
Since the characteristic of bus lines in this paper is length, we chose three typical bus lines to study effects. The first line is long with bigger deficits. The second is also long, however has fewer deficits. The last one is short and has fewer deficits.
Table 6 represents the result.
For a better comparison, we set two extremes of the range of : one,0.1%, representing a situation similar with complete information; the other range, 16%, representing a more serious situation of asymmetric information between bus operators and government.
Through calculation, it was found that longer bus lines would require more effort to reduce cost whatever the range of . The percentage of the reduced subsidies accounting the original deficits is respectively 20%, 19%, and 18%, meaning that there is more cost waste that can be reduced through efforts when the line is longer. This also suggests that the length of lines should not be too largeto avoid more cost waste.
It is seen that only the first bus line obtained excess profit under the range of 0.1%. This bus line has the longest length and biggest deficits, which means it is easier to hide information to obtain excess profit. Additionally, the effect that had on it was the largest. The other two lines were not affected by the change of under this range.
When the range of is 16%, all three bus lines obtained excess profits. The excess profit of the first line accounted for about 9.2% of the total subsidies. The of the second line took the proportion of the total subsidies by 9, while the percentage of the third line was 7.7%. This means that the bus line can obtain greater excess profit if the length is longer and information is less transparent.
4. Conclusions
Public transport subsidies caused by deficits have become a huge financial burden on local governments in Japan. However, there is no motivation forbus operators to reduce deficits so as to lessen subsidies under the present subsidy scheme. Therefore, it is essential to design a new kind of subsidy scheme which will not only motivate bus operators to reduce deficits but also alleviate financial burdens on government. In this study, by taking public transport in Kumamoto, Japan as a research object, it was found that an incentive subsidy scheme based on the Laffont–Tirole model can allow local governments and bus operators to reach a win-win solution under perfect information. In the new scheme, not only can bus operators obtain premiums as the reward of reducing deficits, but local government can also save about 18% of the present subsidies under perfect information. However, under imperfect information, local governments will pay more subsidies because of the non-transparency of the information. Then, we performed a sensitivity analysis on factors that affect optimal efforts. Through calculation, it was found that the length of bus lines has an influence on effort and hidden information. When the length is longer, the bus operator may have more information hidden and cause more cost. The operation of longer lines would reduce the cost more if bus operators were inspired to take efforts to lessen deficits in order to obtain premiums. In order to make information more transparent between bus operators and government, and avoid more resource waste, a suggestion that bus lines should not be set too long is given. It is necessary to take efforts to reduce operational cost that the length of bus lines should be shorter [
31,
32,
33]. Meanwhile, the bus operator should control the manage cost, such as improving working efficiency, avoiding resource waste, and so on.
Eventually, the empirical analysis certifies that the incentive subsidy mechanism proposed by the research can realize the sustainable finance of bus operators and governments finance, and finally form a sustainable city with maximized social benefit. Based on the proposed model, the following suggestions and policies can be adopted for governments:
Bus operators play the most important role in bus operation, and they would like to reduce deficits if appropriate incentives are given in the contract. If a bus company takes measures to reduce its operating cost, it will increase its profit, and the more cost is reduced, the more social benefit will obtain. Therefore, under the subsidy mechanism presented in this paper, bus companies should improve management and operational efficiency and the government will pay fewer subsidies.
Bus operators can get more excess profits if the information between operators and the government is less transparent. And the asymmetric information may affect the service level and operating efficiency, which reduces the social benefit. Therefore, the length of bus lines is suggested not to be set too long to avoid more information being hidden.
Based on the existing research in this paper, various extensions should be considered: The above subsidy scheme is generally researched as a static situation; we will improve the incentive subsidy scheme not only to reduce operation cost but also to inspire bus operators promoting service level to attract more passengers. Additionally, we do not discuss how to continue when the contract period ends. However, governments will know more information hidden after one period ends, and we will research a dynamic incentive subsidy scheme based on more and more transparent information between bus operators and governments, which can make the service supplied by bus operators more efficient and maximize social benefit.


