1. Introduction
The energy and thermal performance in buildings have attained a global significance in the last decades due to the objective of maintaining thermal comfort with a more efficient approach. As energy efficiency is gaining importance, the construction sector has been forced to analyze the capacity of buildings to save energy. An adequate energy efficiency study should analyze the incorporation of heating, ventilation, air conditioning (HVAC) systems, building materials, architectonic design, etc. In addition to the possibility of energy reduction, it is also achievable to develop a design using a specific combination of materials and passive systems that improve thermal comfort in buildings.
To properly assess the thermal performance of buildings, computer simulation techniques stand out as powerful tools to explore the present and future behavior of the project. To carry out a dynamic simulation of a building, a great quantity of information is needed on the geometry of the building, weather data, and the thermal and optical properties of materials. The properties of the construction materials represent critical information, due to their influence on the energy balances of the building. Normally, for simulation purposes, the thermo-physical properties of materials, are obtained from average values published in books, research articles or normativity, which do not necessarily represent the actual properties of real materials.
The International Energy Agency (IEA) presented a list of recommendations for energy efficiency in buildings, transport, lighting, appliances, industry, and others. Therefore, one of the visualized actions to reduce the CO
2 emissions and its consequent effects on climate change is the implementation of tasks that would lead to the overall reduction of energy [
1]. The final energy use for cooling residential and commercial buildings worldwide has tripled between 1990 and 2016, while the energy used for heating has increased from 2.5% to 6% [
2].
In Mexico, the electricity needed for the summer season represents approximately MXN 31,000 million per year (EUR 1409 million). Furthermore, the government incurs an expense of MXN 46,000 million per year (EUR 2091 million) in subsidies to the domestic electricity tariff (1 € = 22 MXN, February 2019). There is a major complication on the national electricity grid to meet the cooling needs (7.5 GW of peak demand) due to the higher demand in concentrated geographical areas, during a fraction of the year and even specific hours of the day. In warm regions, the electricity needed to operate the cooling systems triples the normal electricity demand and, therefore, half of the electricity peak during the summer months [
3]. In addition, between 2000 and 2015, residential energy demand for cooling and heating systems increased by 33.4% and 19.6%, respectively [
4].
1.1. Energy Use in Buildings and Housing
In many countries, the increase in the use of energy to cool and heat spaces remains a problem, especially for those with extreme weather conditions. In Mexico, there are currently several energy saving programs for buildings issued by the federal government. These programs recommend the study and development of materials that offer alternatives to improve the thermal performance of buildings and thus reduce the CO
2 emissions. Muñoz-Torres presented a summary of initiatives and programs for energy saving in residential buildings during 1986–2013 [
5]. This compendium of strategies shows the interest in reducing the energy use. When buildings are not designed considering the climatic conditions of the location, they are highly influenced by the variations of the weather, which generates thermal discomfort for its occupants. One of the critical elements that restrict heat gains and losses on houses built in extreme weathers are the envelope materials. The main problem to be solved in Mexico’s economic hosing is the thermal performance of their envelope due to its construction characteristics. The most common materials are concrete masonry and red bricks, which are known to have low thermal resistance [
6]; this generates the need to use HVAC systems intensively.
Mitsopoulos et al. [
7] analyzed the impact of the insulation thickness in residential buildings of four climate zones in Greece. The energy consumption analysis shows that the optimum insulation thickness is 4 cm. They carried out a financial analysis including the simple payback period and the annual operating cost. Additionally, they calculated the CO
2 produced from the primary energy consumption. Other studies evaluate the optimal thickness of several insulation materials, including perlite, considering the payback time and total operative costs [
8]. The authors found that the most cost-effective material in a wall is expanded polystyrene, followed by extruded polystyrene, polyurethane, perlite and lastly polyvinyl chloride. Naji et al. [
9] carried out a study on the structural, economic and thermal performance of three different lightweight constructive systems (wood light frames, lightweight steel frames, and sandwich panels), obtaining the economic advantages that the insulation level comprises.
1.2. Sensitivity Analysis and Uncertainty Propagation
It is essential to discuss the importance of an appropriate sensitivity analysis and uncertainty propagation. Silva et al. [
10] performed a sensitivity analysis of the building parameters of four cities in Brazil. They found that the variables fluctuate greatly depending on the climatic data and with the variation of the building materials. In addition, the solar absorptivity and thermal capacity of walls and roofs are the most influential variables for the calculation of the degree-hour for cooling and the cooling energy consumption. Struck [
11] achieved several relevant conclusions when exploring the sensitivity analysis and uncertainty propagation on the energy consumption of buildings. The percent change of the parametric variations compared to a base case can be a measure of a sensitivity analysis. The author provided a list of the most influential properties of materials, which coincide with other studies in the literature. In addition, coupling statistical tools to the building simulation is recommended to perform the uncertainty propagation and sensitivity analysis, although this process is not a trivial endeavor. Tian et al. [
12], highlighted that uncertainty analysis is not a standard practice in the building industry. They encouraged the realization of such analysis as a mainstream methodology since statistical techniques are considered adequate to be incorporated in the analysis of a building.
Silva and Ghisi [
13] analyzed the impact of computer models on the energy consumption in buildings through the implementation of three types of tests: deterministic, parameter variation and uncertainty. They found that the simulation uncertainties influenced the energy requirements by 8.3–16%, where the cooling energy consumption typically had a bigger uncertainty of up to 7.4%. Burhenne et al. [
14] introduced a procedure to carry out an uncertainty analysis on simulations considering profitability. The results strongly depend on the utilized economic criteria, where the future energy prices stand as a critical parameter when compared to the initial investment costs. Finally, as an important conclusion for this section, Hopfe and Hensen [
15] stated that the uncertainty analysis can be used as a tool to deal with the uncertainties of physical properties of the materials. Even when this is inevitable, it can be traceable and evaluated.
1.3. Application of Lightweight Materials in Buildings
Studies referencing investigations on the thermal properties of construction materials are briefly discussed in the following. Marco et al., evaluated the thermal properties of a mortar with glass powder mixtures. The study shows that the incorporation of glass powder improved the mechanical resistance of the samples [
16]. Barros-Llerena et al. integrated glass fibers as mortar reinforcement and demonstrated that they could be applied to practical situations [
17]. Del Río Merino et al. carried out a study on the mechanical properties of filled mortars lightened with expanded clay [
18] and developed a model to find the mechanical strength of gypsum by knowing its density [
19].
Heim and Wieprzkowicz [
20] evaluated the effect on attenuation of temperature fluctuation of phase change materials (PCMs). A test of the thermal behavior of PCMs during heat gains and losses confirms that, with the addition of a PCM layer, the temperature fluctuations could be minimized. In another study, the thermal improvement of PCMs with a composite added with paraffin and expanded perlite is analyzed through numerical experimentation and modeling [
21]. The material was applied as a mortar on the interior of buildings; when compared to cement and gypsum prototypes, it shows an attenuation on the temperature amplitude and a reduction on the peak temperatures of up to 2.5 °C. Abidi et al. analyzed the impact on the thermal conductivity and mechanical behavior due to the incorporation of perlite, vermiculite, and cement to a PCM, concluding that the addition of perlite improves its capacity as thermal insulation [
22]. Other studies deepen on the relation between the thermal conductivity and mechanical resistance of such materials, which can be applied to lightweight mortars [
23,
24], zeolite clay bricks [
25] and insulated sustainable materials [
26].
Numerous simulation studies have been carried out in buildings. Within relevant references, it was found that researchers from Chile [
27] carried out experimental measurements of the thermal conductivity and thermal diffusivity of lightweight materials. The authors also performed dynamic simulations on a residential building constructed with the analyzed materials. The results show that the buildings located in the cold climate zones would comply with the current Chilean regulations, while the buildings in the warm climate zones are predicted to have high temperatures. In conclusion, thermal insulation must be considered for the warm climate zone, otherwise buildings will not obtain satisfactory adequacy. An analysis of the operative costs of a residence is carried out in Spain using the tools of Lider and Calener [
28]. Based on the grades achieved, the authors obtained mathematical models to explain the global behavior of buildings constructed on diverse climatic zones. The authors aimed to prove that the energy behavior of a building could be considered as a new parameter to influence the building’s market value. In addition, access to subsidies and tax incentive can be regulated with the purpose of promoting energy efficiency techniques.
A review article published by Rashidi et al. [
29] concludes that the incorporation of porous materials in buildings have the potential for energy saving; nevertheless, further investigation is still needed. The authors emphasized that most studies focus on materials composition, but additional studies for the application of such materials on buildings are required. Another review article deepens on the application of passive techniques and the incorporation of PCMs [
30]. The article focuses on the application of whole-building energy simulation tools, concluding that EnergyPlus, Trnsys, and ESP-r were the most used software to analyze the performance of buildings with PCMs on walls, partitions, roof, floor, attic, green roofs and cool roofs.
1.4. Measurement of Thermal Properties in Construction Materials
The expertise on the experimental determination of thermal properties of materials and constructive systems in Mexico has not been fully developed. Commonly, the studies focus on finding the mechanical properties; nevertheless, for simulation purposes, the quality of results relies directly on the accuracy of the provided optical and thermal properties. Regularly, this information is taken from traditional sources such as books, tables of construction materials, and international and national regulations. These sources offer generalized data, and do not consider the specific characteristics of materials from different regions.
For instance, Berardi et al. [
31] carried out experimental measurements on the thermal conductivity of insulation materials to quantify the effect of the thermal conductivity variation on a building thermal performance. The authors emphasized that more awareness is needed at the policy-making level so that these possible flaws can be taken into account when making decisions. Genova et al. [
32] demonstrated the importance of the experimental determination of thermal properties of materials through in-situ measurements. They also compared the U-value of calcarenite, mortar, and plasters against values from literature and standards. Pásztory et al. [
33] performed measurements of thermal conductivity in multilayer systems intended as reflective insulation. They aimed to find the impact on the thermal conductivity value with the variation of emissivity value of the insulation panel. The authors concluded that the lower is the emissivity, the higher is the temperature’s dependence to this property. They highlighted that the material properties should be evaluated experimentally to enrich the energy analysis and, as a result, the outcomes will be closer to reality.
In this work, the authors had a special interest in analyzing the performance of economic housing because such buildings are massively constructed. The thermal properties of a lightweight perlite mortar were experimentally determined to avoid the previously described problems. Mixtures based on the thermo-physical properties of low-cost lightweight mortars were proposed with the aim of reducing the thermal loads on economic housing. The goal was to obtain a less dense and thermally resistant material and then test its applicability to a building’s envelope. The lightweight mortars were designed in the laboratory following strict manufacturing standards and then the thermo-physical properties were obtained. Next, a dynamic simulation was performed for a prototypical house, incorporating the obtained thermal properties of the materials, the local climatic data and the physical characteristics of the house. The lightweight perlite was set as a plaster on the exterior walls and its thermal performance was compared to a traditional wall with cement plaster. The amount of time for thermal comfort and discomfort of the house was calculated along with the energy requirements and its consequent CO2 impact due to the use of gas and electricity to operate the heating and cooling systems. Finally, an economic analysis of this comparison was carried out.
The aim of the research was to evaluate and propose a material that could be rapidly transferred to the construction sector as well as highlight the importance of measuring the properties of local materials, as the technical sheets of materials often do not supply complete information and the available data in the literature may not adequately represent the local material.
2. Methodology
This research was carried out in two phases: experimental and dynamic simulation. In the experimental phase, the mortar mixtures were designed under applicable regulations. In the simulation phase, the case scenarios for the analysis were established for the prototypical economic house. Geometry, construction materials and physical characteristics were incorporated into the analysis of the cases of interest. Finally, an economic analysis considering investment and operation costs including quantification of the CO2 emissions resulting from the application of the proposed systems was made.
2.1. Experimental
The experimental phase began with the design of a natural cement–sand mortar with a 1:4 ratio. Then, this natural mortar was modified by replacing 60% of the sand with mineral perlite. The objective was to prove that mineral perlite provides lightness while reducing thermal conductivity and preserving the mechanical resistance of a structural mortar. Two mortar mixtures were made in accordance with the current Mexican standards. After the specimens were produced, cured, dried and reached 28 days of aging, they were subjected to a mechanical strength test to determine compression values. These values helped to categorize the mortars as suitable for their use as constructive coatings in walls. Finally, the thermal properties of the dried mortars were tested to determine thermal conductivity and thermal diffusivity.
2.1.1. Mixtures Design and Mortar Production
This paper presents the design of two mortars. The first mortar corresponded to a natural mortar made of cement–sand with a 1:4 ratio (Cement Plaster (CP)). The second corresponded to a lightweight mortar produced by replacing 60% of the sand with mineral perlite (Perlite Plaster (PP)). For both mixtures, CPC-30R cement with 3000 kg/m
3 density, natural sand, and water were used. The sand was tested to characterize its properties by a granulometric analysis according to NMX-C-077-ONNCCE-1997 Mexican Standard [
34]. The results of the material’s characterization, including the mortar’s density and absorption percentage, are shown in
Table 1. The perlite used for this research is a commercial lightweight aggregate, with controlled granulometry and density [
35]. When the perlite is mixed with cement (CPC-30R) and water, it becomes a low-density insulating concrete. Its main applications are for acoustic and thermal insulation; it is also used to create roof slopes and to level floors. The handling recommendations are to wear a mask, gloves and safety glasses. The material comes in 100 L sacks and can be outdoors for up to two months.
The properties of the materials showed contamination of 5.8%; this was obtained screening the sand through a number four mesh. A fineness modulus of 2.8 and a wash loss of 4.5% were obtained. A suitable fluid mortar consistency was achieved to apply the material as a coating on the walls with an adequate dosage of water.
2.1.2. Theoretical Proportion of a Natural Mortar
Once materials were characterized, the next step was to determine theoretical proportions for the mortar mix (1:4 ratio) in absolute volume and fluidity of 110 ± 5%. The natural mortar considered an adjustment of water by performing iterations according to Sanchez methodology [
36], which takes into account the necessary consistency of the materials and the gravel-free sand.
Table 2 shows the results of the 1:4 ratio mortar. The properties shown in
Table 2,
Table 3,
Table 4,
Table 5,
Table 6 and
Table 7 were measured experimentally by the authors, according to the methodology by Sanchez [
36].
Table 3 shows the amount of material for the preparation of one cubic meter (m
3) of natural and lightweight mortar.
2.1.3. Mortar Preparation
To prepare the mortars, conventional laboratory tools—a mixer, molds for specimens, slump equipment, minor tools, fluidity equipment, air content equipment, and a graduated cylinder—were used.
Table 4 shows the amount of required materials for the preparation of 15 L of mixture.
Finally, the properties of the fresh mixtures were revised according to Mexican Standards. The properties of interest were: fluidity, air content and density. The fluidity test regulates the water demand according to NMX-C-061-ONNCCE-2015 [
37] and determines the consistency and workability of the mortar. The density test of the mixture was determined according to NMX-C-162-ONNCCE-2014 [
38], and the air content test measured the amount of air contained in the fresh mortar (%) according to NMX-C-159-ONNCCE-2016 [
39]. The air content test allowed the calculation of the density.
Table 5 shows the results of the tests under the accepted ranges established by the standards.
Once the fluid mortar properties were in order, the mixture was poured in the test molds. The molds had a dimension of 0.05 m × 0.05 m × 0.05 m. Then, they were cured and dried for 28 days, in accordance with NMX-C-159-ONNCCE-2016 [
39]. After this period, the sample cubes were tested for compressive strength until failure. These assessments determined the material capacity to endure the compressions efforts, thus the material could be characterized as a structural mortar according to the values and procedures provided in NMX-C-161-ONNCCE-2013 [
40].
2.1.4. Compression Strength Assessment
The compression strength was measured on the samples after 28 days of aging using a semi-automatic compression equipment (DIGIMAX dual chamber), which has a capacity of 33/15 kN of compression and flexion for testing mortar specimens. The samples meet the requirements of ASTM-C109 [
41], C348 [
42] and C349 [
43].
Table 6 shows the measured compressive strength performed to three samples for each mortar (natural and lightweight mixtures). According to NMX-C-486-ONNCCE-2014 [
44], a minimum of 75 kg/cm
2 is required to define a suitable mortar for the application of wall coverings.
The results in
Table 6 show the values of the compressive strength measurements in triplicate. The mean values were 187.83 kg/cm
2 and 104.63 kg/cm
2 for the natural and lightweight mortar, respectively. These values indicated a 45% decrease in the ability to endure compressive strength of the lightweight material against the natural mortar. Even though this showed a decrease in the compressive strength of the lightweight material, the mortar properties pointed out that the material complies with the current normativity (75 kg/cm
2 [
44]) and is appropriate to be used as a structural mortar.
2.1.5. Measurement of the Thermophysical Properties of Materials
A dry sample of 0.15 m × 0.15 m × 0.04 m was used to determine the thermal conductivity (W/m K), specific heat (J/kg K), and volumetric density (kg/m
3). The equipment used was an automatic model (KD2-Pro) with a SH-1 sensor, which measures the specific heat of hard materials, and RK-1 sensor that measures the thermal conductivity of rocks and concretes. The equipment was calibrated according to ASTM D5334 [
45] and the accuracy of the results varied from ±5% to ±10%. The measurement procedure consisted of drilling to a depth of 0.03 m and then placing the sensor inside the test tubes.
Table 7 shows the measured properties (density, thermal conductivity, and specific heat) of samples with equal dimensions and thickness. When comparing the properties of PP with CP, there was a decrease of 24% on the weight, 25% on the density and 56% on the thermal conductivity, while the specific heat increased around 75%.
2.2. Dynamic Simulation
The dynamic simulation software TRNSYS 17 was used to determine the thermal and energetic performance of the prototypical houses. The study considered two cities located in dry climates, known as B climates, according to the Köppen–Geiger classification. The performance of a prototype house was calculated for two cities, Hermosillo and Durango, México, which correspond to BWh (hot arid) and BSk (cold semi-arid). The simulation was carried out over a year using climatic data obtained from the Meteonorm software in the format of a typical meteorological year (TMY). The incorporation of lightweight mortar on a traditional wall was compared with a regular construction system to find the effect of adding a low-cost material to the overall thermal performance of the house.
2.2.1. House Model and Location
The analyzed design of economic housing represents a typical construction of the northwest Mexican region. The families that intend to buy this kind of houses normally apply to available financing schemes of institutions such as the Workers Housing Institute (INFONAVIT), State Workers Housing Institute (FOVISSSTE), Federal Mortgage Company (SHF), National Trust Fund for Popular Housing (FONHAPO) or the National Housing Commission (CONAVI). These institutions grant mortgages to families earning 1–5 Mexican minimum wages (1 UMA = MXN 2568.5 per month [
46], EUR 117). Families that earn 2.8 UMA need to apply for federal housing subsidies, otherwise their income will not be sufficient to buy any available housing in the market even when the mortgages are paid monthly for up to 30 years [
47].
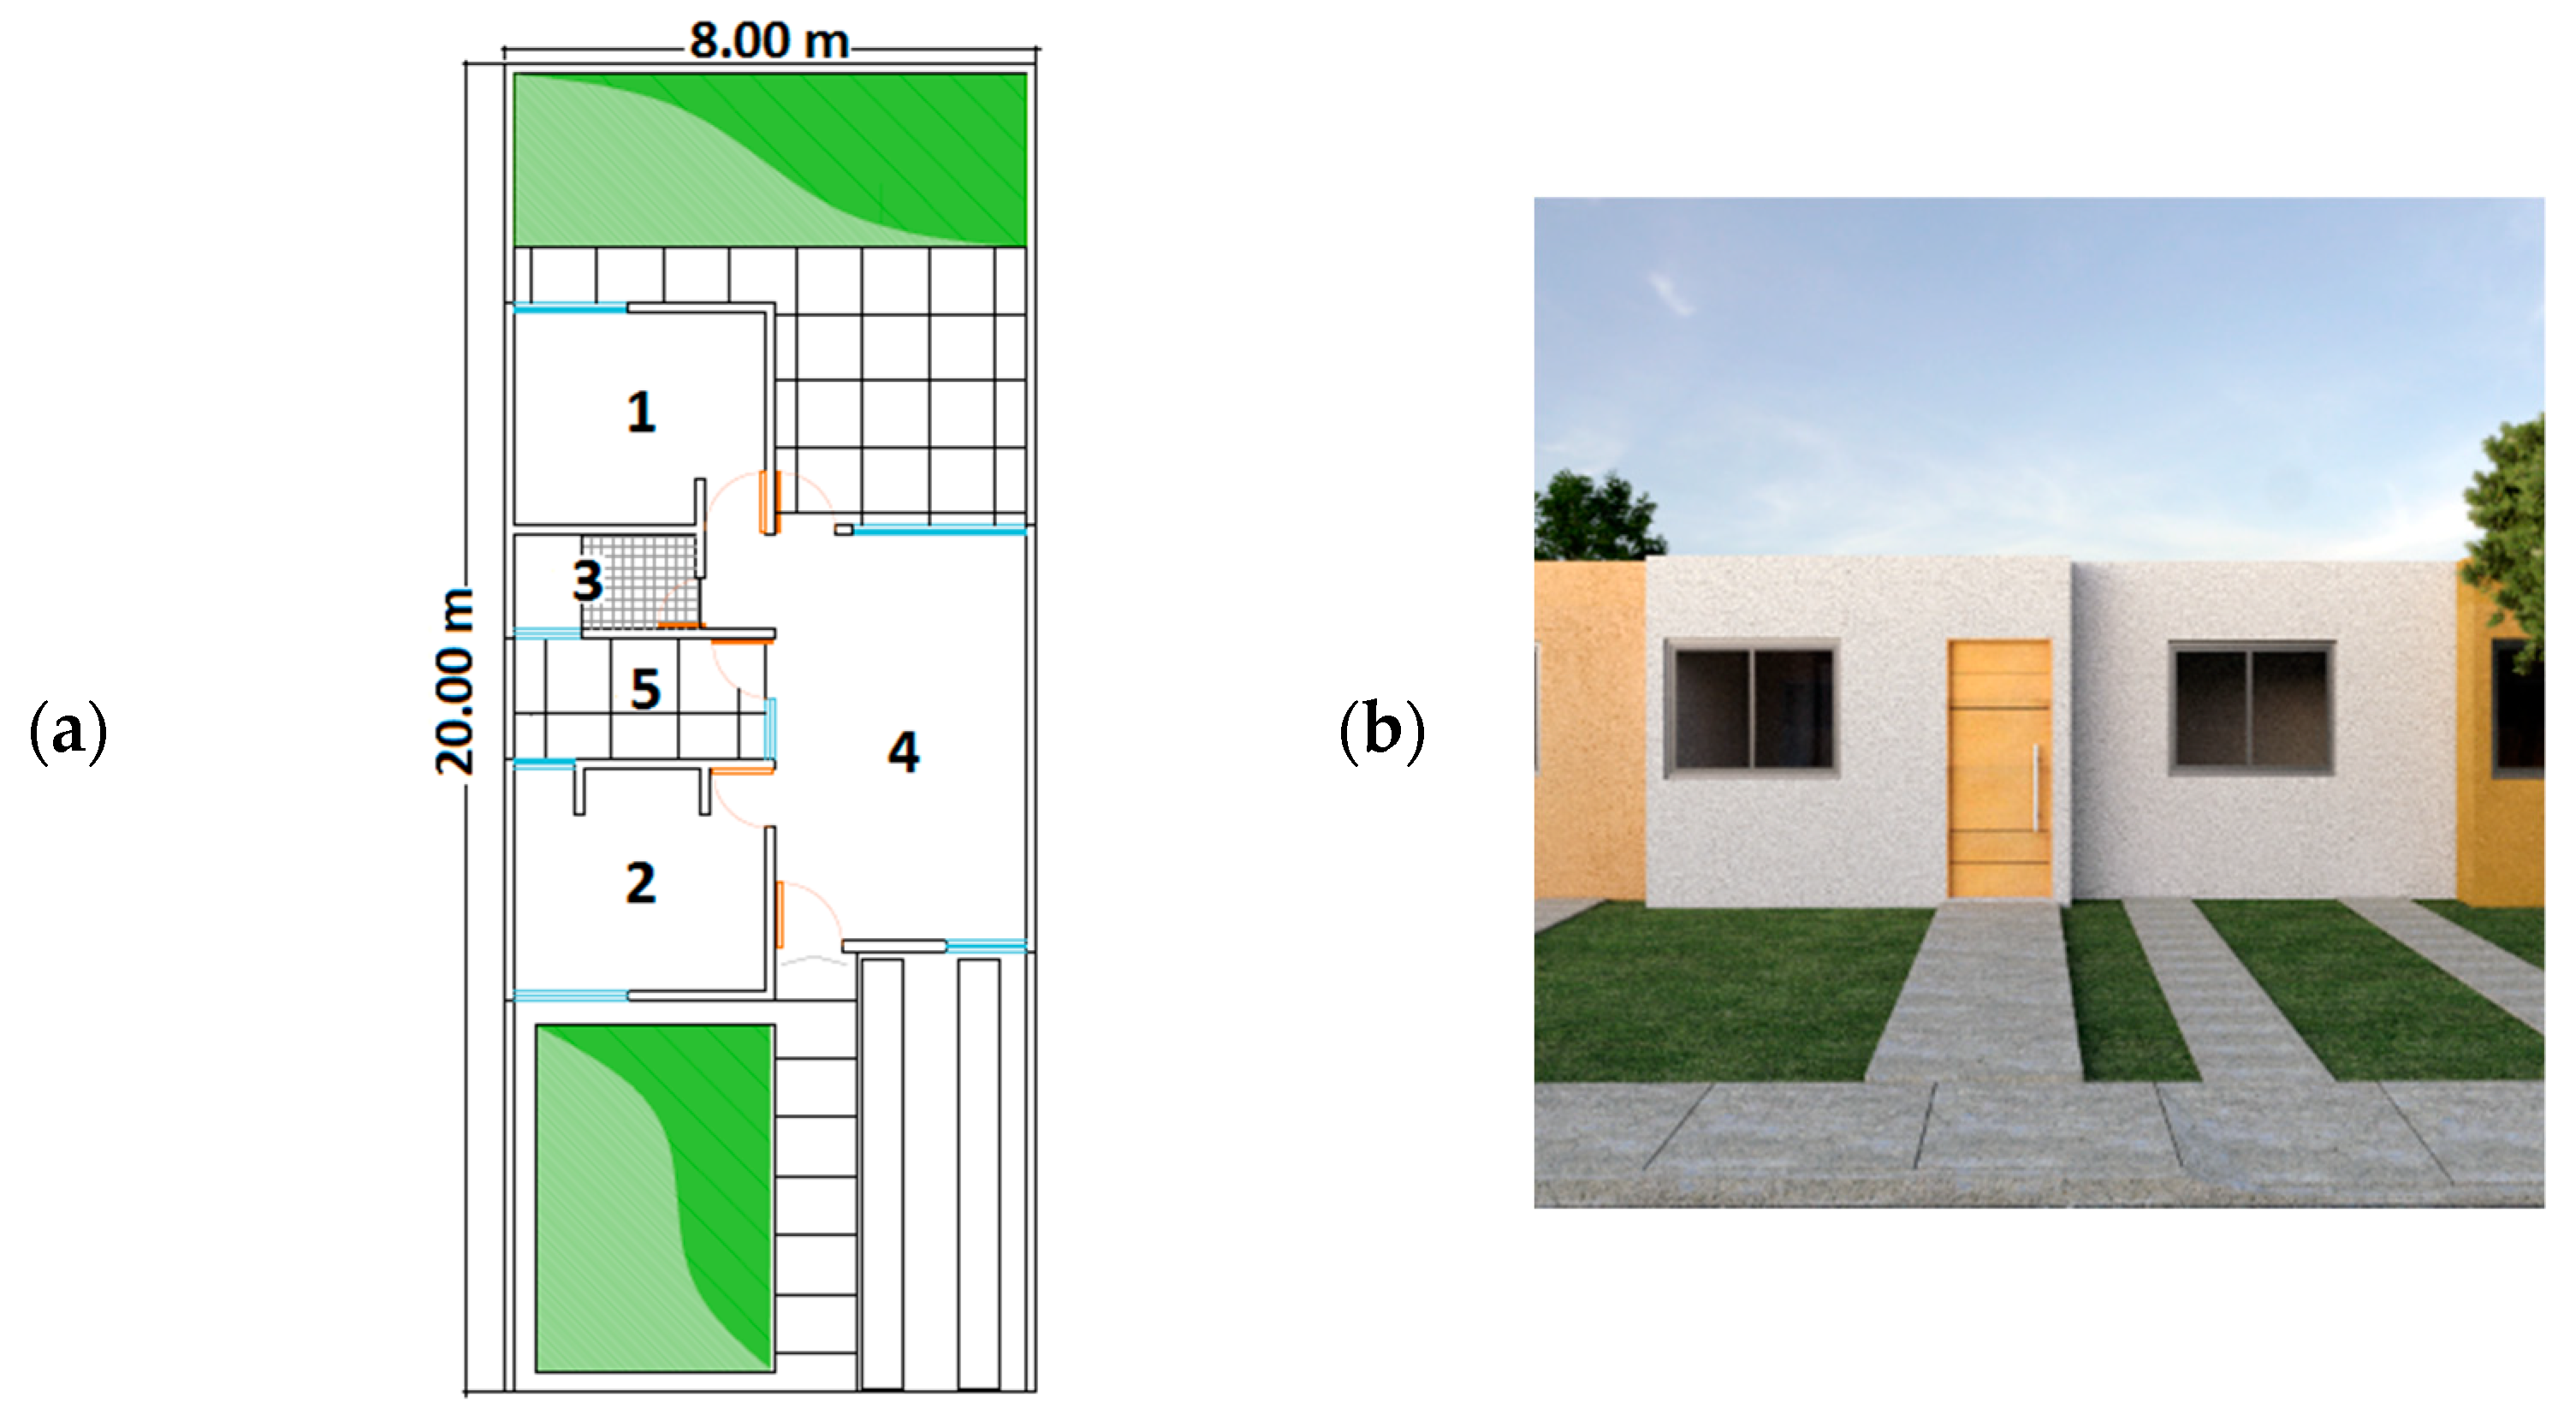
Economic housing is typically adjacent to each other, while the main façade is exposed to the exterior and the patio of the house is adjacent to the back yard of a neighboring house. The layout and the façade of the dwelling can be observed in
Figure 1. The houses have 51.98 m
2 of construction, 43.78 m
2 of exposed façade, 7.41 m
2 of glazing and a floor to ceiling height of 2.5 m. In
Figure 1a, the house’s floorplan can be observed. The house is distributed in the following zones: (1) north bedroom; (2) south bedroom; (3) bathroom; (4) kitchen/living/dining room; and (5) interior courtyard.
Figure 1b shows a caption of the house’s façade.
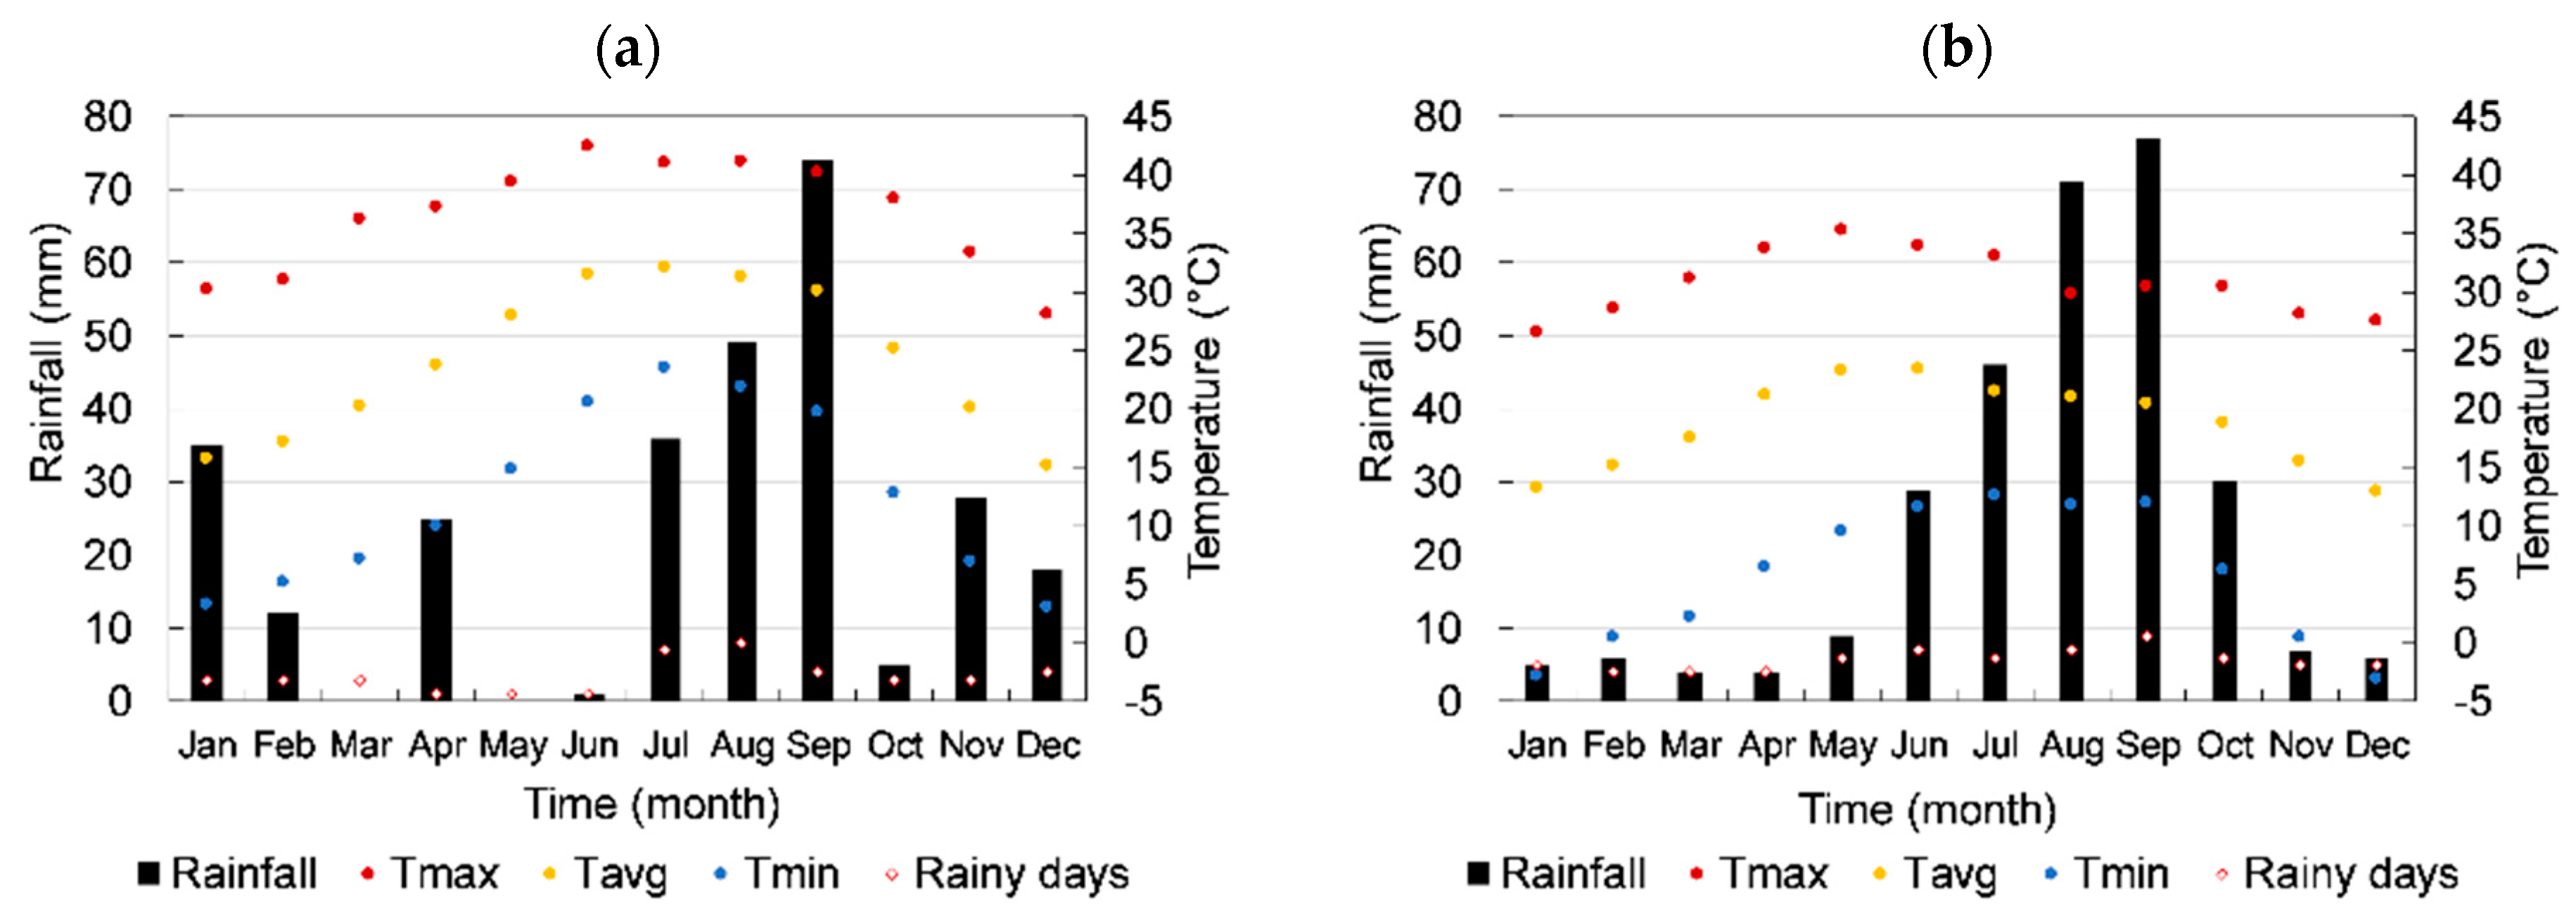
2.2.2. Dry Climates
This climate has scarce precipitation, which promotes a large thermal oscillation between day and night. In summer, during the day, the temperature can reach up to 50 °C, while, at night, a temperature of 10 °C is also possible.
Figure 2 shows the average monthly temperatures, rainfall and days with rain for Hermosillo (
Figure 2a) and Durango (
Figure 2b).
2.2.3. Thermal Comfort
The thermal comfort range was calculated according to the ASHRAE 55-2004 standard [
48]. The air conditioning systems operate using the comfort ranges obtained through this methodology: 20.6–27.6 °C for Durango and 20.6–27.3 °C Hermosillo. The house model (Type 56) uses a simplified calculation of heating and cooling, which works under the assumption that the demand for cooling and heating depends on a defined indoor temperature range. The output power to keep the temperature within the range will result in a positive value for cooling and a negative value for heating, as a convention that heat is removed or added to the system. Heating and cooling were deactivated from the simulation to obtain the number of hours of thermal comfort and discomfort under normal conditions.
The number of hours of thermal comfort was calculated by counting the frequency of hours within the comfort range defined for each of the climates studied. The number of hours for discomfort due to heat and cold was calculated by counting the incidence of hours exceeding the upper and lower limit of the defined thermal comfort range.
2.2.4. Case Studies
Table 8 shows the case studies implemented in the house. The results of its thermal performance were compared for red brick (RB) and concrete block (CB) walls using regular cement (CP) or perlite plaster (PP). Houses in Durango are commonly built using a roof named as “maceteado” (clay–brick system) with terracotta waterproofing. In Hermosillo, a lightened slab known as “vigueta-bovedilla” with reflective white waterproofing was considered. Due to the adjacency of the houses, the natural and lightweight perlite plaster was applied only at the exterior north and south façades in a total area of 43.78 m
2.
2.2.5. Material Properties
Table 9 and
Table 10 show the thermal and optical properties of the walls and roofs construction systems under study. The clay–brick system consisted of a layer of native clay and a thin brick applied as a roofing system mainly for its benefits in the cold season of Durango (BSk). This system had low thermal conductivity due to the native clay’s properties. On the other hand, Hermosillo (BWh) used the lightened slab. This system consisted of a layer of expanded polystyrene, which helped to cope with the daily temperature fluctuations of the region. All cases considered 4 mm single glazed windows with a solar heat gain coefficient (SHGC) of 0.902.
2.2.6. Economic Analysis
This study considered the investment costs (installation and cost of materials) and the operation cost of using heating and cooling systems to calculate the present worth of the different scenarios. The investment costs considered the purchase of materials, installation and associated equipment. The traditional system (CP) was estimated to cost 39.28 $MXN/m2 (1.78 €/m2) and the lightweight perlite plaster (PP) 48.56 $MXN/m2 (2.20 €/m2). Each house required 43.78 m2 of plaster, thus the cost was 1720 $MXN (78.18 €) and 2125 $MXN (96.59 €) for the traditional (CP) and lightweight perlite plaster (PP), respectively.
The economic impact of heating and cooling systems depends on the amount and the cost of the fuel needed to operate such systems. The cooling systems operated with electricity, while the heating systems used electricity or LP gas. The LP gas heating system assumed an efficiency of 80%, whereas the electrical system assumed an efficiency of 100%. This analysis considered an annual increase in the LP gas and electricity costs of 10% and 2%, respectively, annual inflation of 5%, and a life span of the house of 30 years.
Electricity rates in Mexico work under a scheme known as specific stimulus tariffs [
52] for the residential sector. This scheme has eight tariffs: 1, 1A, 1B, 1C, 1D, 1E, 1F, and DAC. The first one (1) represents the least subsidized tariff, while 1F is the most subsidized one. DAC is the priciest tariff that applies for high consumption domestic consumers. The kWh price of each tariff depends on the amount of subsidy applied, which is also dependent on the minimum monthly mean temperature reached in the municipality [
53]. Differentiated tariffs apply between summer and other seasons, with three levels of consumption (basic, intermediate and excess), for each level the kWh price increases. As mentioned above, the studied cities contemplate tariffs 1 (Durango) and 1F (Hermosillo); they represent the least and most subsidized tariffs.
Another important consideration was the base consumption. This represents the house’s energy requirement due to the use of basic appliances. It is based on a previous study that considers 100 kWh a month [
54]. This consideration was integrated into the resulting cost of heating and cooling. The economic analysis was based on a life span cost analysis, which considered the present worth of the different constructive systems to evaluate the economic feasibility. The equations involved are described in the following:
The equations determine the present worth of operating the heating and cooling of each case scenario. Equation (1) describes the present worth (PW), which is the result of multiplying the uniform amount (R) by the Series Present Worth Factor (SPWF) and the addition of the gradient (R) multiplied by the Gradient Present Worth Factor (GPWF). The uniform amount refers to the annualized cost of energy. However, simulations determined the energy demand of each case scenario. On the other hand, the gradient (G) is the result of multiplying the uniform amount (R) by the annual increase in the cost of energy (PCA). Finally, the result plus the initial investment equals the total cost of a specific case scenario.
3. Results
This section shows the results of the number of hours within thermal comfort and discomfort, and the annual and monthly energy requirements due to the use of heating and cooling systems. In addition, the study considered the present worth of each case, considering the investment on the implementation of the lightweight perlite plaster and the resulting operating costs of the heating and cooling systems over 30 years. Finally, the annual CO2 emissions resulting from the energy use of heating and cooling systems were considered.
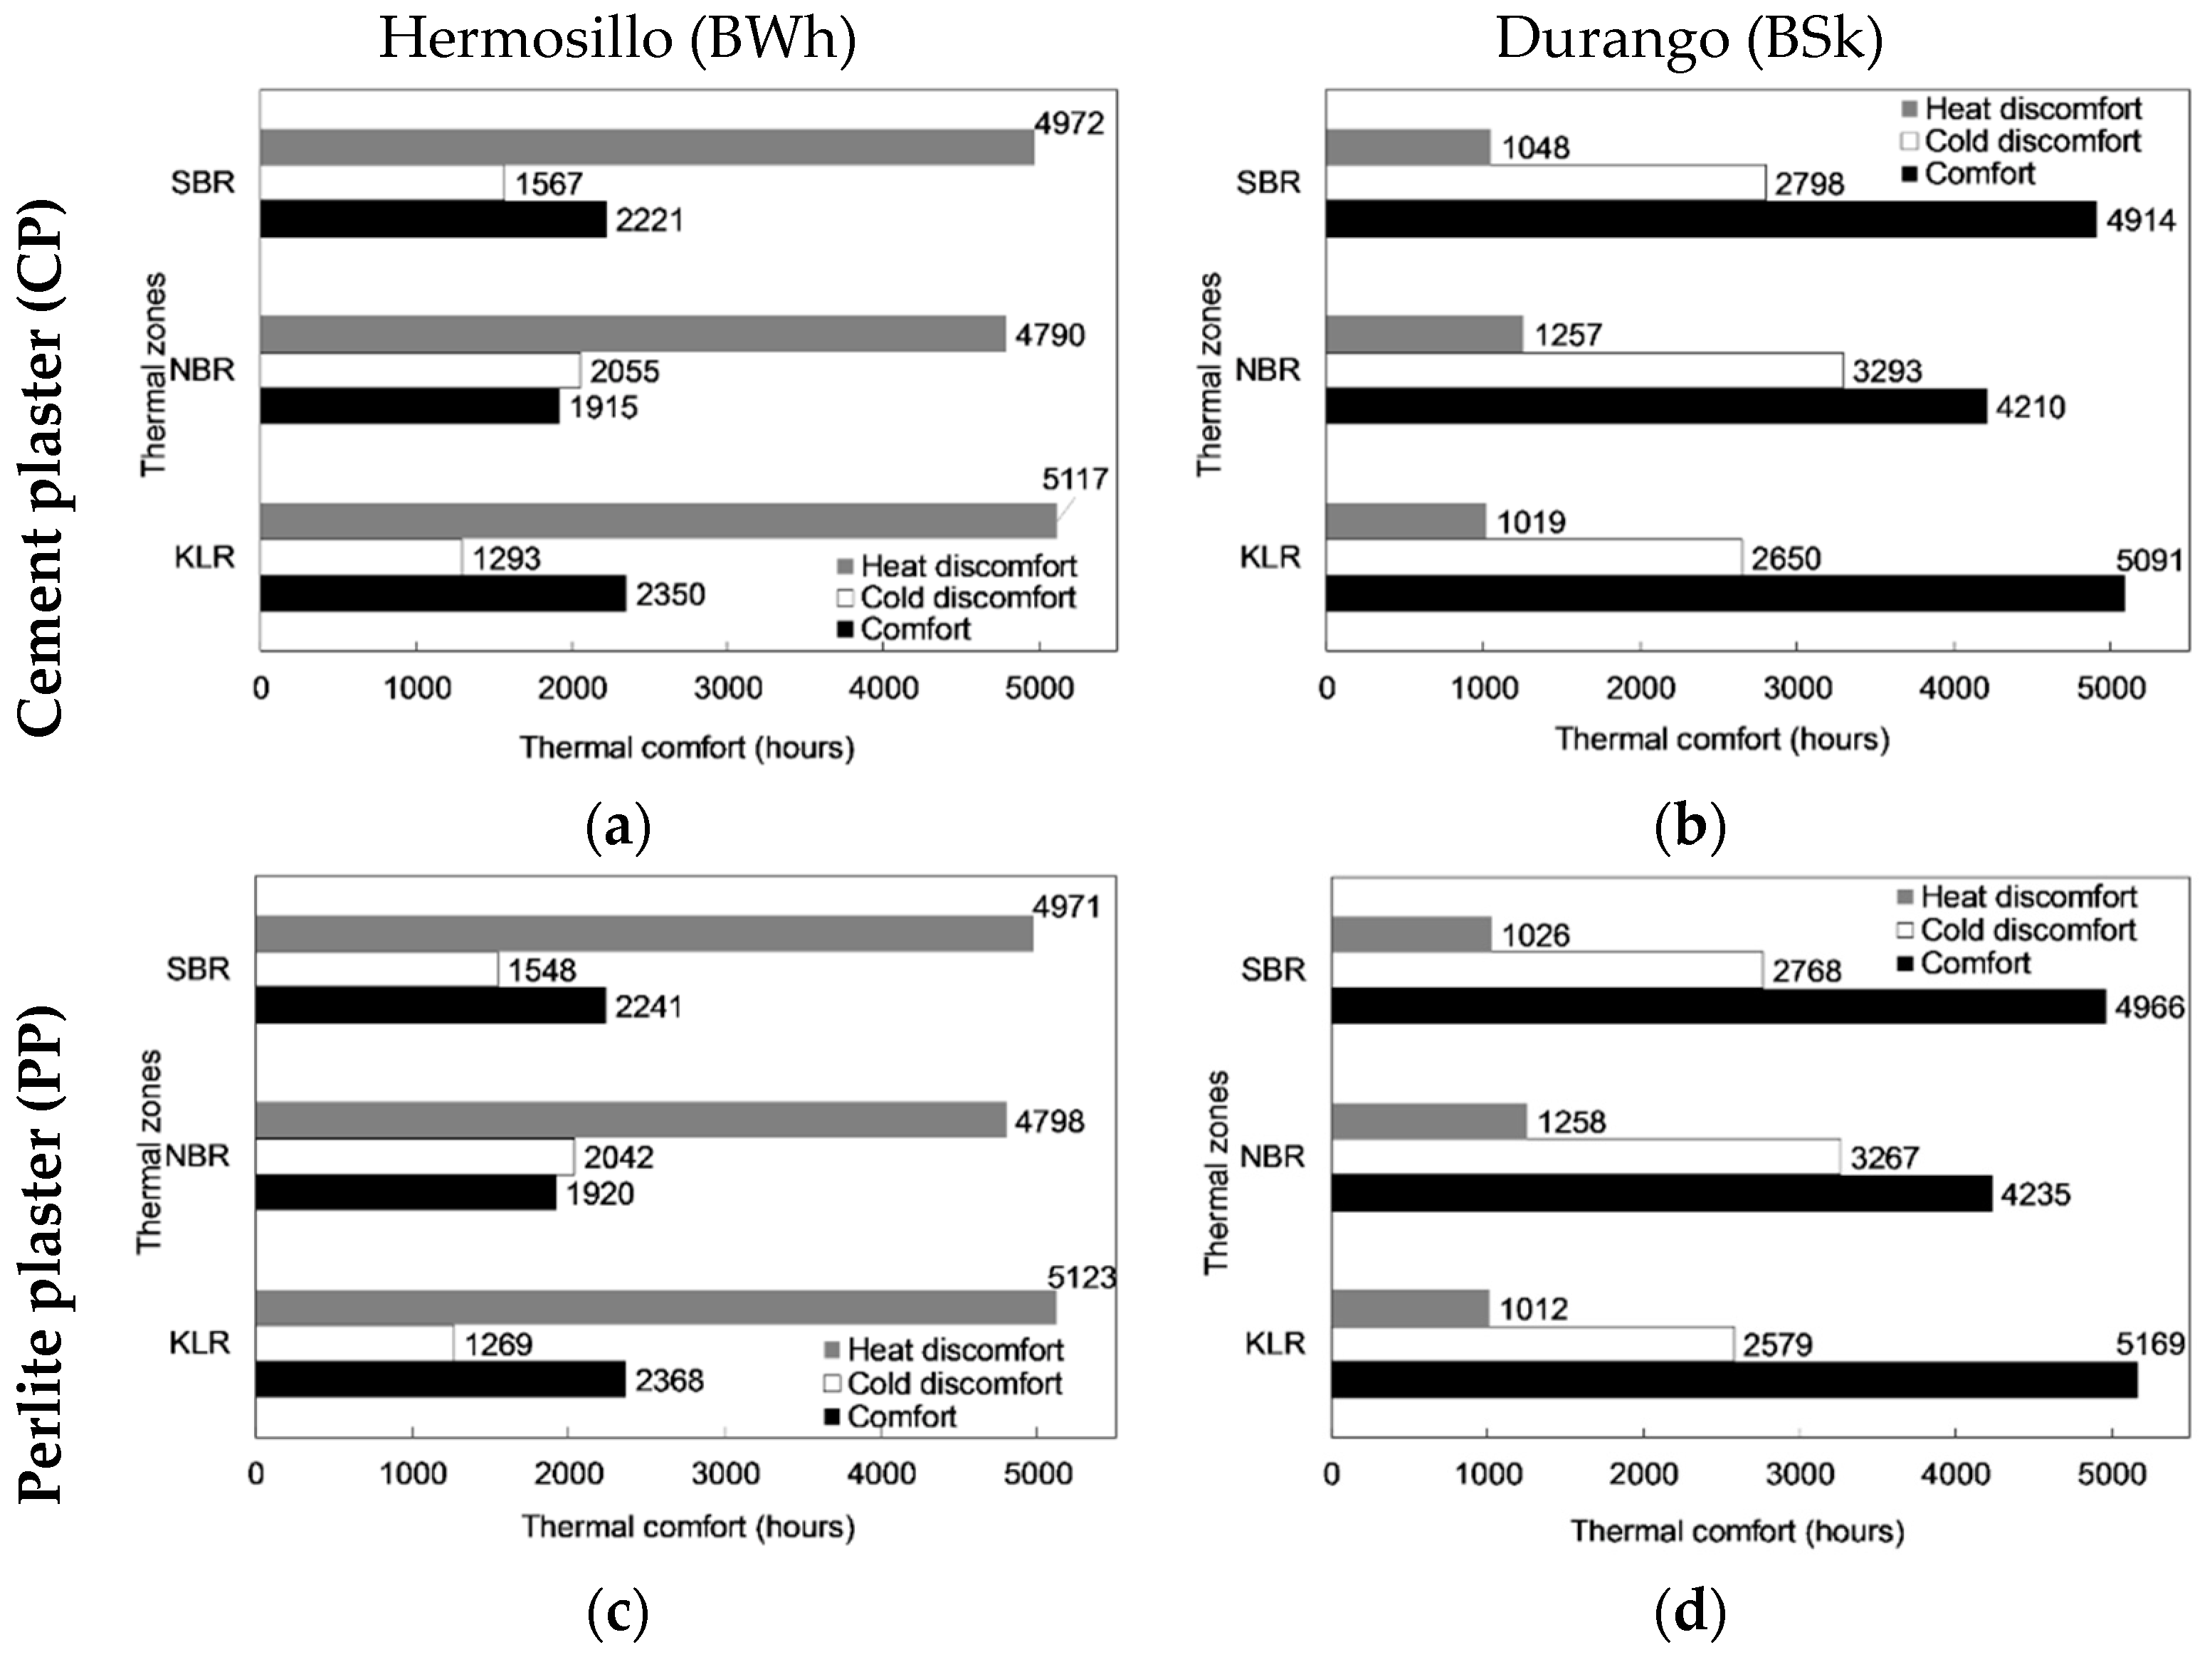
3.1. Thermal Comfort
Figure 3 shows the number of comfort hours (black), heat discomfort (grey) and cold discomfort (white).
Figure 3a,c (CP and PP, respectively) shows the number of comfort and discomfort hours for a house in the city of Hermosillo. In this city, 2162 comfort hours through the year were counted, meaning that the occupants would feel comfortable during 25% of a year inside their homes. Consequently, the residents would feel hot during 56% (4960 h) and cold during 15% (1638 h) of the year. For the city of Durango, in
Figure 3b,d (CP and PP, respectively), comfort hours during the year accounted for 54% (4738 h), and the total of heat and cold discomfort hours were 1108 h (12%) and 2914 h (33%), respectively. These contrasts evidence the difference between the climates.
3.2. Energy Demand
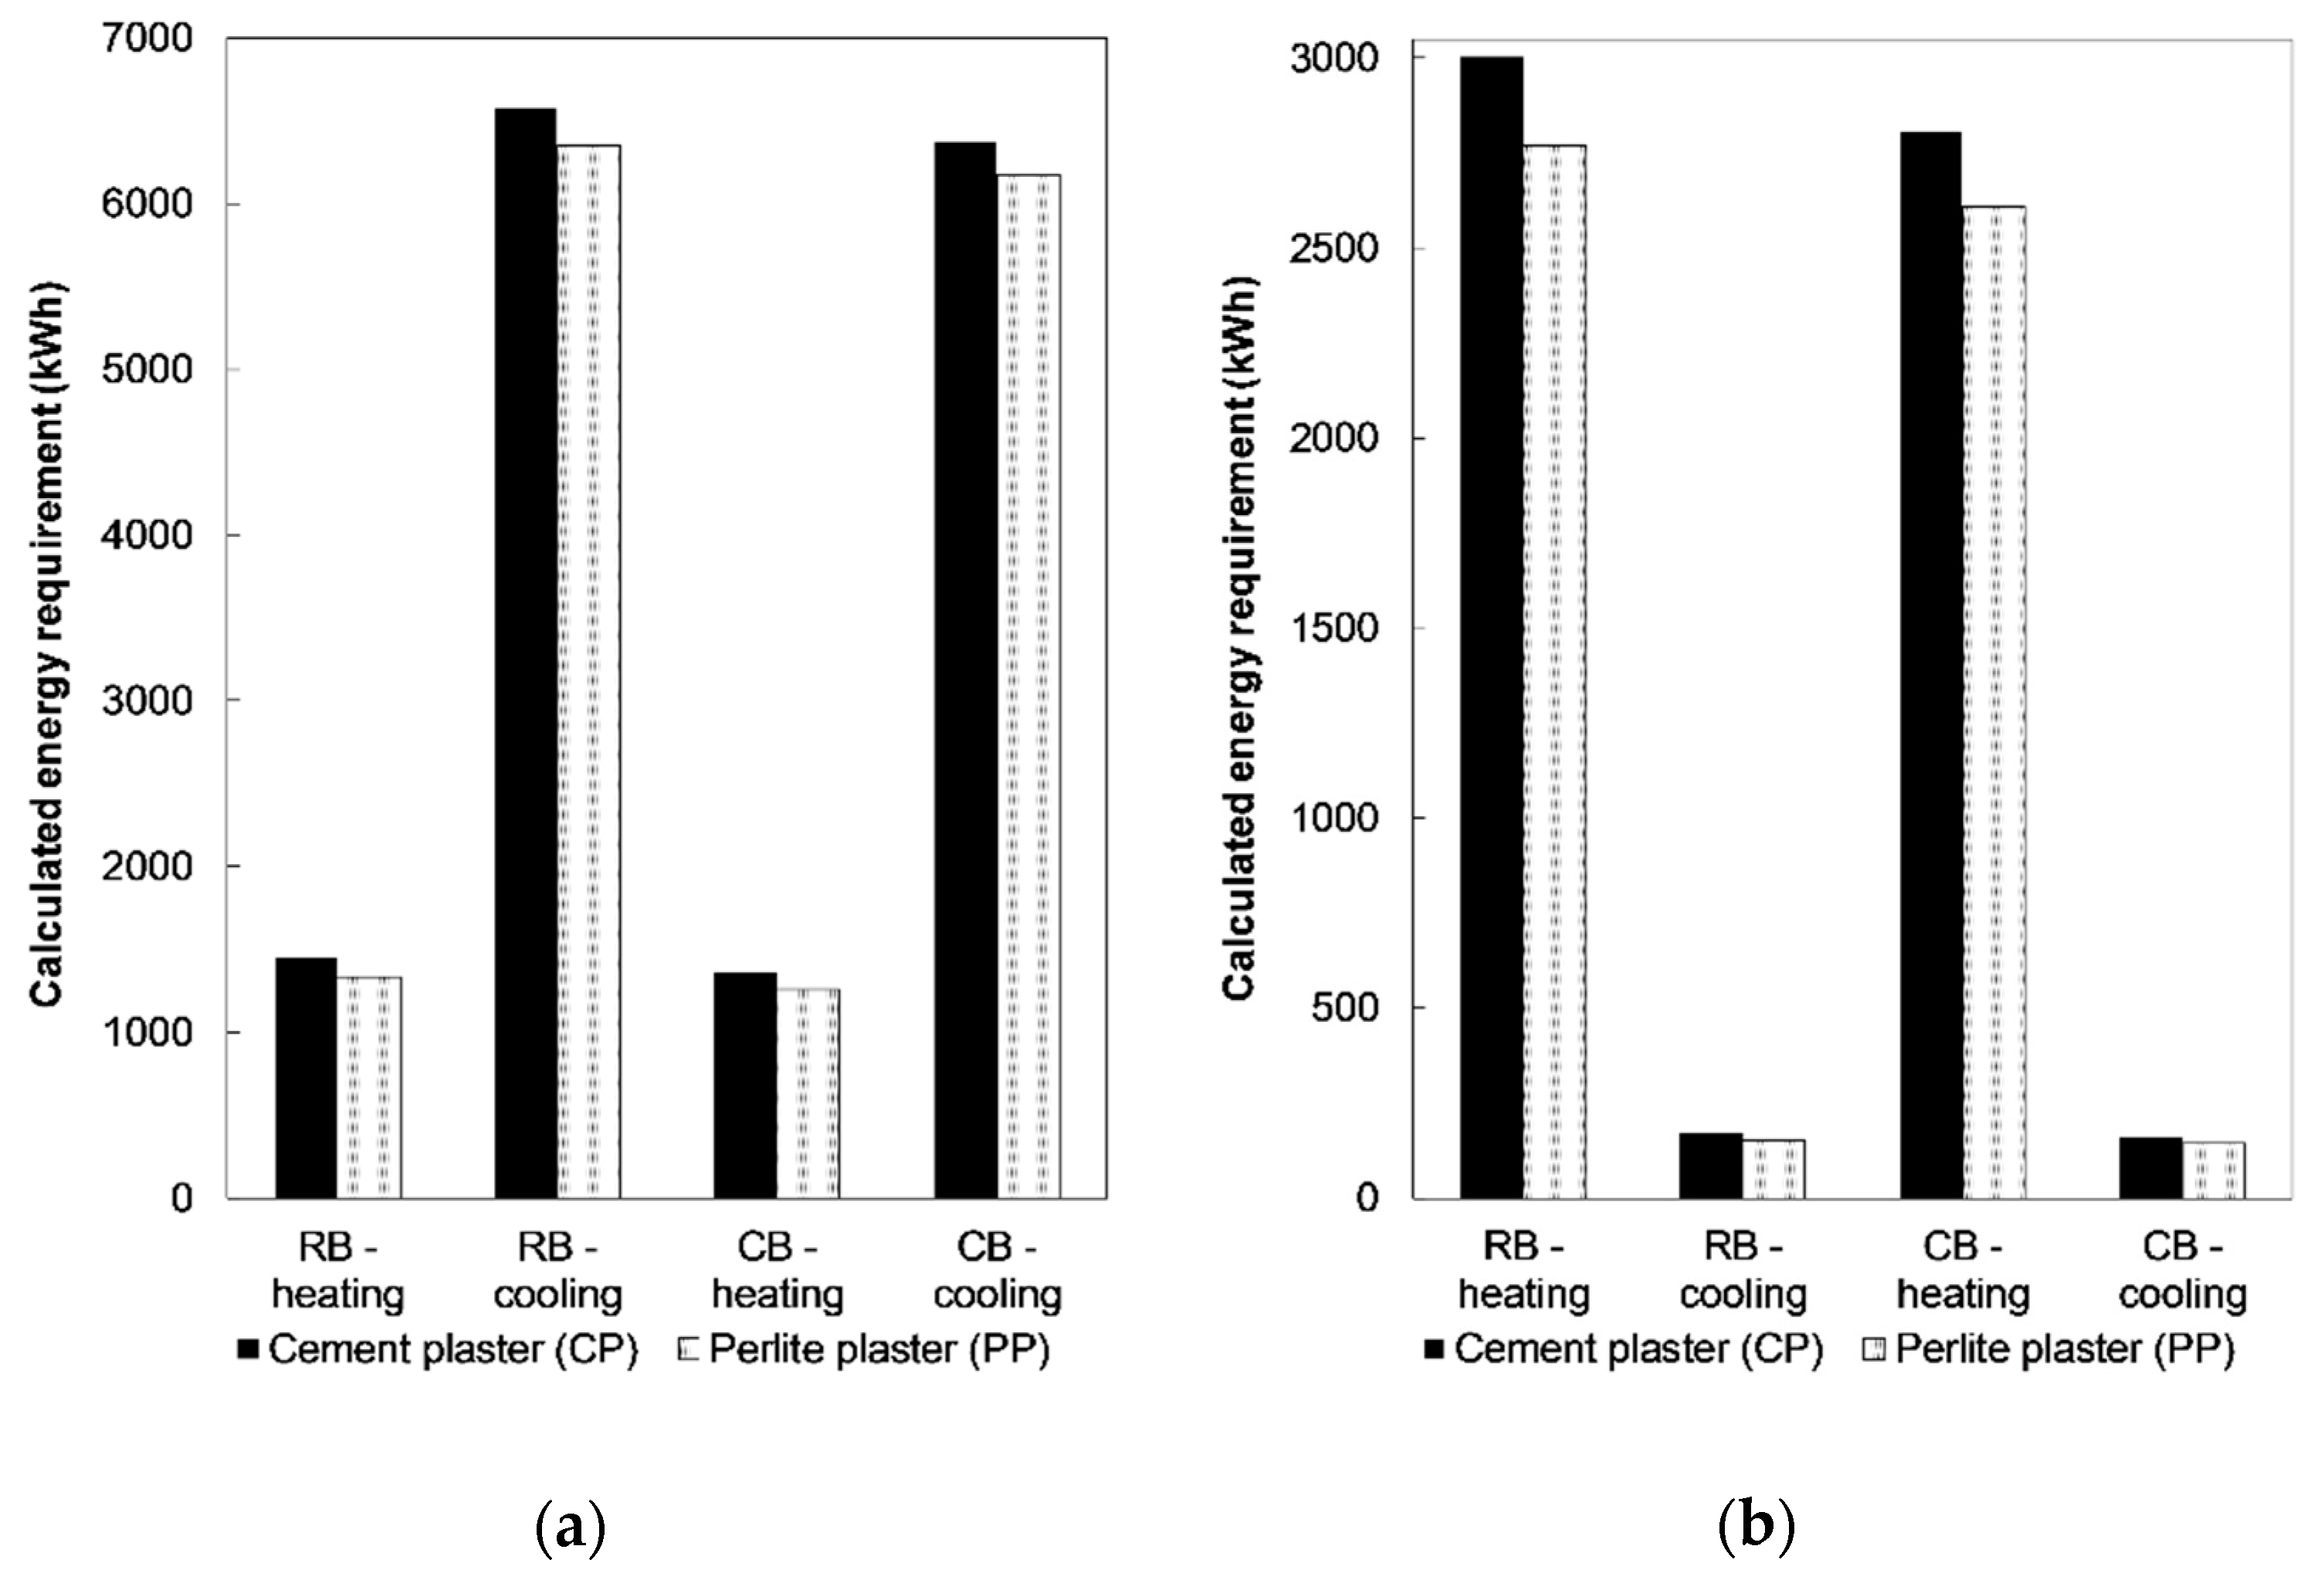
Figure 4a shows that in Hermosillo (BWh) with a concrete block house, the energy required for heating would be 1656 kWh/year and 1562 kWh/year for CP and PP, respectively. The energy requirements for the cooling system would be 6621 kWh/year (CP) and 6422 (PP) kWh/year. Accordingly,
Figure 4b shows that in Durango (BSk) in a red brick house, the energy required to operate the heating system would be 3001 kWh/year and 2769 kWh/year for the CP and PP, respectively. The differences on the energy consumption, between the use of concrete block or red brick, were up to 13.6% of energy for cooling in Hermosillo, and up to 10.9% in Durango for the use of energy for heating systems.
Each different construction material influenced the building thermal inertia. Specific heat is one of the properties that can help to improve thermal comfort and reduce energy consumption in buildings. The specific heat of PP is over four times the specific heat of CP, whereas the thermal conductivity value of CP is twice as big as PP. The increase in the specific heat value of the perlite plaster helped to reduce the overall indoor temperature fluctuation and, consequently, the need for heating and cooling. Even though the plaster represented around 12% of the total wall thickness, the plaster thermal conductivity and specific heat had a relevant impact on the thermal performance of the house.
Figure 5 shows the monthly energy requirements for the studied cities. As shown in
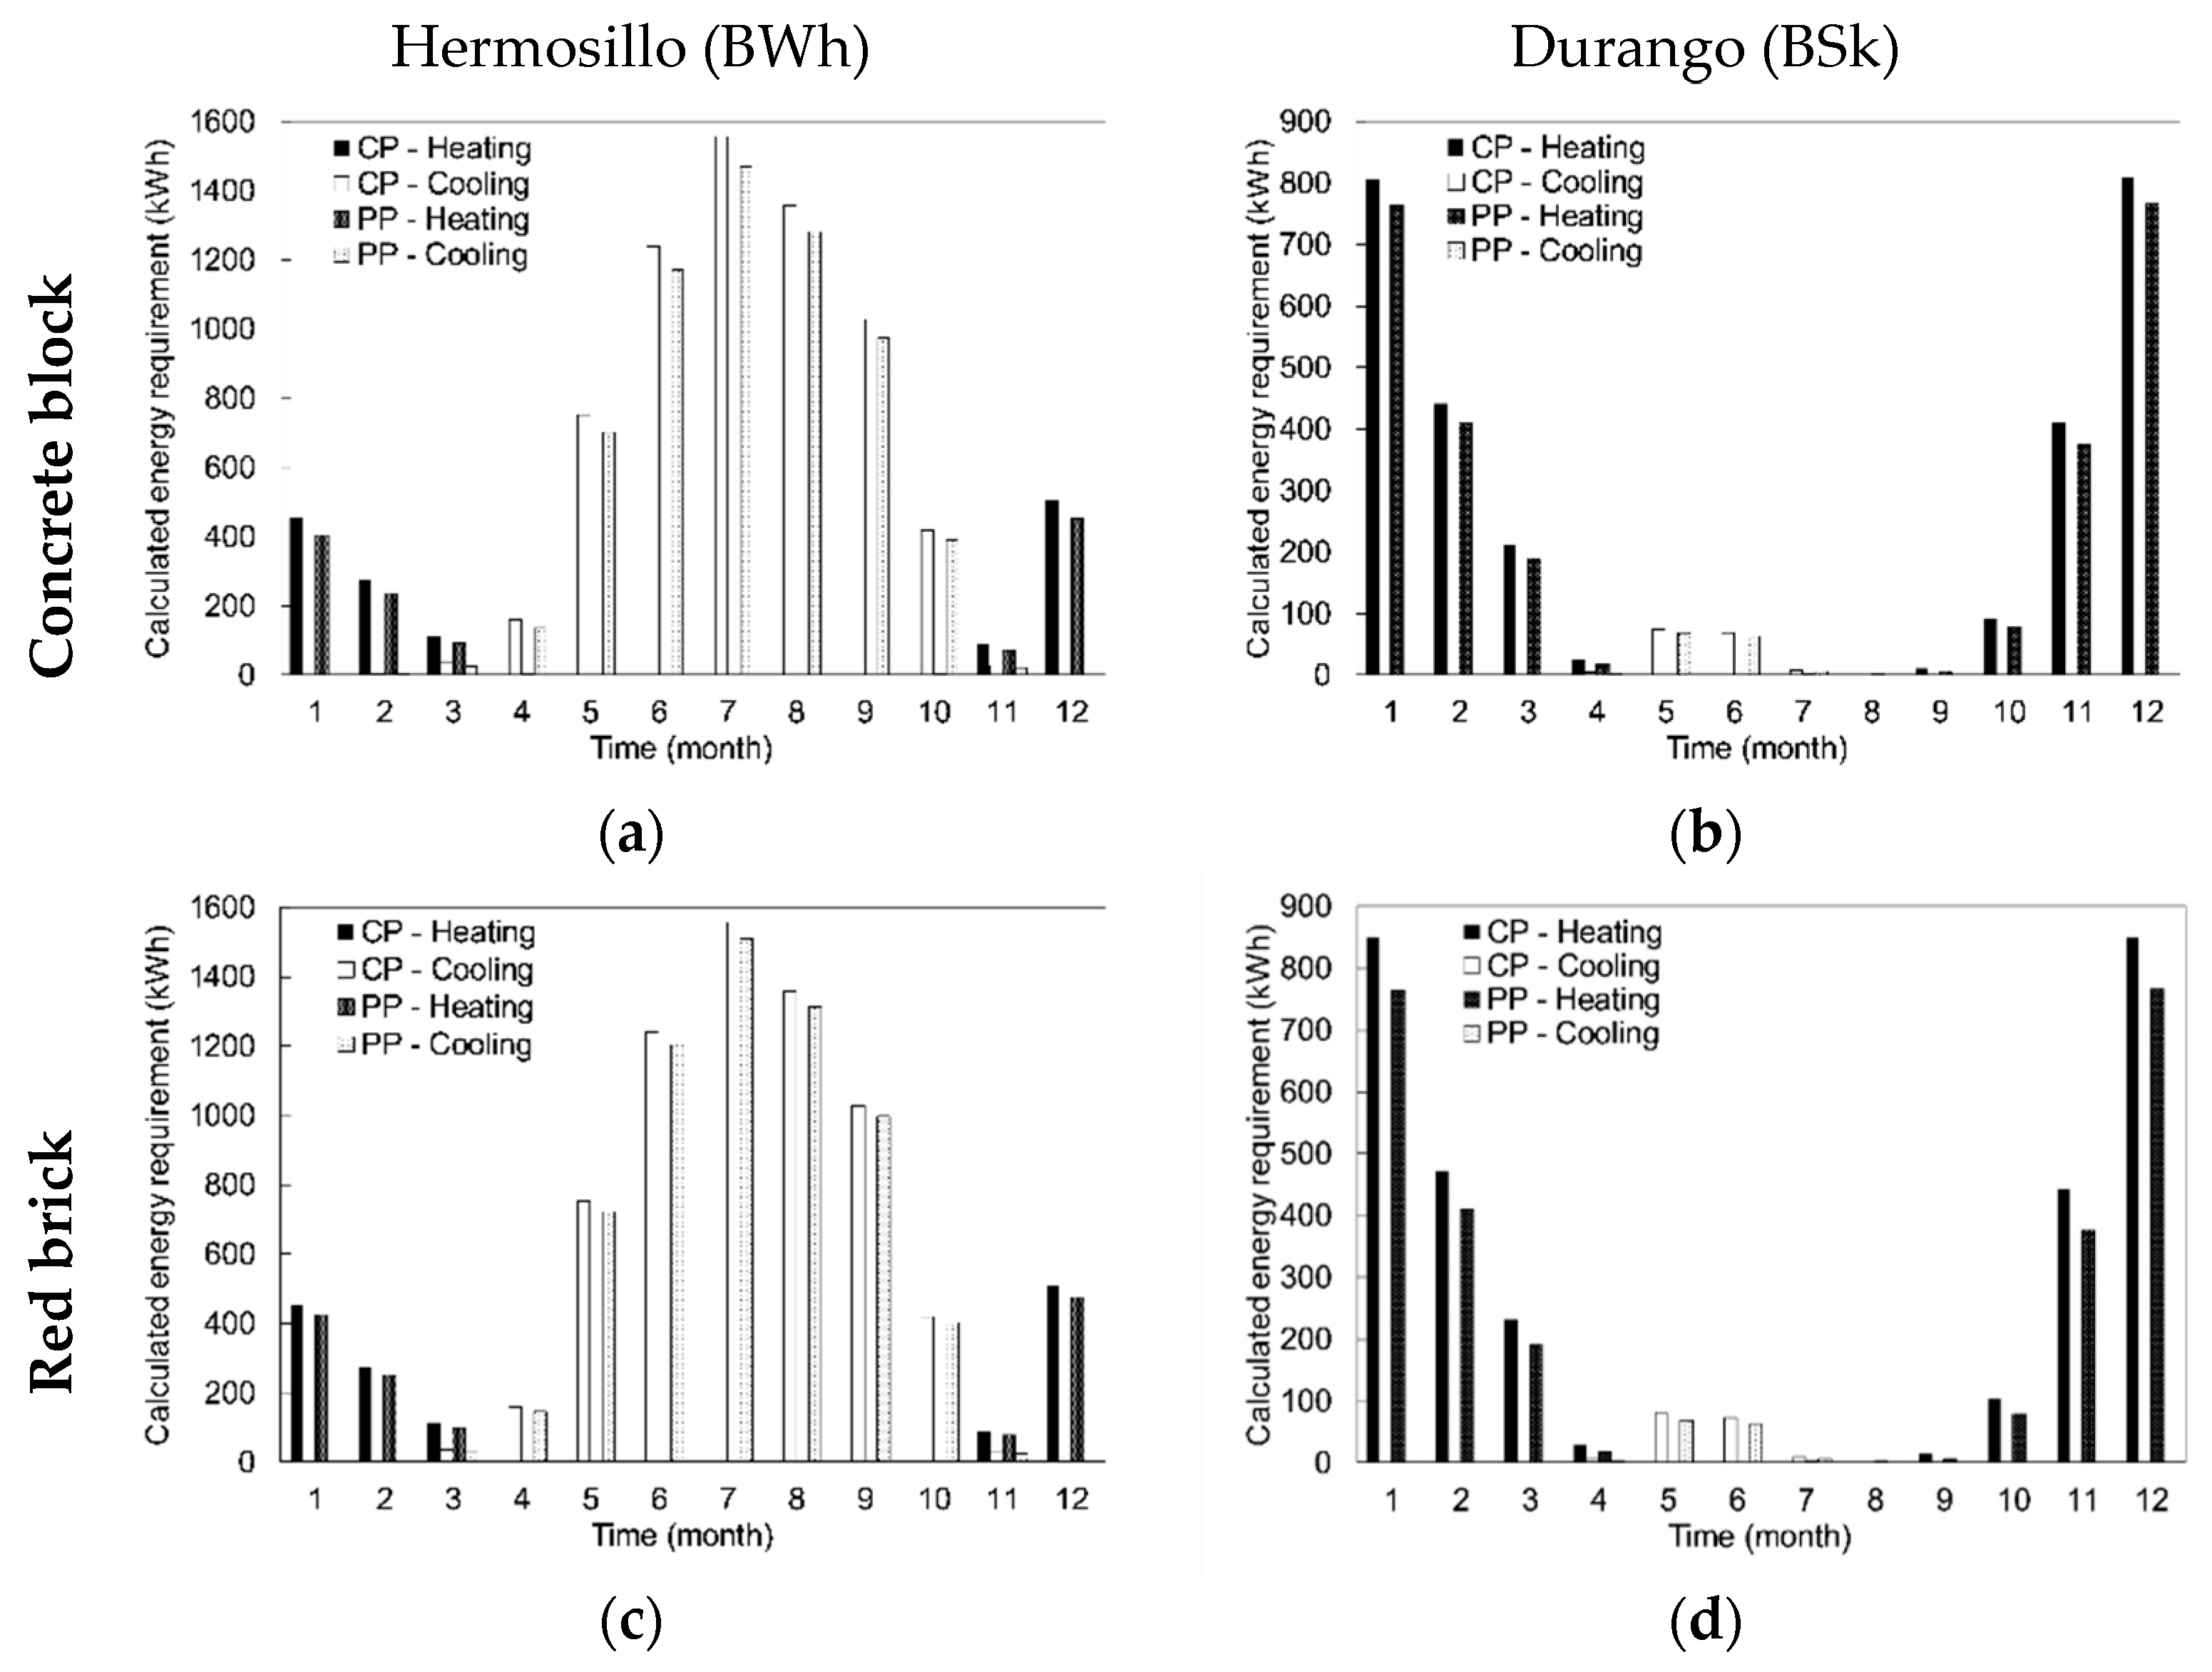
Figure 5a,c, it was observed that, to maintain an adequate thermal comfort in Hermosillo, the intensive use of cooling systems during seven months of the year would be necessary (April to October). It was also noted that the cooling energy requirements were higher during the months of June, July, and August; however, during five months (November to March), minor requirements of heating occurred. Similar energy requirements were calculated for the red brick and concrete block houses.
Figure 5b,d shows the cooling energy requirement for Durango. It was observed that the energy required for the cooling systems was minimized. On the other hand, constant use of heating systems would be required from November to March, where the higher energy requirements occurred during December and January.
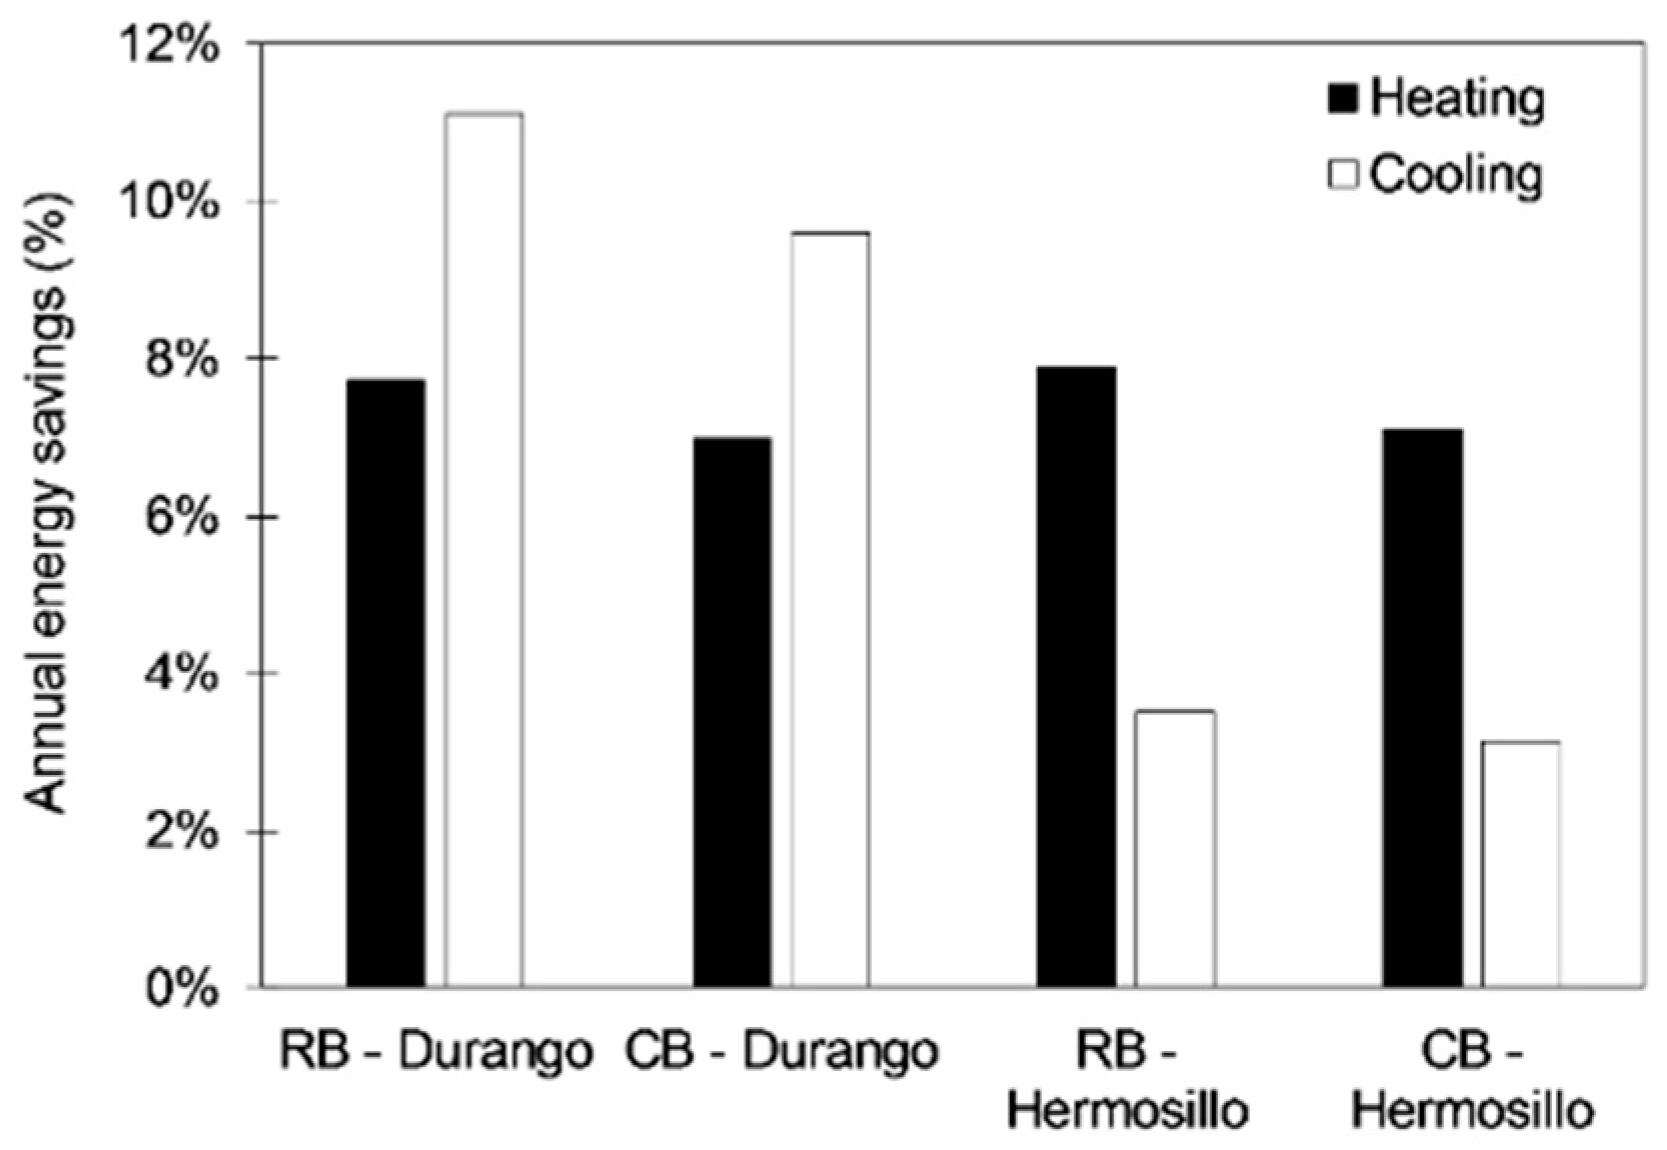
Figure 6 shows the energy savings comparison between the CP and PP cases. In Hermosillo, the CP and PP savings on heating and cooling were 7.8% and 3.5%, respectively, whereas for Durango, they were 7.7% (heating) and 11.1% (cooling).
Section 3.3 details the economic analysis contemplating the energy cost resulting from the use of heating and cooling systems through a period and the investment cost due to the implementation of the cement plaster and perlite plaster. This analysis was challenging because there is a differentiated residential electricity tariff based on the minimum monthly mean temperature of the country. The 1F tariff applies in municipalities where hot weather conditions prevail and that use cooling systems intensively. Hermosillo’s tariff 1F represents the most subsidized tariff in the country due to the high demand of electricity during the summer months (from May to October). Nevertheless, for this case, without the subsidy, the electricity bills would be unpayable for most families. On the other hand, the use of cooling systems in Durango are minor, therefore the electricity tariff (tariff 1) is not subsidized. The fuel for the operation of heating systems can be either electricity or gas (either natural or LP), depending on the equipment existing in the house.
3.3. Installation and Operation Costs
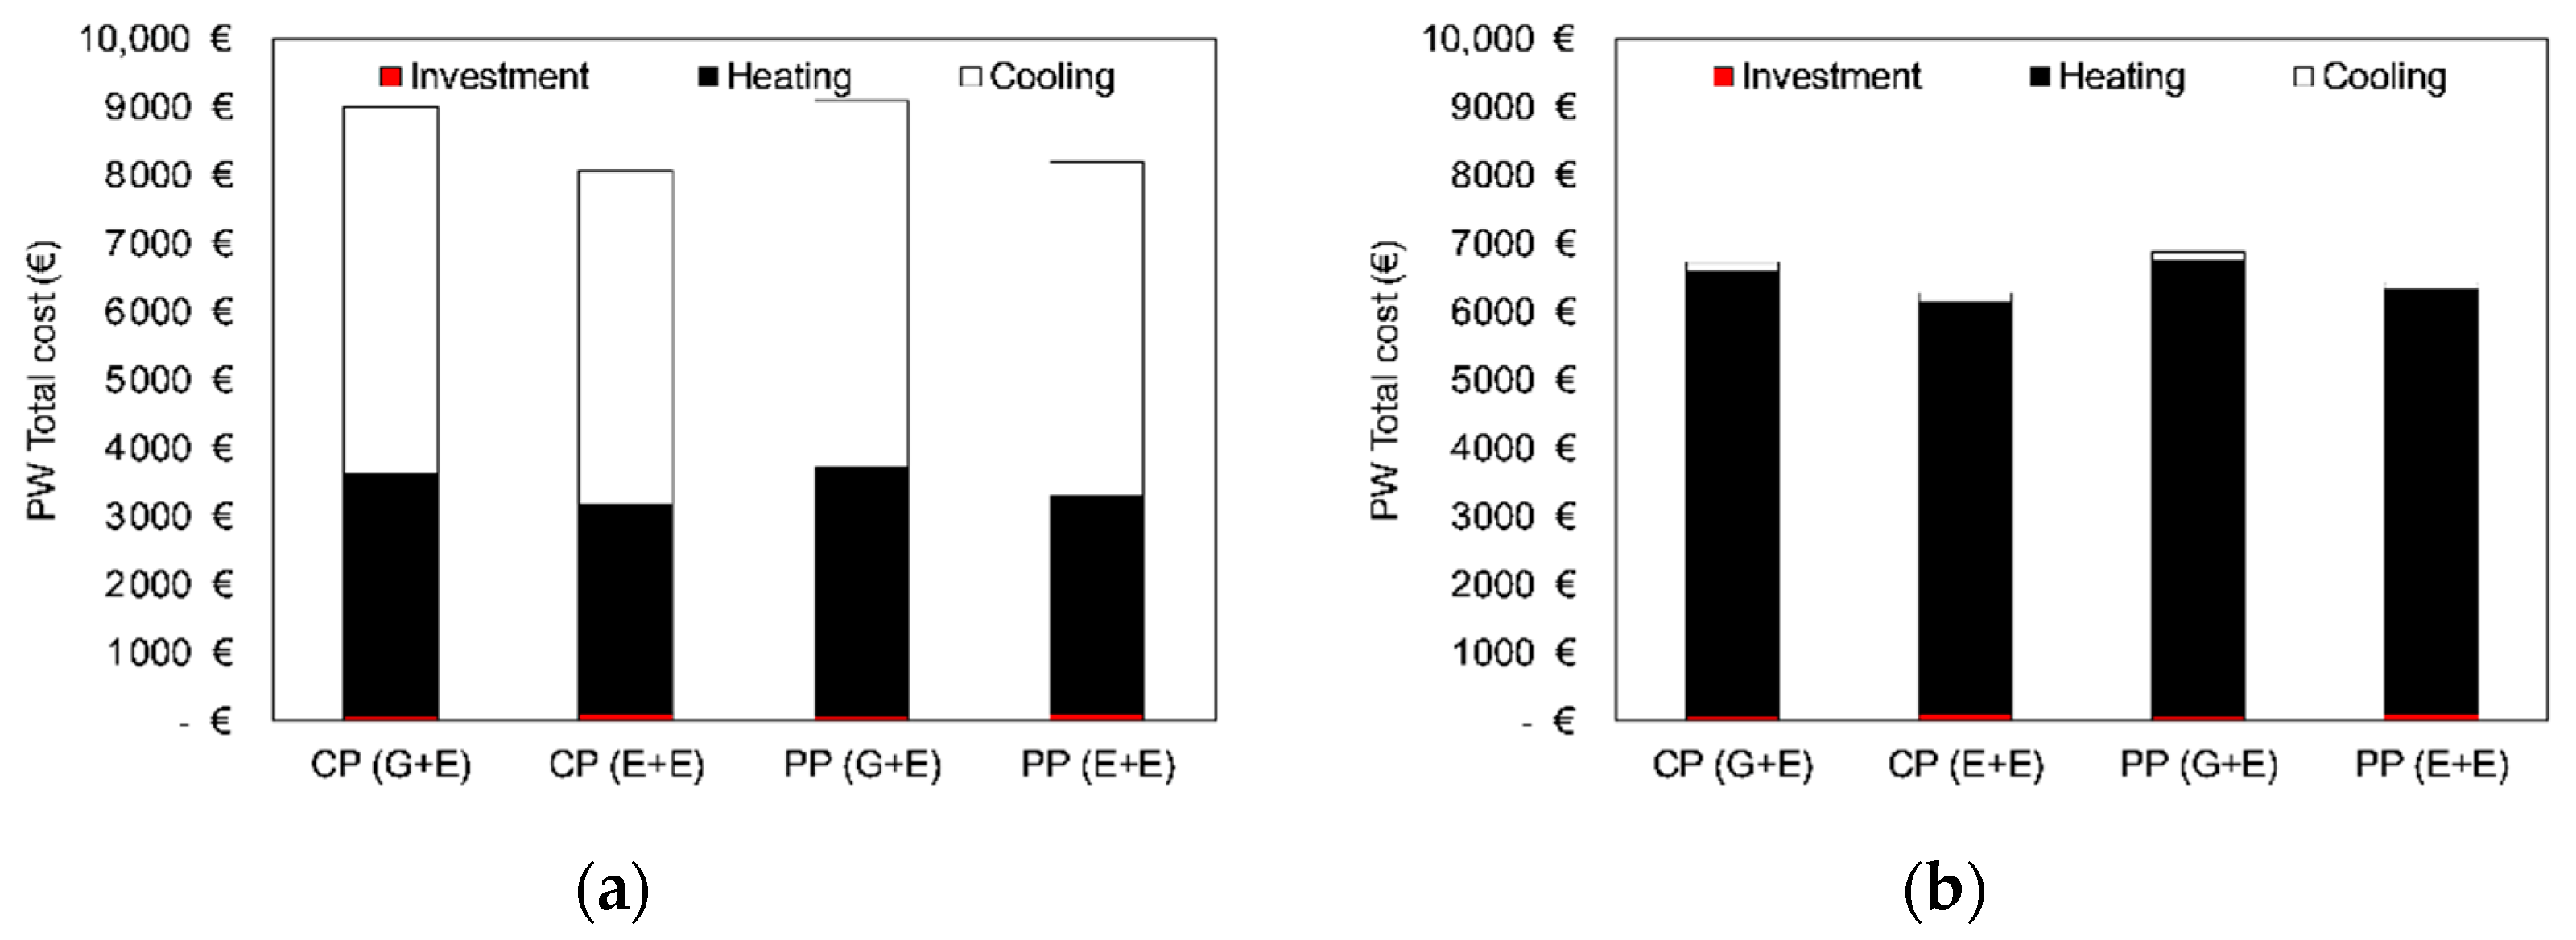
Figure 7 shows the total energy costs due to the implementation of the traditional CP and PP. The total costs included investment (materials, installation, and equipment) plus the costs of the energy required to operate the air conditioning systems (electricity and LP gas).
Figure 7a shows that, for the city of Hermosillo, it was possible to achieve energy savings between 9.8% (E+E) and 10.3% (G+E) when the perlite plaster was incorporated into the wall, while, for Durango (
Figure 7b), these savings would be between 6.2% (E+E) and 6.7% (G+E). These results incorporate the investment cost of the plaster systems that represent less than 1.5% of the expenditure in 30 years of operation. Consequently, the return on investment of using such systems would be reached in less than one year for both cities.
3.4. Annual CO2 Emissions
The CO
2 emissions calculation considered the annual energy requirements of each scenario. The impact calculation of the electric systems used an emission factor from the Mexican electricity sector. The emission factor is reported to be 0.582 CO
2 ton/MWh [
55]. On the other hand, an emission factor for the LP gas of 65,083 kg CO
2/TJ was taken from an emissions report issued by the National Institute of Ecology and Climate Change of México (INECC) [
56].
Figure 8a shows a reduction in CO
2 emissions of 6.7% (E+E) and 10.9% (G+E) using the lightweight systems in Hermosillo. In
Figure 8b, in the city of Durango, up to 7% of CO
2 emissions would be avoided. The difference of CO
2 emissions between (E+E) and (G+E) systems within the hot arid climate was not critical (less than 2%); however, in the cold semi-arid climate, this comparison between the selection of the heating system resulted in a 20% difference.
The analysis of the amount of CO
2 emissions shows that, when the house used electric heating and cooling systems, it generated a large amount of CO
2 emissions. The generation of CO
2 emissions due to the use of heating systems in the city with the cold semi-arid climate was substantially higher. It is important to mention that electric cooling systems are common in urban dwellings located in the hot arid climate. The statistical information of México indicates that 35% of houses have at least one cooling system, and these figures will increase up to 50% in 2030 and 80% in 2050 [
3]. A 2018 report developed by the National Institute of Statistic and Geography (INEGI), shows that, within the extreme warm region, 48.1% of the houses have a cooling system, representing a total of 5.6 million devices [
57]. This document also reports that, of the 2.5 million installed heating systems, 46.3% are electric and 29.3% use gas (natural or LP).
4. Discussion
A low-cost perlite mortar for a plaster application was proposed. The lightweight material was designed and adapted for the walls of economic housing. The main objective was to obtain accurate information to develop an evaluation of the thermal performance of a house through dynamic simulations.
The results indicate that the conditions of thermal discomfort prevailed over three quarters of the year in the hot arid weather (BWh); as for the city with cold semi-arid climate (BSk), just above half of the year had an adequate thermal comfort range. The incorporation of perlite plaster on the façades of houses in the hot arid climate helped to reduce the energy requirements by up to 7.7% (heating) and 3.5% (cooling); correspondingly, the CO
2 emissions also would be reduced up to 10.9% and 7.0% for BWh and BSk climates, respectively. In a cost-effectiveness evaluation performed by Naji et al. [
9], they found that the heating and cooling requirements for a house in Turkey (Csa, Mediterranean climate) were 2200 kWh (18.06 kWh/m
2) and 5200 kWh (42.69 kWh/m
2), respectively. The cooling requirements for Hermosillo and Durango were 118.79 kWh/m
2 and 2.73 kWh/m
2, respectively, and the heating demands were 24.29 kWh/m
2 and 50.19 kWh/m
2. Even though the analyzed houses greatly differed in size (121.80 m
2 in Turkey vs. 51.98 m
2 in this study) and there was a noticeable difference between climates, the total energy requirements per square meter were similar.
The economic analysis showed possible savings of up to 10.3% (BWh) and 6.7% (BSk) over 30 years of operation. Therefore, even though the electricity tariff is heavily subsidized, the climate with the greatest potential for saving is the hot arid climate. Although the savings may seem small, they become attractive for an investment (including materials, installation and the cost of fuel for air conditioning systems) of less than 1.5% of the total cost. In this research, the maximum calculated savings (30-year analysis), were 17.76 (€/m
2) in Hermosillo and 8.65 (€/m
2) in Durango. An analysis performed in China [
8] shows that the maximum saving, calculated for a life-cycle cost of 20 years and an electricity cost of 0.076 (€/kWh), was 41.94
$/m
2.
There was no increase in the CO2 emissions due to the use of electric or gas heating systems for the hot arid region. On the other hand, this decision certainly influenced the amount of CO2 emissions (20% increment when using an electric heating system) for the cold semi-arid region.
5. Conclusions
The addition of perlite to construction materials is a low-cost alternative for new or already constructed houses due to the uncomplicated incorporation. The addition of such lightweight materials can achieve greater savings when incorporated in larger quantities and in other construction elements.
This study was conceived as exploratory research to calculate the possible effects and impacts of incorporating the perlite plaster to prototypical economic houses on two arid climates. Energy efficiency studies were not often profitable due to subsidized domestic electricity tariffs and low gas prices. For example, the least subsidized tariff (1, Durango) ranges MXN 0.70–2.8 (EUR 0.0318–0.127), whereas the most subsidized tariff (1F, Hermosillo) ranges MXN 0.58–2.8 (EUR 0.0650–0.127).
These results lead to the conclusion that governments wanting to promote energy efficient, sustainability or renewable energy systems should encourage the development of programs that provide attractive loans for its implementation instead of promoting electricity subsidies. In addition, if subsidized tariffs are in place, the environmental benefits, such as the reduction of CO2 emissions due to sustainable systems implementation, should be considered for policy-making. Despite subsidies, the objective of this research was positively achieved with moderate savings and a CO2 reduction for both climates. Therefore, the implementation of the perlite plaster should be adopted, either for economic or residential housing. However, further studies are still needed for additional cases.
Author Contributions
Formal analysis, A.C.B.-A. and M.N.-T.; Funding acquisition, N.A.R.-M.; Investigation, A.C.B.-A.; Methodology, N.A.R.-M.; Project administration, N.A.R.-M.; Software, M.N.-T.; Writing—original draft, A.C.B.-A.; and Writing—review and editing, N.A.R.-M. and M.N.-T.
Funding
This research was funded by Consejo Nacional de Ciencia y Tecnologia (CONACYT) (grant number CONACYT-CONAVI 2014-1-S0003-236187) and Consejo Nacional de Ciencia y Tecnologia (CONACYT) (grant number CONACYT-PDCPN-2015:1099).
Acknowledgments
We acknowledge the Laboratory of Material Thermal Analysis (TERMAT) from the Civil Engineering Department of the University of Sonora (UNISON); the Municipal Housing Institute of Durango (INMUVI) for the housing information; and the students—Juan F. Vela-Carrillo (CONACYT:28359), Rubén D. Torres-Verduzco (CONACYT:26912) and Claudia K. Romero-Pérez (CONACYT:252876)—who collaborated on the processing of image files.
Conflicts of Interest
The authors declare no conflict of interest.
Abbreviations
| | Nomenclature | | Abbreviations |
| A | Area, m2 | ASHRAE | American Society of Heating, Refrigerating and Air-Conditioning Engineers |
| Cp | Specific heat, kJ/kg K | ASTM | American Society for Testing and Materials |
| EC | Energy cost, $MXN | BSk | Hot arid climate |
| eff’ | Efficiency, % | BWh | Cold semi-arid climate |
| G | Gradient, $MXN | CB | Concrete block |
| GPWF | Gradient present worth factor, - | CONAVI | National housing commission |
| k | Thermal conductivity, W/m K | CP | Cement plaster |
| PCA | Annual increase in the cost of energy, % | CPC-30R | Portland cement |
| PW | Present worth, $MXN | DAC | High consumption domestic tariff |
| R | Uniform amount, $MXN | (E+E) | Heating electric systems and cooling electric systems |
| SPWF | Series present worth factor, - | FONHAPO | National trust fund for popular housing |
| V | Volume, L | FOVISSSTE | State workers housing Institute |
| W | Weight, kg | (G+E) | Heating gas systems and cooling electric systems |
| | Greek symbols | HVAC | Heating, ventilation, and air conditioning |
| α | Absorptivity | INECC | Mexican Institute of Ecology and Climate Change |
| δ | Density, kg/m3 | INEGI | National Institute of Statistic and Geography |
| ε | Emissivity | INFONAVIT | Workers Housing Institute |
| ρ | Reflectivity | LP | liquid petroleum |
| | | MXN | Mexican peso |
| | | NMX | Non-mandatory Mexican federal standard |
| | | NOM | Mandatory Mexican federal standard |
| | | ONNCCE | Normalization and certification national organism |
| | | PCM | Phase change material |
| | | PP | Perlite plaster |
| | | RB | Red brick |
| | | TMY | Typical meteorological year |
References
- International Energy Agency. WEO-2015 Special Report: Energy and Climate Change; IEA: Paris, France, 2015. [Google Scholar]
- International Energy Agency. The Future of Cooling: Opportunities for Energy-Efficient Air Conditioning; IEA: Paris, France, 2018. [Google Scholar]
- Mexico Space Cooling Electricity Impacts and Mitigation Strategies: Analysis Supporting the Summit on Space Cooling; USAID: Mexico City, Mexico, 2018.
- Informe Nacional de Monitoreo de la Eficiencia Energética de México; CEPAL: Mexico City, Mexico, 2018.
- Muñoz-Torres, G.E. NAMA Mexicana de vivienda nueva: Un análisis cualitativo. Vivienda y Comunidades Sustentables 2018, 3, 11–24. [Google Scholar]
- Borbón, A.C.; Cabanillas, R.E.; Pérez, J.B. Determinación experimental y contraste numérico de la resistencia térmica de un muro de bloques de concreto hueco. Inf. Technol. 2010, 21, 163–176. [Google Scholar] [CrossRef]
- Mitsopoulos, G.; Bellos, E.; Tzivanidis, C. Financial and Energetic Optimization of Greek Buildings Insulation. Designs 2018, 2, 34. [Google Scholar] [CrossRef]
- Yu, J.; Yang, C.; Tian, L.; Liao, D. A study on optimum insulation thicknesses of external walls in hot summer and cold winter zone of China. Appl. Energy 2009, 86, 2520–2529. [Google Scholar] [CrossRef]
- Naji, S.; Celik, O.C.; Alengaram, J.C.; Jumaat, M.Z.; Shamshirband, S. Structure, energy and cost efficiency evaluation of three different lightweight construction systems used in low-rise residential buildings. Energy Build. 2014, 84, 727–739. [Google Scholar] [CrossRef]
- Silva, A.S.; Almeida, L.S.S.; Ghisi, E. Decision-making process for improving thermal and energy performance of residential buildings: A case study of constructive systems in Brazil. Energy Build. 2016, 128, 270–286. [Google Scholar] [CrossRef]
- Struck, C. Uncertainty Propagation and Sensitivity Analysis Techniques in Building Performance Simulation to Support Conceptual Building and System Design. Ph.D. Thesis, Eindhoven University, Enhofen, The Netherlands, 2012. [Google Scholar]
- Tian, W.; Heo, Y.; de Wilde, P.; Li, Z.; Yan, D.; Park, C.S.; Feng, X.; Augenbroe, G. A review of uncertainty analysis in building energy assessment. Renew. Sustain. Energy Rev. 2018, 93, 285–301. [Google Scholar] [CrossRef]
- Silva, A.S.; Ghisi, E. Uncertainty analysis of the computer model in building performance simulation. Energy Build. 2014, 76, 258–269. [Google Scholar] [CrossRef]
- Burhenne, S.; Tsvetkova, O.; Jacob, D.; Henze, G.P.; Wagner, A. Uncertainty quantification for combined building performance and cost-benefit analyses. Build. Environ. 2013, 62, 143–154. [Google Scholar] [CrossRef]
- Hopfe, C.J.; Hensen, J.L.M. Uncertainty analysis in building performance simulation for design support. Energy Build. 2011, 43, 2798–2805. [Google Scholar] [CrossRef]
- Marco, J.; García, E.; Más, M.I.; Alcaraz, V.; Luizaga, A. Estudio de la resistencia a compresión de morteros fabricados con conglomerante compuesto de polvo de vidrio. Inf. Construcción 2012, 64, 529–536. [Google Scholar] [CrossRef]
- Barros Llerena, A.; Caballero, J.M.; Zaldo, V. Aplicaciones del Cemento Reforzado con Fibra de Vidrio (GRC). Inf. Construcción 1981, 69, 73–81. [Google Scholar] [CrossRef]
- Del Río Merino, M.; Santa Cruz Astorqui, J.; González Cortina, M. Morteros aligerados con arcilla expandida: Influencia de la granulometría y la adicción de fibras de vidrio AR en el comportamiento mecánico. Inf. Construcción 2005, 57, 39–46. [Google Scholar] [CrossRef]
- Astorqui, J.S.C.; Del Río Merino, M.; Sáez, P.V.; Porras-Amores, C. Analysis of the Relationship between Density and Mechanical Strength of Lightened Gypsums: Proposal for a Coefficient of Lightening. Adv. Mater. Sci. Eng. 2017, 2017. [Google Scholar] [CrossRef]
- Heim, D.; Wieprzkowicz, A. Attenuation of Temperature Fluctuations on an External Surface of the Wall by a Phase Change Material-Activated Layer. Appl. Sci. 2017, 8, 11. [Google Scholar] [CrossRef]
- Ramakrishnan, S.; Wang, X.; Sanjayan, J.; Wilson, J. Thermal performance assessment of phase change material integrated cementitious composites in buildings: Experimental and numerical approach. Appl. Energy 2017, 207, 654–664. [Google Scholar] [CrossRef]
- Abidi, S.; Nait-Ali, B.; Joliff, Y.; Favotto, C. Impact of perlite, vermiculite and cement on the thermal conductivity of a plaster composite material: Experimental and numerical approaches. Compos. Part B Eng. 2015, 68, 392–400. [Google Scholar] [CrossRef]
- Tasdemir, C.; Sengul, O.; Tasdemir, M.A. A comparative study on the thermal conductivities and mechanical properties of lightweight concretes. Energy Build. 2017, 151, 469–475. [Google Scholar] [CrossRef]
- Lu, Z.; Hanif, A.; Lu, C.; Liu, K.; Sun, G.; Li, Z. A novel lightweight cementitious composite with enhanced thermal insulation and mechanical properties by extrusion technique. Constr. Build. Mater. 2018, 163, 446–449. [Google Scholar] [CrossRef]
- Farnood Ahmadi, P.; Ardeshir, A.; Ramezanianpour, A.M.; Bayat, H. Characteristics of heat insulating clay bricks made from zeolite, waste steel slag and expanded perlite. Ceram. Int. 2018, 44, 7588–7598. [Google Scholar] [CrossRef]
- Balo, F.; Sua, L.S. Techno-economic optimization model for “sustainable” insulation material developed for energy efficiency. Int. J. Appl. Ceram. Technol. 2018, 15, 792–814. [Google Scholar] [CrossRef]
- Vasco, D.A.; Muñoz-Mejías, M.; Pino-Sepúlveda, R.; Ortega-Aguilera, R.; García-Herrera, C. Thermal simulation of a social dwelling in Chile: Effect of the thermal zone and the temperature-dependant thermophysical properties of light envelope materials. Appl. Therm. Eng. 2017, 112, 771–783. [Google Scholar] [CrossRef]
- Ruá, M.J.; Guadalajara, N. Using the building energy rating software for mathematically modelling operation costs in a simulated home. Int. J. Comput. Math. 2016, 93, 797–806. [Google Scholar] [CrossRef]
- Rashidi, S.; Esfahani, J.A.; Karimi, N. Porous materials in building energy technologies—A review of the applications, modelling and experiments. Renew. Sustain. Energy Rev. 2018, 91, 229–247. [Google Scholar] [CrossRef]
- Saffari, M.; de Gracia, A.; Ushak, S.; Cabeza, L.F. Passive cooling of buildings with phase change materials using whole-building energy simulation tools: A review. Renew. Sustain. Energy Rev. 2017, 80, 1239–1255. [Google Scholar] [CrossRef]
- Berardi, U.; Tronchin, L.; Manfren, M.; Nastasi, B. On the effects of variation of thermal conductivity in buildings in the Italian construction sector. Energies 2018, 11, 872. [Google Scholar] [CrossRef]
- Genova, E.; Fatta, G. The thermal performances of historic masonry: In-situ measurements of thermal conductance on calcarenite stone walls in Palermo. Energy Build. 2018, 168, 363–373. [Google Scholar] [CrossRef]
- Pásztory, Z.; Horváth, T.; Glass, S.V.; Zelinka, S. Experimental investigation of the influence of temperature on thermal conductivity of multilayer reflective thermal insulation. Energy Build. 2018, 174, 26–30. [Google Scholar] [CrossRef]
- NMX-C-077-ONNCCE-1997: Industria de la Construcción—Agregados para Concreto—Análisis Granulométrico- Método de Prueba; ONNCCE: Mexico City, Mexico, 1997.
- Termolita Ficha Tecnica: Termocret (Technical Sheet). Available online: https://www.materialesjerez.com.mx/wp-content/uploads/2016/10/TERMOCRETF.pdf (accessed on 18 February 2019).
- Sanchez de Guzman, D. Tecnología del Concreto y del Mortero, 5th ed.; Editores, B., Ed.; Pontificia Universidad Javeriana: Bogota, Colombia, 2001. [Google Scholar]
- NMX-C-061-ONNCCE-2015: Industria de la Construcción. Cementos Hidráulicos—Determinación de la Resistencia a la Compresión de Cementantes Hidráulicos; ONNCCE: Mexico City, Mexico, 2015.
- NMX-C-162-ONNCCE-2014: Industria de la Construcción. Concreto hidráulico—Determinación de la Masa Unitaria, cálculo del Rendimiento y Contenido de Aire del Concreto Fresco por el Método Gravimétrico; ONNCCE: Mexico City, Mexico, 2014.
- NMX-C-159-ONNCCE-2016: Industria de la Construcción—Concreto—Elaboración y Curado de Especímenes de Ensayo; ONNCCE: Mexico City, Mexico, 2016.
- NMX-C-161-ONNCCE-2013: Industria de la Construcción -Concreto Fresco—Muestreo; ONNCCE: Mexico City, Mexico, 2013.
- ASTM C109/C109M—16a Standard Test Method for Compressive Strength of Hydraulic Cement Mortars (Using 2-in. or [50-mm] Cube Specimens); ASTM: West Conshohocken, PA, USA, 2016.
- ASTM C348—14 Standard Test Method for Flexural Strength of Hydraulic-Cement Mortars; ASTM: West Conshohocken, PA, USA, 2014.
- ASTM C349—14 Standard Test Method for Compressive Strength of Hydraulic-Cement Mortars (Using Portions of Prisms Broken in Flexure); ASTM: West Conshohocken, PA, USA, 2014.
- NMX-C-486-ONNCCE-2014: Industria de la Construcción -Mampostería- Mortero para uso Estructural- Especificaciones y Métodos de Ensayo; ONNCCE: Mexico City, Mexico, 2014.
- ASTM D5334—14 Standard Test Method for Determination of Thermal Conductivity of Soil and Soft Rock by Thermal Needle Probe Procedure; ASTM: West Conshohocken, PA, USA, 2014.
- INEGI UMA—Unidad de Medida y Actualización. Available online: https://www.inegi.org.mx/temas/uma/ (accessed on 18 February 2019).
- INFONAVIT Plan Financiero 2016-2020 [INFONAVIT Financial Plan]. Available online: https://portal.infonavit.org.mx/wps/wcm/connect/b5470f62-a334-4450-85cd-0dd9256064e3/Plan_Financiero_2015-2019.pdf?MOD=AJPERES (accessed on 18 February 2019).
- ASHRAE 55: 2004 Thermal Environmental Conditions for Human Occupancy. ASHRAE 2004, 2004, 30.
- Comprobacion DEEVi: Valor U de Elementos Constructivos (U Value of Constructive Systems); INFONAVIT: Durango, Mexico, 2016.
- NOM-020-ENER-2011: Eficiencia Energética en Edificaciones. Envolvente de Edificios para uso Habitacional; [Energy Efficiency in Buildings: Residential Use]; Diario Oficial de la Federacion: Mexico City, Mexico, 2011.
- FANOSA. Soluciones que Cumplen con la nom-020-ENER-2011. Available online: https://www.gob.mx/cms/uploads/attachment/file/84531/2_FANOSA.pdf (accessed on 4 March 2019).
- CFE. Nuevo Esquema Tarifario (2017–2018). Available online: https://app.cfe.mx/Aplicaciones/CCFE/Tarifas/TarifasCRECasa/Casa.aspx (accessed on 18 February 2019).
- DOF. ACUERDO por el que se Autorizan las Tarifas Finales de Energía Eléctrica del Suministro Básico a Usuarios Domésticos. Available online: http://www.dof.gob.mx/nota_detalle.php?codigo=5506179&fecha=30/11/2017 (accessed on 18 February 2019).
- Lucero-Álvarez, J.; Rodríguez-Muñoz, N.; Martín-Domínguez, I. The Effects of Roof and Wall Insulation on the Energy Costs of Low Income Housing in Mexico. Sustainability 2016, 8, 590. [Google Scholar] [CrossRef]
- CRE Factor de Emisión del Sector Eléctrico Nacional. Available online: https://www.gob.mx/cms/uploads/attachment/file/304573/Factor_de_Emisi_n_del_Sector_El_ctrico_Nacional_1.pdf (accessed on 18 February 2019).
- INECC. Factores de Emisión para los Diferentes Tipos de Combustibles Fósiles que se Consumen en México. Available online: http://www.inecc.gob.mx/descargas/cclimatico/2014_inf_parc_tipos_comb_fosiles.pdf (accessed on 18 February 2019).
- INEGI. Encuesta Nacional Sobre el Consumo de Energéticos en Viviendas Particulares. Available online: http://www.beta.inegi.org.mx/programas/encevi/2018/ (accessed on 18 February 2019).
Figure 1.
Housing: (a) floor plan; and (b) façade. Source: Municipal Housing Institute (INMUVI-Durango).
Figure 1.
Housing: (a) floor plan; and (b) façade. Source: Municipal Housing Institute (INMUVI-Durango).
Figure 2.
Climatological variables per analyzed city: (a) Hermosillo; and (b) Durango.
Figure 2.
Climatological variables per analyzed city: (a) Hermosillo; and (b) Durango.
Figure 3.
Thermal comfort hours per thermal zone. SBR, south bedroom; NBR, north bedroom; KLR, kitchen-living room. (a) CP Hermosillo; (b) PP Hermosillo; (c) CP Durango; and (d) PP Durango.
Figure 3.
Thermal comfort hours per thermal zone. SBR, south bedroom; NBR, north bedroom; KLR, kitchen-living room. (a) CP Hermosillo; (b) PP Hermosillo; (c) CP Durango; and (d) PP Durango.
Figure 4.
Heating and cooling annual energy requirements. (a) Hermosillo; and (b) Durango.
Figure 4.
Heating and cooling annual energy requirements. (a) Hermosillo; and (b) Durango.
Figure 5.
Monthly energy requirements. CP, cement plaster; PP, perlite plaster. (a) CB Hermosillo; (b) CB Durango; (c) RB Hermosillo; and (d) RB Durango.
Figure 5.
Monthly energy requirements. CP, cement plaster; PP, perlite plaster. (a) CB Hermosillo; (b) CB Durango; (c) RB Hermosillo; and (d) RB Durango.
Figure 6.
Annual energy savings.
Figure 6.
Annual energy savings.
Figure 7.
Total annual cost: (a) Hermosillo; and (b) Durango.
Figure 7.
Total annual cost: (a) Hermosillo; and (b) Durango.
Figure 8.
Annual CO2 emissions per house: (a) Hermosillo; and (b) Durango.
Figure 8.
Annual CO2 emissions per house: (a) Hermosillo; and (b) Durango.
Table 1.
Density and absorption of materials.
Table 1.
Density and absorption of materials.
| Material | Density, δ (kg/m3) | Absorption (%) |
|---|
| Cement CPC-30R [36] | 3000 | - |
| Sand [36] | 2560 | 1.50 |
| Mineral perlite [35] | 341 | 6.82 |
Table 2.
Proportions for natural and lightweight mortar, absolute volume and fluidity of 110 ± 5%.
Table 2.
Proportions for natural and lightweight mortar, absolute volume and fluidity of 110 ± 5%.
| Material | Natural Mixture 1:4 | Corrected Natural Mixture 1:4 |
|---|
| Volume of the mixture (V) | 20 | L |
| Additional water | 0.12 | L |
| Additional water volume in 1 m3 | 6.0 | L |
| Amount of air | 3.9 | % |
| Slump | 0.16 | m |
| Fluency | 107 | % |
| Density, δ | 2135 | kg/m3 |
| Corrected theoretical density | 2156 | kg/m3 |
Table 3.
Proportions for natural and lightweight mortar, absolute volume and fluidity of 110 ± 5%.
Table 3.
Proportions for natural and lightweight mortar, absolute volume and fluidity of 110 ± 5%.
| Material | Natural Mixture 1:4 | Corrected Natural Mixture 1:4 | Lightweight Mixture (60%) Mineral Perlite |
|---|
| Cement CPC30-R weight (kg) | 419 | 415 | 415 |
| Sand weight (kg) | 1430 | 1415 | 566 |
| Water volume (L) | 302 | 305 | 300 |
| Mineral perlite weight (kg) | 0 | 0 | 113 |
| Theoretical density (kg/m3) | 2151 | 2135 | 1393 |
Table 4.
Experimentation matrix for 15 L.
Table 4.
Experimentation matrix for 15 L.
| Material | Natural Mortar (Cement Plaster–CP) | Lightweight Mortar (60%) Mineral Perlite (Perlite Plaster–PP) |
|---|
| Cement CPC30-R weight (kg) | 6.225 | 6.225 |
| Sand weight (kg) | 21.225 | 8.49 |
| Water volume (L) | 4.575 | 4.496 |
| Mineral Perlite weight (kg) | 0 | 1.696 |
Table 5.
Fluid mortar test results.
Table 5.
Fluid mortar test results.
| Test | Natural Mortar (Cement Plaster–CP) | Lightweight Mortar (60%) Mineral Perlite (Perlite Plaster–PP) |
|---|
| Fluidity test (%) | 106.5 | 107.5 |
| Air content (%) | 6.0 | 9.5 |
| Density, δ (kg/m3) | 2129.0 | 1672.0 |
Table 6.
Compressive strength results of dry samples after 28 days of aging.
Table 6.
Compressive strength results of dry samples after 28 days of aging.
| Material | Name | Size (m) | Weight (kg) | Load (kg) | Strength (kg/cm2) | Average (kg/cm2) |
|---|
| A | B | C |
|---|
| Natural mixture (CP) | mold I | 0.0518 | 0.0505 | 0.0507 | 0.283 | 4897 | 187.21 | 187.83 |
| mold II | 0.0499 | 0.0509 | 0.0501 | 0.273 | 5382 | 211.91 |
| mold III | 0.0501 | 0.0994 | 0.0501 | 0.418 | 3241 | 164.39 |
| Lightweight mixture (60%) (PP) | mold I | 0.0516 | 0.0502 | 0.0519 | 0.208 | 2804 | 108.26 | 104.63 |
| mold II | 0.0519 | 0.0500 | 0.0504 | 0.207 | 2650 | 102.14 |
| mold III | 0.0520 | 0.0506 | 0.0511 | 0.212 | 2423 | 93.72 |
Table 7.
Sample dimensions and thermal properties.
Table 7.
Sample dimensions and thermal properties.
| Sample | Natural Mortar (Cement Plaster–CP) | Lightweight Mortar (60%) Mineral Perlite (Perlite Plaster–PP) |
|---|
| Thickness, l (m) | 0.04 | 0.04 |
| Area, A (m2) | 0.0225 | 0.0225 |
| Size (m) | 0.15 × 0.15 | 0.15 × 0.15 |
| Weight, W (kg) | 1.72 | 1.31 |
| Density, δ (kg/m3) | 1915 | 1432 |
| Specific heat, Cp (kJ/kg K) | 0.355 | 1.456 |
| Thermal conductivity, k (W/m K) | 0.764 | 0.335 |
Table 8.
Case studies.
| Climate/City | Code | Wall Composition | Roof Composition |
|---|
| BSk/Durango, Durango | RB + CP | Red brick + cement plaster | Clay–brick system + terracotta waterproofing |
| RB + PP | Red brick + perlite plaster |
| CB + CP | Concrete block + cement plaster |
| CB + PP | Concrete block + perlite plaster |
| BWh/Hermosillo, Sonora | RB + CP | Red brick + cement plaster | Lightened slab + reflective white waterproofing |
| RB + PP | Red brick + perlite plaster |
| CB + CP | Concrete block + cement plaster |
| CB + PP | Concrete block + perlite plaster |
Table 9.
Thermal and optical properties of the roofing systems.
Table 9.
Thermal and optical properties of the roofing systems.
| | Material | Thickness, L (m) | Thermal Conductivity, k (W/m K) | Specific Heat, Cp (kJ/kg K) | Density, δ (kg/m3) | (ε) | (α) | (ρ) |
|---|
| Clay–brick system | Terracotta waterproofing [49] | 0.0254 | 0.100 | 1.50 | 400 | 0.35 | 0.60 | 0.40 |
| Mortar layer [49] | 0.002 | 0.872 | 0.72 | 1860 | |
| Thin red brick [49] | 0.025 | 0.768 | 0.20 | 2000 |
| Mortar [49] | 0.025 | 0.698 | 0.72 | 1860 |
| Clay [49] | 0.075 | 0.095 | 0.44 | 1500 |
| Asphalt membrane [50] | 0.002 | 0.170 | 1.26 | 1127 |
| Concrete [50] | 0.100 | 1.740 | 0.84 | 2300 |
| Gypsum plaster [50] | 0.020 | 0.372 | 1.09 | 800 | 0.90 | 0.60 | 0.40 |
| Lightened slab | White waterproofing [49] | 0.025 | 0.063 | 1.50 | 400 | 0.85 | 0.30 | 0.70 |
| Concrete [50] | 0.040 | 1.740 | 0.84 | 2300 | |
| Lightened slab [51] | 0.110 | 0.334 | 1.32 | 381 |
| Gypsum plaster [50] | 0.020 | 0.372 | 1.09 | 800 | 0.90 | 0.60 | 0.40 |
Table 10.
Thermal properties of walls.
Table 10.
Thermal properties of walls.
| Code | Layer Order | Material | Thickness, L (m) | Thermal Conductivity, k (W/m K) | Specific Heat, Cp (kJ/kg K) | Source |
|---|
| RB-CP | Exterior | Cement plaster | 0.020 | 0.764 | 0.355 | * |
| Centre | Red brick | 0.130 | 0.872 | 0.900 | [50] |
| Interior | Gypsum plaster | 0.013 | 0.160 | 1.090 | [50] |
| RB-PP | Exterior | Perlite plaster | 0.020 | 0.335 | 1.456 | * |
| Centre | Red brick | 0.200 | 0.872 | 0.900 | [50] |
| Interior | Gypsum plaster | 0.013 | 0.160 | 1.090 | [50] |
| CB-CP | Exterior | Cement plaster | 0.020 | 0.764 | 0.3556 | * |
| Centre | Concrete block | 0.130 | 0.722 | 0.900 | [6] |
| Interior | Gypsum plaster | 0.013 | 0.160 | 1.090 | [50] |
| CB-LP | Exterior | Perlite plaster | 0.020 | 0.335 | 1.456 | * |
| Centre | Concrete block | 0.130 | 0.722 | 0.900 | [6] |
| Interior | Gypsum plaster | 0.013 | 0.160 | 1.090 | [50] |
© 2019 by the authors. Licensee MDPI, Basel, Switzerland. This article is an open access article distributed under the terms and conditions of the Creative Commons Attribution (CC BY) license (http://creativecommons.org/licenses/by/4.0/).


