Article

Rethinking the Utility of Public Bicycles: The Development and Challenges of Station-Less Bike Sharing in China

1
State Key Laboratory of Resources and Environmental Information System, Institute of Geographic Sciences and Natural Resources Research, Chinese Academy of Sciences, Beijing 100101, China
2
Key Laboratory of Regional Sustainable Development Modeling, Institute of Geographic Sciences and Natural Resources Research, Chinese Academy of Sciences, Beijing 100101, China
3
College of Resources and Environment, University of Chinese Academy of Sciences, Beijing 100049, China
4
School of Global Studies, University of Sussex, Brighton BN1 9QN, Sussex, UK
*
Author to whom correspondence should be addressed.
Sustainability 2019, 11(6), 1539; https://doi.org/10.3390/su11061539
Submission received: 31 January 2019 / Revised: 8 March 2019 / Accepted: 8 March 2019 / Published: 13 March 2019
(This article belongs to the Special Issue Accessibility and Transportation Equity)

Abstract

:
Cycling is known to be environmentally friendly and beneficial to public health and sustainable urban development. Cycling has recently increased in Chinese cities as a result of the emergence of station-less bike-sharing systems. This study examines the emergence, rapid growth and consolidation of station-less bike-sharing systems and the role of suppliers, users and government regulators. It shows that these systems developed unevenly, growing most in large cities in eastern and south-eastern China, and explores the relationship between this spatial distribution and the nature of the service and the socio-economic characteristics of cities. To investigate patterns of, and reasons for, the use of these systems, this research also reports the results of a survey of users and non-users, identifying their gender, age, income characteristics and attitudes to station-less systems.

1. Introduction

In the 1980s China was known as the ‘kingdom of the bicycle’. Since the 1990s however, increasing ownership and the use of private motor cars has seen a dramatic decline in bicycle usage [1]. The recent emergence of station-less bike-sharing has reversed this trend and seen a substantial rise in bicycle use, with significant urban transportation impacts. In 2017 the number of shared bicycle users reached 70 million [2]. At present Chinese bike-sharing companies serve about 150 cities, and have started to expand services overseas in cities such as Singapore and Sapporo. Improving the utility of station-less bike-sharing systems should help bring cycling habits back into overly car-congested cities [3], and play an important role in green mobility and urban sustainability.
Concomitant with the development of sharing economies and technologies [4], bike-sharing systems have evolved from station-based to station-less systems in China. Similar to other forms within the sharing economy [5,6], station-less systems involve on-demand services and flexible supply. In general, a station-less bike-sharing system uses a mobile phone application (app) to provide on-demand services (Figure 1). By increasing the use of bicycles, this new development is beneficial for public health [7]. In addition, it significantly improves the first/last mile of public transport journeys, alleviates traffic congestion and lessens the environmental impact of urban transport, helping to improve air quality, reduce carbon emissions and reduce traffic noise [8]. Since the launch of station-less bike-sharing systems in China, they have experienced explosive growth followed by consolidation, seasonal decline and even the recent collapse of some providers. This has given rise to important governance challenges.
The aim of this paper is to investigate how supplier, user and government agencies responded to, and affected, the development of bike-sharing systems in China, in particular, for station-less systems. With this in mind, the paper outlines the emergence, growth and consolidation of bike-sharing systems in China and interactions between suppliers and government agencies in these stages. In a further study of the supply side, the paper surveys the spatial distribution of station-less bike-sharing systems and their drivers. In terms of the demand side, the paper reports the results of a questionnaire survey conducted to understand usage patterns and related issues. The paper itself is organised as follows. The existing literature is briefly reviewed in Section 2. Section 3 outlines the evolution of bike-sharing systems in China, and the ways in which governments responded. Section 4 outlines methods used to study the supply and demand sides respectively. Section 5 presents the results, and Section 6 concludes.

2. Literature Review

The principle of bike-sharing is that people use a bicycle on an ‘as-needed’ basis without the costs and responsibilities of bicycle ownership [9]. Bike-sharing systems have evolved from ‘station-less’ to ‘station-based’ and back to ‘station-less’. DeMaio has shown that bike-sharing systems date back to 1965 in Amsterdam [8]. At that time and place, users looked for a shared bicycle at or near their place of origin and rode it to a destination where the user could leave it unlocked for the next user. The next generation, coin-deposit systems, first appeared in Denmark in 1991 [10]. With the design of docking stations, third generation systems appeared in 1996 in England at Portsmouth University. These self-service systems provided services in over 120 cities worldwide [8,11]. The fourth generation systems were station-less and included Call-a-bike, established in 2000, and Nextbike set up in 2004 in Europe (see www.bikesharingmap.com for a fuller list).
In China, station-based and station-less bike-sharing systems appeared successively. With the development of related smartphone applications from 2015, station-less bikes have appeared in about 150 Chinese cities. Before the emergence of station-less systems, station-based systems had been in use for years. Hence, station-based and station-less systems may be classified into two different phases in the development of bike-sharing systems in China. With this in mind, previous studies are sorted into two streams, as follows.

2.1. Station-Based Systems

Station-based bike-sharing systems or public bicycle programmes appeared in Denmark in 1991. Most subsequent systems used a station-based model. These systems received a great deal of attention, as they contributed significantly to improved urban mobility from the mid-2000s [11]. A variety of self-service docking stations were used. Bicycles could be hired at a docking station and had to be returned after use to the same or a different docking station.
The distribution of docking stations was an important determinant of accessibility and service coverage. Midgley suggested that bike stations should be close to major transit hubs (transfer points), residential zones (origins/destinations) and workplaces (destinations/origins) [12]. Martens argued that cycling should be an alternative mode of public transportation and that the distribution of bike stations should therefore be related to the public transport network [13]. In Europe and the United States, bike stations were indeed located close to Metro stations [13,14,15,16]. García-Palomares et al. put forward a GIS modelling approach for optimizing bike station locations [17].
In station-based systems, bicycles have to be moved from surplus to deficit stations. Ho and Szeto, and Erdoğan et al. (2014), amongst others, used optimization techniques to deal with this problem [18,19], while Fricker and Gast examined the role of the finite capacities of stations in the reallocation of bicycles [20]. The distribution of stations and the reallocation of bicycles together played an important role in matching supply and demand. However, a high density of stations required substantial investment and increased maintenance costs, so that station-based systems usually only served limited parts of cities.
To better understand their use, a number of researchers examined the geographies of bike-sharing systems in Europe, the Middle East, Asia, Australasia and North America [11,21,22,23,24,25]. Subsequently, Faghih-Imani and Eluru found that users’ destination preferences significantly affected cycling choices [26]. De Chardon et al. found that station-based systems encountered constraints in relation to the maximization of profits and service levels [27], although these constraints could be relaxed in medium-sized cities [28]. Moreover, Faghih-Imani et al. concluded that bike-sharing systems were likely to be favoured where urban congestion was serious [29]. An advantage of station-based systems was that bicycle usage could be monitored at points of origin and destination, but these systems were limited by the distribution of stations and the need to redistribute bicycles. As the success of bike-sharing systems largely depends on how user demand is met, these constraints limited the use of shared bicycles.

2.2. Station-Less Systems

The first station-less system in Amsterdam collapsed due to the absence of a suitable regulatory environment and monitoring [8]. If, however, station-less systems are equipped with built-in GPS devices, station-less systems offer significant opportunities for smart management and mobility [30], and should better facilitate cycling trips.
Recently, many station-less bike-sharing systems have appeared. In the US, Canada, Europe and Australia, SocialBicycles (SoBi) offered services via smartphones and websites [31]. In contrast to SoBi, post-2015 Chinese station-less bike sharing companies provided services only via smartphones. Bicycles were equipped with advanced locks. Mobike for example fitted its bicycles with keyless digital locks, which automatically unlocked/locked bicycles when users borrowed/returned them. The process of renting, riding and returning a station-less bike is shown in Figure 2.
Station-less systems are mobile phone application-based and can collect and display users’ cycling data. This data can be used in empirical studies of cycling behaviour [32]. Application data from GPS devices provides insights into spatio-temporal patterns of usage, but there is a lack of corresponding socio-demographic data. To fill this gap, Piwek et al. conducted an online survey to investigate the extent to which cyclists’ travel behaviour was affected by cycling applications [33]. Zhao and Li sought to identify the reasons why people chose cycling as a transfer mode. However, these studies did not focus on station-less systems [34].
Table 1 summarizes recent related studies. For station-based systems, bike-sharing implementation, cycling patterns and bike usage have been studied. At present however, gaps remain. To date there are few studies of Chinese station-less bike-sharing systems. A study by Zhang et al. dealt with the need to deal with the re-distribution of cycles and parking disorder [35]. The relationships between rapid growth, supplier strategy and governance, however, still require investigation, as do the socio-demographic characteristics of users. This knowledge is particularly important for policy-makers and operators seeking to improve urban transport and its management.

3. Stages in the Development of Bike-Sharing Systems in China

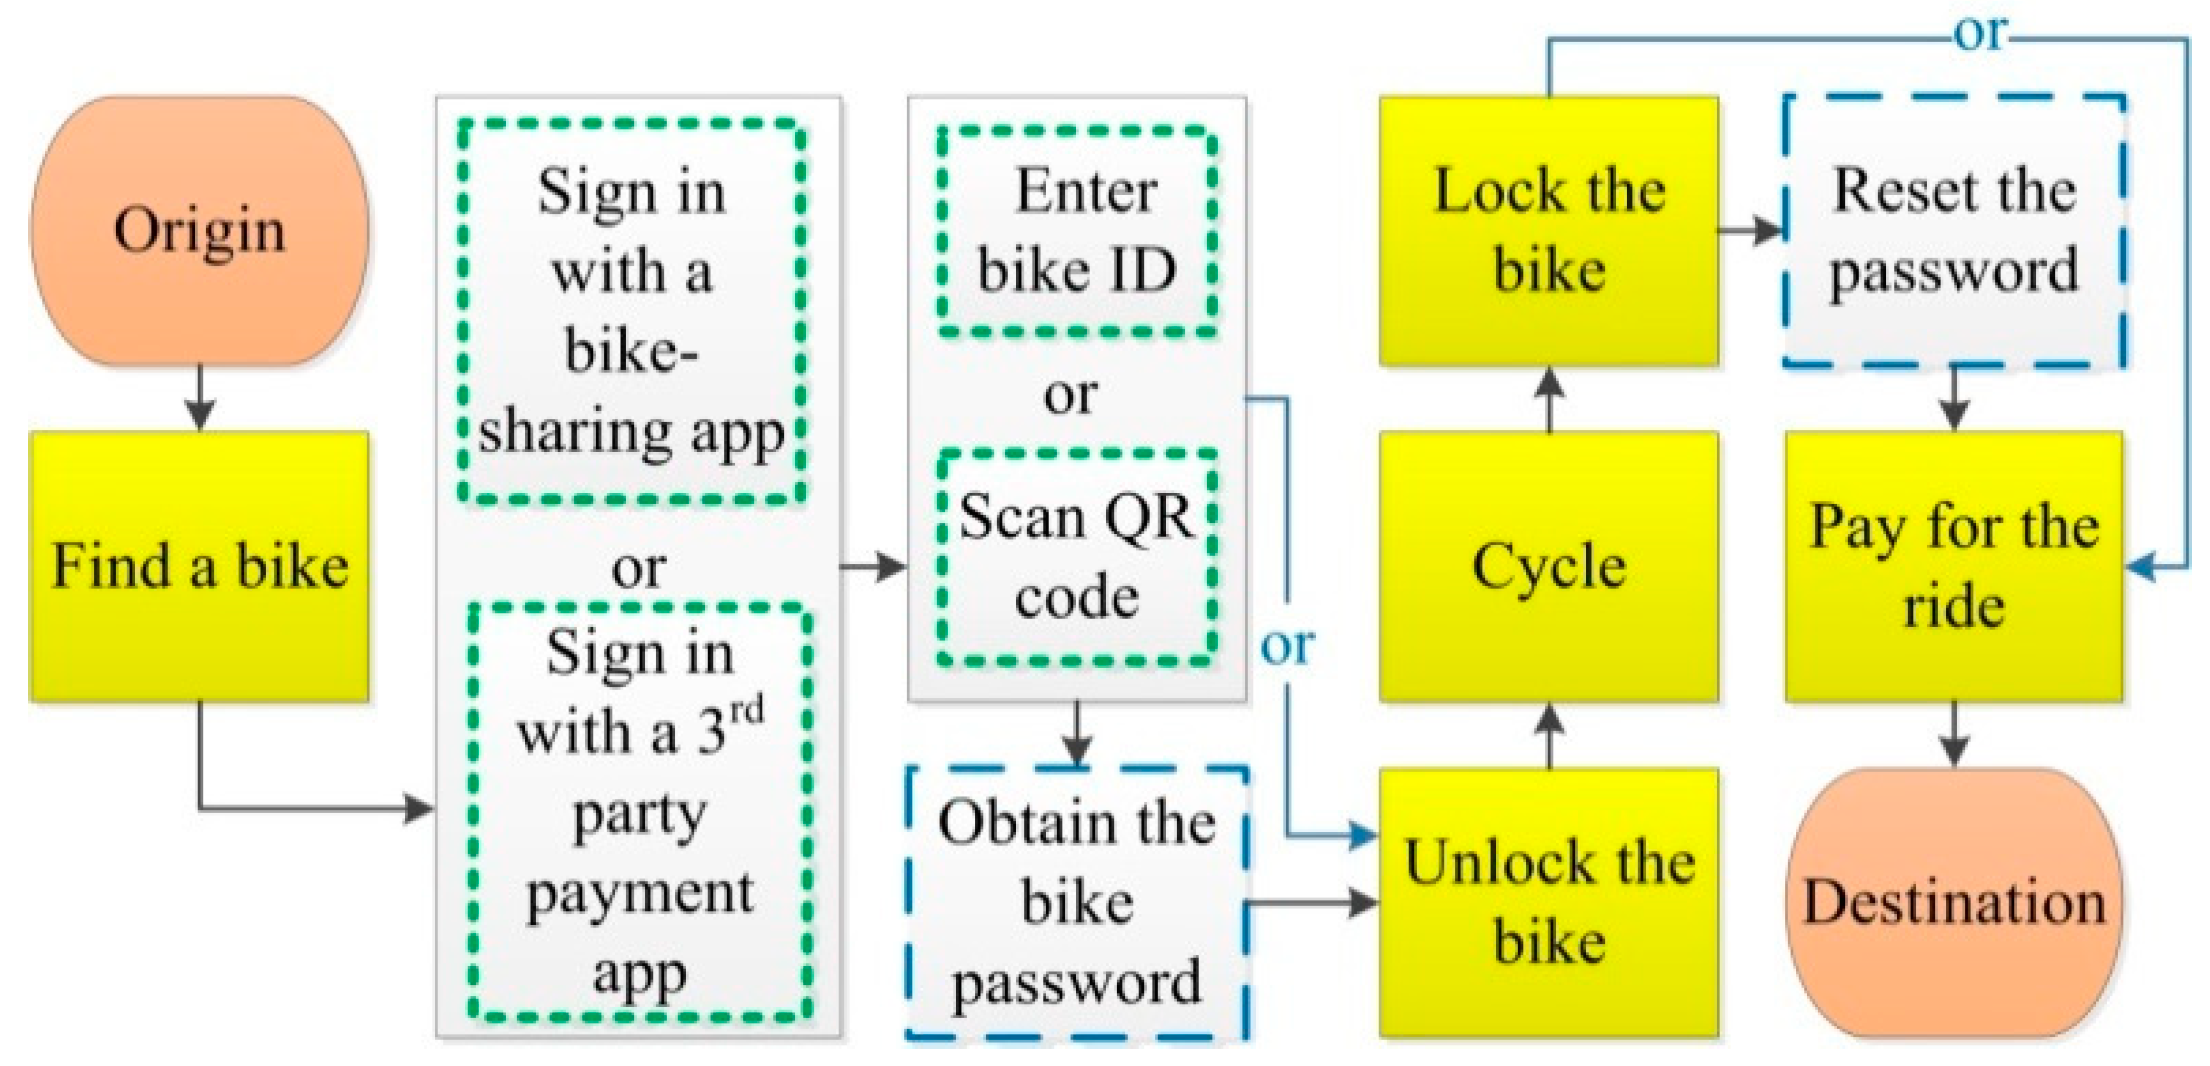
The emergence, growth and governance of urban shared cycling systems derives from the strategies of operators (bike sharing companies), decision-makers (local and national authorities whose responses to new application-based transport services differ), users and the suppliers and users of other modes of urban transport [36,37]. In the case of China, 
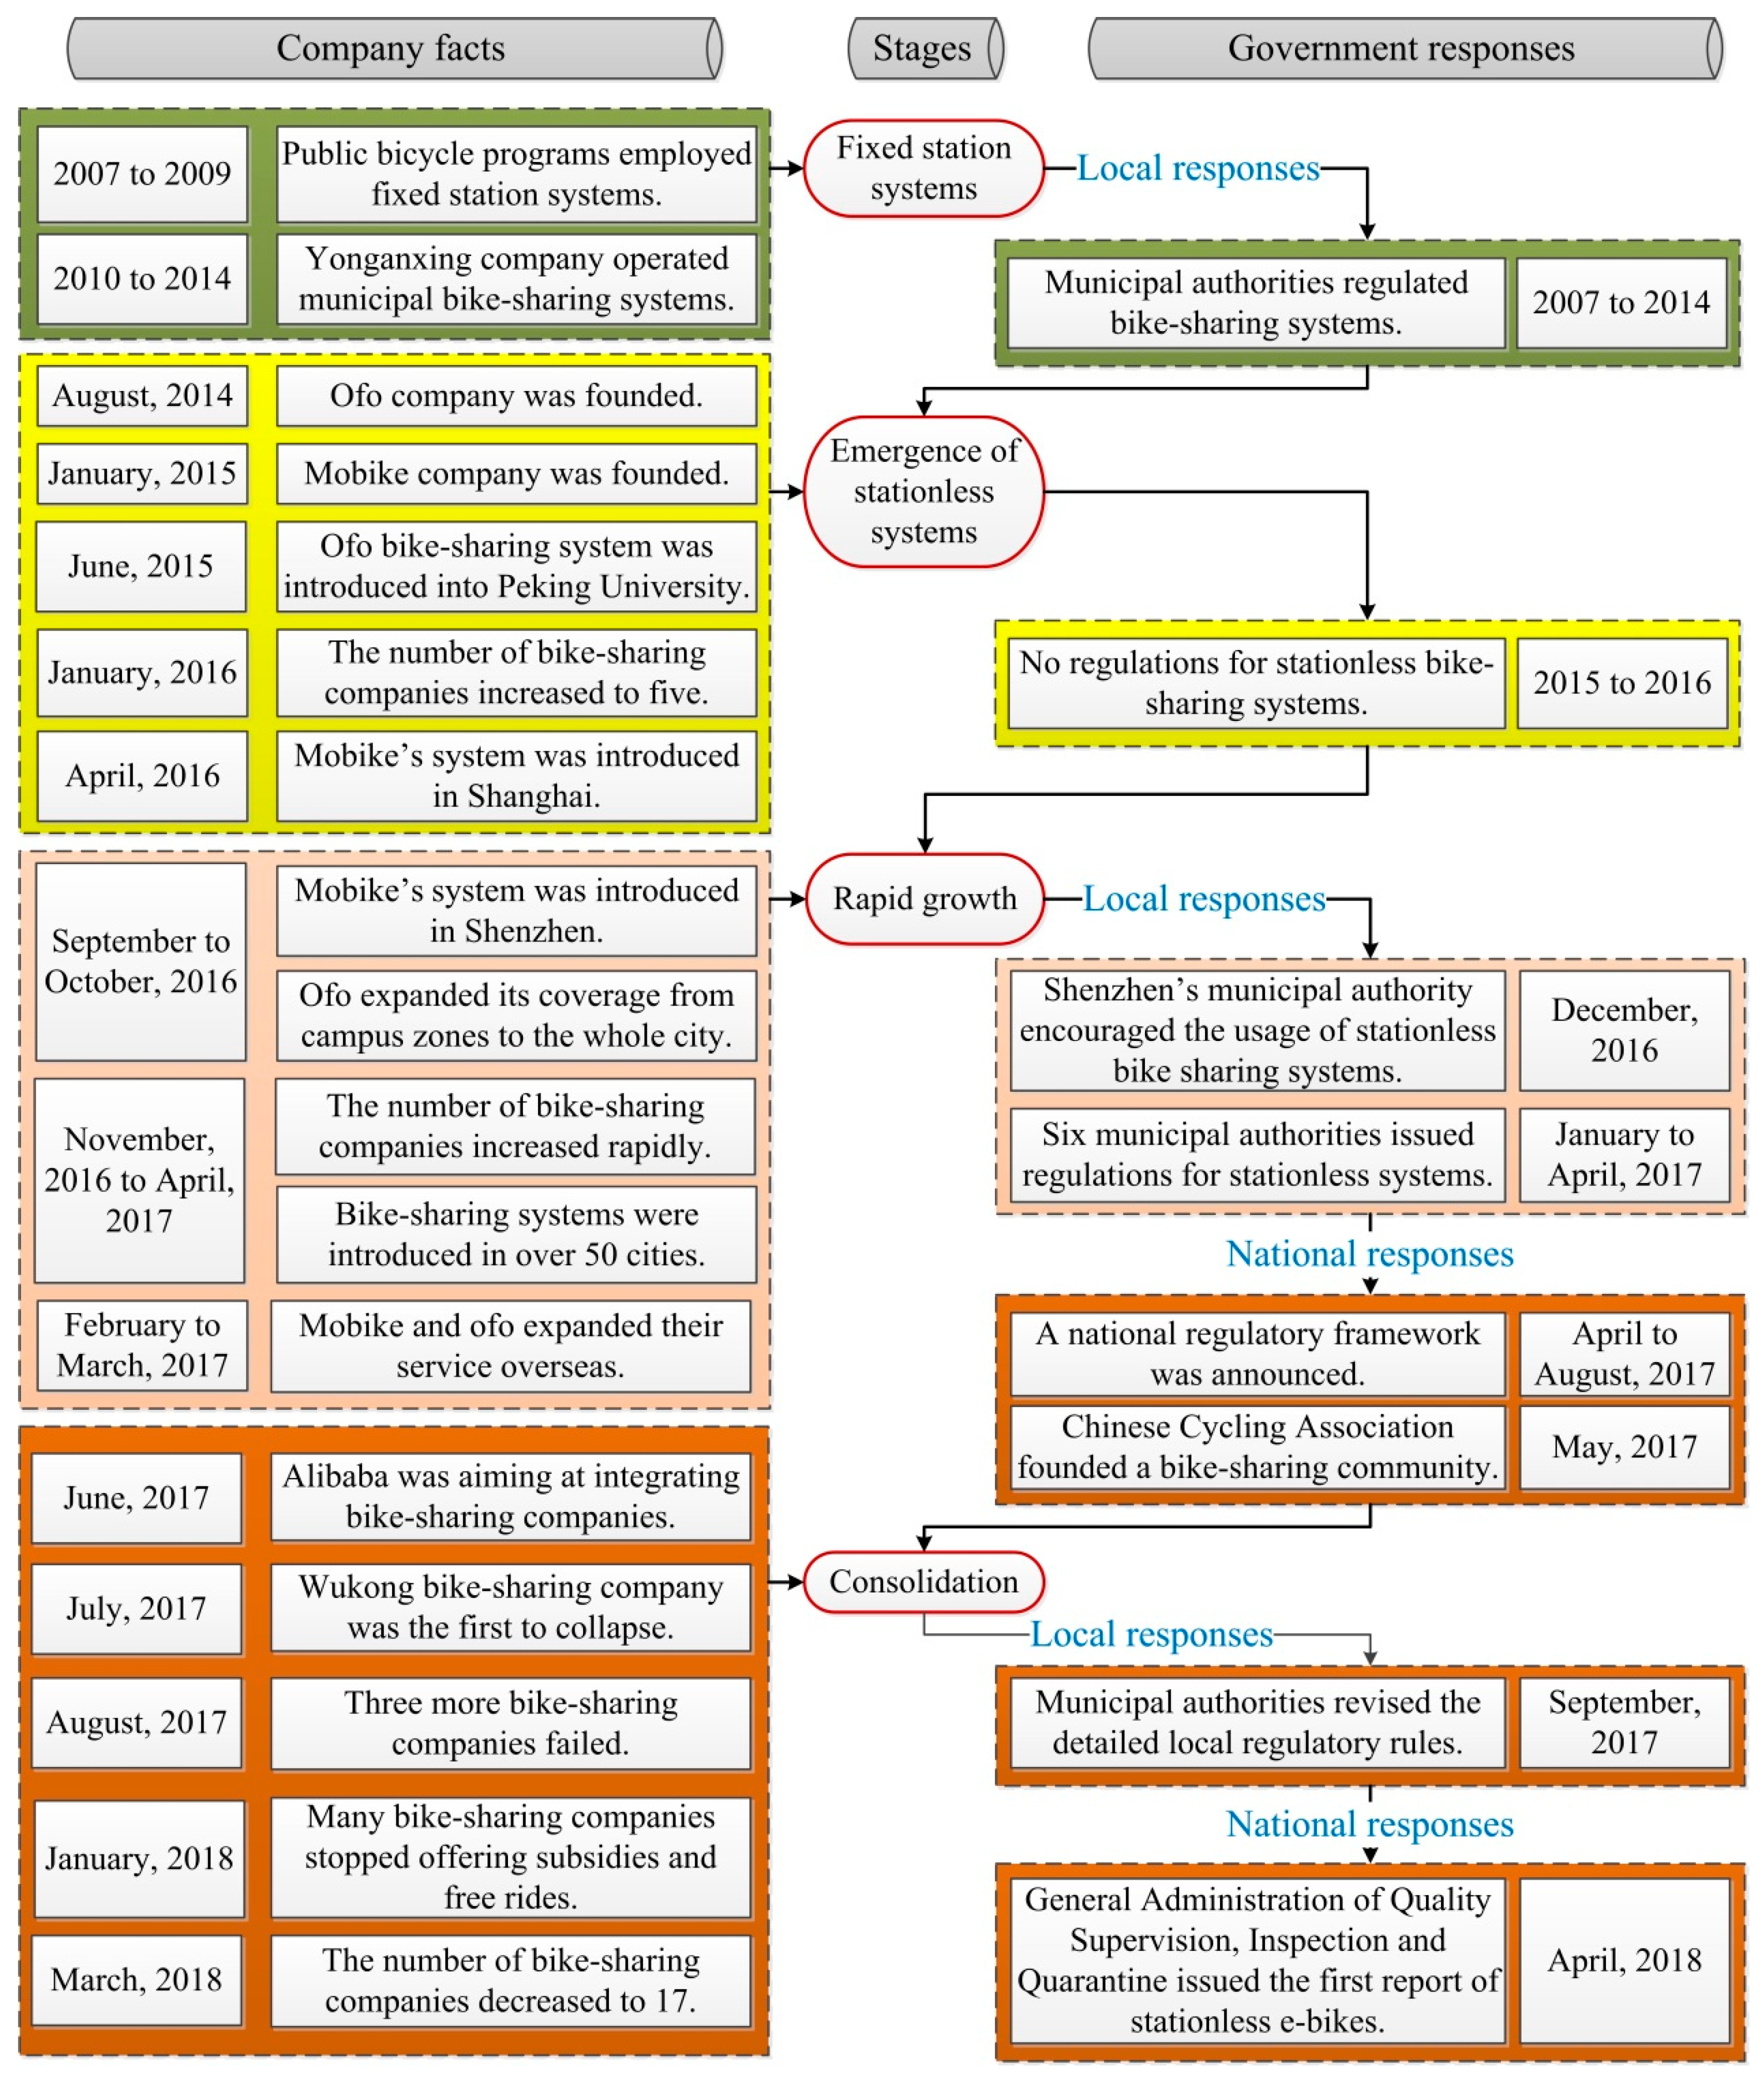
Figure 3 identifies the main stages in the industry’s evolution, mainly in terms of the number of companies and local and state authorities’ responses.

3.1. Launch of Bike-Sharing Systems

In China, public bike-sharing systems have been in use from 2007. At first, they were station-based systems governed by municipal governments. Municipal authorities were responsible for the distribution of bike stations, the maintenance of facilities and equipment and management, supported public bicycle programmes and even offered subsidies to bike-sharing companies.
From 2010 to 2014 some municipal governments authorized bike-sharing companies to operate and manage station-based systems. The launch of a new provider required municipal authorization, after which these services were self-financing. The providers made decisions as to the number and location of bike stations so as to minimize costs and maximize spatial coverage.
One of the largest bike-sharing companies was Yonganxing. In 2014, it provided services in over 200 mainly small and medium sized cities, proving that station-based systems could be successful in cities of these sizes [28]. In these cities, a finite number of stations could meet cycling demand. In large cities however, costs prevented companies from providing sufficient stations. Spatial coverage was inadequate, and riders had to accept a degree of inconvenience. To some extent, station-based systems are similar to other station-centred public transport systems. The result was that there was potential demand for on-demand bike-sharing services, particularly in large cities. In addition, it is worth noting that the station-based model usually involved a membership system. Users had to sign up with municipal authorities or agencies, get a smart card and pre-pay cycling fees. The membership system contributed to the emergence of some loyal users of station-based systems, while the presence of existing members in a locality contributed to membership growth [38]. However, station-based systems have a limited influence on shifts in travel behavior, and as indicated in Section 2.1, the popularity of station-based systems declined due to their fixed distribution.

3.2. Emergence of Station-Less Bike Systems

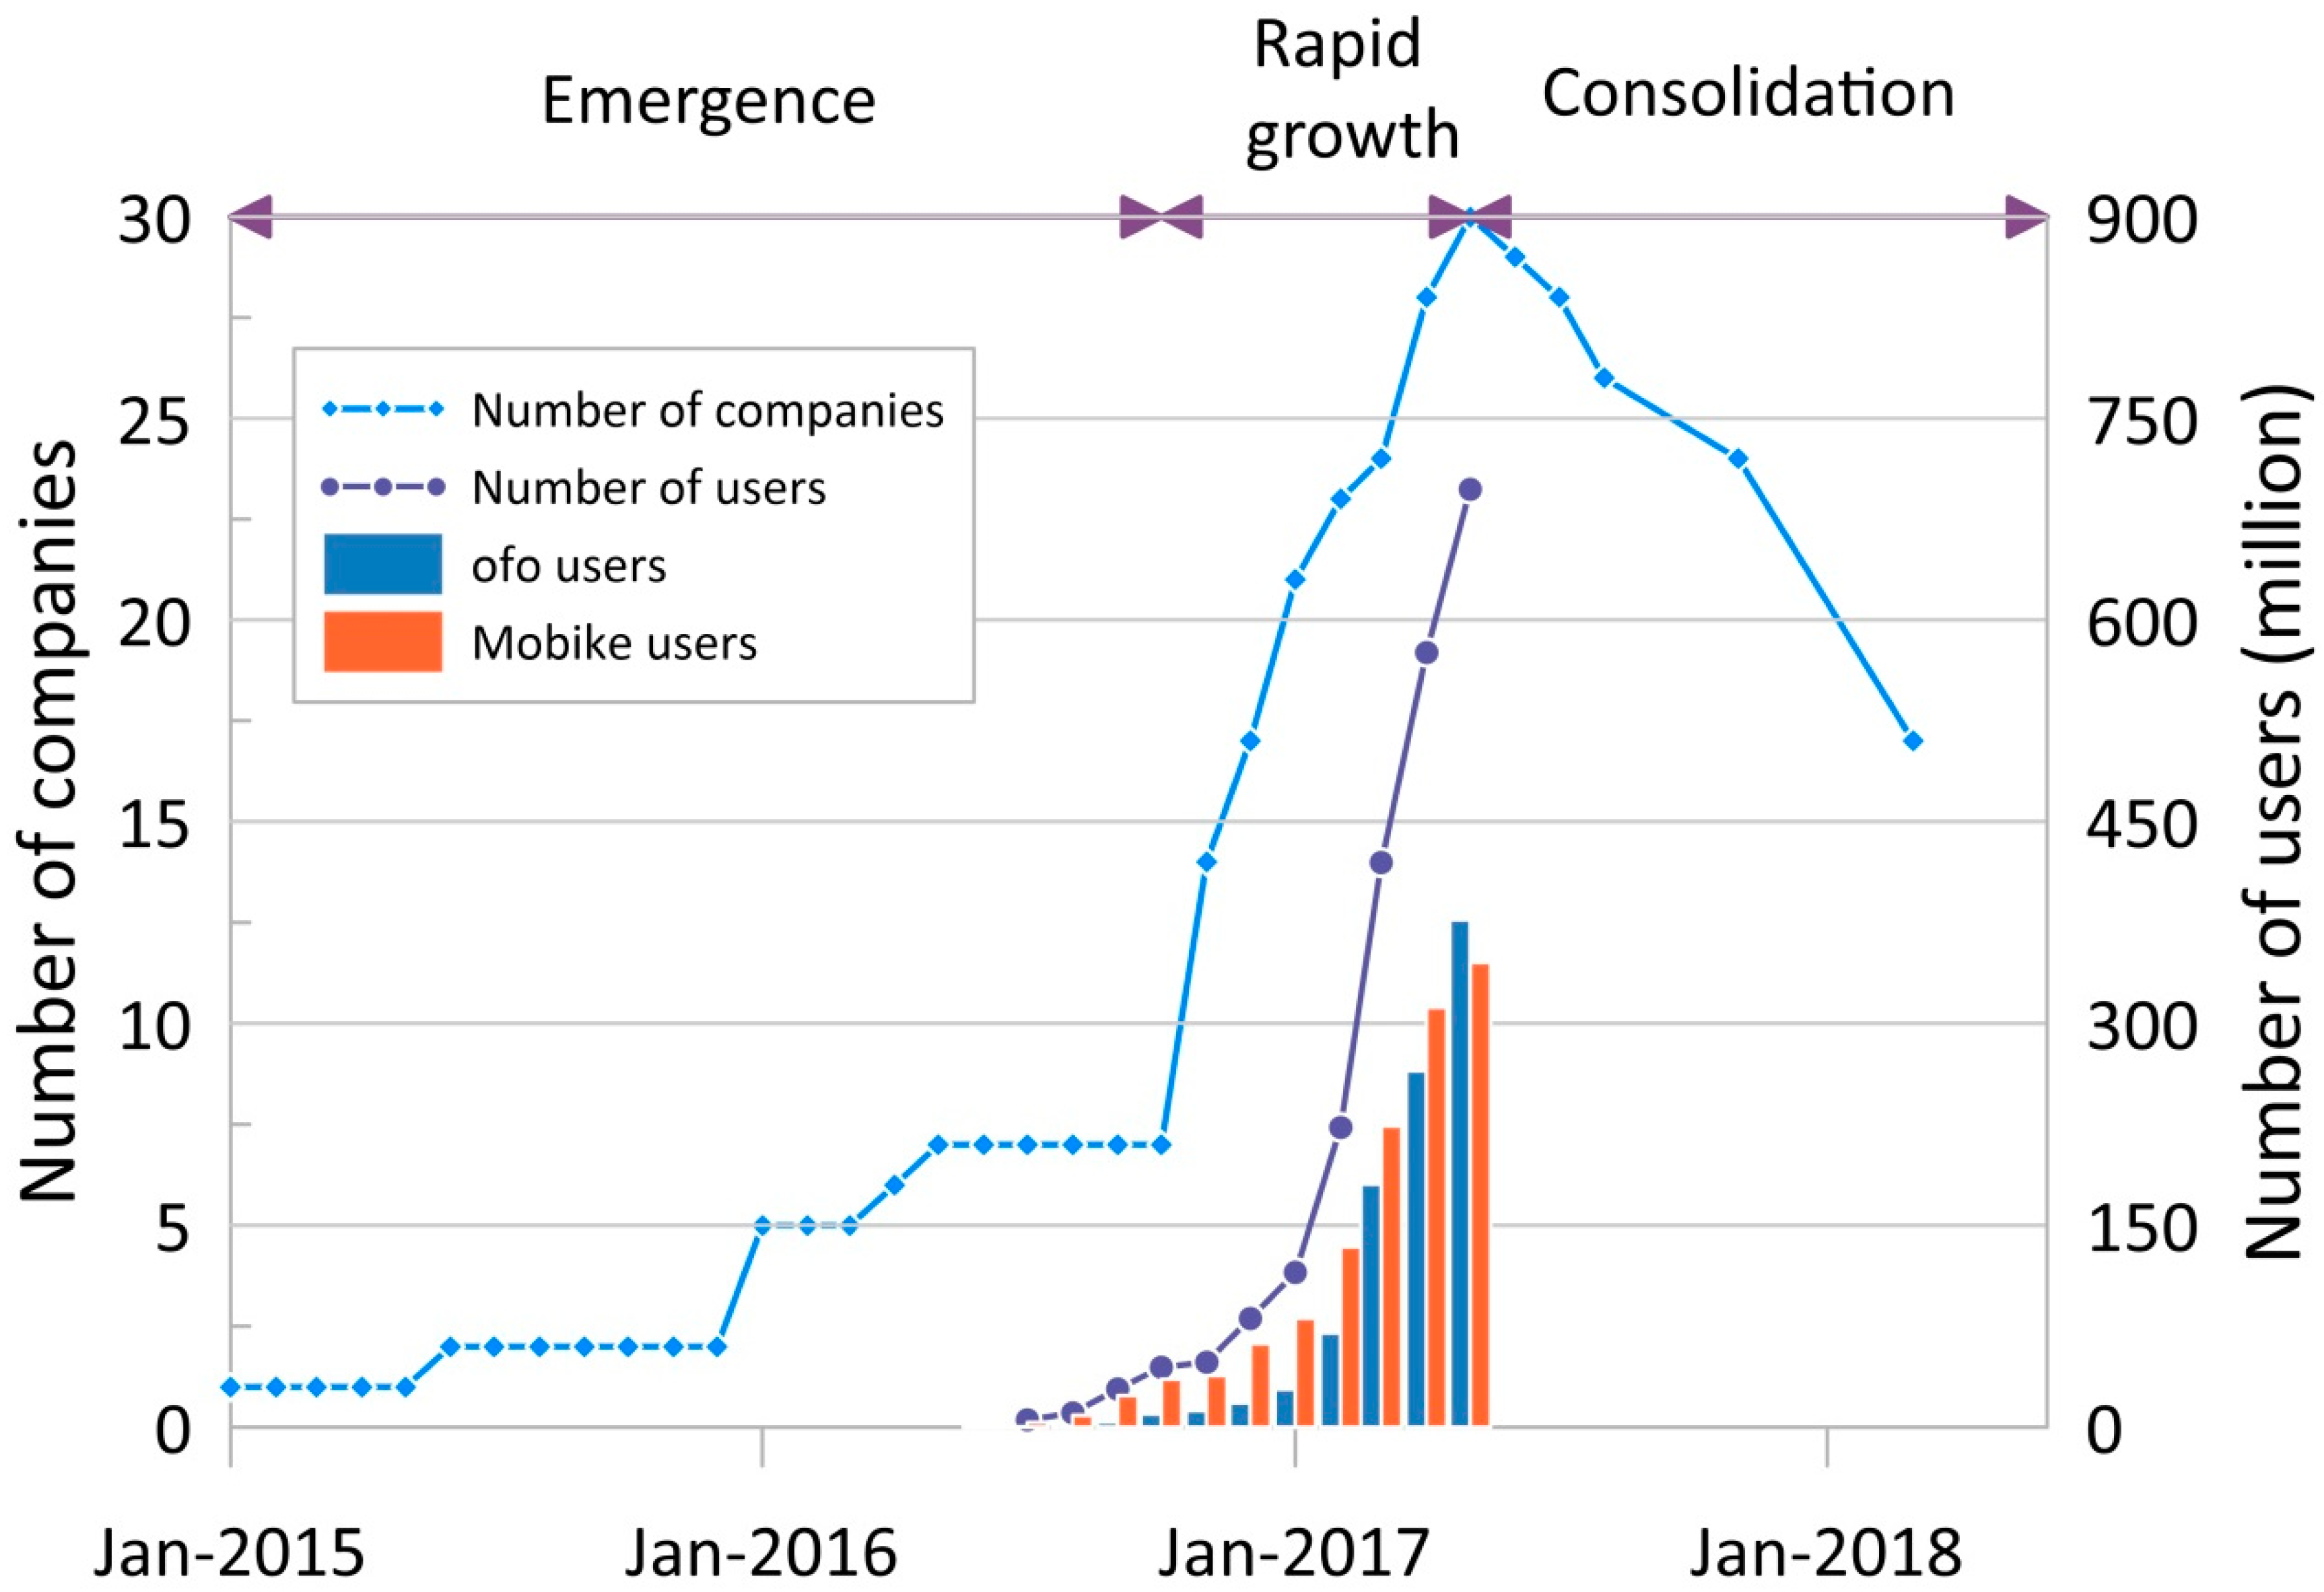
Station-less bike-sharing systems emerged in August 2014, following on the tails of station-based systems. In some cities, the emergence of station-less systems decreased the market occupancy of station-based systems or even caused their failure. The number of station-less bike-sharing companies reached five in January 2016 (Figure 4). There were three main reasons for the emergence of this new system namely traffic congestion, improvements in information technology, and the call for on-demand services.
Rising traffic congestion was a major issue in many mega-cities, leading some urban residents to switch from driving to public transportation and/or cycling. For short-distance trips, cycling is an alternative, saving both money and time. Generally speaking, users paid a deposit of 99 to 299 yuan (about 15 to 45 US dollars) when they signed up as a member of a bike-sharing system. Afterwards, the average cost of a cycling trip of less than one hour was not more than 1 yuan (about 15 US cents). When roads are gridlocked, cycling is faster than driving. For long-distance trips, public transportation is an alternative, but users still need bicycles to solve the first/last mile issue. A report showed that in 2016 average walking distance was about 0.94 km for a public transport trip [39], and average public transport travel time was between 40.9 min and 53.8 min. Assuming that average walking speed was 4 km/h, average walking time accounted for at least 26% of a door-to-door public transport trip. Replacing walking by cycling significantly reduces the overall duration of public transport journeys by speeding up the first/last mile of the journey.
Improvements in information technology ensured that users could find bicycles almost everywhere. Companies equipped their bicycles with digital locks and GPS devices. Each bike-sharing company used a cloud server to operate its station-less system. Meanwhile, the spatial coverage of the 4G network expanded, and the popularity of smartphones grew. In China, smartphone ownership increased from 55% in 2013 to 65% in 2015 and continued to grow [40]. The popularity of smartphones encouraged an application-based daily payments and service lifestyle. About 500 million smartphone users relied on application-based payments and were used to making payments by scanning QR codes.
Along with the call for on-demand services, the two aforementioned reasons explain the establishment of Ofo and Mobike. Ofo initially focused on campus cycling trips, starting operation in Peking University in June 2015 (Figure 3). Mobike aimed from the outset at providing for cycling trips throughout a city, starting in Shanghai in April 2016.
In the early stages, a decision had to be made as to whether a station-less bike-sharing system should be confined to a certain area. Apparently, Ofo employed this strategy, but Mobike did not. Ofo made this decision because universities along with industrial zones are highly populated areas with a high demand for cycling. In these areas, Ofo acquired a high market share in the early years, and then in 2017 exported this system overseas, initially targeting campuses in Cambridge, Massachusetts and Silicon Valley. However, the distribution of bicycles over a whole city can increase the number of users in the long term.
At this stage, the only relevant government document was the guidance for promoting green consumption, issued by China’s national development and reform commission (NDRC) in March 2016. It encouraged low-carbon travel modes, including walking, cycling, and public transport. Following the establishment of a stream of application-based transport services, the NDRC also supported car-sharing applications and public bike-sharing programmes to facilitate green transport.
At the municipal level, there were no direct regulatory responses to station-less bike-sharing systems. It is worth noting that early-phase local and national state attempts to regulate and even forbid ride-hailing applications were unsuccessful. When station-less systems entered the market, local and state authorities did not prohibit their emergence, letting the outcomes reflect the interaction of suppliers and users.

3.3. Stage of Rapid Growth

From October 2016 and May 2017 rapid bike-sharing market growth occurred (Figure 3; Figure 4). The number of registered users grew to over 80 million [2]. Companies that had previously operated station-based systems started to employ station-less systems.
In this period bike-sharing companies continuously increased the number of cities served. As Mobike’s system was working smoothly in Shanghai, between September and October 2016 it was introduced in Beijing, Shenzhen and Guangzhou. To compete with Mobike, Ofo expanded its services from campuses to the whole city. This expansion of service coverage made Ofo and Mobike the two largest companies. 
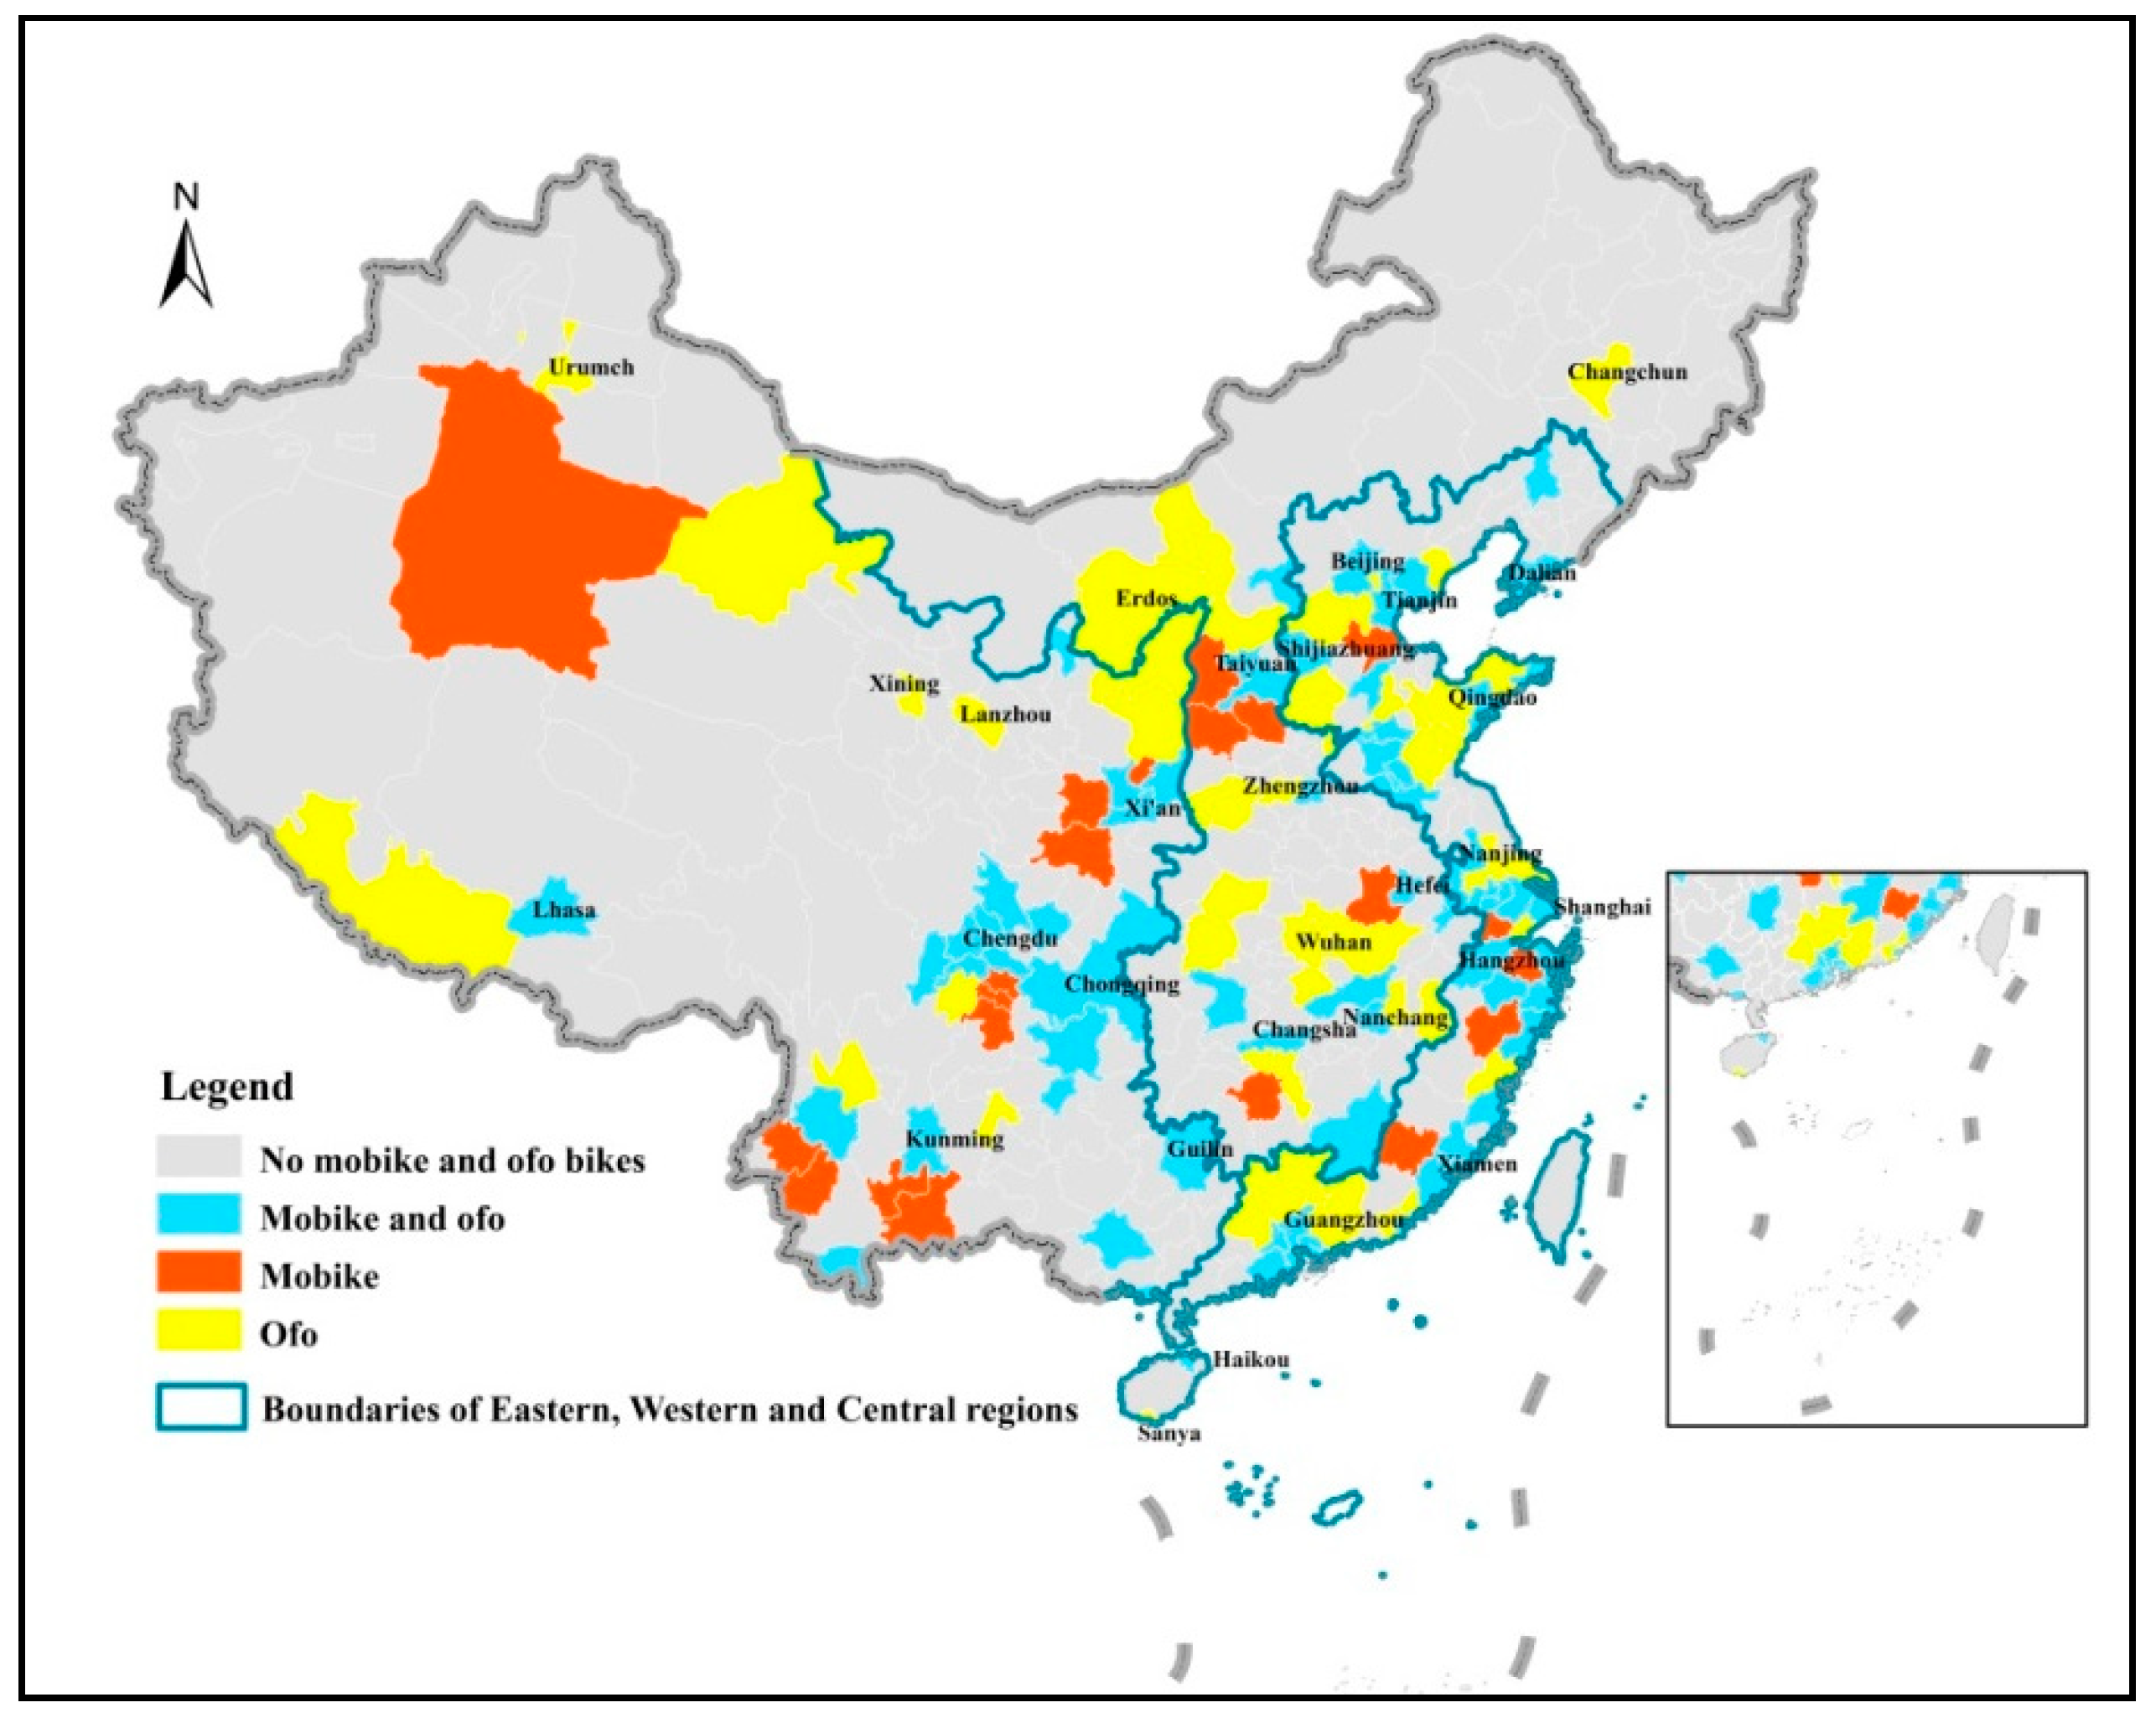
Figure 5 shows the cities they served in May 2017. In general, bike-sharing companies usually distributed bicycles in four mega cities, namely Beijing, Shanghai, Guangzhou and Shenzhen, subsequently adding provincial capitals. By May 2017, all provincial capitals had at least one station-less system.
At this stage the major issue was the rapid entry of new suppliers and intense competition, with the number of companies increasing from seven to over thirty, and with rapid increases in the number and distribution of bicycles in the cities they served. Other problems encountered in this phase were the increasing occupation of urban space by bicycles and the exacerbation of already serious parking disorder.
Local municipal authorities supported the rapid growth of station-less systems due to their contribution to a green lifestyle and improved public health. As shown in Figure 3, the first regulatory document was issued in Shenzhen in December 2016. This document sought to encourage and guide the development of station-less systems and clarified the responsibilities of related sectors. Primarily, the transportation and city management sectors were made responsible for the planning of bicycle lanes and parking zones. Municipal district and city management authorities were required to avoid disorderly bicycle parking, and the traffic police department was made responsible for dealing with traffic incidents involving shared bicycles.
Initially, many companies registered as internet rather than transport companies. The Shenzhen regulation, however, referred to bike-sharing companies, requiring the companies involved to register in both the commercial and transportation administration sectors. Under this regulation, the companies were required to report on their service coverage, number of bicycles, pricing arrangements and regulations relating to traffic accidents. Companies were advised to adopt advanced technology to monitor bicycle usage and ensure device quality. Companies were also made responsible for all aspects of cycling trips, including for example, accident insurance and security of the deposits paid by users.
Following Shenzhen, six other cities issued policies to regulate station-less systems, transforming the bilateral relationships between operators and users into trilateral relationships between supply, demand and government. These local regulations did not establish uniform overall standards governing station-less systems. For example, some local regulations included provisions relating to the risks attached to the deposits paid by riders, while others did not. Some local authorities set the minimum age of riders at 12 years, while others specified restrictions relating to their height.

3.4. Consolidation Stage

From May 2017, the bike-sharing market entered a supplier consolidation stage (see Figure 3 and Figure 4). One change related to market shares. During the period of rapid growth, the users registered with most companies increased continuously, with all of the companies focusing on marketing. In the consolidation stage, the relative competitiveness of large companies increased, as did their share of all users (see Figure 4). However, the overall speed of increase in user numbers slowed down. In these circumstances, small companies gradually withdrew from the market or collapsed, as in the case of Wukong (see Figure 3). These failures were mainly due to a loss of market share.
In general, one might expect the number of shared bikes to be correlated with the morphology and climate of cities. However, companies paid little attention to these factors and put as many bikes as possible onto the market. This strategy accelerated the failure of small companies. As Figure 4 shows, between June and September 2017 the number of bike-sharing companies decreased from 30 to 26, and it continued downwards to 17 April 2018. In addition, many bike-sharing companies adopted new strategies, and instead of offering subsidies and/or free rides to attract users and increase their competitiveness, removed them in an attempt to cover costs and increase their financial sustainability.
At this stage, authors of third-party applications offered to handle payments for the users of multiple bike-sharing applications. This service made payments much more convenient and helped integrate the market. For example, Alibaba decided to invest in, and integrate, the bike-sharing market. Its payment application, Alipay, offered access to various bike-sharing applications. The Alipay platform listed available bike-sharing applications for each city, although it excluded Mobike, as access to Mobike was provided by WeChat Pay, another third-party payment application.
At this stage, after a four-month period of consultation with companies and users, the Ministry of Transport designed a national regulatory framework. In May 2017, the Chinese cycling association established a separate sector for station-less bike-sharing companies. These steps were designed to establish national service norms for station-less systems and a national industrial community for bike-sharing systems. Then the General Administration of Quality Supervision, Inspection and Quarantine issued the first report on station-less bikes, indicating that 12.5% of station-less bikes fell short of quality standards, making them a safety risk for users.
Table 2 summarizes this discussion of supply and governance issues. As Shaheen and Martin argued, station-based and station-less systems should suit different sizes of cities [41]. Station-less bike-sharing systems have higher maintenance costs than station-based systems. Station-less systems provide greater flexibility with a large number of bicycles spread across a wide area, while station-based systems provide limited bicycles in a finite region. Consequently, station-less systems can solve the first/last mile issue, but cause parking disorder, whereas station-based systems have the opposite characteristics. Because of these characteristics, station-less systems are suitable in large and populous cities, while station-based systems work well in small- and medium-sized cities. A further advantage of station-less systems is that, given the wide availability of smart phones, it is easy to sign up. Joining station-based systems is more complicated. However, station-based systems can ensure the security of deposits, while users of station-less systems risk their deposits. For this reason, an analysis of user and non-user perspectives is necessary.

4. Methods

4.1. Quantitative Supply-Side Analysis

The rise of bike sharing systems raises new governance and management issues, of which one is the distribution of shared bikes. To investigate the strategies adopted in the phase of rapid growth, a quantitative analysis of the distribution of cycles was conducted for the two largest companies (i.e., Ofo and Mobike). Figure 5 portrays the spatial distribution of bike-sharing systems at a city level in the stage of rapid growth. Trends in the distribution will be discussed in Section 5.
In light of the literature survey and the examination of the phases in the development of the sector, a number of hypothesized drivers of this distribution were identified and operationalized by collecting data on a series of corresponding causal variables. More specifically, for 273 cities the presence or absence of a shared bicycle system was noted along with a number of infrastructural and socio-demographic characteristics. The size of the urban area, X1, and the length of the road system per inhabitant, X2, were considered as they might affect the number of potential users. Population density, X3, was measured as the existing literature suggests that high densities are conducive to the development of shared bicycle systems and the number of buses per 1000 people, X4 was computed to reflect the importance of alternative modes of public urban transport. The development of shared cycling is also likely to be shaped by the size of the potential market in income terms, and so data on urban gross domestic product (GDP) were collected. As the popularity of cycling may be correlated with the climate, terrain and physical geographical attributes of cities, data were also collected on the average latitude, X6, slope, X7, and ground elevation, X8. Table 3 reports summary statistics for the eight variables on which data were collected. To examine the role of these potential drivers, a logistic regression model was estimated, in which the binary dependent variable was set equal to one for cities served by bike-sharing systems and zero for the others, using as independent variables the eight variables X 1 ,   ,   X 8 , identified in this paragraph and reported in Table 3. Algebraically, the model can be expressed as follow:
Pr ( Y = 1 | X 1 , X 2 , , X 8 ) = F ( β 0 + β 1 · X 1 + β 2 · X 2 + + β 8 · X 8 ) ,
where Pr ( Y = 1 | X 1 , X 2 , , X 8 ) is the probability of a city having a station-less bike sharing system, X 1 ,   ,   X 8 are the eight hypothesized causal variables and β 1 ,   ,   β 8 are coefficients to be estimated with logistic regression. The results are reported in the next section.
Of these cities, 138 were served by one or two bike-sharing companies. The validity of this model depends upon the existence of a linear relationship between the logit (logarithm of the odds ratio) of the outcome and each independent variable. Before the regression analysis, the absence of multicollinearity amongst the independent variables was checked through inspection of a correlation matrix. The results are set out in the Section 5.

4.2. Demand-Side Questionnaire Survey

To examine further the demand side in the period of rapid growth, an online smartphone survey of attitudes towards, and the demand for, station-less bikes was conducted. The aims of the survey were to discover why and how people use station-less bike-sharing systems and to inform policy.
In the sampling process, respondents were randomly selected from users and non-users interested in commenting on station-less bike-sharing systems and in submitting completed questionnaires using their smartphones. The survey was conducted between 24 May and 1 June 2017, did not permit multiple submissions and protected the privacy of respondents. The survey was distributed via the social media portal ‘WeChat’. All respondents therefore owned a smartphone and were Wechat users. The questionnaire was divided into two parts. The first section contained compulsory questions about the socioeconomic characteristics of the respondent. The second included separate sets of questions for users and non-users.
In total 1110 questionnaires were completed and returned. Of the respondents, 648 were female and 462 were male, 54.9% lived in three mega cities (Beijing, Shanghai, and Guangzhou). According to the National Bureau of Statistics (http://www.stats.gov.cn/) data, in 2016 48.79% of the total population of China were female, and 65.6% were of working-age (between 16 and 60 years old). In the survey female respondents exceeded male respondents (Table 4) and were over-represented relative to their share of the Chinese population, perhaps because female smartphone users are more likely to complete surveys. The share of working-age respondents also exceeded their overall national population share, perhaps because smartphone users are more likely to be of working age.
The respondents were classified into a series of age groups. The first group comprised non-adults (≤18 years of age). This age band was selected because children under 12 are not allowed to ride bicycles on the urban road network in China, and because teenage smartphone ownership is relatively small. The fifth interval was set at more than 55 years as the use of smartphones is also relatively small for people in this age group. These two groups accounted for less than 5% of respondents (see Table 4). People aged 18 to 55 needed investigation in more detail as station-less bike-sharing systems first appeared on campuses, increasing the popularity of bike sharing amongst undergraduate and postgraduate students who are usually aged 18 to 25. Accordingly, this age group was distinguished. Respondents aged between 26 and 55 were divided into two more or less equal groups comprising, respectively, the 41.71% aged 26 to 35 years and the 35.5% aged 36 to 55 years. Meanwhile, the respondents were also divided into five income groups. The shares in each of the first four groups were relatively even. Few respondents had an income of more than 20,000 RMB per month.
To examine the socio-economic characteristics (gender, age and income) of users and non-users, a logistic regression model was estimated. The dependent variable was whether the respondent was a user or a non-user (i.e., respondent status). As shown in Table 4, gender was a binary independent variable, age and income were represented by categorical variables depicting the socio-economic background of users and non-users and a binary and a categorical variable were used to represent attitudes towards and the influence of bike-sharing. Algebraically, the model can be written as follows:
Pr ( B = 1 | A i ) = F ( α 0 + α i · A i ) ,   i = 1 , 2 , 3 .
where Pr ( B = 1 | A i ) is the probability that an individual was a user of a station-less bike sharing system. A 1 , A 2 , and A 3 denote the gender, age, and income of respondents all of which were considered to be potential determinants of use, and α 1 ,   ,   α 3 are coefficients to be estimated with logistic regression. The results are reported in the next section.

5. Results

5.1. Spatial Distribution by Regions

As the estimates in Table 5 show, by the end of 2016 the total urban population of cities with bike sharing systems was about 280 million, and bike sharing systems served 83.38% of Chinese cities. Bike sharing systems tended to be established in cities in eastern rather than in western or central China. Over 64% of cities in the east had bike sharing systems, and 37 of them had both Mobike and Ofo systems. In western and central regions, only 30% of cities were served by bike sharing systems. Most of the Chinese population, and most economic activity, is located in the eastern region, indicating bike sharing companies’ preference for investment in economically advanced and heavily populated areas.
Bike sharing systems were most common in eastern and southwestern cities. In the east, Mobike and Ofo tended to serve cities with more than three million inhabitants, while in western and central regions both were also usually present in large cities, in this case with more than two million inhabitants. In the case of gross domestic product (GDP) Mobike and Ofo were usually present in cities with a GDP of more than 106.97 billion (about 16.0 billion US dollars) in eastern China and more than 36 billion (about 5.38 billion US dollars) in central and western China. Cities in the northeast and northwest rarely had bike sharing systems (Figure 5). In these areas long and relatively cold winters make cycling less popular than in southern cities.

5.2. Influencing Elements on the Supply Side

The model results suggest that population density and GDP per capita are statistically significant determinants of the logit of the presence of the two main companies (Table 6). Of the geographical characteristics of the cities, only average latitude, which is related to the climatic conditions prevailing in different cities, was related to the log odds of the presence of the two main companies. The evidence suggests the presence of shared bicycles in cities may be somewhat indeterminate, as many potential influences such as buses per capita, urban road density, and the geography of cities did not significantly affect decisions to invest and were seemingly not considered by bike-sharing companies in making investment decisions. For example, one would expect cycling to be more common in cities in which there are few steep slopes and, therefore, with a lower ground elevation at the city centre, as higher ground elevation is correlated with the presence of steep terrain. And yet, the average ground elevation of cities that were served by bike-sharing companies was 474.95 m above sea level, which is higher than the overall average (716.8 m). A possible explanation is the overriding importance of population density and city size.
These results suggest that the presence and success of station-less systems depends on how cities’ public transport networks developed. For example, all cities with metro systems have station-less bike-sharing systems. In fact, bike-sharing companies deliberately locate bicycles around bus and metro stations. These findings are consistent with previous studies of the introduction of public bike-sharing programmes in cities [13,14,15] and are also suggestive of the role of station-less systems in solving the first/last mile issue.
As already mentioned, these companies also chose to establish services in cities with high GDP per capita and high population densities. Economic growth tends to increase the popularity of smartphones, which play a significant role in the usage of station-less systems. High population densities, as already mentioned in Section 3.2, tend to increase the demand for cycling and afford a sufficiently large user base.

5.3. Usage Patterns

Over 85% of all respondents were positive about the development of station-less systems, while about 70% of respondents had used them. Around 24% of respondents stated that these systems had no impact on their daily travel behaviour. This proportion corresponded more or less with the share of non-users.
In the case of the gender variable, the odds ratio of 1.2941 indicates that males are 29% more likely to use bike-sharing systems than females (Table 7). An odds ratio of 3.7405 for people between 18 and 55 years old indicates that people in this age group were 3.74 times more likely to use shared bicycles than those under 18 (the reference category). The odds ratio for the group between 26 and 35 years old was 2.3010 indicates that that people between 26 and 35 are 2.3 times more likely to use shared bicycles compared with the reference age group. The coefficient for the group aged between 36 and 55 years of age was not statistically significant. This estimate should in any case be set aside due to collinearity.
As far as income levels are concerned, only the coefficients for individuals with incomes between 5000 and 10,000 and 10,000 and 20,000 Yuan per month (approximately 750, 1500 and 3000 US dollars per month) were statistically significant. A possible conjecture is that bike-sharing systems have affected the travel behaviour of middle-to-high income groups. For people in modest income categories, the use of bike-sharing systems increased slightly as income increased, as the odds ratios rose from 1.1796 to 1.6925.
Table 6 shows that 146 respondents considered that station-less bike-sharing systems have a large impact on their daily travel behaviour. Of users, 61 (16.3%) used station-less systems every day (see Table 8). Almost one-half of users rode shared bicycles one to three times per week. Over 60% of users were therefore frequent riders.
Only 3.75% of users usually rode for more than 5 km. Station-less bike-journeys were usually of less than 5 km. More than 60% of users usually rode less than 2 km, probably reflecting the fact that 32.1% of users were riding to solve first/last mile issues, and 41.27% were using shared bikes to replace walking. These results are consistent with the findings of other studies [43]. It was found that 32.21% of users replaced short public transport journeys with cycling, which indicates a possible modal shift as suggested other authors have suggested [44]. Further, 47.09% of journeys were to work or school. As these trips were made in the morning and evening rush hours, avoiding congestion may have played a significant role. A decision to cycle rather than walk probably reflects a desire to reduce travel time. More than 40% of users selected leisure and entertainment as the purpose of their journeys. Station-less bike-sharing systems not only facilitate daily commuting but also play a role in relation to other activities, perhaps due to their flexibility and the places and times when they are available. As far as the use of bike sharing applications is concerned, the survey showed that around 70% of users had installed more than one application, with more than 60% using two or three (Table 8). This evidence may reflect relative costs, but it may also reflect the advantages of being able to use a number of services, of which some of the most important are increases in the speed and ease of finding an unused bicycle.
As Table 9 shows, Ofo and Mobike dominated the market. Over 70% of users rode their bicycles. More specifically, 244 (31.57%) users took advantage of both Ofo and Mobike services. Further, 15.65% of users just used the Ofo system, while 13.2% just used Mobike. The existence of roughly equal shares is indicative of relatively equal progress in a context of intense competition between Ofo and Mobike. With 220 users Bluegogo occupied the third position in terms of market share.

5.4. Use-Related Issues

The existence of (sometimes wilfully) damaged cycles has an important impact on availability, use and safety. In station-based systems, bicycles are checked at the stations, and usage is tracked. Station-less systems offer users much more freedom, making it more difficult for suppliers to monitor the condition of their bicycles and repair those that are damaged. This problem was relatively serious, with over 73% of users surveyed complaining that they had encountered broken bicycles (Table 8).
Secondly, one-half of the users have had difficulty in finding bicycles. One of the main reasons is that bike-sharing companies tend to put large numbers of bicycles in populous locations, such as at metro stations, in city centres, and at transportation hubs, locating insufficient cycles in other places. Generally, companies tend to focus on maximizing the number of users rather than maximizing service coverage.
Thirdly, 36.61% of users encountered improperly locked bicycles. With the station-less system, the locking process is a source of problems. Some users deliberately choose not to lock bicycles they have used, especially in some residential communities and on campuses. Subsequent users can then use the bike without payment. Some users lock bikes that they have used, that they consider to be in a good condition and that they want to reuse, remembering the password, or using their own locks. Companies have tried to address these problems by introducing automatic locking devices or by punishing users by deducting credit from their accounts.
The responses of non-users were interesting (Table 10) in that 31.75% indicated that they did not need to hire a shared bike, as they presumably either had their own bicycles or had no interest in cycling. Non-users also highlighted some of the concerns that one might expect from people who use other means of transport. The establishment of new, and changes in the relative importance of different, modes of transport apply new pressures on the provision and use of urban spaces including roads, cycle lanes, pavements and parking spaces. Although it is indeed ironic if some of the complainants are car drivers, whose vehicles occupy far more space than bicycles and are often parked illegally (including in cycle lanes and on pavements).
It is also interesting to compare the responses of users and non-users. Both users and non-users were mainly concerned with the waste of bicycles and parking disorder, although they encountered these problems in different ways. The existence of high shares of respondents identifying these issues may reflect an excess supply of cycles, especially in the early entry phase, characterized by the launch of new companies and intense competition. The survey results showed that 21.99% of users and 34.12% of non-users complained that bicycles had made improper use of urban space, although this is a problem that also involves private means of transport such as motorcycles, cars and also pedestrians. In the case of cycling, some traffic regulations have not yet been revised, although establishing a regulation and enforcing it are two different things. A substantial 28.72% of users and 36.8% of non-users were concerned about security issues. A high share of non-users finally indicated that they had no need for station-less bikes.

6. Conclusions and Discussion

Increased cycling contributes to sustainable urban development, improved public health and the alleviation of traffic congestion. However, urban efficiency and equity, and the necessary regulation and governance of bike-sharing companies and users require an understanding of the utility of shared bicycles and the reasons and issues behind their development. This paper contributes to the understanding of these issues in the following ways.
First, this paper reviewed the rapid growth of bike-sharing systems in China and explored the underlying relationships between suppliers, users and government agencies. An analysis of stages in the development of smartphone-based station-less bike-sharing in China identified changes in supplier strategies and government-industry relations through an initial phase of rapid increases in firm entry and intense competition, and a subsequent phase of supplier consolidation (see Section 3).
Second, the attitudes of, and usage by, different categories of user and the attitudes of non-users were examined. Generally speaking, users were mainly middle-income people aged between 18 and 25 years of age (Section 5.3). A result of this survey was also the observation of complementarities between station-less shared bikes and other modes of transport, as well as conflicts over the use of urban space and a number of problems including improper use, an oversupply of bicycles in some places and an absence in others (Section 5.4).
The analysis has a number of policy implications. Identification of advantages and problems is useful for urban planners and decision-makers and for the application-based companies providing shared-bike services by combining information technology and cycling expertise. These companies need to develop their models of transport demand management, and improve the distribution and redistribution of cycles, so as to meet demand, drawing on real-time information to provide good quality, properly maintained and safe bicycles at the right time and in the right place. To meet different types of cycle demand, these companies should also design different categories of bicycles. Municipal authorities can play an important role by designing and enforcing regulations and monitoring mobility, so as to encourage more options for bike-sharing [45]. At the city level, transport agencies should provide cycling infrastructure, enact and enforce norms, including service standards for bike-sharing companies, rules of bicycle usage, and traffic, parking and accident regulations. In each city, urban district administrative agencies are responsible for the planning of parking zones and the provision of cycle lanes, and must also supervise and enforce parking regulations with the cooperation of urban management agencies and traffic police. The traffic police must also seek to increase road safety and deal promptly with traffic accidents involving cycling trips. More importantly, advanced technology should be employed at the municipal level to provide real-time supervision of the number and use of bicycles and the interaction of cycles with other means of transport. Local authorities need to design their service norms according to their population sizes, public transport service levels and economic growth.
As station-less bike-sharing systems develop, more work is required to examine its relationships with regulatory frameworks and the conditions prevailing in particular cities. Also, vitally important is an exploration of cycling’s relationships of complementarity and competition with other modes of transport with a view to improving environmental quality and sustainable mobility.
As for this research, a number of limitations point to the need for further investigations. Surveys should be conducted in more cities, cover more companies, and provide answers to further questions relating to the case for subsidization, the impact on other modes of transport, the duration and nature of cycle trips, the dynamics of cycle distribution and its impact on usage, comparative supplier performance and the impact of local climate, meteorological, traffic and other conditions on shared cycle use. Shared cycles are a major urban transport innovation with significant potential positive impacts on urban mobility and environmental quality. This research represents an early step in the investigation of a phenomenon that may well radically reshape future urban mobility.

Author Contributions

J.W. and J.H. designed research; J.W. and J.H. analyzed data; J.H. and M.D. performed research; and J.W., J.H. and M.D. wrote the paper.

Funding

This research was financially supported by the Strategic Priority Research Program of the Chinese Academy of Sciences (No. XDA19040402), the National Natural Science Foundation of China (No. 41701132), and the Chinese Academy of Sciences Grant No. 2017VP01.

Acknowledgments

The authors wish to thank Lili Jiang who helped collect part of data.

Conflicts of Interest

The authors declare no conflict of interest.

References

  1. Li, Z.; Wang, W.; Yang, C.; Ding, H. Bicycle mode share in China: A city-level analysis of long term trends. Transportation 2017, 44, 773–788. [Google Scholar] [CrossRef]
  2. AVIC Securities. A Multidirectional Campaign in the Station-Less Bike-Sharing Market. 28 August 2017. Available online: http://b2b.toocle.com/detail--6415809.html (accessed on 9 September 2018). (In Chinese).
  3. Ma, Y.; Lan, J.; Thornton, T.; Mangalagiu, D.; Zhu, D. Challenges of Collaborative Governance in the Sharing Economy: The case of free-floating bike sharing in Shanghai. J. Clean. Prod. 2018, 197, 356–365. [Google Scholar] [CrossRef]
  4. Owyang, J.; Tran, C.; Silva, C. The Collaborative Economy; Altimeter: Pasadena, CA, USA, 2013. [Google Scholar]
  5. Ukolov, V.F.; Solomatin, A.V.; Solomatin, Y.V.; Chernikov, S.U.; Ukolov, A.V. Food-sharing economy pattern comparison in UK and Russian markets. Int. Bus. Manag. 2016, 10, 4268–4282. [Google Scholar]
  6. Palos-Sanchez, P.R.; Correia, M.B. The collaborative economy based analysis of demand: Study of airbnb case in spain and portugal. J. Theor. Appl. Electron. Commer. Res. 2018, 13, 85–98. [Google Scholar] [CrossRef]
  7. Chen, S.Y. Green helpfulness or fun? Influences of green perceived value on the green loyalty of users and non-users of public bikes. Transp. Policy 2016, 47, 149–159. [Google Scholar] [CrossRef]
  8. DeMaio, P. Bike-sharing: History, impacts, models of provision, and future. J. Public Transp. 2009, 12, 3. [Google Scholar] [CrossRef]
  9. Shaheen, S.; Guzman, S.; Zhang, H. Bikesharing in Europe, the Americas, and Asia: Past, present, and future. Transp. Res. Rec. J. Transp. Res. Board 2010, 2143, 159–167. [Google Scholar] [CrossRef]
  10. Shaheen, S.; Martin, E.; Cohen, A. Public bikesharing and modal shift behavior: A comparative study of early bikesharing systems in North America. Int. J. Transp. 2013, 1, 35–54. [Google Scholar] [CrossRef]
  11. Parkes, S.D.; Marsden, G.; Shaheen, S.A.; Cohen, A.P. Understanding the diffusion of public bikesharing systems: Evidence from Europe and North America. J. Transp. Geogr. 2013, 31, 94–103. [Google Scholar] [CrossRef]
  12. Midgley, P. Bicycle-Sharing Schemes: Enhancing Sustainable Mobility in Urban Areas; Department of Economic and Social Affairs: New York, NY, USA, 2011; pp. 1–12. Available online: http://www.un.org/esa/dsd/resources/res_pdfs/csd-19/BackgroundPaper8-P.Midgley-Bicycle.pdf (accessed on 6 September 2017).
  13. Martens, K. Promoting bike-and-ride: The Dutch experience. Transp. Res. Part A Policy Pract. 2007, 41, 326–338. [Google Scholar] [CrossRef]
  14. DeMaio, P.; Gifford, J. Will smart bikes succeed as public transportation in the United States? J. Public Transp. 2004, 7, 1. [Google Scholar] [CrossRef]
  15. Pucher, J.; Buehler, R. Making cycling irresistible: Lessons from the Netherlands, Denmark and Germany. Transp. Rev. 2008, 28, 495–528. [Google Scholar] [CrossRef]
  16. Nair, R.; Miller-Hooks, E.; Hampshire, R.C.; Bušić, A. Large-scale vehicle sharing systems: Analysis of Vélib. Int. J. Sustain. Transp. 2013, 7, 85–106. [Google Scholar] [CrossRef]
  17. García-Palomares, J.C.; Gutiérrez, J.; Latorre, M. Optimizing the location of stations in bike-sharing programs: A GIS approach. Appl. Geogr. 2012, 35, 235–246. [Google Scholar] [CrossRef]
  18. Ho, S.C.; Szeto, W.Y. Solving a static repositioning problem in bike-sharing systems using iterated tabu search. Transp. Res. Part E Logist. Transp. Rev. 2014, 69, 180–198. [Google Scholar] [CrossRef] [Green Version]
  19. Erdoğan, G.; Laporte, G.; Calvo, R.W. The static bicycle relocation problem with demand intervals. Eur. J. Oper. Res. 2014, 238, 451–457. [Google Scholar] [CrossRef] [Green Version]
  20. Fricker, C.; Gast, N. Incentives and redistribution in homogeneous bike-sharing systems with stations of finite capacity. Eur. J. Transp. Logist. 2016, 5, 261–291. [Google Scholar] [CrossRef]
  21. O’brien, O.; Cheshire, J.; Batty, M. Mining bicycle sharing data for generating insights into sustainable transport systems. J. Transp. Geogr. 2014, 34, 262–273. [Google Scholar] [CrossRef]
  22. Schoner, J.E.; Levinson, D.M. The missing link: Bicycle infrastructure networks and ridership in 74 US cities. Transportation 2014, 41, 1187–1204. [Google Scholar] [CrossRef]
  23. Vogel, M.; Hamon, R.; Lozenguez, G.; Merchez, L.; Abry, P.; Barnier, J.; Robardet, C. From bicycle sharing system movements to users: A typology of Vélo’v cyclists in Lyon based on large-scale behavioural dataset. J. Transp. Geogr. 2014, 41, 280–291. [Google Scholar] [CrossRef]
  24. Sarkar, A.; Lathia, N.; Mascolo, C. Comparing cities’ cycling patterns using online shared bicycle maps. Transportation 2015, 42, 541–559. [Google Scholar] [CrossRef]
  25. Audikana, A.; Ravalet, E.; Baranger, V.; Kaufmann, V. Implementing bikesharing systems in small cities: Evidence from the Swiss experience. Transp. Policy 2017, 55, 18–28. [Google Scholar] [CrossRef]
  26. Faghih-Imani, A.; Eluru, N. Analysing bicycle-sharing system user destination choice preferences: Chicago’s Divvy system. J. Transp. Geogr. 2016, 44, 53–64. [Google Scholar] [CrossRef]
  27. De Chardon, C.M.; Caruso, G.; Thomas, I. Bike-share rebalancing strategies, patterns, and purpose. J. Transp. Geogr. 2016, 55, 22–39. [Google Scholar] [CrossRef]
  28. Caulfield, B.; O’Mahony, M.; Brazil, W.; Weldon, P. Examining usage patterns of a bike-sharing scheme in a medium sized city. Transp. Res. Part A Policy Pract. 2017, 100, 152–161. [Google Scholar] [CrossRef] [Green Version]
  29. Faghih-Imani, A.; Anowar, S.; Miller, E.J.; Eluru, N. Hail a cab or ride a bike? A travel time comparison of taxi and bicycle-sharing systems in New York City. Transp. Res. Part A Policy Pract. 2017, 101, 11–21. [Google Scholar] [CrossRef]
  30. Behrendt, F. Why cycling matters for Smart Cities. Internet of Bicycles for Intelligent Transport. J. Transp. Geogr. 2016, 56, 157–164. [Google Scholar] [CrossRef]
  31. Pal, A.; Zhang, Y. Free-floating bike sharing: Solving real-life large-scale static rebalancing problems. Transp. Res. Part C Emerg. Technol. 2017, 80, 92–116. [Google Scholar] [CrossRef]
  32. Romanillos, G.; Zaltz Austwick, M.; Ettema, D.; De Kruijf, J. Big data and cycling. Transport Rev. 2015, 36, 114–133. [Google Scholar] [CrossRef]
  33. Piwek, L.; Joinson, A.; Morvan, J. The use of self-monitoring solutions amongst cyclists: An online survey and empirical study. Transp. Res. Part A Policy Pract. 2015, 77, 126–136. [Google Scholar] [CrossRef]
  34. Zhao, P.; Li, S. Bicycle-metro integration in a growing city: The determinants of cycling as a transfer mode in metro station areas in Beijing. Transp. Res. Part A Policy Pract. 2017, 99, 46–60. [Google Scholar] [CrossRef]
  35. Zhang, Y.; Lin, D.; Mi, Z. Electric fence planning for dockless bike-sharing services. J. Clean. Prod. 2019, 206, 383–393. [Google Scholar] [CrossRef]
  36. Liu, T.; Ceder, A.A. Analysis of a new public-transport-service concept: Customized bus in China. Transp. Policy 2015, 39, 63–76. [Google Scholar] [CrossRef]
  37. Flores, O.; Rayle, L. How cities use regulation for innovation: The case of Uber, Lyft and Sidecar in San Francisco. Transp. Res. Procedia 2017, 25, 3760–3772. [Google Scholar] [CrossRef]
  38. Schoner, J.; Lindsey, G.; Levinson, D. Is bikesharing contagious? Modeling its effects on system membership and general population cycling. Transp. Res. Rec. J. Transp. Res. Board 2016, 2587, 125–132. [Google Scholar] [CrossRef]
  39. Amap. Traffic Analysis for Major Cities in China: 2016. 2017. Available online: http://report.amap.com/download.do (accessed on 10 September 2018). (In Chinese).
  40. Poushter, J. Smartphone ownership and internet usage continues to climb in emerging economies. Pew Res. Center 2016, 22. Available online: http://s1.pulso.cl/wp-content/uploads/2016/02/2258581.pdf (accessed on 11 September 2018).
  41. Shaheen, S.; Martin, E. Unraveling the Modal Impacts of Bikesharing. 2015. Available online: https://www.accessmagazine.org/wp-content/uploads/sites/7/2015/12/access47.shaheen.pdf (accessed on 13 September 2018).
  42. Ifeng. Mobike’s Coverage Reached 130 Cities Worldwide. 2017. Available online: http://news.ifeng.com/a/20170628/51333276_0.shtml (accessed on 10 September 2018). (In Chinese).
  43. Borecki, N.; Buck, D.; Chung, P.; Happ, P.; Kushner, N.; Maher, T.; Rawls, B.; Reyes, P.; Steenhoek, M.; Studhalter, C.; Watkins, A.; Buehler, R. Virginia Tech Capital Bikeshare Study. 2012. Available online: https://ralphbu.files.wordpress.com/2012/01/vt-bike-share-study-final3.pdf (accessed on 28 September 2018).
  44. Shaheen, S.A.; Martin, E.W.; Cohen, A.P.; Chan, N.D.; Pogodzinski, M. Public Bikesharing in North America During a Period of Rapid Expansion: Understanding Business Models, Industry Trends & User Impacts; MTI Report; MTI Ltd.: Tokyo, Japan, 2014; pp. 12–29. [Google Scholar]
  45. Gleason, R.; Miskimins, L. Exploring Bicycle Options for Federal Lands: Bike Sharing, Rentals and Employee Fleets; No. FHWA-WFL/TD-12-001; Federal Highway Administration: Washington, DC, USA, 2012.
Figure 1. Station-less bike equipment and devices.
Sustainability 11 01539 g001
Figure 2. The process of renting, riding and returning a station-less bike.
Sustainability 11 01539 g002
Figure 3. Company development and regulatory responses.
Sustainability 11 01539 g003
Figure 4. The number of bike-sharing companies and users in China. Note that users registered with more than one bike-sharing application were only counted once, and the number of users only dates back to the period of rapid growth. The number of Ofo and Mobike users since July 2017 is not available.
Sustainability 11 01539 g004
Figure 5. Spatial distributions of the two main bike sharing systems in China. (Data sources: Mobike’s data was sourced from ifeng [42], and Ofo data was sourced from the Alipay platform).
Sustainability 11 01539 g005
Table 1. Recent studies on bike-sharing systems worldwide.
AuthorsStudy AreaTypeRemarks
Parkes et al., 201337 cities in North America, EuropeDiffusion of innovation
O’Brien et al., 201438 cities worldwideSystem utility
Schoner and Levinson, 201474 US citiesTravel behaviour
Vogel et al., 2014Lyon, FranceCycling patterns
Sarkar et al., 201510 cities worldwideCycling patterns
Faghih-Imani and Eluru, 2015Chicago, USBike usage
Behrendt, 2016Brighton, UKSmart mobility
De Chardon et al., 20169 cities in North America, EuropeCycling patterns
Audikana et al., 201718 Swiss citiesBike-sharing implement
Caulfield, 2017Cork, IrelandBike usage
Pal and Zhang, 2017Tampa and Chicago, USOperation research
Zhao and Li, 2017Beijing, ChinaBike-sharing implement
Zhang et al., 2019Shanghai, ChinaOperation research
○ indicates station-based systems, and ● indicates station-less systems.
Table 2. Comparison of public bicycle programmes.
Station-BasedStation-Less
Suitable urban sizeSmall- and medium-size citiesLarge and populous cities
Maintenance costsLowHigh
UtilityFixed points to rent and returnFlexible
Re-distributionNecessaryNecessary
First/last mile issueExistAlmost solved
Parking disorderAlmost noneYes
Sign-up processComplicatedEasy
DepositYesSome are free
Deposit risksLowHigh
Table 3. Infrastructural, socio-demographic and geographical attributes of 273 Chinese cities.
MeanStd. Dev.MinMax
Urban area (sq.km)1971.262869.2481429,518
Population Density (persons/sq.km)832.4311707.712913.854329.9
Number of buses per 10,000 persons9.67340715.251951.04225.5
Urban road area per person (sq.m per person)13.496089.6398561.24105.02
GDP per capita (yuan)63,019.3732,618.7515,356195,792
Average latitude33.036.6718.4549.64
Average slope6.397.88040.08
Average ground elevation (meters)467.01615.6704731
(Data source: Chinese city statistical yearbook, 2016).
Table 4. Socio-economic attributes and attitudes of respondents to station-less bike-sharing systems.
CategoryN (%)Typology of Variable
Respondent statusUser773 (69.64)Binary
Non-user337 (30.36)
GenderFemale648 (58.38)Binary
Male462 (41.62)
AgeUnder 186 (0.54)Categorical
18–25205 (18.47)
18–25205 (18.47)
26–35463 (41.71)
36–55394 (35.50)
Beyond 5542 (3.78)
Income (RMB per month)<2000160 (14.41)Categorical
2000–5000219 (19.73)
5000–10,000394 (35.50)
10,000–20,000272 (24.50)
>20,00065 (5.86)
Attitude to bike-sharingPositive963 (86.76)Binary
Negative147 (13.24)
Influence on daily travel1 almost none270 (24.32)Categorical
2 only a little380 (34.23)
3 medium314 (28.29)
4 large146 (13.15)
Table 5. Characteristics of the spatial distribution of bike sharing systems.
EasternCentralWesternTotal
Mobike and OfoCities37121867
Average GDP ( 10 9 Yuan)539.88179.04209.07386.38
Average urban population ( 10 6 persons)349.27170.93279.25298.52
Only MobikeCities551121
Average GDP ( 10 9 Yuan)106.9736.0735.6552.73
Average urban population ( 10 6 persons)10.529.467.318.59
Only OfoCities24211156
Average GDP ( 10 9 Yuan)124.65111.9055.11106.21
Average urban population ( 10 6 persons)14.3511.056.6111.60
NoneCities378469190
Average GDP ( 10 9 Yuan)62.7541.1911.3834.56
Average urban population ( 10 6 persons)9.97.803.226.54
Table 6. Regression results.
CoefficientStd. Errort
Urban area (sq.km)8.76 × 10−60.00005510.16
Population Density (persons/sq.km)0.00047950.00021622.22 **
Number of buses per 10,000 persons0.05101090.0320211.68
Urban road area per person (sq.metres per person)0.00900220.0212610.43
GDP per capita (yuan)0.00002135.9 × 10−63.61 ***
Latitude−0.058440.0190−3.07 **
Average slope−0.0051820.01543−0.34
Average ground evaluation (meters)−0.00004620.230.82
Note that ** indicates p < 0.05 and *** indicates p < 0.01 .
Table 7. Logistic (logit) regression model results.
CoefficientZOdds Ratio
Gender (Female)Control group
Gender (Male)0.25782.19 *1.2941
Age (<18)Control group
Age (18–25)1.31923.52 ***3.7405
Age (26–35)0.83722.53 **2.3010
Age (36–55)0.44971.351.5679
Age (>55)Omitted
Income (<2000)Control group
Income (2000–5000)−0.0208−0.080.9794
Income (5000–10,000)0.16522.16 **1.1796
Income (10,000–20,000)0.52621.83 *1.6925
Income (>20,000)0.58611.531.7970
obs1110
* p < 0.1, ** p < 0.05, *** p < 0.01.
Table 8. Responses of users (N = 773).
VariablesCategoryN (%)
Frequency of useEvery day126 (16.30)
One to three times per week343 (44.37)
Five to ten times per month124 (16.04)
Less than five times per month180 (23.29)
Distance travelled<2 km471 (60.93)
2 to 5 km273 (35.32)
>5 km29 (3.75)
Number of mobile apps usedOne256 (33.12)
Two319 (41.27)
Three158 (20.44)
Four36 (4.66)
Five4 (0.52)
Purpose of use #Replace walking319 (41.27)
Replace short trips by public transport249 (32.21)
First and last mile issue249 (32.21)
Journey to job/school364 (47.09)
Try the ride136 (17.59)
Leisure316 (40.88)
Others28 (3.62)
Use related issues #Bicycles are locked improperly283 (36.61)
Broken bicycles568 (73.48)
High prices104 (13.45)
Deposits cannot be returned49 (6.34)
Inconvenience in seeking bicycles420 (54.33)
Others43 (5.56)
Concerns of users #Security222 (28.72)
Occupation of urban space170 (21.99)
Parking disorder554 (71.67)
Waste of bicycles637 (82.41)
Risks attached to deposits191 (24.71)
# indicates questions with multiple-choice answers.
Table 9. Market shares estimated from questionnaire responses.
Bike-Sharing AppNPercentages
Ofo612 Sustainability 11 01539 i00176.79%
Mobike576 Sustainability 11 01539 i00272.27%
Bluegogo220 Sustainability 11 01539 i00327.6%
Unibike43 Sustainability 11 01539 i0045.4%
Small Ming31 Sustainability 11 01539 i0053.89%
Hellobike30 Sustainability 11 01539 i0063.76%
Others47 Sustainability 11 01539 i0075.9%
Table 10. Non-user responses (N = 337).
CategoryN (%)
Reasons of non-use *No necessity to cycle107 (31.75)
Complicated process of signing-up56 (16.62)
Do not want to pay deposits64 (18.99)
Protect personal information43 (12.76)
Others60 (17.80)
Concerns of non-users *Security 124 (36.80)
Occupy urban space115 (34.12)
Parking disorder265 (78.64)
Waste of bicycles276 (81.90)
Deposit risks76 (22.55)
* indicates that multiple-choices were possible.

