Does Air Pollution Affect Health and Medical Insurance Cost in the Elderly: An Empirical Evidence from China

Abstract
:1. Introduction
2. Theoretical Analysis and Research Hypotheses
3. Variables and Data
3.1. Measurement of Air Pollution and Health
3.2. Selection of Control Variables
3.3. Analysis of Descriptive Statistics
4. Empirical Results and Analysis
4.1. Air Pollution and Self-Rated Health
4.2. Self-Rated Health and Medical Insurance Costs
4.3. Mechanism of Air Pollutants Affecting Medical Insurance Cost
4.4. Further Study
5. Robustness Test
5.1. Adding Outpatient Frequency and Hospitalization Times
5.2. Difference between Northern and Southern China
6. Conclusions
7. Discussion
- (1)
- Further study on air quality difference between the north and south of China, and the difference in health, medical expenses and life expectancy caused by air pollution.
- (2)
- The concentrations of SO2, NO2 and PM10 are representative of air pollutants, but they are not comprehensive. For example, PM2.5, is small in particle size, rich in toxic substances, and has long residence time in the atmosphere and long transport distance. Therefore, the impact on human health and atmospheric environmental quality is greater, but PM2.5 monitoring indicators The data was only available in January 2013.
- (3)
- The data span is relatively short, the current CHARLS website only updated to 2015 data.
- (1)
- The coal-burning heating policy in the south and north of China is implemented with the Qinling-Huaihe River as the boundary, so we can consider the Regression Discontinuity with the latitude of the Qinling-Huaihe River as the breakpoint. The difference of air quality between the north and the south and its series influence are obtained.
- (2)
- Various important air pollutant concentrations can be incorporated into the calculation to construct a new “air quality composite index”, similar to the air quality index “Air Quality Index” (AQI), which China began to monitor and publish in real time in May 2012.
- (3)
- To better measure the void, the national baseline survey data for 2017 will be updated in 2019, and the data will be updated to further verify the results of the article.
Author Contributions
Funding
Conflicts of Interest
Appendix A

Appendix B

| Variable | OLS Regression |
|---|---|
| Health | −110.5711 *** (−2.7600) |
| Ln GDP | −8.9002 (−0.3000) |
| Disease | 199.5100 *** (13.7300) |
| Education | 3.7920 (1.0300) |
| Gender | −44.1925 (−1.1400) |
| Age | −1.3731 (−0.7400) |
| C | 1016.7050 |
| Source | Chi2 | df | p |
|---|---|---|---|
| Heteroscedasticity | 70.84 | 26 | 0.0000 |
| Skewness | 628.71 | 6 | 0.0000 |
| Kurtosis | 579.75 | 1 | 0.0000 |
| Total | 1279.31 | 33 | 0.0000 |
| Source | Chi2 | df | p |
|---|---|---|---|
| Heteroscedasticity | 132.29 | 52 | 0.0000 |
| Skewness | 631.30 | 9 | 0.0000 |
| Kurtosis | 570.24 | 1 | 0.0000 |
| Total | 1333.84 | 62 | 0.0000 |
| Source | Chi2 | df | p |
|---|---|---|---|
| Heteroscedasticity | 114.01 | 49 | 0.0000 |
| Skewness | 624.85 | 9 | 0.0000 |
| Kurtosis | 570.50 | 1 | 0.0000 |
| Total | 1309.36 | 59 | 0.0000 |
| Source | Chi2 | df | p |
|---|---|---|---|
| Heteroscedasticity | 142.43 | 73 | 0.0000 |
| Skewness | 633.56 | 12 | 0.0000 |
| Kurtosis | 570.34 | 1 | 0.0000 |
| Total | 1346.32 | 86 | 0.0000 |
Appendix C
Appendix C.1. Multicollinearity Test for Logistic Regression
| Index | _cons | PM10 | PM102 | |
|---|---|---|---|---|
| 1 | 1.00 | 0.01 | 0.00 | 0.01 |
| 2 | 2.82 | 0.06 | 0.00 | 0.08 |
| 3 | 16.37 | 0.93 | 1.00 | 0.91 |
| Index | _cons | PM10 | PM102 | |
|---|---|---|---|---|
| 1 | 1.00 | 0.01 | 0.02 | 0.02 |
| 2 | 1.42 | 0.99 | 0.00 | 0.00 |
| 3 | 7.86 | 0.01 | 0.98 | 0.98 |
| Index | _cons | PM10 | PM102 | |
|---|---|---|---|---|
| 1 | 1.00 | 0.17 | 0.02 | 0.18 |
| 2 | 1.28 | 0.04 | 0.90 | 0.00 |
| 3 | 2.14 | 0.79 | 0.08 | 0.82 |
| Index | _cons | PM10 | PM102 | |
|---|---|---|---|---|
| 1 | 1.00 | 0.01 | 0.01 | 0.01 |
| 2 | 1.72 | 0.00 | 0.00 | 0.00 |
| 3 | 5.84 | 0.53 | 0.64 | 0.00 |
| 4 | 0.39 | 0.46 | 0.35 | 0.99 |
| Index | _cons | PM10 | PM102 | NO2 | NO22 | SO2 | SO22 | |
|---|---|---|---|---|---|---|---|---|
| 1 | 1.00 | 0.02 | 0.02 | 0.03 | 0.02 | 0.04 | 0.00 | 0.00 |
| 2 | 1.20 | 0.01 | 0.02 | 0.01 | 0.01 | 0.00 | 0.01 | 0.01 |
| 3 | 1.33 | 0.15 | 0.04 | 0.08 | 0.08 | 0.08 | 0.00 | 0.00 |
| 4 | 1.94 | 0.04 | 0.01 | 0.38 | 0.38 | 0.38 | 0.00 | 0.00 |
| 5 | 2.70 | 0.63 | 0.00 | 0.03 | 0.03 | 0.03 | 0.00 | 0.00 |
| 6 | 3.80 | 0.15 | 0.91 | 0.47 | 0.47 | 0.47 | 0.00 | 0.00 |
| 7 | 9.06 | 0.00 | 0.00 | 0.00 | 0.00 | 0.00 | 0.98 | 0.98 |
| Index | _cons | PM10 | PM102 | NO2 | NO22 | SO2 | SO22 | |
|---|---|---|---|---|---|---|---|---|
| 1 | 1.00 | 0.02 | 0.02 | 0.03 | 0.02 | 0.04 | 0.00 | 0.00 |
| 2 | 1.18 | 0.01 | 0.01 | 0.03 | 0.01 | 0.01 | 0.01 | 0.01 |
| 3 | 1.32 | 0.13 | 0.05 | 0.00 | 0.08 | 0.07 | 0.00 | 0.00 |
| 4 | 1.92 | 0.04 | 0.01 | 0.24 | 0.38 | 0.04 | 0.00 | 0.00 |
| 5 | 2.68 | 0.59 | 0.00 | 0.02 | 0.03 | 0.82 | 0.00 | 0.00 |
| 6 | 3.77 | 0.14 | 0.91 | 0.69 | 0.47 | 0.00 | 0.00 | 0.00 |
| 7 | 8.88 | 0.07 | 0.00 | 0.00 | 0.00 | 0.98 | 0.98 | 0.98 |
| Index | _cons | PM10 | PM102 | Age | Education | Disease | lngdp | Gender | |
|---|---|---|---|---|---|---|---|---|---|
| 1 | 1.00 | 0.06 | 0.03 | 0.06 | 0.00 | 0.00 | 0.00 | 0.01 | 0.06 |
| 2 | 1.14 | 0.04 | 0.10 | 0.03 | 0.00 | 0.04 | 0.01 | 0.07 | 0.06 |
| 3 | 1.36 | 0.00 | 0.00 | 0.02 | 0.30 | 0.00 | 0.27 | 0.23 | 0.00 |
| 4 | 1.38 | 0.01 | 0.01 | 0.01 | 0.29 | 0.47 | 0.05 | 0.03 | 0.00 |
| 5 | 1.47 | 0.01 | 0.02 | 0.02 | 0.13 | 0.10 | 0.63 | 0.05 | 0.00 |
| 6 | 1.57 | 0.00 | 0.00 | 0.04 | 0.27 | 0.30 | 0.04 | 0.40 | 0.01 |
| 7 | 2.63 | 0.22 | 0.36 | 0.31 | 0.01 | 0.05 | 0.00 | 0.13 | 0.53 |
| 8 | 3.07 | 0.65 | 0.47 | 0.52 | 0.00 | 0.03 | 0.00 | 0.09 | 0.34 |
| Index | _cons | SO2 | SO22 | Age | Education | Disease | lngdp | Gender | |
|---|---|---|---|---|---|---|---|---|---|
| 1 | 1.00 | 0.01 | 0.02 | 0.02 | 0.00 | 0.00 | 0.00 | 0.00 | 0.01 |
| 2 | 1.07 | 0.12 | 0.00 | 0.00 | 0.00 | 0.00 | 0.00 | 0.00 | 0.12 |
| 3 | 1.33 | 0.01 | 0.00 | 0.02 | 0.30 | 0.03 | 0.04 | 0.47 | 0.00 |
| 4 | 1.36 | 0.00 | 0.00 | 0.00 | 0.29 | 0.55 | 0.09 | 0.02 | 0.00 |
| 5 | 1.42 | 0.00 | 0.00 | 0.00 | 0.13 | 0.11 | 0.87 | 0.03 | 0.00 |
| 6 | 1.57 | 0.01 | 0.00 | 0.00 | 0.27 | 0.30 | 0.00 | 0.47 | 0.00 |
| 7 | 2.79 | 0.83 | 0.00 | 0.00 | 0.01 | 0.01 | 0.00 | 0.00 | 0.87 |
| 8 | 7.79 | 0.03 | 0.98 | 0.98 | 0.00 | 0.00 | 0.00 | 0.00 | 0.00 |
| Index | _cons | NO2 | NO22 | Age | Education | Disease | Lngdp | Gender | |
|---|---|---|---|---|---|---|---|---|---|
| 1 | 1.00 | 0.06 | 0.00 | 0.07 | 0.00 | 0.00 | 0.00 | 0.00 | 0.07 |
| 2 | 1.21 | 0.00 | 0.22 | 0.00 | 0.00 | 0.05 | 0.00 | 0.23 | 0.00 |
| 3 | 1.44 | 0.00 | 0.00 | 0.00 | 0.52 | 0.25 | 0.10 | 0.02 | 0.00 |
| 4 | 1.48 | 0.00 | 0.01 | 0.00 | 0.02 | 0.12 | 0.78 | 0.01 | 0.00 |
| 5 | 1.58 | 0.01 | 0.06 | 0.00 | 0.41 | 0.49 | 0.04 | 0.01 | 0.00 |
| 6 | 1.92 | 0.01 | 0.21 | 0.32 | 0.01 | 0.00 | 0.07 | 0.35 | 0.13 |
| 7 | 2.20 | 0.00 | 0.47 | 0.35 | 0.03 | 0.03 | 0.00 | 0.38 | 0.17 |
| 8 | 3.20 | 0.92 | 0.02 | 0.25 | 0.00 | 0.07 | 0.00 | 0.00 | 0.63 |
| Index | _cons | PM10 | PM102 | SO2 | SO22 | NO2 | NO22 | Age | Education | Disease | Lngdp | Gender | |
|---|---|---|---|---|---|---|---|---|---|---|---|---|---|
| 1 | 1.00 | 0.02 | 0.01 | 0.02 | 0.00 | 0.00 | 0.02 | 0.04 | 0.00 | 0.00 | 0.00 | 0.01 | 0.02 |
| 2 | 1.17 | 0.03 | 0.01 | 0.00 | 0.00 | 0.00 | 0.03 | 0.02 | 0.00 | 0.01 | 0.00 | 0.03 | 0.04 |
| 3 | 1.24 | 0.00 | 0.02 | 0.02 | 0.01 | 0.01 | 0.02 | 0.00 | 0.00 | 0.01 | 0.00 | 0.03 | 0.00 |
| 4 | 1.57 | 0.01 | 0.01 | 0.04 | 0.00 | 0.00 | 0.01 | 0.00 | 0.20 | 0.00 | 0.26 | 0.18 | 0.01 |
| 5 | 1.61 | 0.01 | 0.01 | 0.01 | 0.00 | 0.00 | 0.00 | 0.00 | 0.33 | 0.45 | 0.03 | 0.02 | 0.00 |
| 6 | 1.72 | 0.01 | 0.01 | 0.02 | 0.00 | 0.00 | 0.00 | 0.00 | 0.15 | 0.11 | 0.61 | 0.04 | 0.00 |
| 7 | 1.77 | 0.00 | 0.00 | 0.05 | 0.00 | 0.00 | 0.04 | 0.00 | 0.29 | 0.32 | 0.08 | 0.10 | 0.02 |
| 8 | 1.35 | 0.00 | 0.00 | 0.10 | 0.00 | 0.00 | 0.17 | 0.45 | 0.00 | 0.00 | 0.01 | 0.16 | 0.12 |
| 9 | 2.43 | 0.00 | 0.01 | 0.04 | 0.00 | 0.00 | 0.27 | 0.21 | 0.04 | 0.04 | 0.00 | 0.44 | 0.17 |
| 10 | 3.47 | 0.53 | 0.14 | 0.12 | 0.00 | 0.00 | 0.14 | 0.24 | 0.00 | 0.05 | 0.00 | 0.00 | 0.50 |
| 11 | 4.05 | 0.35 | 0.77 | 0.58 | 0.00 | 0.00 | 0.29 | 0.02 | 0.00 | 0.01 | 0.00 | 0.00 | 0.11 |
| 12 | 9.33 | 0.05 | 0.00 | 0.00 | 0.98 | 0.98 | 0.00 | 0.02 | 0.00 | 0.00 | 0.00 | 0.00 | 0.00 |
| Index | _cons | Age | Education | Disease | lngdp | Gender | |
|---|---|---|---|---|---|---|---|
| 1 | 1.00 | 0.12 | 0.00 | 0.01 | 0.00 | 0.00 | 0.13 |
| 2 | 1.25 | 0.01 | 0.02 | 0.43 | 0.01 | 0.38 | 0.00 |
| 3 | 1.28 | 0.00 | 0.61 | 0.02 | 0.15 | 0.14 | 0.00 |
| 4 | 1.33 | 0.00 | 0.08 | 0.05 | 0.82 | 0.05 | 0.00 |
| 5 | 1.46 | 0.01 | 0.28 | 0.41 | 0.03 | 0.42 | 0.00 |
| 6 | 2.64 | 0.86 | 0.01 | 0.07 | 0.00 | 0.00 | 0.87 |
| Index | _cons | Age | Education | Disease | lngdp | Gender | |
|---|---|---|---|---|---|---|---|
| 1 | 1.00 | 0.12 | 0.00 | 0.00 | 0.00 | 0.00 | 0.12 |
| 2 | 1.20 | 0.00 | 0.01 | 0.35 | 0.03 | 0.38 | 0.00 |
| 3 | 1.31 | 0.00 | 0.46 | 0.02 | 0.02 | 0.00 | 0.00 |
| 4 | 1.35 | 0.00 | 0.52 | 0.05 | 0.05 | 0.01 | 0.00 |
| 5 | 1.50 | 0.00 | 0.00 | 0.55 | 0.55 | 0.61 | 0.00 |
| 6 | 2.73 | 0.87 | 0.01 | 0.03 | 0.03 | 0.00 | 0.88 |
| Index | _cons | PM10 | PM102 | SO2 | SO22 | NO2 | NO22 | |
|---|---|---|---|---|---|---|---|---|
| 1 | 1.00 | 0.02 | 0.03 | 0.05 | 0.00 | 0.00 | 0.03 | 0.04 |
| 2 | 1.12 | 0.02 | 0.01 | 0.03 | 0.01 | 0.01 | 0.01 | 0.02 |
| 3 | 1.27 | 0.13 | 0.09 | 0.00 | 0.00 | 0.00 | 0.12 | 0.07 |
| 4 | 1.83 | 0.06 | 0.03 | 0.27 | 0.00 | 0.00 | 0.55 | 0.02 |
| 5 | 2.53 | 0.62 | 0.00 | 0.06 | 0.00 | 0.00 | 0.01 | 0.85 |
| 6 | 2.75 | 0.12 | 0.83 | 0.59 | 0.00 | 0.00 | 0.28 | 0.00 |
| 7 | 11.91 | 0.03 | 0.00 | 0.00 | 0.99 | 0.99 | 0.00 | 0.01 |
| Index | _cons | PM10 | PM102 | SO2 | SO22 | NO2 | NO22 | |
|---|---|---|---|---|---|---|---|---|
| 1 | 1.00 | 0.00 | 0.02 | 0.03 | 0.00 | 0.00 | 0.02 | 0.03 |
| 2 | 1.09 | 0.00 | 0.02 | 0.04 | 0.00 | 0.00 | 0.01 | 0.02 |
| 3 | 1.21 | 0.02 | 0.05 | 0.00 | 0.00 | 0.00 | 0.08 | 0.09 |
| 4 | 1.65 | 0.00 | 0.01 | 0.23 | 0.00 | 0.00 | 0.44 | 0.03 |
| 5 | 2.52 | 0.13 | 0.04 | 0.03 | 0.00 | 0.00 | 0.06 | 0.76 |
| 6 | 3.12 | 0.05 | 0.71 | 0.65 | 0.00 | 0.00 | 0.36 | 0.04 |
| 7 | 169.10 | 0.79 | 0.15 | 0.02 | 1.00 | 1.00 | 0.02 | 0.03 |
| Index | _cons | PM10 | PM102 | |
|---|---|---|---|---|
| 1 | 1.00 | 0.00 | 0.00 | 0.01 |
| 2 | 2.96 | 0.06 | 0.00 | 0.09 |
| 3 | 17.77 | 0.94 | 1.00 | 0.91 |
| Index | _cons | PM10 | PM102 | |
|---|---|---|---|---|
| 1 | 1.00 | 0.01 | 0.02 | 0.02 |
| 2 | 1.42 | 0.98 | 0.00 | 0.00 |
| 3 | 7.88 | 0.01 | 0.98 | 0.98 |
| Index | _cons | PM10 | PM102 | |
|---|---|---|---|---|
| 1 | 1.00 | 0.00 | 0.00 | 0.00 |
| 2 | 3.75 | 0.06 | 0.00 | 0.04 |
| 3 | 28.63 | 0.94 | 1.00 | 0.96 |
| Index | _cons | PM10 | PM102 | |
|---|---|---|---|---|
| 1 | 1.00 | 0.01 | 0.01 | 0.01 |
| 2 | 1.74 | 0.00 | 0.00 | 0.00 |
| 3 | 6.35 | 0.88 | 0.41 | 0.04 |
| 4 | 0.39 | 0.46 | 0.35 | 0.99 |
| Index | _cons | PM10 | PM102 | NO2 | NO22 | SO2 | SO22 | |
|---|---|---|---|---|---|---|---|---|
| 1 | 1.00 | 0.01 | 0.02 | 0.02 | 0.02 | 0.02 | 0.00 | 0.00 |
| 2 | 1.32 | 0.02 | 0.01 | 0.01 | 0.02 | 0.01 | 0.01 | 0.01 |
| 3 | 1.54 | 0.19 | 0.06 | 0.06 | 0.00 | 0.03 | 0.00 | 0.00 |
| 4 | 2.38 | 0.14 | 0.03 | 0.03 | 0.19 | 0.00 | 0.00 | 0.00 |
| 5 | 3.22 | 0.45 | 0.54 | 0.54 | 0.03 | 0.33 | 0.00 | 0.00 |
| 6 | 3.89 | 0.07 | 0.34 | 0.34 | 0.71 | 0.57 | 0.00 | 0.00 |
| 7 | 9.75 | 0.12 | 0.00 | 0.00 | 0.01 | 0.04 | 0.98 | 0.98 |
| Index | _cons | PM10 | PM102 | Age | Education | Disease | lngdp | |
|---|---|---|---|---|---|---|---|---|
| 1 | 1.00 | 0.06 | 0.03 | 0.06 | 0.06 | 0.00 | 0.00 | 0.00 |
| 2 | 1.14 | 0.03 | 0.11 | 0.03 | 0.03 | 0.03 | 0.03 | 0.05 |
| 3 | 1.33 | 0.02 | 0.00 | 0.03 | 0.03 | 0.24 | 0.08 | 0.32 |
| 4 | 1.36 | 0.00 | 0.00 | 0.00 | 0.00 | 0.20 | 0.03 | 0.03 |
| 5 | 1.45 | 0.00 | 0.02 | 0.02 | 0.02 | 0.00 | 0.86 | 0.02 |
| 6 | 1.57 | 0.01 | 0.00 | 0.02 | 0.02 | 0.40 | 0.00 | 0.27 |
| 7 | 2.66 | 0.25 | 0.34 | 0.28 | 0.28 | 0.08 | 0.00 | 0.16 |
| 8 | 3.80 | 0.68 | 0.40 | 0.55 | 0.55 | 0.03 | 0.00 | 0.12 |
| Index | _cons | SO2 | SO22 | Age | Education | Disease | lngdp | Gender | |
|---|---|---|---|---|---|---|---|---|---|
| 1 | 1.00 | 0.01 | 0.01 | 0.02 | 0.00 | 0.00 | 0.00 | 0.00 | 0.01 |
| 2 | 1.07 | 0.11 | 0.00 | 0.00 | 0.00 | 0.01 | 0.00 | 0.00 | 0.12 |
| 3 | 1.32 | 0.01 | 0.00 | 0.00 | 0.01 | 0.01 | 0.00 | 0.37 | 0.00 |
| 4 | 1.36 | 0.00 | 0.00 | 0.00 | 0.64 | 0.64 | 0.06 | 0.14 | 0.00 |
| 5 | 1.42 | 0.00 | 0.00 | 0.00 | 0.04 | 0.04 | 0.93 | 0.01 | 0.00 |
| 6 | 1.60 | 0.02 | 0.00 | 0.00 | 0.30 | 0.30 | 0.00 | 0.46 | 0.00 |
| 7 | 2.82 | 0.80 | 0.00 | 0.00 | 0.01 | 0.01 | 0.00 | 0.01 | 0.07 |
| 8 | 7.76 | 0.05 | 0.98 | 0.98 | 0.00 | 0.00 | 0.00 | 0.00 | 0.00 |
| Index | _cons | NO2 | NO22 | Age | Education | Disease | lngdp | Gender | |
|---|---|---|---|---|---|---|---|---|---|
| 1 | 1.00 | 0.06 | 0.01 | 0.07 | 0.00 | 0.00 | 0.00 | 0.00 | 0.06 |
| 2 | 1.19 | 0.01 | 0.16 | 0.01 | 0.00 | 0.05 | 0.01 | 0.18 | 0.02 |
| 3 | 1.42 | 0.00 | 0.00 | 0.00 | 0.55 | 0.26 | 0.03 | 0.01 | 0.00 |
| 4 | 1.47 | 0.01 | 0.00 | 0.00 | 0.00 | 0.10 | 0.78 | 0.03 | 0.00 |
| 5 | 1.60 | 0.02 | 0.07 | 0.00 | 0.39 | 0.44 | 0.10 | 0.01 | 0.00 |
| 6 | 1.82 | 0.01 | 0.09 | 0.23 | 0.02 | 0.01 | 0.07 | 0.45 | 0.09 |
| 7 | 2.43 | 0.00 | 0.54 | 0.38 | 0.02 | 0.05 | 0.00 | 0.31 | 0.26 |
| 8 | 3.25 | 0.90 | 0.12 | 0.32 | 0.01 | 0.08 | 0.00 | 0.01 | 0.57 |
| Index | _cons | PM10 | SO2 | NO2 | Age | Education | Disease | Lngdp | Gender | |
|---|---|---|---|---|---|---|---|---|---|---|
| 1 | 1.00 | 0.00 | 0.09 | 0.04 | 0.09 | 0.00 | 0.01 | 0.01 | 0.08 | 0.00 |
| 2 | 1.08 | 0.12 | 0.00 | 0.00 | 0.00 | 0.00 | 0.01 | 0.00 | 0.00 | 0.13 |
| 3 | 1.36 | 0.01 | 0.01 | 0.05 | 0.00 | 0.28 | 0.46 | 0.01 | 0.02 | 0.00 |
| 4 | 1.38 | 0.00 | 0.00 | 0.12 | 0.00 | 0.29 | 0.01 | 0.32 | 0.12 | 0.00 |
| 5 | 1.47 | 0.00 | 0.00 | 0.22 | 0.00 | 0.13 | 0.02 | 0.63 | 0.01 | 0.00 |
| 6 | 1.55 | 0.01 | 0.03 | 0.47 | 0.02 | 0.22 | 0.28 | 0.01 | 0.01 | 0.00 |
| 7 | 1.75 | 0.01 | 0.25 | 0.09 | 0.01 | 0.06 | 0.10 | 0.03 | 0.57 | 0.00 |
| 8 | 2.45 | 0.00 | 0.61 | 0.01 | 0.87 | 0.00 | 0.00 | 0.00 | 0.18 | 0.00 |
| 9 | 2.85 | 0.85 | 0.00 | 0.00 | 0.00 | 0.01 | 0.10 | 0.00 | 0.01 | 0.87 |
| Index | _cons | PM10 | PM102 | SO2 | SO22 | NO2 | NO22 | Age | Education | Disease | Lngdp | Gender | |
|---|---|---|---|---|---|---|---|---|---|---|---|---|---|
| 1 | 1.00 | 0.01 | 0.02 | 0.02 | 0.00 | 0.00 | 0.02 | 0.02 | 0.00 | 0.00 | 0.00 | 0.00 | 0.01 |
| 2 | 1.27 | 0.04 | 0.01 | 0.00 | 0.00 | 0.00 | 0.02 | 0.01 | 0.00 | 0.01 | 0.00 | 0.02 | 0.06 |
| 3 | 1.39 | 0.00 | 0.03 | 0.01 | 0.01 | 0.01 | 0.03 | 0.00 | 0.00 | 0.01 | 0.00 | 0.03 | 0.01 |
| 4 | 1.66 | 0.02 | 0.01 | 0.04 | 0.00 | 0.00 | 0.01 | 0.00 | 0.04 | 0.08 | 0.11 | 0.23 | 0.02 |
| 5 | 1.71 | 0.00 | 0.00 | 0.00 | 0.00 | 0.00 | 0.00 | 0.00 | 0.50 | 0.33 | 0.01 | 0.00 | 0.00 |
| 6 | 1.83 | 0.00 | 0.01 | 0.01 | 0.00 | 0.00 | 0.00 | 0.00 | 0.05 | 0.00 | 0.86 | 0.03 | 0.01 |
| 7 | 1.93 | 0.00 | 0.00 | 0.02 | 0.00 | 0.00 | 0.02 | 0.01 | 0.38 | 0.43 | 0.00 | 0.09 | 0.02 |
| 8 | 2.85 | 0.00 | 0.00 | 0.01 | 0.00 | 0.00 | 0.18 | 0.24 | 0.02 | 0.06 | 0.00 | 0.28 | 0.30 |
| 9 | 2.99 | 0.01 | 0.27 | 0.03 | 0.00 | 0.00 | 0.67 | 0.07 | 0.00 | 0.00 | 0.00 | 0.19 | 0.05 |
| 10 | 3.90 | 0.68 | 0.31 | 0.18 | 0.00 | 0.00 | 0.00 | 0.03 | 0.01 | 0.05 | 0.00 | 0.05 | 0.45 |
| 11 | 4.17 | 0.16 | 0.26 | 0.66 | 0.00 | 0.00 | 0.05 | 0.58 | 0.00 | 0.02 | 0.00 | 0.08 | 0.07 |
| 12 | 10.07 | 0.08 | 0.01 | 0.02 | 0.98 | 0.98 | 0.00 | 0.04 | 0.00 | 0.00 | 0.00 | 0.00 | 0.00 |
| Index | _cons | PM10 | PM102 | |
|---|---|---|---|---|
| 1 | 1.00 | 0.00 | 0.00 | 0.01 |
| 2 | 3.03 | 0.06 | 0.00 | 0.09 |
| 3 | 19.68 | 0.94 | 1.00 | 0.93 |
| Index | _cons | PM10 | PM102 | |
|---|---|---|---|---|
| 1 | 1.00 | 0.01 | 0.02 | 0.02 |
| 2 | 1.42 | 0.98 | 0.00 | 0.00 |
| 3 | 7.88 | 0.01 | 0.98 | 0.98 |
| Index | _cons | PM10 | PM102 | |
|---|---|---|---|---|
| 1 | 1.00 | 0.00 | 0.00 | 0.00 |
| 2 | 3.75 | 0.06 | 0.00 | 0.04 |
| 3 | 28.63 | 0.94 | 1.00 | 0.96 |
| Index | _cons | PM10 | PM102 | |
|---|---|---|---|---|
| 1 | 1.00 | 0.01 | 0.01 | 0.01 |
| 2 | 1.74 | 0.00 | 0.00 | 0.00 |
| 3 | 6.35 | 0.88 | 0.41 | 0.04 |
| 4 | 0.39 | 0.46 | 0.35 | 0.99 |
| Index | _cons | PM10 | PM102 | NO2 | NO22 | SO2 | SO22 | |
|---|---|---|---|---|---|---|---|---|
| 1 | 1.00 | 0.01 | 0.02 | 0.02 | 0.02 | 0.02 | 0.00 | 0.00 |
| 2 | 1.32 | 0.02 | 0.01 | 0.01 | 0.02 | 0.01 | 0.01 | 0.01 |
| 3 | 1.54 | 0.19 | 0.06 | 0.06 | 0.00 | 0.03 | 0.00 | 0.00 |
| 4 | 2.38 | 0.14 | 0.03 | 0.03 | 0.19 | 0.00 | 0.00 | 0.00 |
| 5 | 3.22 | 0.45 | 0.54 | 0.54 | 0.03 | 0.33 | 0.00 | 0.00 |
| 6 | 3.89 | 0.07 | 0.34 | 0.34 | 0.71 | 0.57 | 0.00 | 0.00 |
| 7 | 9.75 | 0.12 | 0.00 | 0.00 | 0.01 | 0.04 | 0.98 | 0.98 |
| Index | _cons | PM10 | PM102 | Age | Education | Disease | Lngdp | |
|---|---|---|---|---|---|---|---|---|
| 1 | 1.00 | 0.06 | 0.03 | 0.06 | 0.06 | 0.00 | 0.00 | 0.00 |
| 2 | 1.14 | 0.03 | 0.11 | 0.03 | 0.03 | 0.03 | 0.03 | 0.05 |
| 3 | 1.33 | 0.02 | 0.00 | 0.03 | 0.03 | 0.24 | 0.08 | 0.32 |
| 4 | 1.36 | 0.00 | 0.00 | 0.00 | 0.00 | 0.20 | 0.03 | 0.03 |
| 5 | 1.45 | 0.00 | 0.02 | 0.02 | 0.02 | 0.00 | 0.86 | 0.02 |
| 6 | 1.57 | 0.01 | 0.00 | 0.02 | 0.02 | 0.40 | 0.00 | 0.27 |
| 7 | 2.66 | 0.25 | 0.34 | 0.28 | 0.28 | 0.08 | 0.00 | 0.16 |
| 8 | 3.80 | 0.68 | 0.40 | 0.55 | 0.55 | 0.03 | 0.00 | 0.12 |
| Index | _cons | SO2 | SO22 | Age | Education | Disease | Lngdp | Gender | |
|---|---|---|---|---|---|---|---|---|---|
| 1 | 1.00 | 0.01 | 0.01 | 0.02 | 0.00 | 0.00 | 0.00 | 0.00 | 0.01 |
| 2 | 1.07 | 0.11 | 0.00 | 0.00 | 0.00 | 0.01 | 0.00 | 0.00 | 0.12 |
| 3 | 1.32 | 0.01 | 0.00 | 0.00 | 0.01 | 0.01 | 0.00 | 0.37 | 0.00 |
| 4 | 1.36 | 0.00 | 0.00 | 0.00 | 0.64 | 0.64 | 0.06 | 0.14 | 0.00 |
| 5 | 1.42 | 0.00 | 0.00 | 0.00 | 0.04 | 0.04 | 0.93 | 0.01 | 0.00 |
| 6 | 1.60 | 0.02 | 0.00 | 0.00 | 0.30 | 0.30 | 0.00 | 0.46 | 0.00 |
| 7 | 2.82 | 0.80 | 0.00 | 0.00 | 0.01 | 0.01 | 0.00 | 0.01 | 0.07 |
| 8 | 7.76 | 0.05 | 0.98 | 0.98 | 0.00 | 0.00 | 0.00 | 0.00 | 0.00 |
| Index | _cons | NO2 | NO22 | Age | Education | Disease | Lngdp | Gender | |
|---|---|---|---|---|---|---|---|---|---|
| 1 | 1.00 | 0.06 | 0.01 | 0.07 | 0.00 | 0.00 | 0.00 | 0.00 | 0.06 |
| 2 | 1.19 | 0.01 | 0.16 | 0.01 | 0.00 | 0.05 | 0.01 | 0.18 | 0.02 |
| 3 | 1.42 | 0.00 | 0.00 | 0.00 | 0.55 | 0.26 | 0.03 | 0.01 | 0.00 |
| 4 | 1.47 | 0.01 | 0.00 | 0.00 | 0.00 | 0.10 | 0.78 | 0.03 | 0.00 |
| 5 | 1.60 | 0.02 | 0.07 | 0.00 | 0.39 | 0.44 | 0.10 | 0.01 | 0.00 |
| 6 | 1.82 | 0.01 | 0.09 | 0.23 | 0.02 | 0.01 | 0.07 | 0.45 | 0.09 |
| 7 | 2.43 | 0.00 | 0.54 | 0.38 | 0.02 | 0.05 | 0.00 | 0.31 | 0.26 |
| 8 | 3.25 | 0.90 | 0.12 | 0.32 | 0.01 | 0.08 | 0.00 | 0.01 | 0.57 |
| Index | _cons | PM10 | SO2 | NO2 | Age | educAtion | Disease | Lngdp | Gender | |
|---|---|---|---|---|---|---|---|---|---|---|
| 1 | 1.00 | 0.00 | 0.04 | 0.04 | 0.05 | 0.00 | 0.00 | 0.00 | 0.04 | 0.00 |
| 2 | 1.21 | 0.13 | 0.00 | 0.00 | 0.00 | 0.00 | 0.01 | 0.00 | 0.00 | 0.13 |
| 3 | 1.47 | 0.00 | 0.00 | 0.03 | 0.01 | 0.16 | 0.01 | 0.36 | 0.13 | 0.00 |
| 4 | 1.59 | 0.01 | 0.00 | 0.00 | 0.00 | 0.29 | 0.62 | 0.01 | 0.00 | 0.00 |
| 5 | 1.64 | 0.01 | 0.00 | 0.00 | 0.00 | 0.48 | 0.25 | 0.25 | 0.00 | 0.00 |
| 6 | 1.86 | 0.00 | 0.04 | 0.07 | 0.01 | 0.06 | 0.03 | 0.34 | 0.41 | 0.00 |
| 7 | 2.66 | 0.00 | 0.09 | 0.05 | 0.92 | 0.00 | 0.00 | 0.00 | 0.36 | 0.00 |
| 8 | 3.16 | 0.85 | 0.00 | 0.00 | 0.00 | 0.01 | 0.07 | 0.00 | 0.00 | 0.87 |
| 9 | 3.37 | 0.00 | 0.82 | 0.80 | 0.00 | 0.00 | 0.00 | 0.03 | 0.05 | 0.00 |
| Index | _cons | PM10 | PM102 | SO2 | SO22 | NO2 | NO22 | Age | Education | Disease | Lngdp | Gender | |
|---|---|---|---|---|---|---|---|---|---|---|---|---|---|
| 1 | 1.00 | 0.00 | 0.01 | 0.01 | 0.01 | 0.01 | 0.00 | 0.01 | 0.00 | 0.00 | 0.00 | 0.00 | 0.01 |
| 2 | 1.23 | 0.02 | 0.01 | 0.00 | 0.01 | 0.00 | 0.02 | 0.04 | 0.00 | 0.00 | 0.00 | 0.02 | 0.03 |
| 3 | 1.65 | 0.01 | 0.00 | 0.01 | 0.01 | 0.00 | 0.03 | 0.00 | 0.04 | 0.00 | 0.13 | 0.17 | 0.02 |
| 4 | 1.88 | 0.00 | 0.00 | 0.00 | 0.00 | 0.00 | 0.00 | 0.00 | 0.27 | 0.64 | 0.00 | 0.00 | 0.00 |
| 5 | 1.91 | 0.00 | 0.00 | 0.01 | 0.00 | 0.00 | 0.02 | 0.00 | 0.55 | 0.21 | 0.04 | 0.01 | 0.02 |
| 6 | 1.98 | 0.00 | 0.00 | 0.01 | 0.00 | 0.00 | 0.01 | 0.00 | 0.10 | 0.03 | 0.74 | 0.01 | 0.00 |
| 7 | 2.55 | 0.01 | 0.00 | 0.00 | 0.02 | 0.01 | 0.07 | 0.14 | 0.03 | 0.06 | 0.01 | 0.47 | 0.14 |
| 8 | 2.65 | 0.00 | 0.00 | 0.03 | 0.04 | 0.00 | 0.04 | 0.42 | 0.01 | 0.00 | 0.05 | 0.18 | 0.11 |
| 9 | 3.78 | 0.27 | 0.01 | 0.02 | 0.30 | 0.00 | 0.12 | 0.05 | 0.01 | 0.04 | 0.01 | 0.06 | 0.46 |
| 10 | 4.01 | 0.15 | 0.37 | 0.00 | 0.38 | 0.02 | 0.00 | 0.10 | 0.00 | 0.01 | 0.02 | 0.04 | 0.14 |
| 11 | 5.23 | 0.30 | 0.17 | 0.02 | 0.23 | 0.59 | 0.24 | 0.00 | 0.00 | 0.00 | 0.00 | 0.02 | 0.05 |
| 12 | 7.13 | 0.23 | 0.44 | 0.90 | 0.01 | 0.36 | 0.45 | 0.23 | 0.00 | 0.00 | 0.00 | 0.00 | 0.01 |
Appendix C.2. Multicollinearity Test for OLS Regression
| Variable | VIF | 1/VIF |
|---|---|---|
| Education | 1.08 | 0.928736 |
| Health | 1.06 | 0.939754 |
| Lngdp | 1.05 | 0.951208 |
| Gender | 1.05 | 0.952480 |
| Disease | 1.04 | 0.962520 |
| age | 1.02 | 0.979863 |
| Mean VIF | 1.05 | |
| Variable | VIF | 1/VIF |
|---|---|---|
| NO2 | 1.76 | 0.568128 |
| PM10 | 1.53 | 0.654072 |
| Lngdp | 1.30 | 0.771432 |
| Education | 1.08 | 0.927595 |
| Health | 1.07 | 0.931172 |
| Disease | 1.06 | 0.942868 |
| Gender | 1.05 | 0.952106 |
| Age | 1.02 | 0.978021 |
| SO2 | 1.01 | 0.991937 |
| Mean VIF | 1.21 | |
| Variable | VIF | 1/VIF |
|---|---|---|
| NO2 * health | 7.81 | 0.127996 |
| health | 4.83 | 0.207184 |
| PM10 * health | 4.39 | 0.227780 |
| Lngdp | 1.19 | 0.839801 |
| Education | 1.07 | 0.931340 |
| Disease | 1.06 | 0.944869 |
| Gender | 1.05 | 0.954871 |
| Age | 1.02 | 0.980083 |
| SO2&health | 1.01 | 0.989930 |
| Mean VIF | 2.60 | |
| Variable | VIF | 1/VIF |
|---|---|---|
| PM10 | 1.86 | 0.537684 |
| PM102 | 1.86 | 0.537684 |
| Mean VIF | 1.86 | |
| Variable | VIF | 1/VIF |
|---|---|---|
| SO2 | 15.43 | 0.064801 |
| SO22 | 15.43 | 0.064801 |
| Mean VIF | 15.43 | |
| Variable | VIF | 1/VIF |
|---|---|---|
| NO2 | 1.04 | 0.960136 |
| NO22 | 1.04 | 0.960136 |
| Mean VIF | 1.04 | |
| Variable | VIF | 1/VIF |
|---|---|---|
| NO2 | 1.63 | 0.615186 |
| PM10 | 1.60 | 0.626726 |
| SO2 | 1.03 | 0.970426 |
| Mean VIF | 1.42 | |
| Variable | VIF | 1/VIF |
|---|---|---|
| NO22 | 1.17 | 0.856324 |
| NO2 | 1.83 | 0.545422 |
| SO2 | 16.05 | 0.062292 |
| SO22 | 15.70 | 0.063707 |
| PM10 | 3.17 | 0.315347 |
| PM102 | 2.15 | 0.466159 |
| Mean VIF | 1.42 | |
| Variable | VIF | 1/VIF |
|---|---|---|
| PM10 | 2.18 | 0.459763 |
| PM102 | 1.99 | 0.502957 |
| Lngdp | 1.19 | 0.837080 |
| Education | 1.07 | 0.930635 |
| Gender | 1.05 | 0.951440 |
| Age | 1.02 | 0.979703 |
| disease | 1.01 | 0.988049 |
| Mean VIF | 1.36 | |
| Variable | VIF | 1/VIF |
|---|---|---|
| SO2 | 15.47 | 0.064639 |
| SO22 | 15.45 | 0.064723 |
| Education | 1.07 | 0.930403 |
| Gender | 1.05 | 0.950717 |
| Lngsp | 1.03 | 0.969817 |
| Age | 1.02 | 0.979583 |
| disease | 1.00 | 0.996117 |
| Mean VIF | 5.16 | |
| Variable | VIF | 1/VIF |
|---|---|---|
| NO2 | 27.57 | 0.036275 |
| NO22 | 26.99 | 0.037055 |
| Lngdp | 1.30 | 0.769348 |
| Education | 1.08 | 0.927188 |
| Gender | 1.05 | 0.950564 |
| Age | 1.02 | 0.978403 |
| disease | 1.01 | 0.986874 |
| Mean VIF | 8.57 | |
| Variable | VIF | 1/VIF |
|---|---|---|
| NO2 | 1.33 | 0.752278 |
| Lngdp | 1.30 | 0.769348 |
| Education | 1.08 | 0.927188 |
| NO22 | 1.05 | 0.947888 |
| Gender | 1.05 | 0.950564 |
| Age | 1.02 | 0.978403 |
| disease | 1.01 | 0.986874 |
| Mean VIF | 1.12 | |
| Variable | VIF | 1/VIF |
|---|---|---|
| NO2 | 1.88 | 0.532724 |
| PM10 | 1.60 | 0.624213 |
| Lngdp | 1.29 | 0.772899 |
| Education | 1.07 | 0.930323 |
| Gender | 1.05 | 0.951390 |
| SO2 | 1.03 | 0.967910 |
| age | 1.02 | 0.978653 |
| disease | 1.01 | 0.987308 |
| Mean VIF | 1.25 | |
| Variable | VIF | 1/VIF |
|---|---|---|
| PM10 | 1.86 | 0.537684 |
| PM102 | 1.86 | 0.537684 |
| Mean VIF | 1.86 | |
| Variable | VIF | 1/VIF |
|---|---|---|
| SO2 | 15.43 | 0.064801 |
| SO22 | 15.43 | 0.064801 |
| Mean VIF | 15.43 | |
| Variable | VIF | 1/VIF |
|---|---|---|
| NO2 | 1.04 | 0.960136 |
| NO22 | 1.04 | 0.960136 |
| Mean VIF | 1.04 | |
| Variable | VIF | 1/VIF |
|---|---|---|
| NO2 | 1.63 | 0.615186 |
| PM10 | 1.60 | 0.626726 |
| SO2 | 1.03 | 0.970426 |
| Mean VIF | 1.42 | |
| Variable | VIF | 1/VIF |
|---|---|---|
| SO2 | 16.05 | 0.062292 |
| SO22 | 15.70 | 0.063707 |
| PM10 | 3.17 | 0.315347 |
| PM102 | 2.15 | 0.466159 |
| NO2 | 1.83 | 0.545422 |
| NO22 | 1.17 | 0.856324 |
| Mean VIF | 6.68 | |
| Variable | VIF | 1/VIF |
|---|---|---|
| PM10 | 2.18 | 0.459763 |
| PM102 | 1.99 | 0.502957 |
| Lngdp | 1.19 | 0.837080 |
| Education | 1.07 | 0.930635 |
| Gender | 1.05 | 0.951440 |
| Age | 1.02 | 0.979703 |
| disease | 1.01 | 0.988049 |
| Mean VIF | 1.36 | |
| Variable | VIF | 1/VIF |
|---|---|---|
| SO2 | 15.47 | 0.064639 |
| SO22 | 15.45 | 0.064723 |
| Education | 1.07 | 0.930403 |
| Gender | 1.05 | 0.950717 |
| Lngsp | 1.03 | 0.969817 |
| Age | 1.02 | 0.979583 |
| disease | 1.00 | 0.996117 |
| Mean VIF | 5.16 | |
| Variable | VIF | 1/VIF |
|---|---|---|
| NO2 | 1.33 | 0.752270 |
| Lngdp | 1.30 | 0.769348 |
| Education | 1.08 | 0.927188 |
| NO2 | 1.05 | 0.947888 |
| Gender | 1.05 | 0.950564 |
| Age | 1.02 | 0.978403 |
| disease | 1.01 | 0.986874 |
| Mean VIF | 1.12 | |
| Variable | VIF | 1/VIF |
|---|---|---|
| NO2 | 1.88 | 0.532724 |
| PM10 | 1.60 | 0.624213 |
| Lngdp | 1.29 | 0.772899 |
| Education | 1.07 | 0.930323 |
| Gender | 1.05 | 0.951390 |
| SO2 | 1.03 | 0.967910 |
| age | 1.02 | 0.978635 |
| disease | 1.01 | 0.987308 |
| Mean VIF | 1.25 | |
| Variable | VIF | 1/VIF |
|---|---|---|
| SO2 | 16.07 | 0.062228 |
| SO22 | 15.71 | 0.063668 |
| PM10 | 3.22 | 0.310308 |
| PM102 | 2.19 | 0.455695 |
| NO2 | 2.04 | 0.491125 |
| Lngdp | 1.32 | 0.755907 |
| NO2 | 1.18 | 0.849807 |
| education | 1.08 | 0.926813 |
| Gender | 1.05 | 0.951080 |
| Age | 1.02 | 0.978368 |
| disease | 1.02 | 0.981867 |
| Mean VIF | 4.17 | |
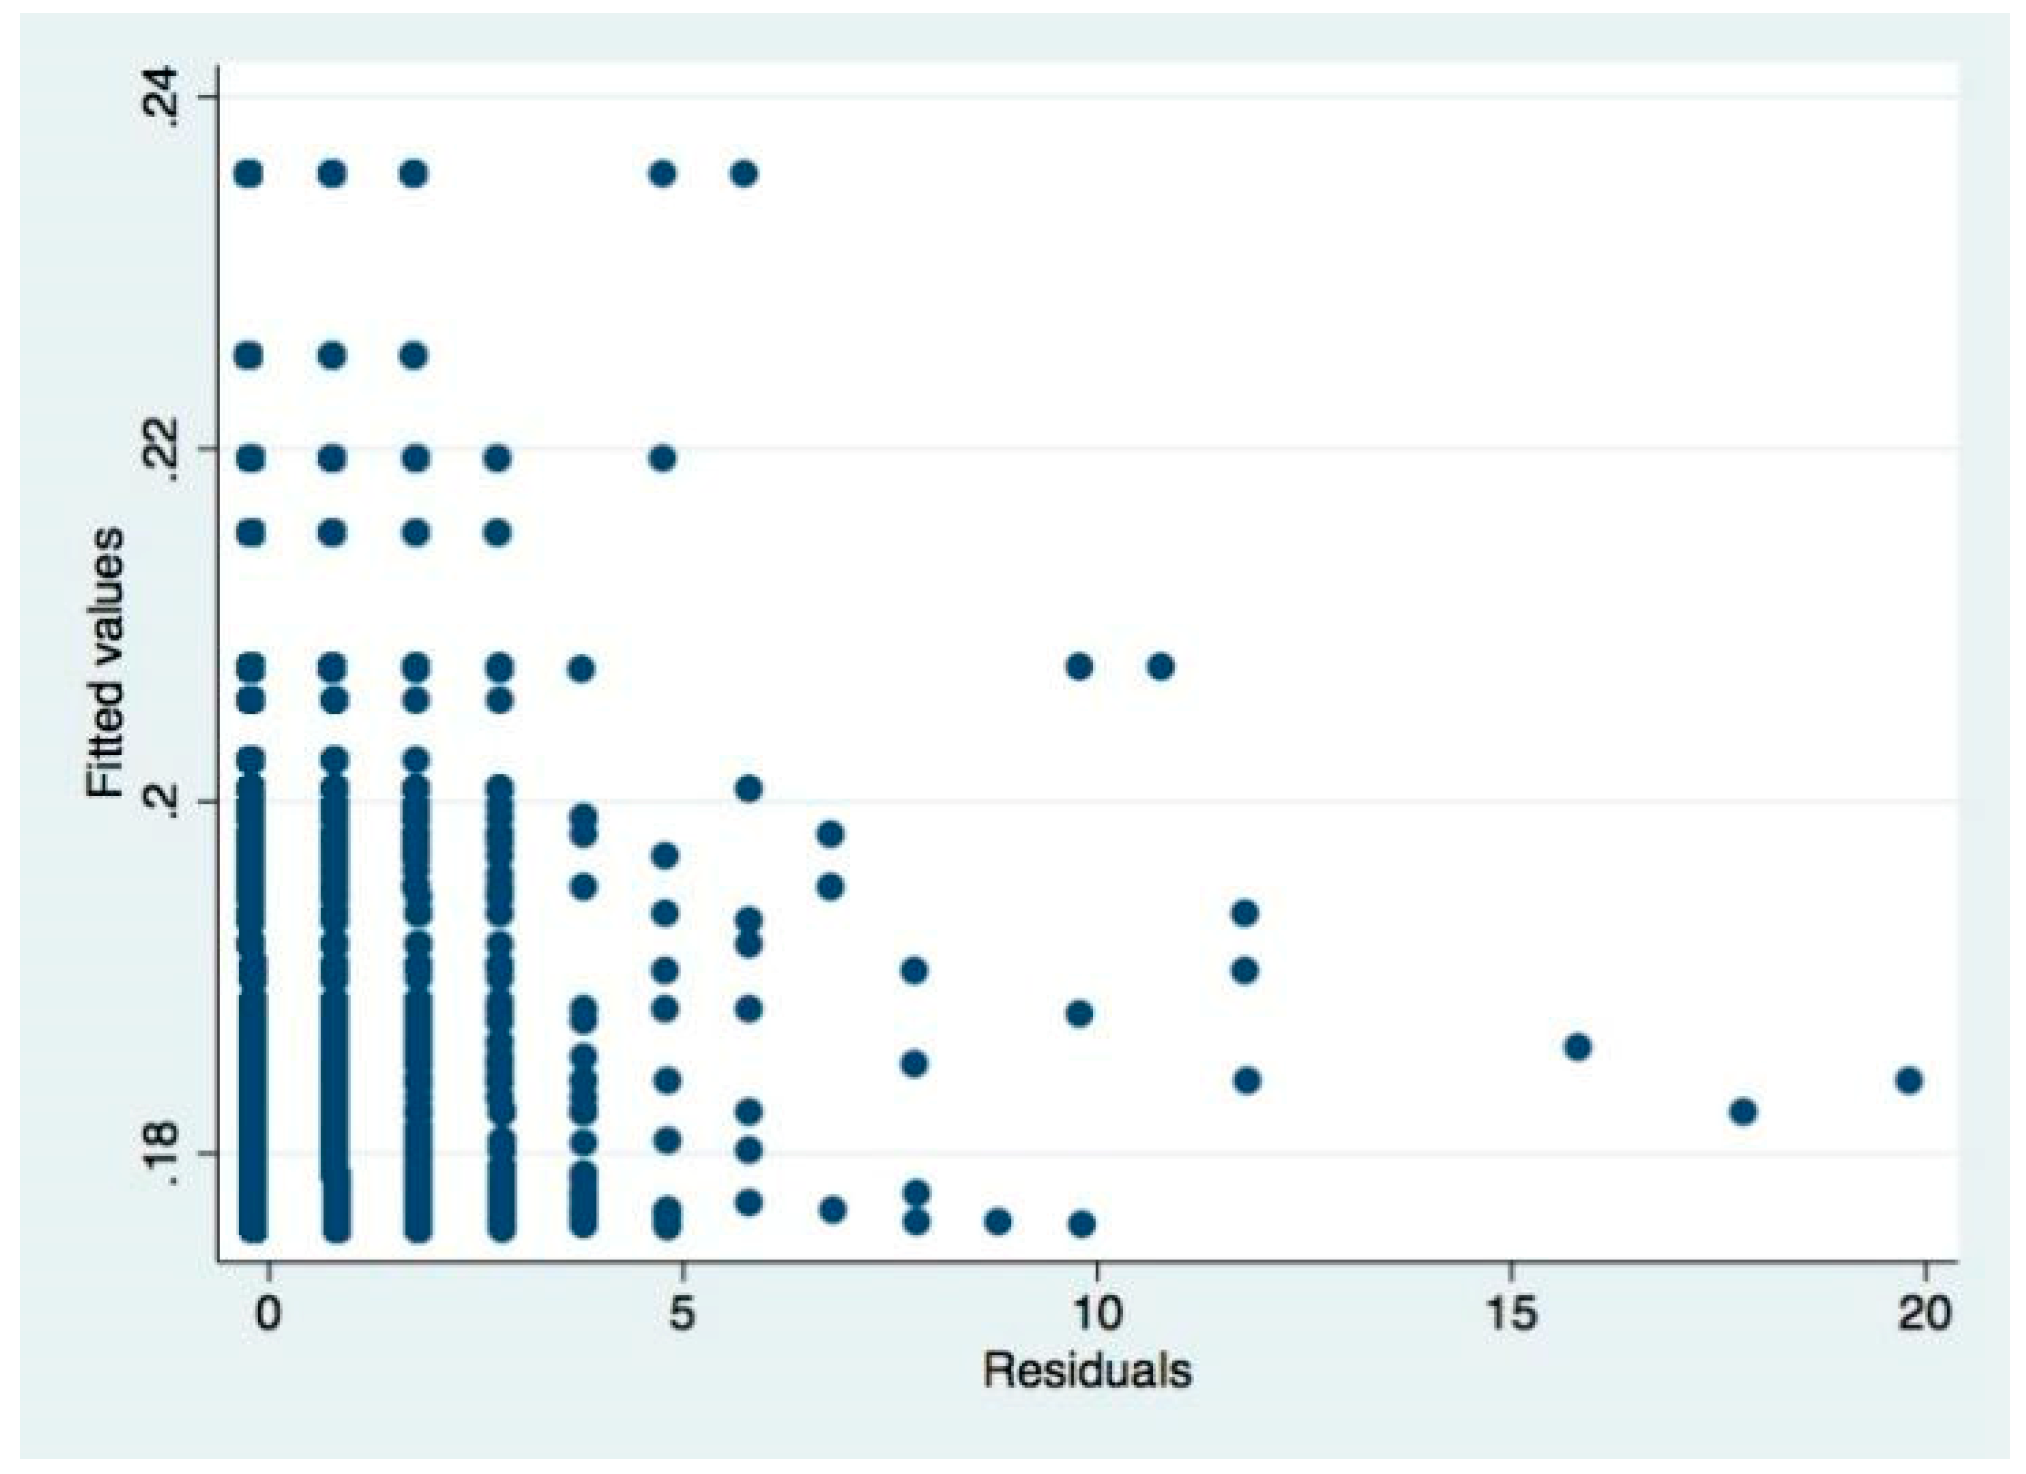
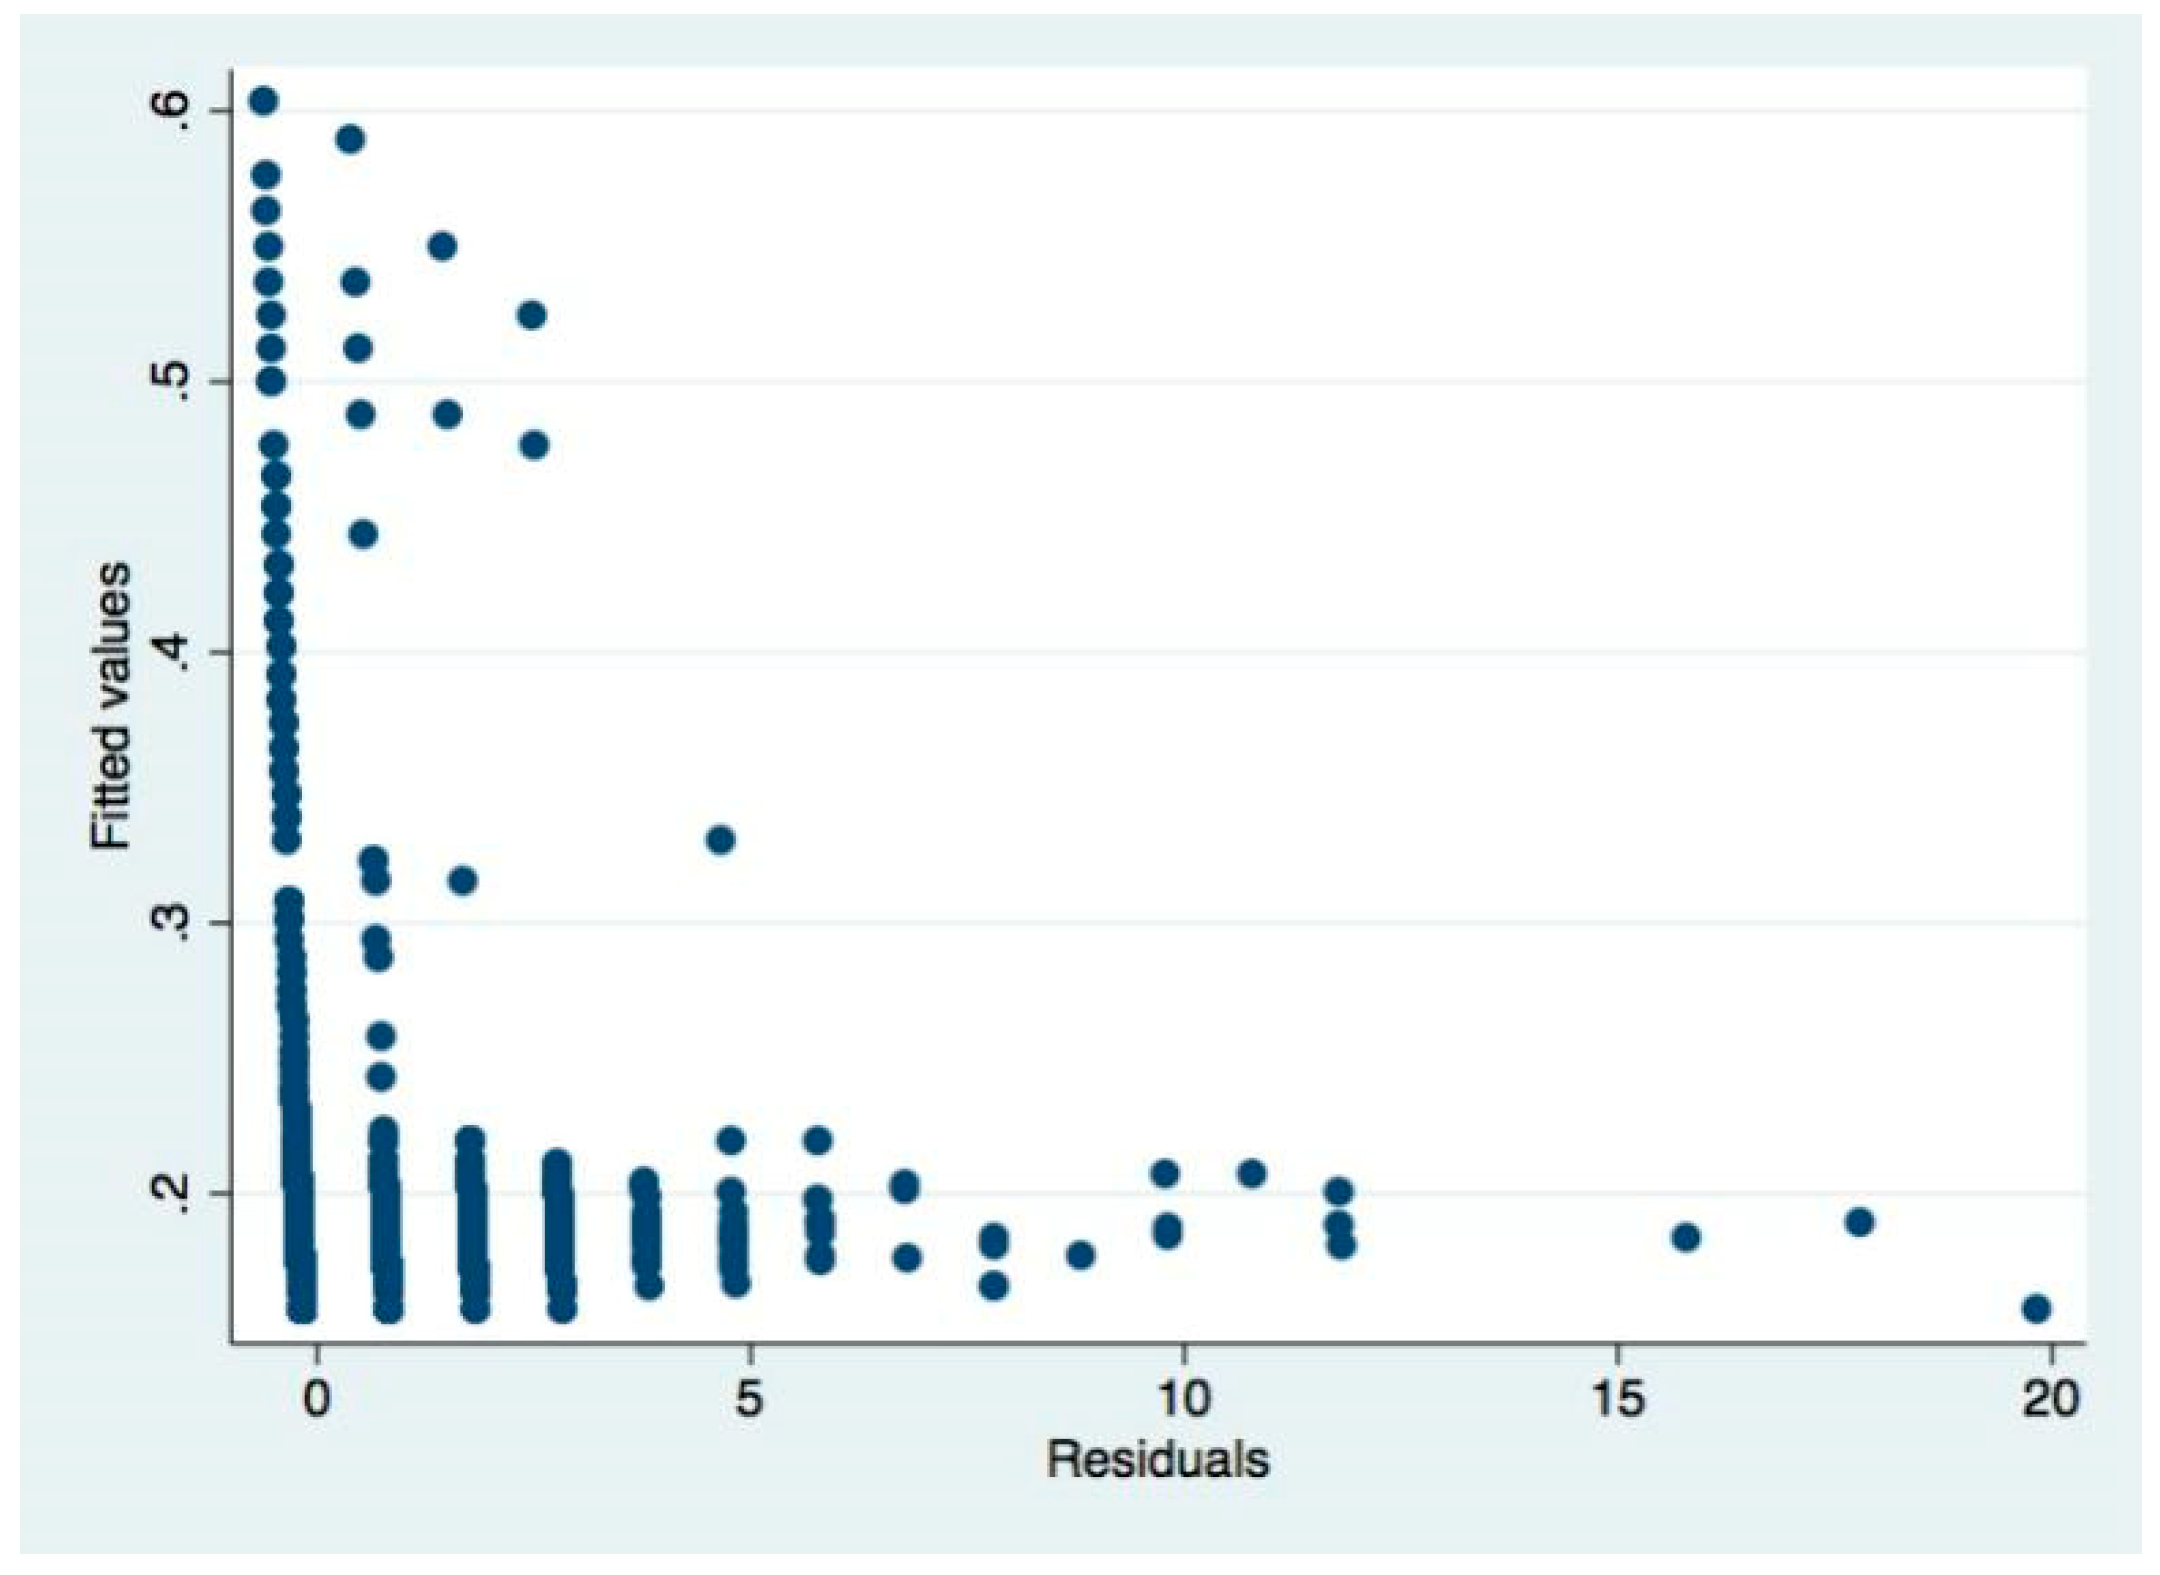
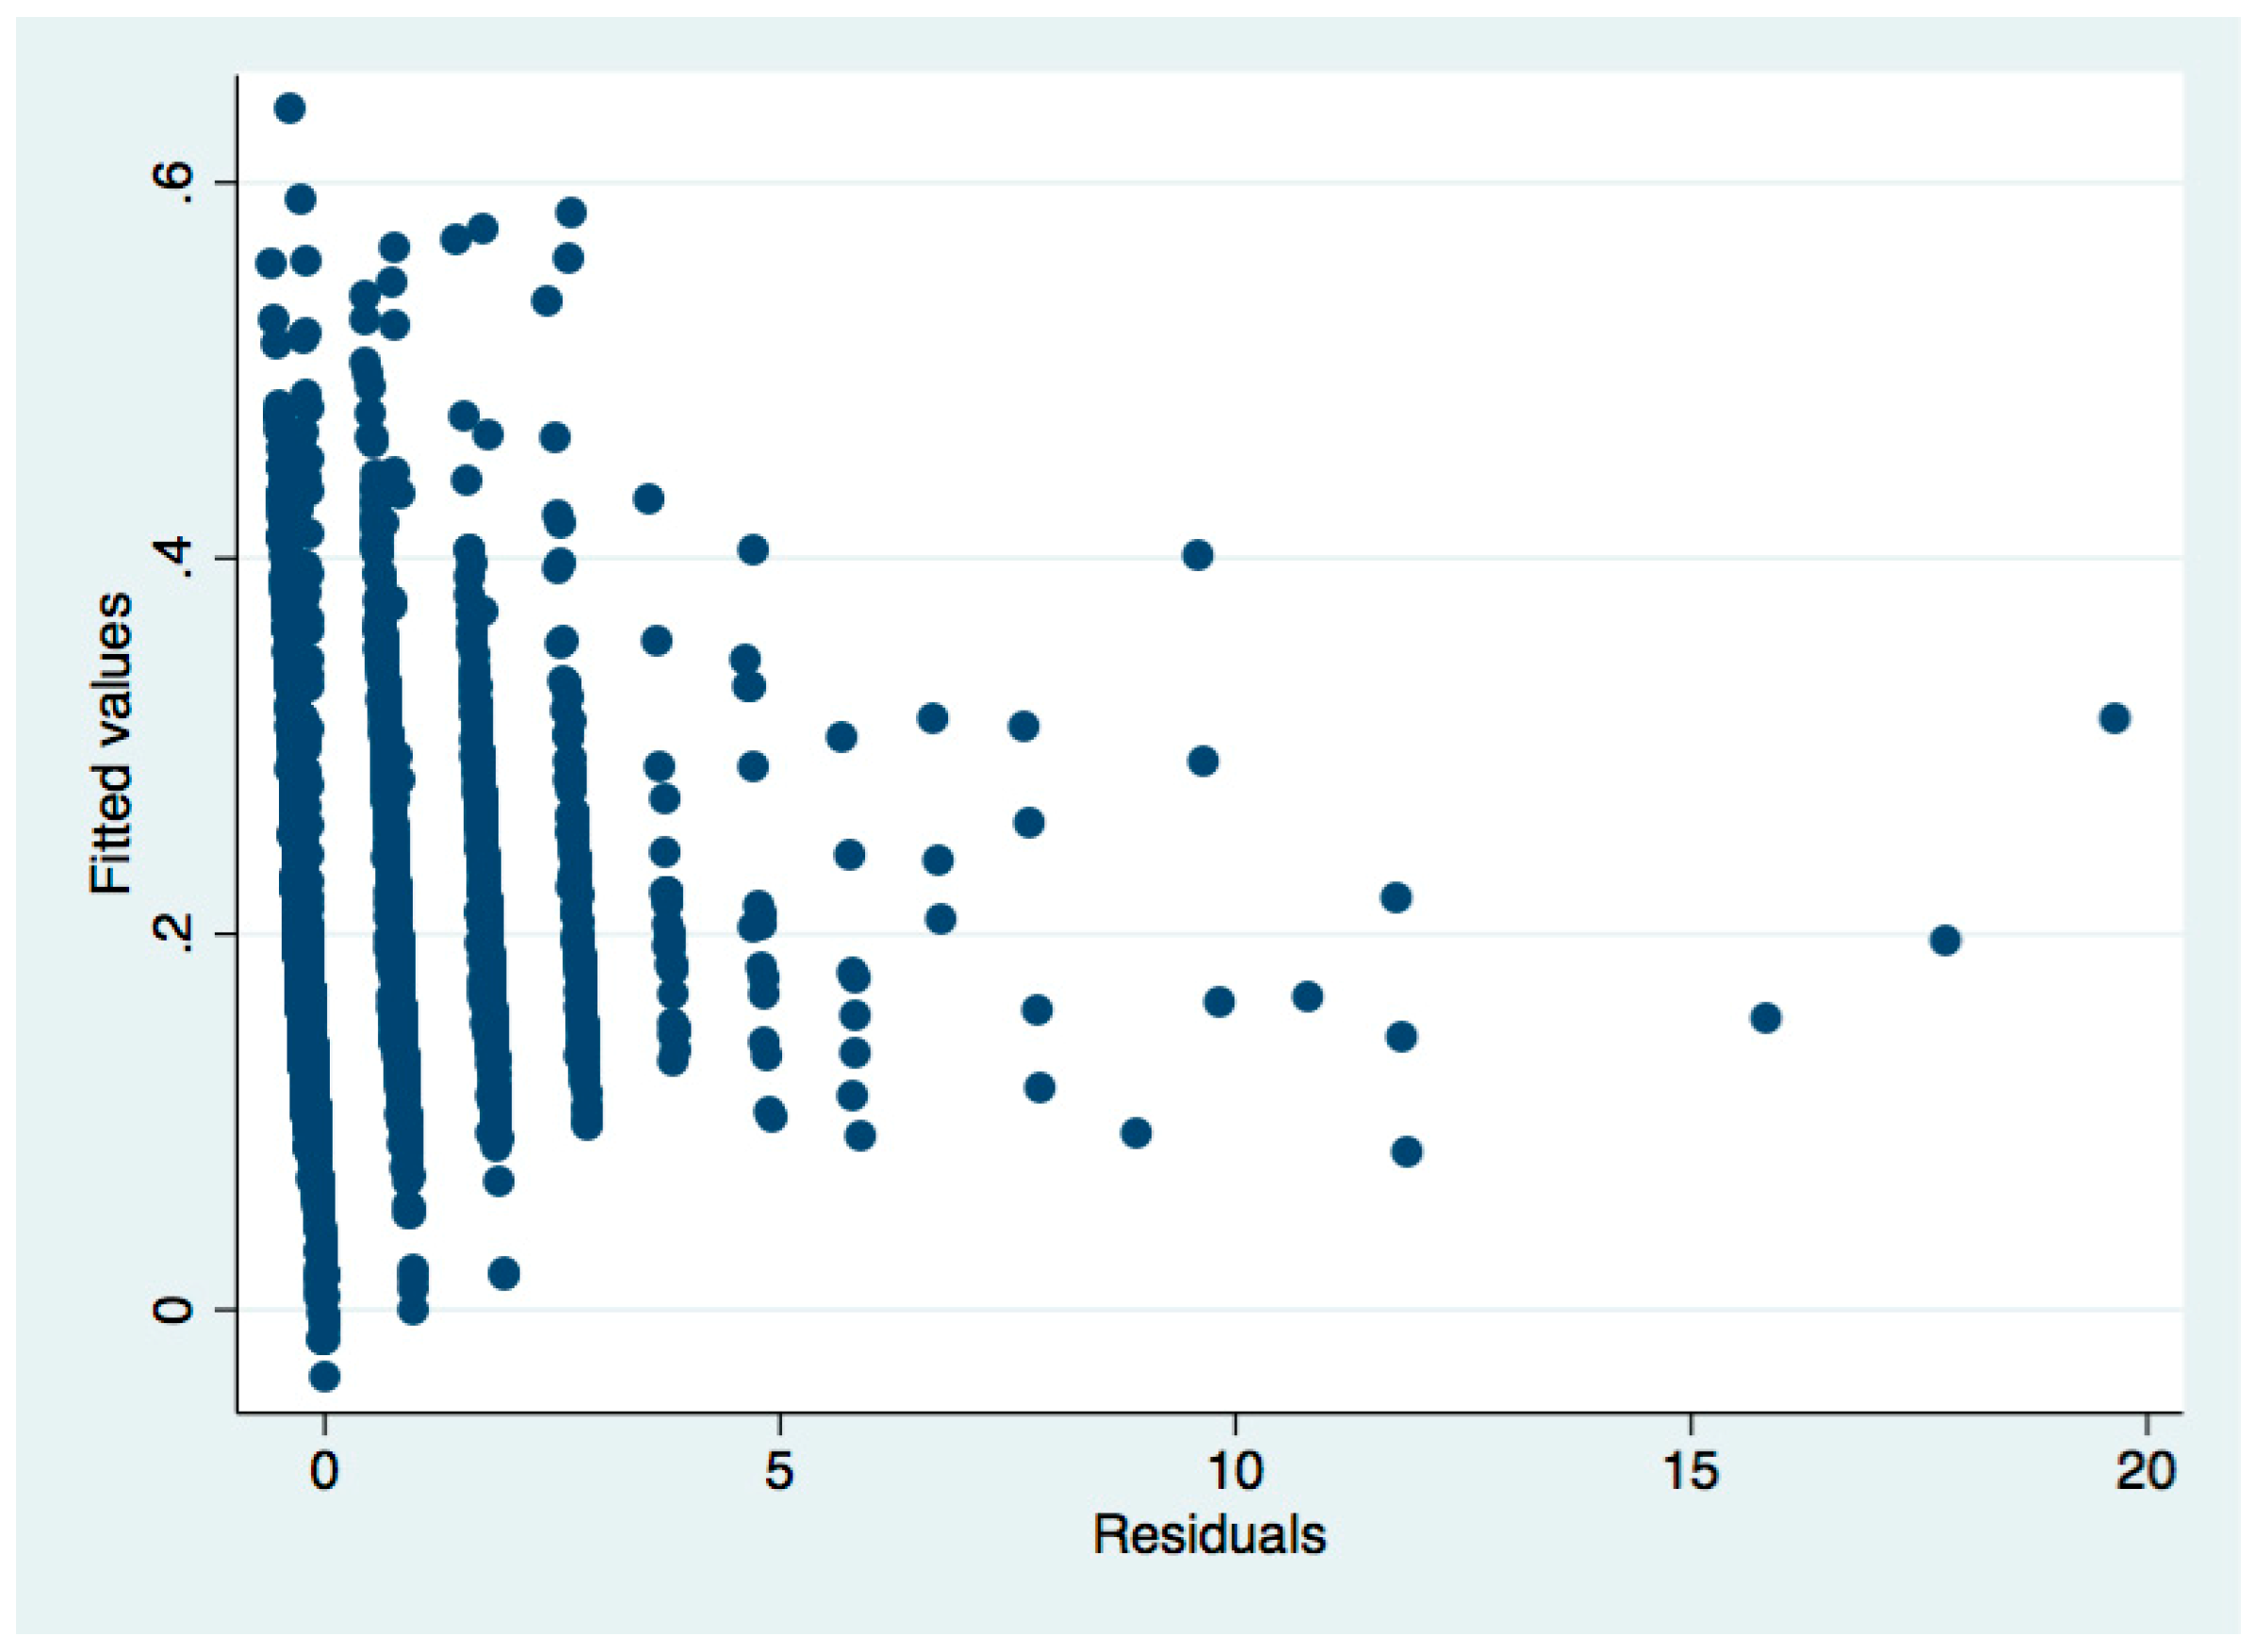
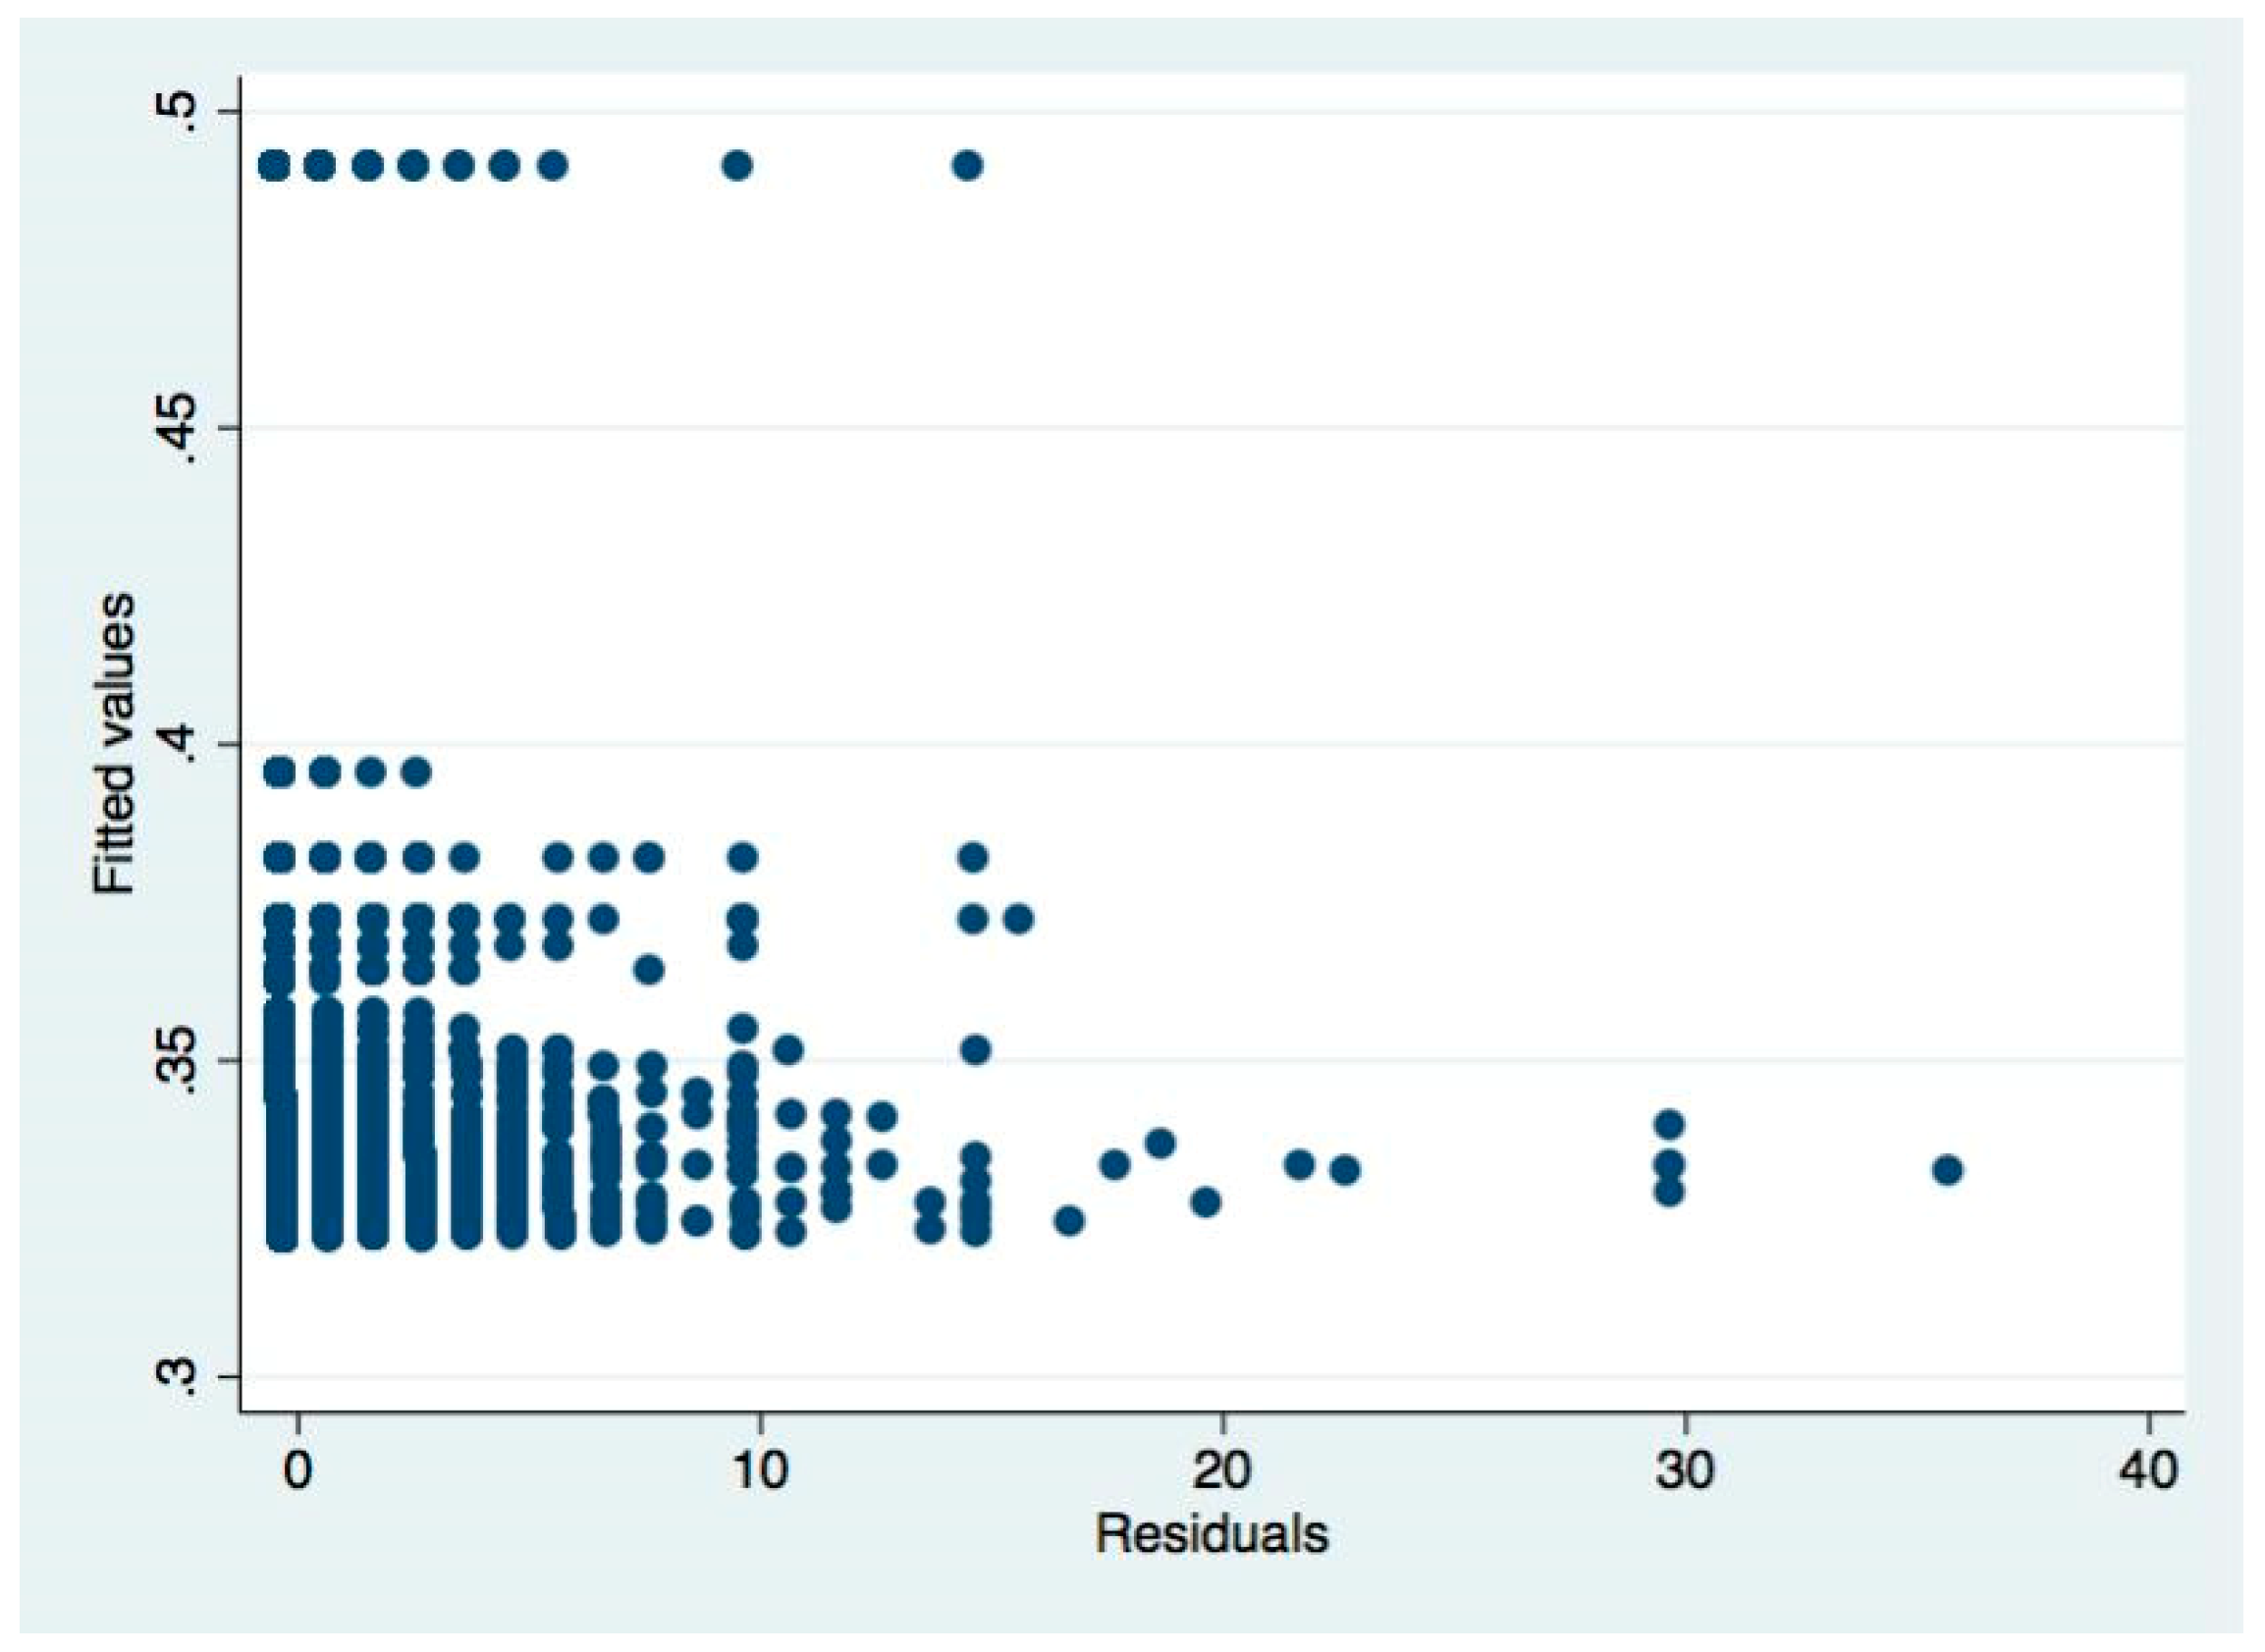
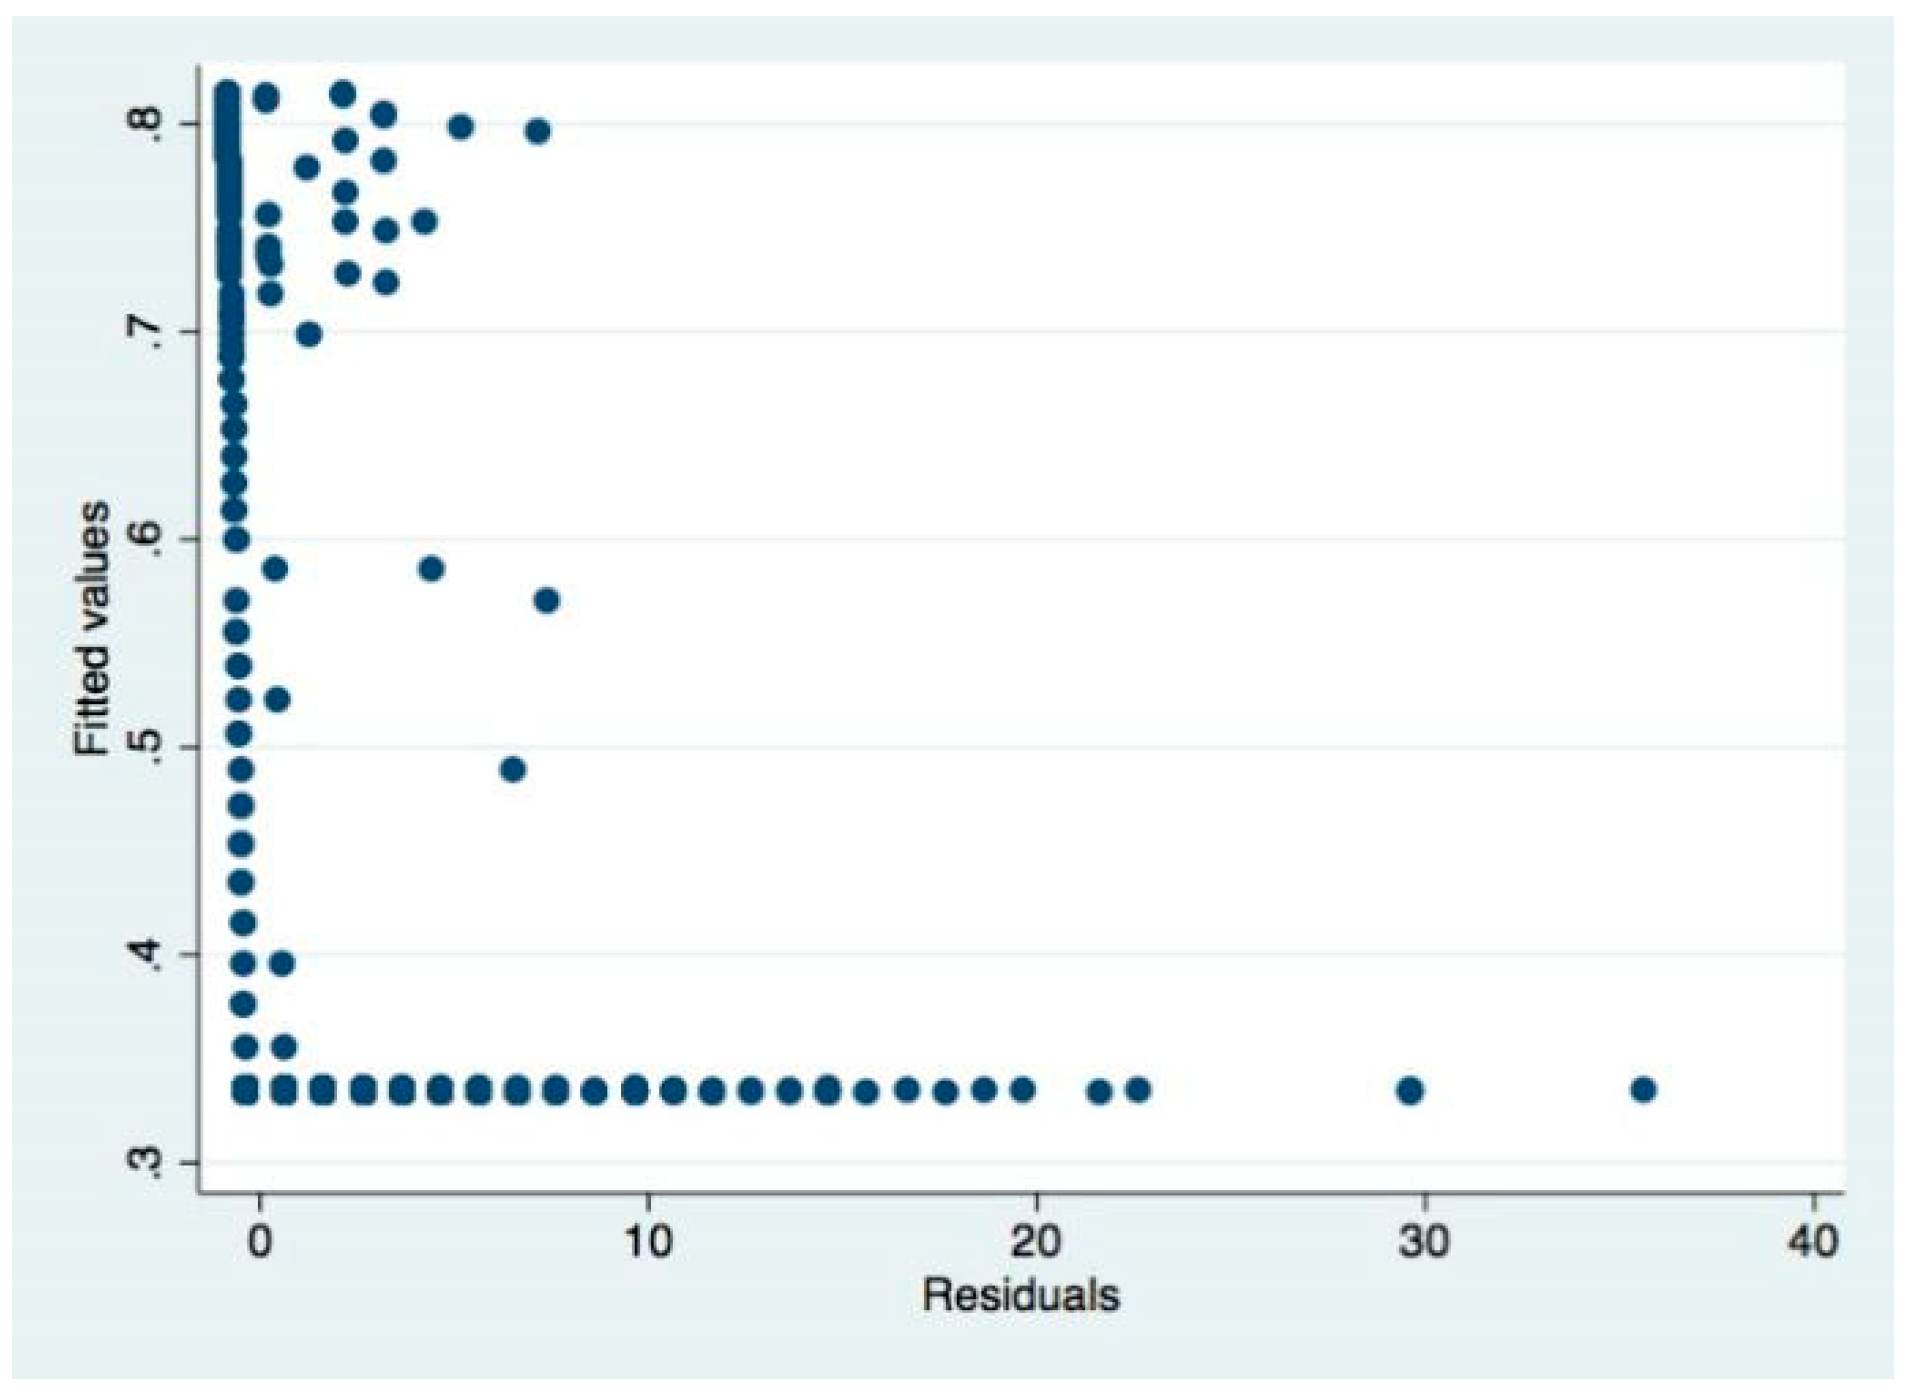
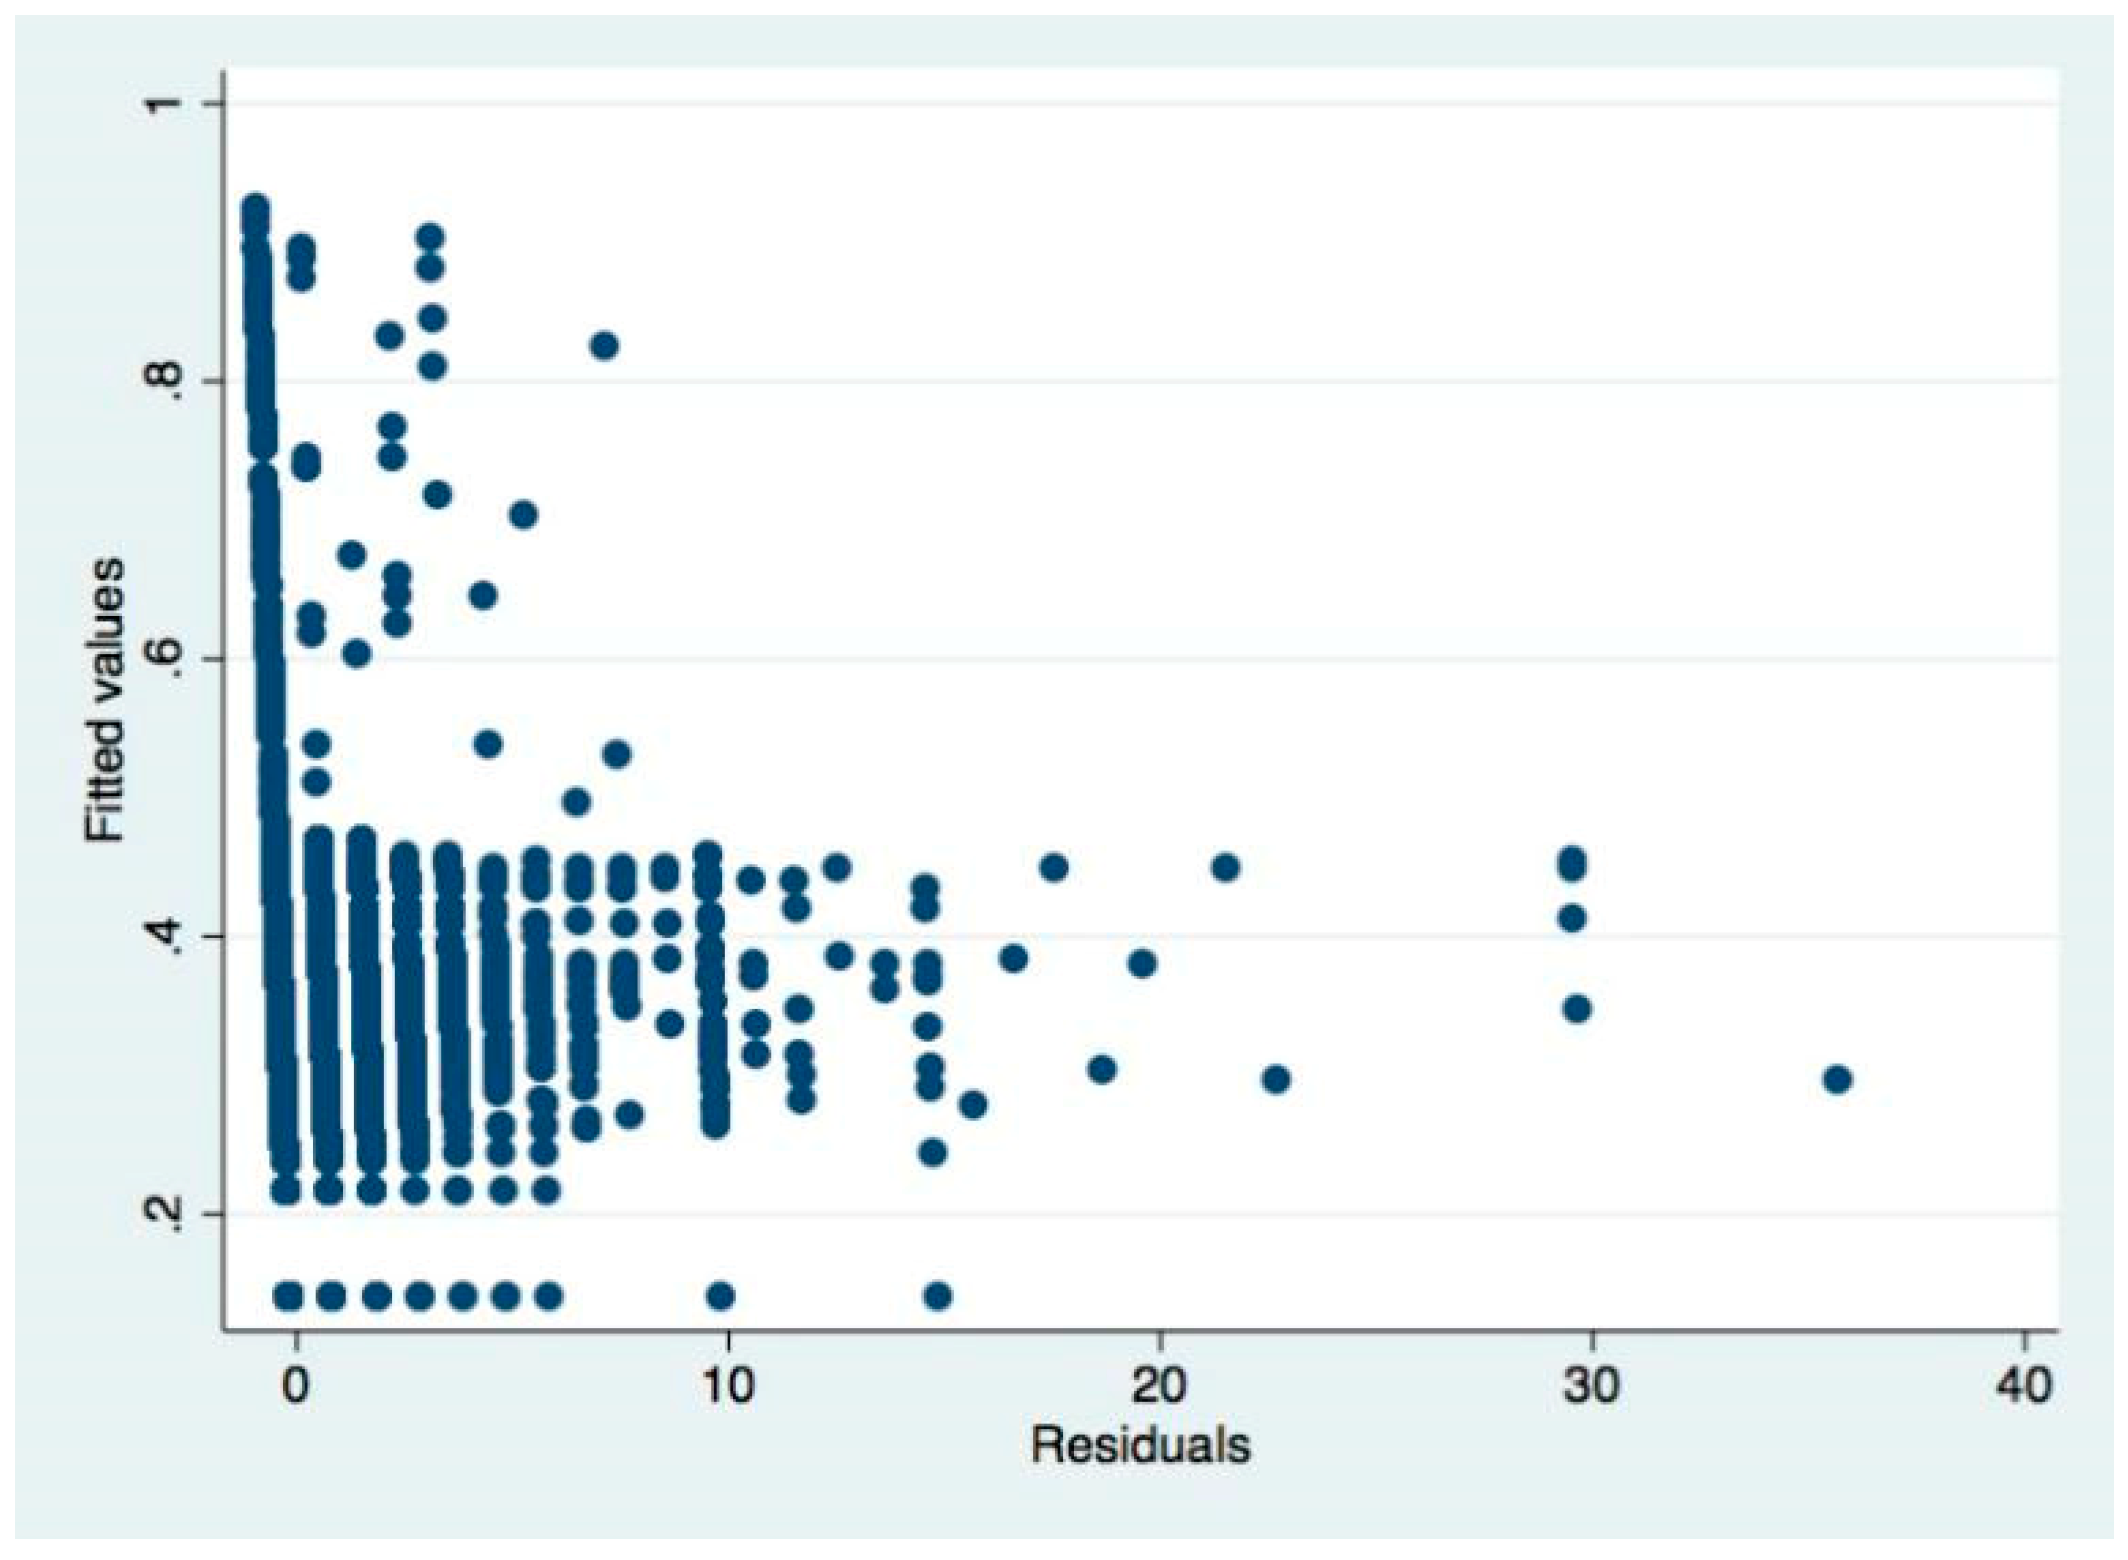
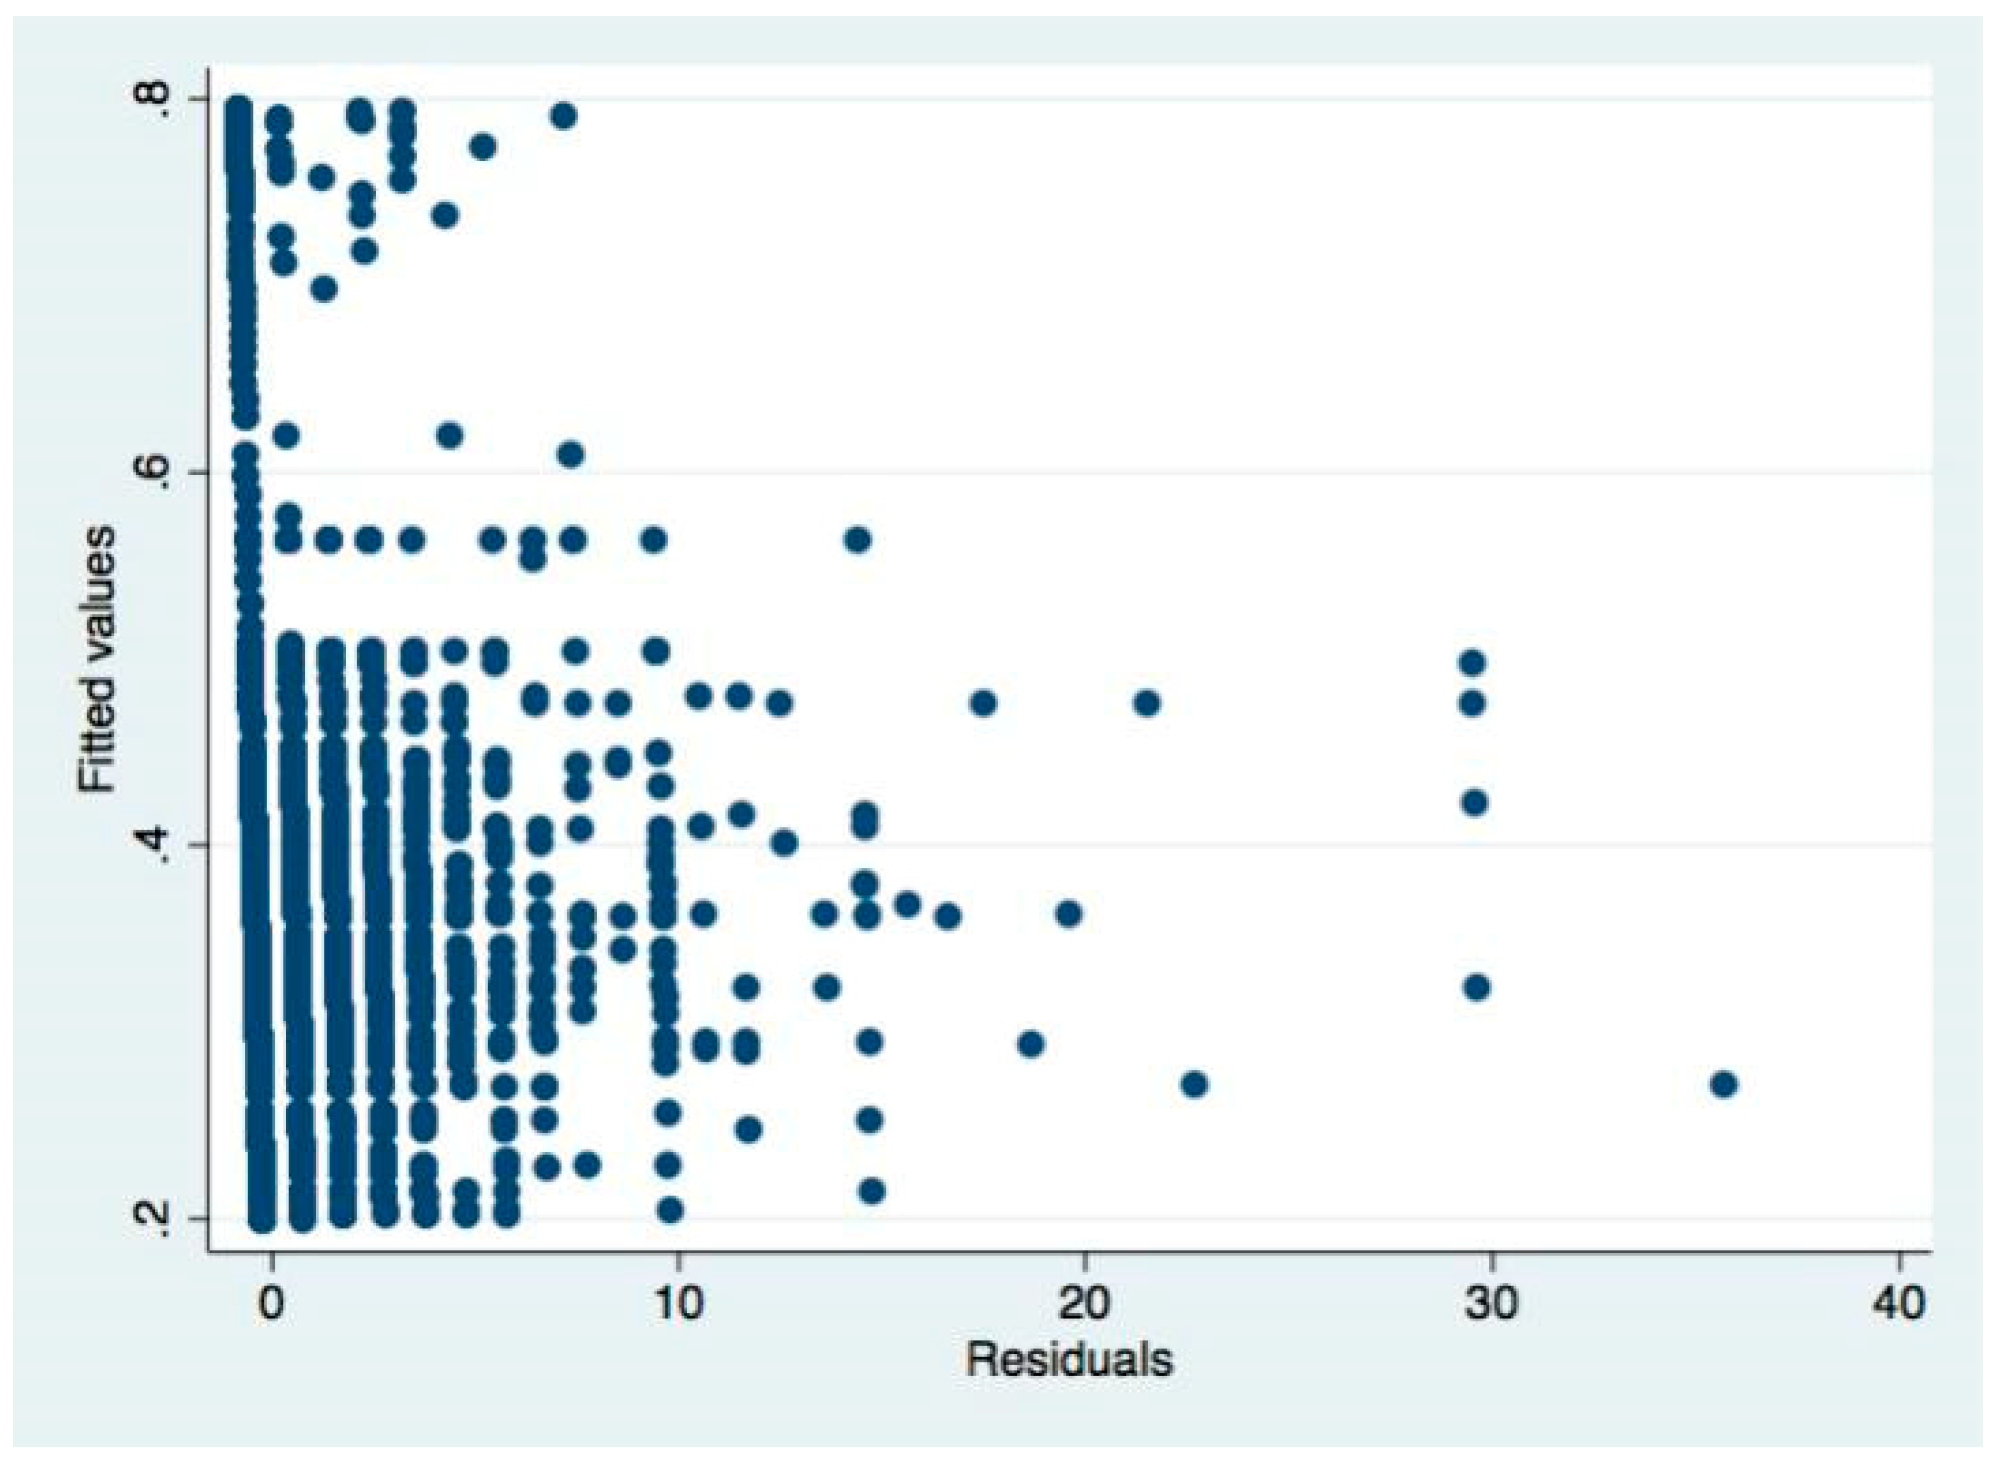
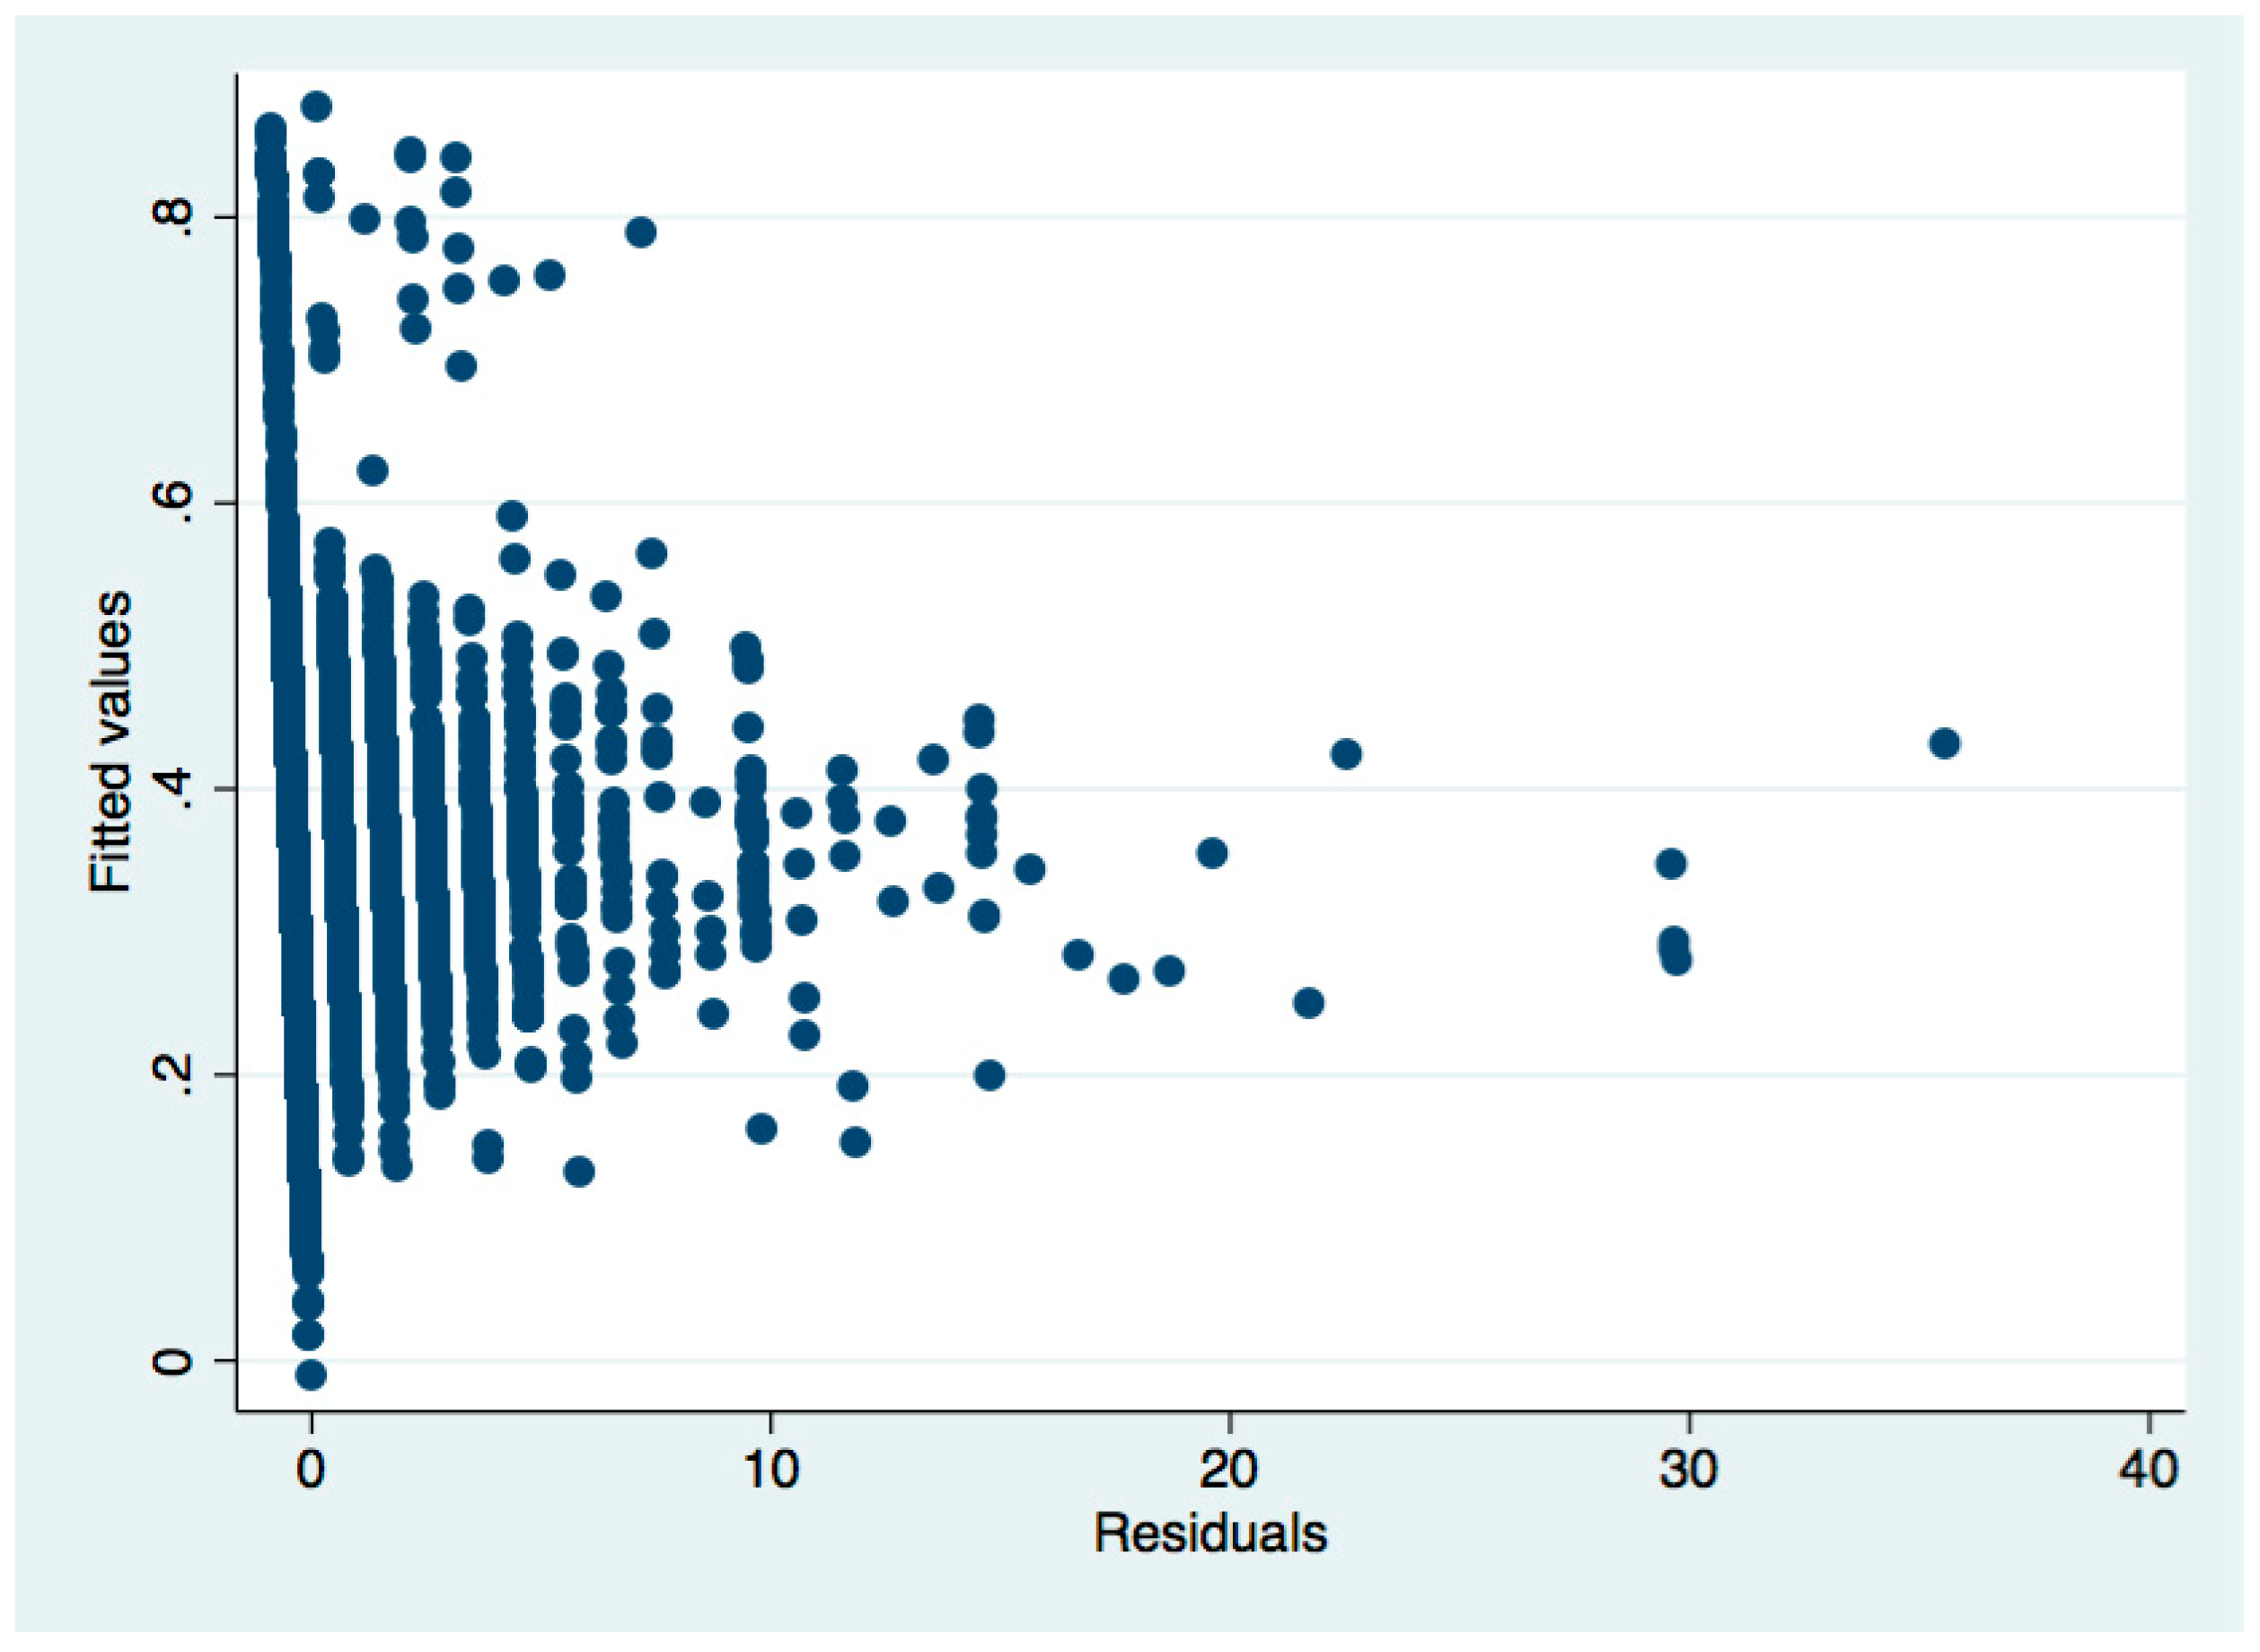
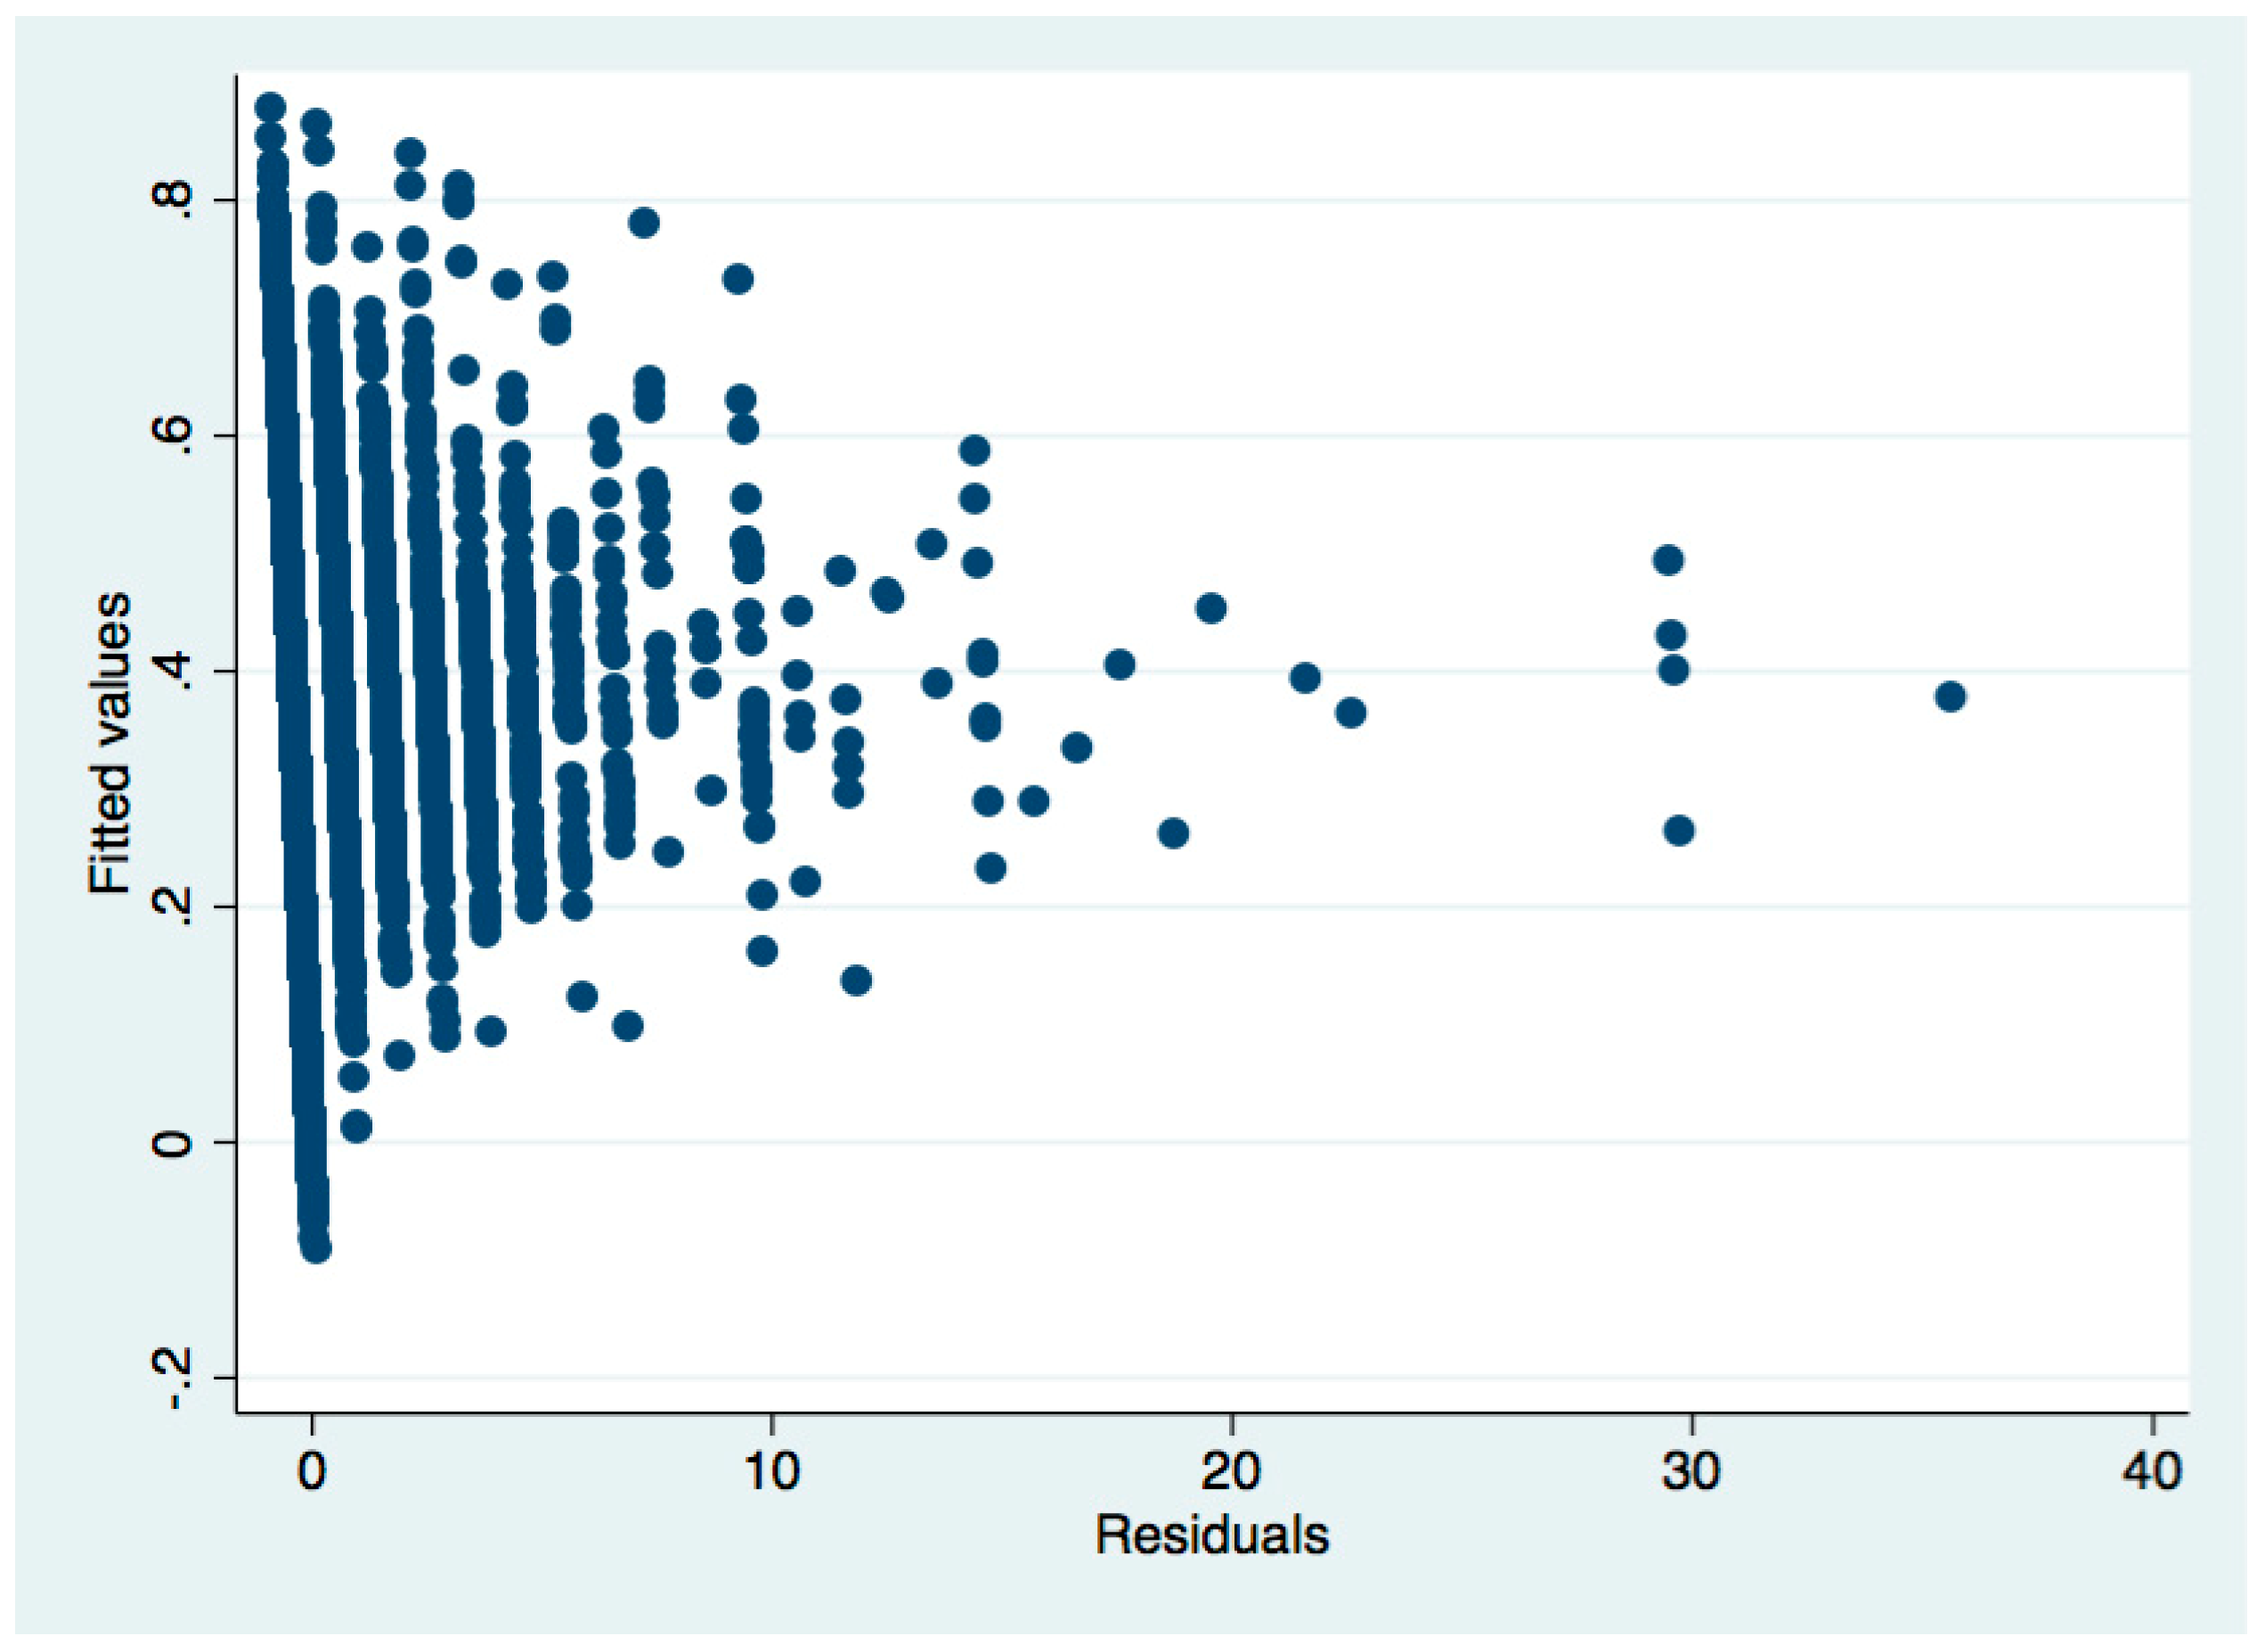
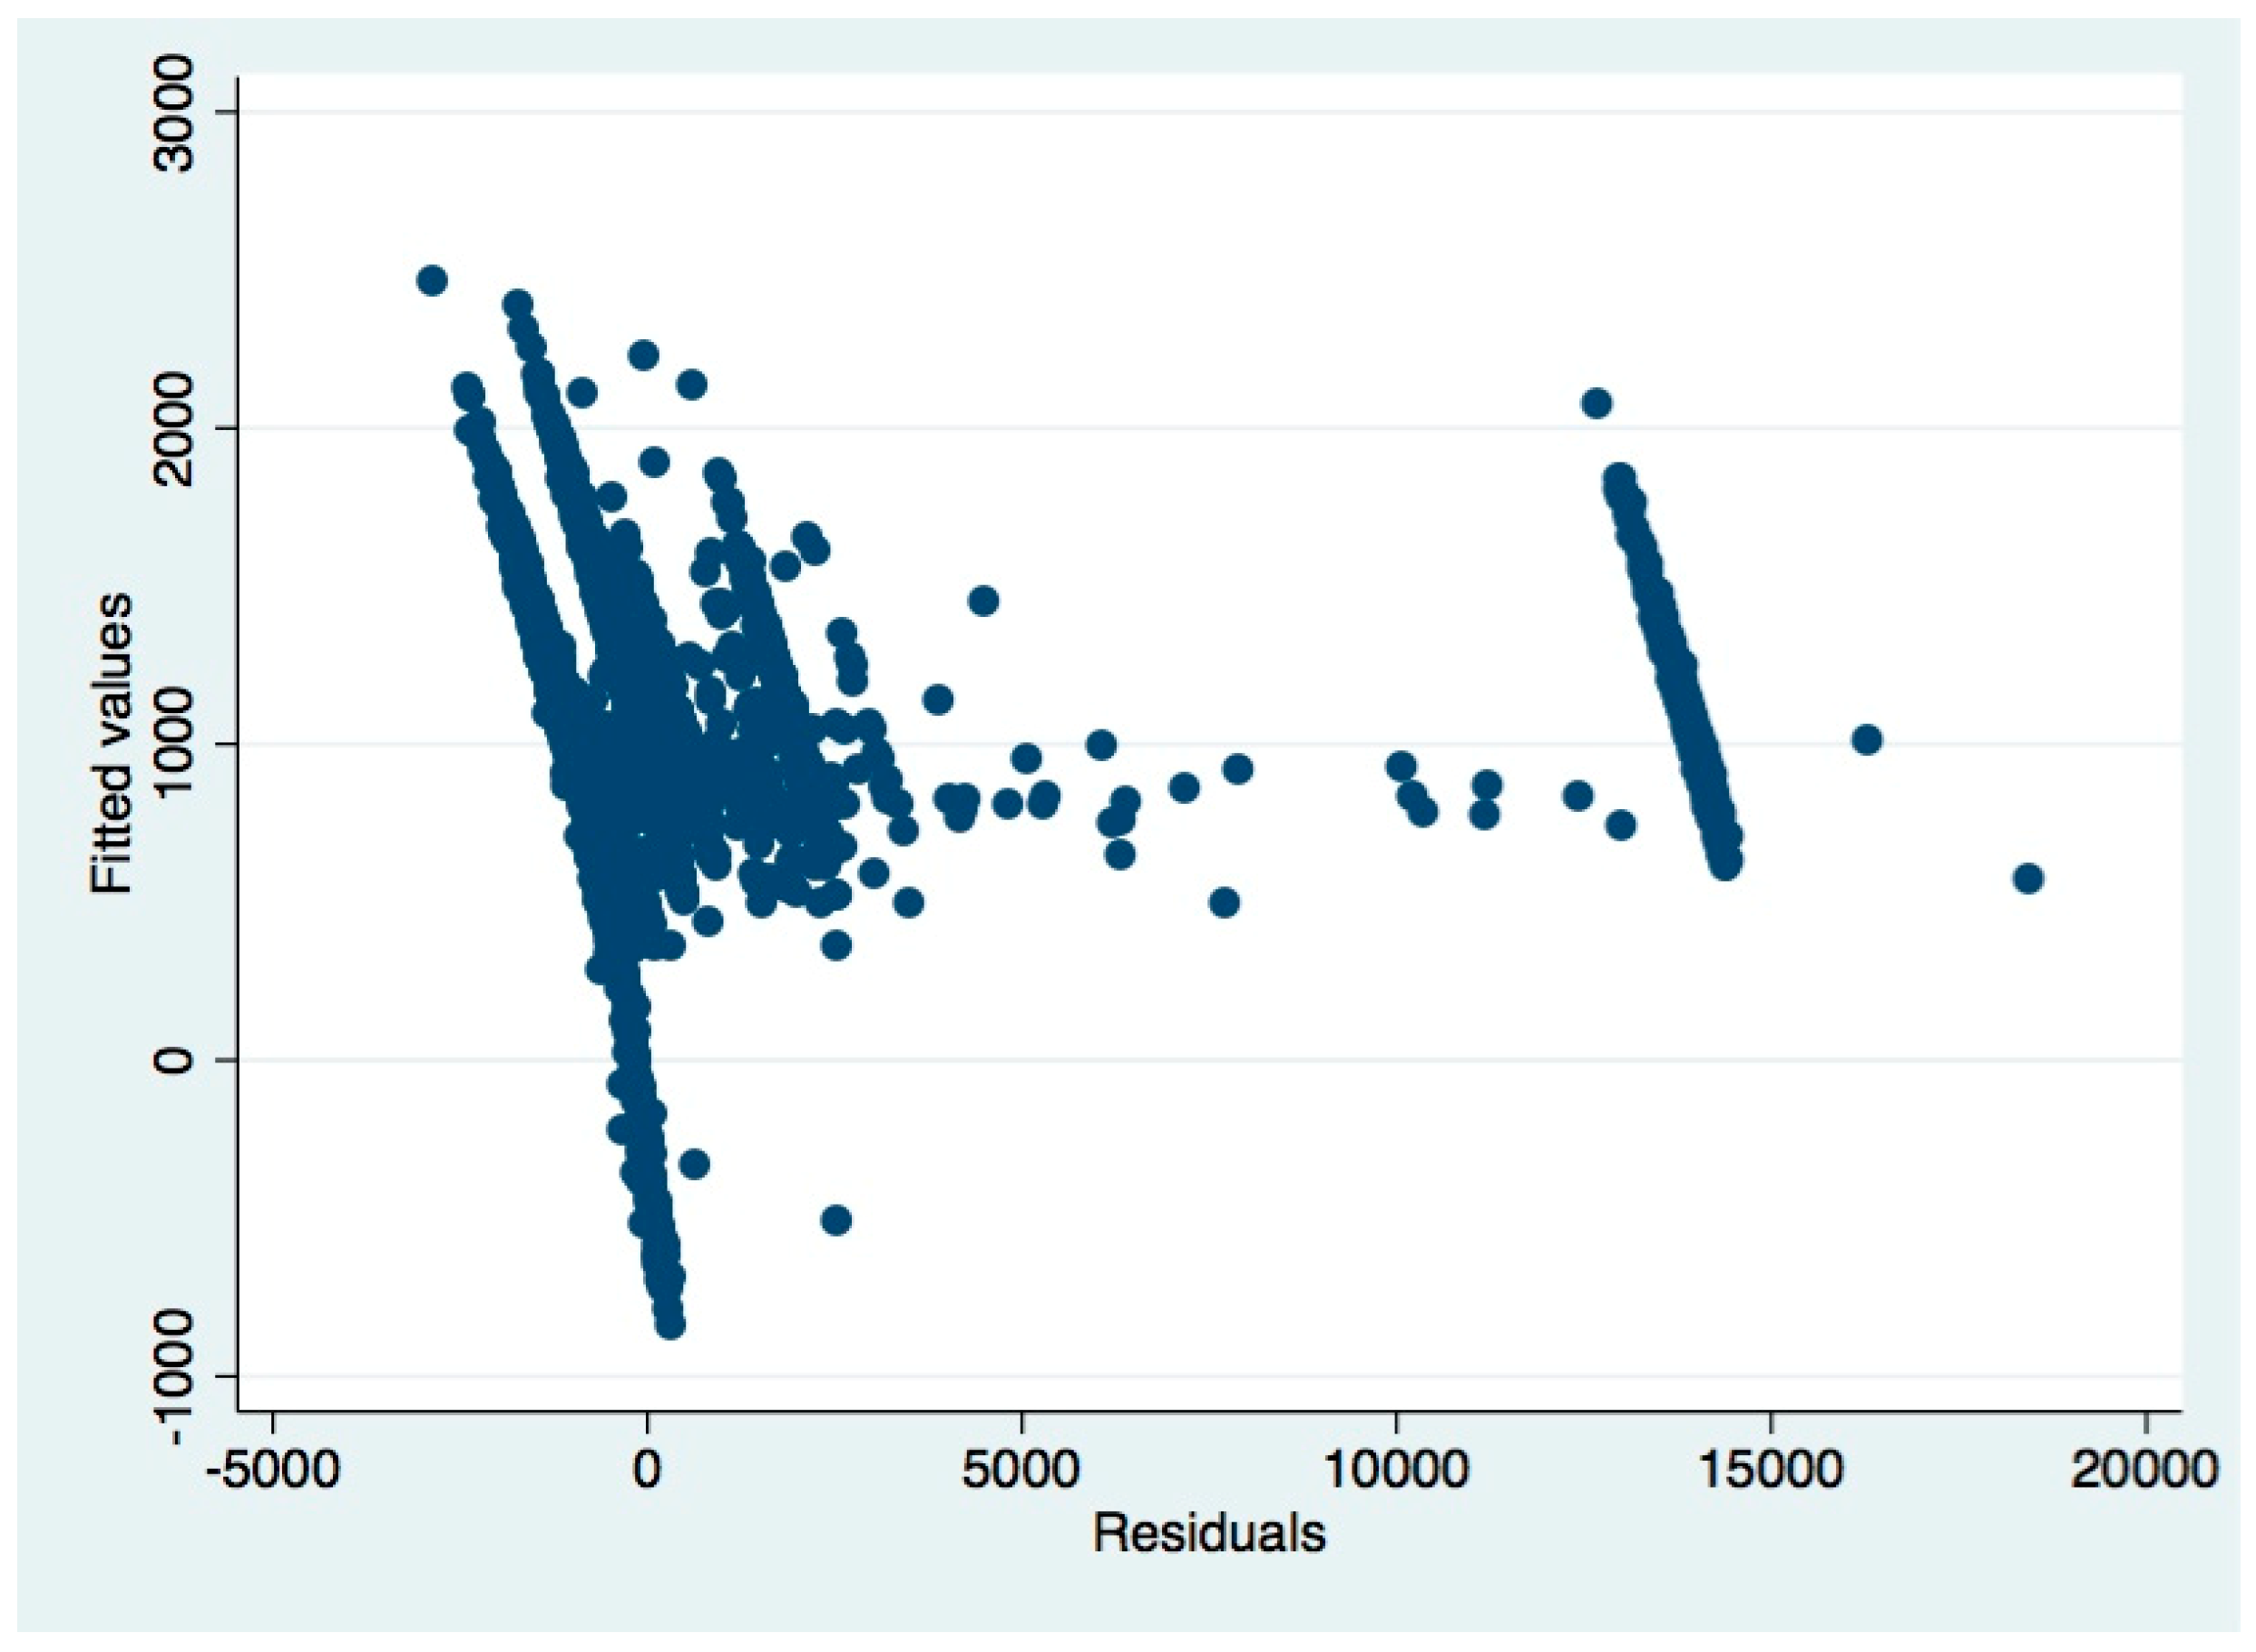
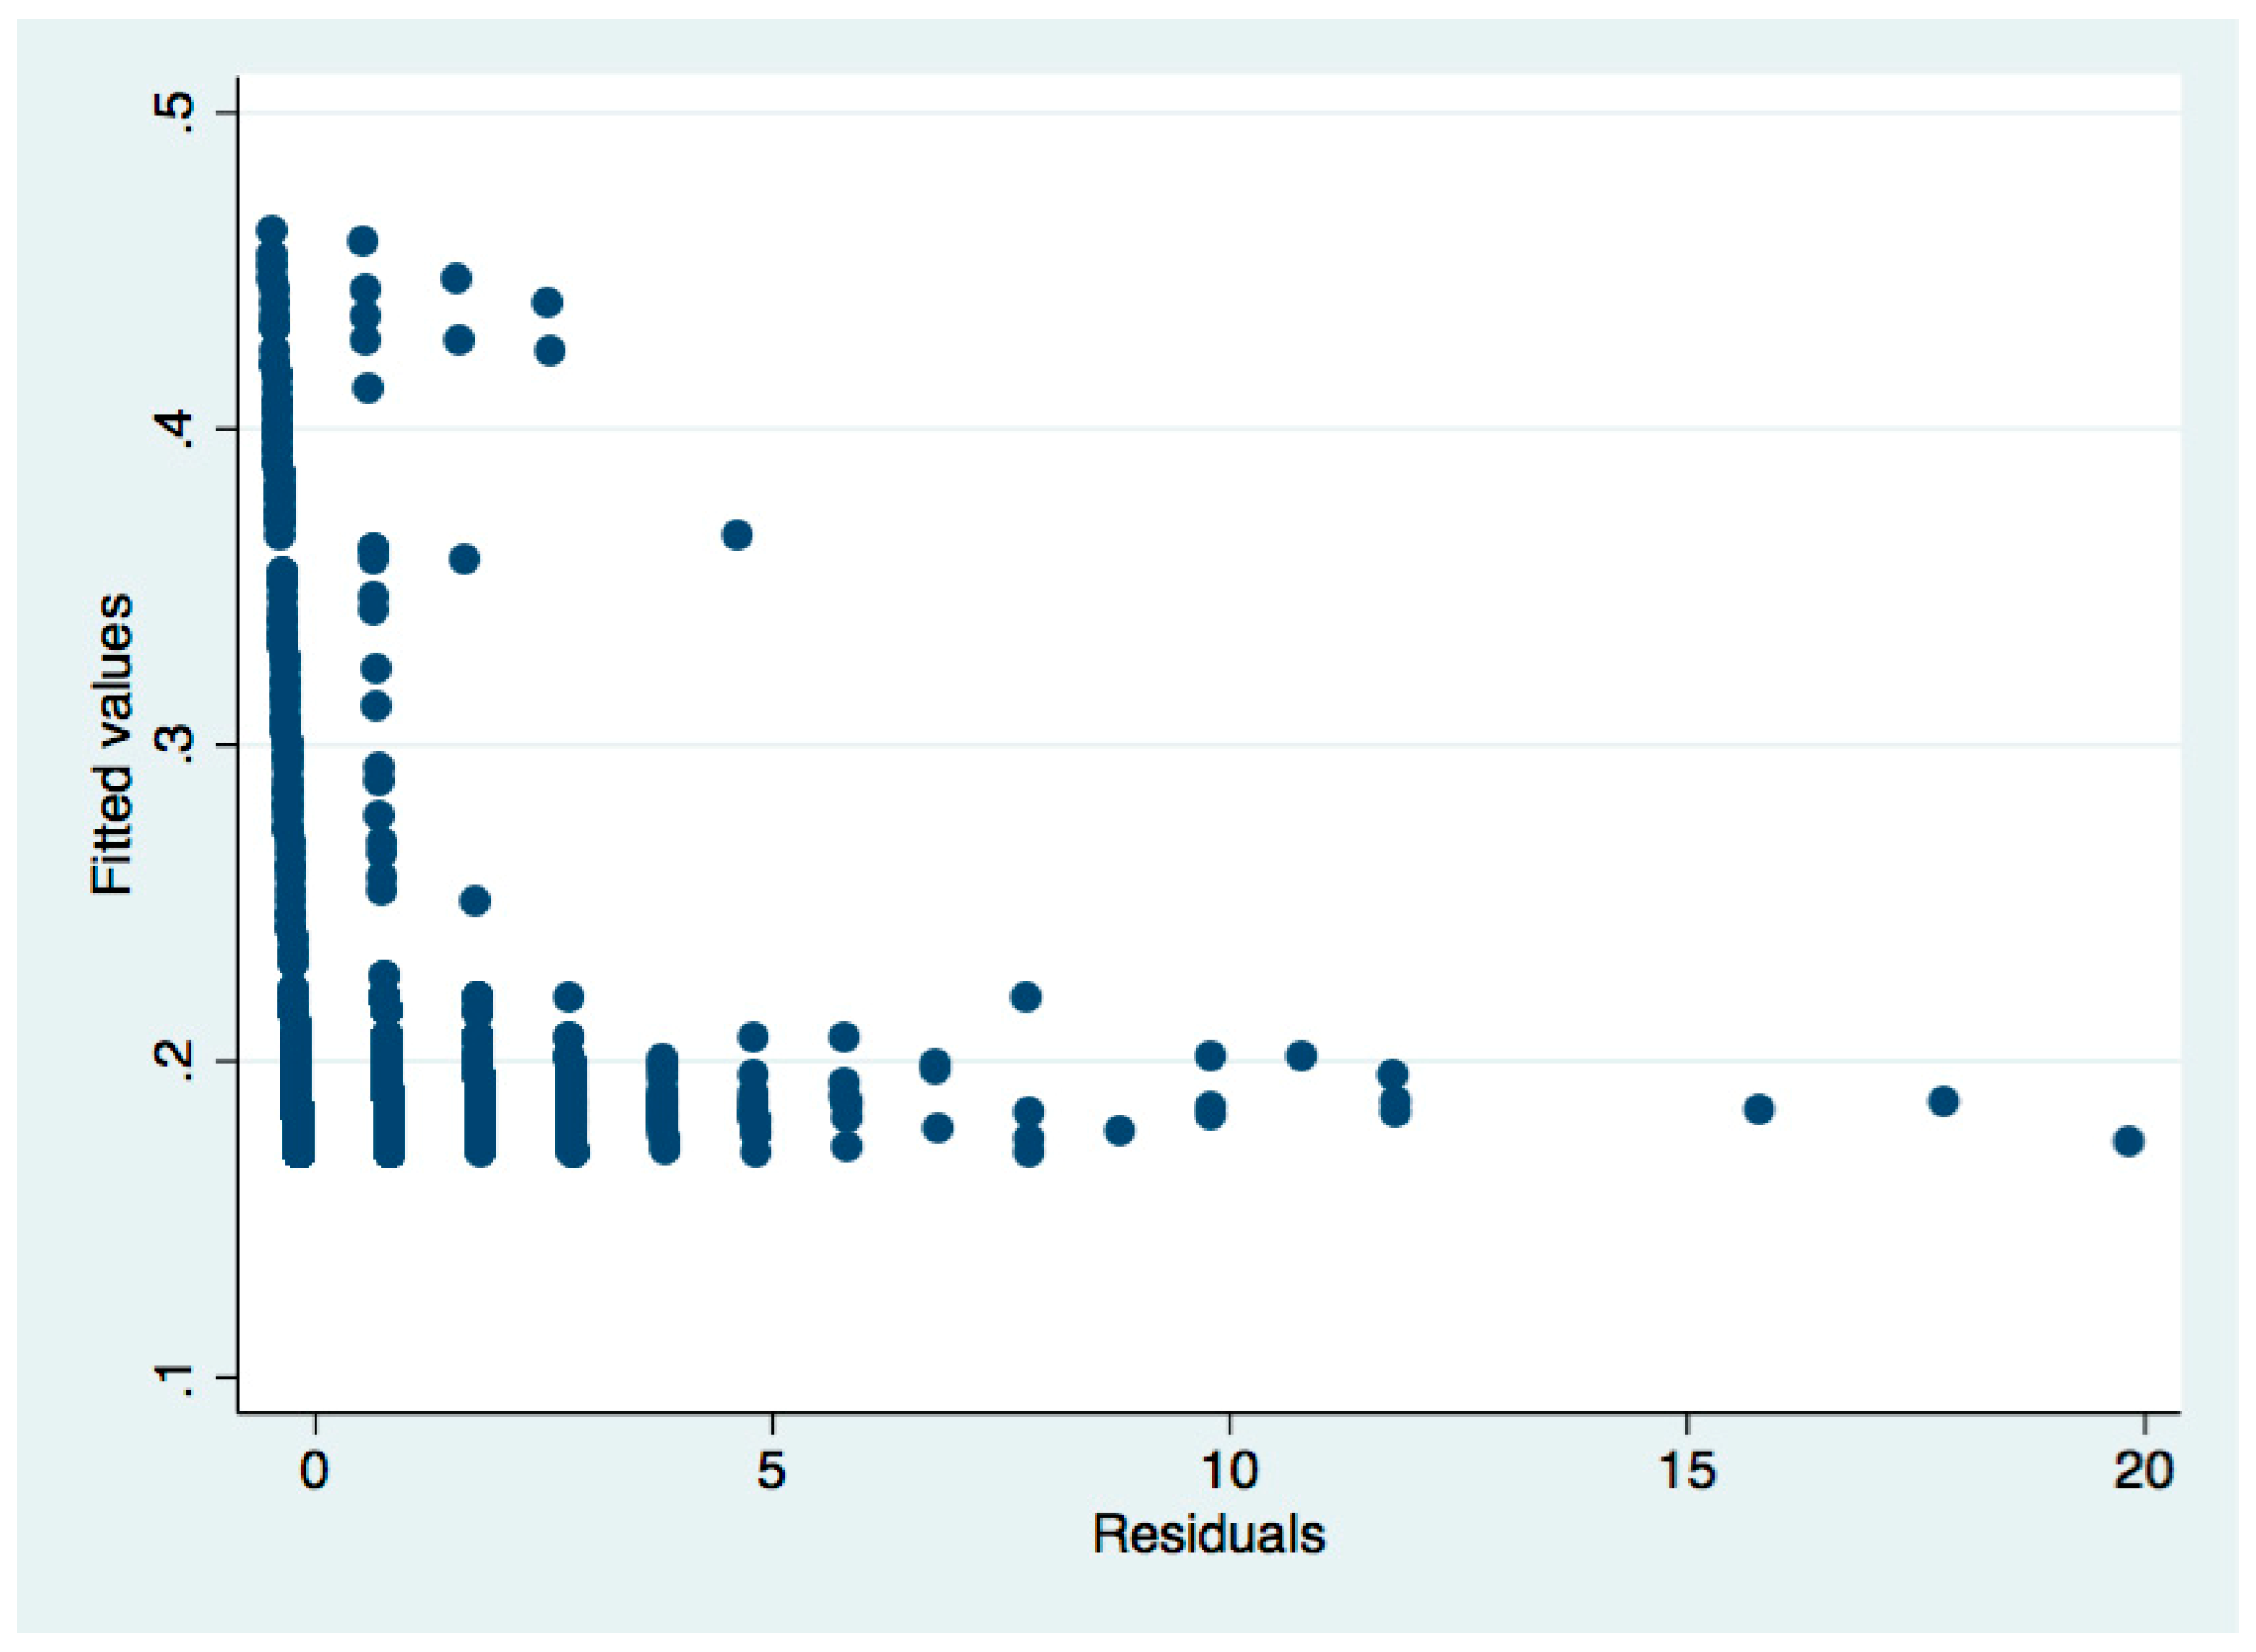
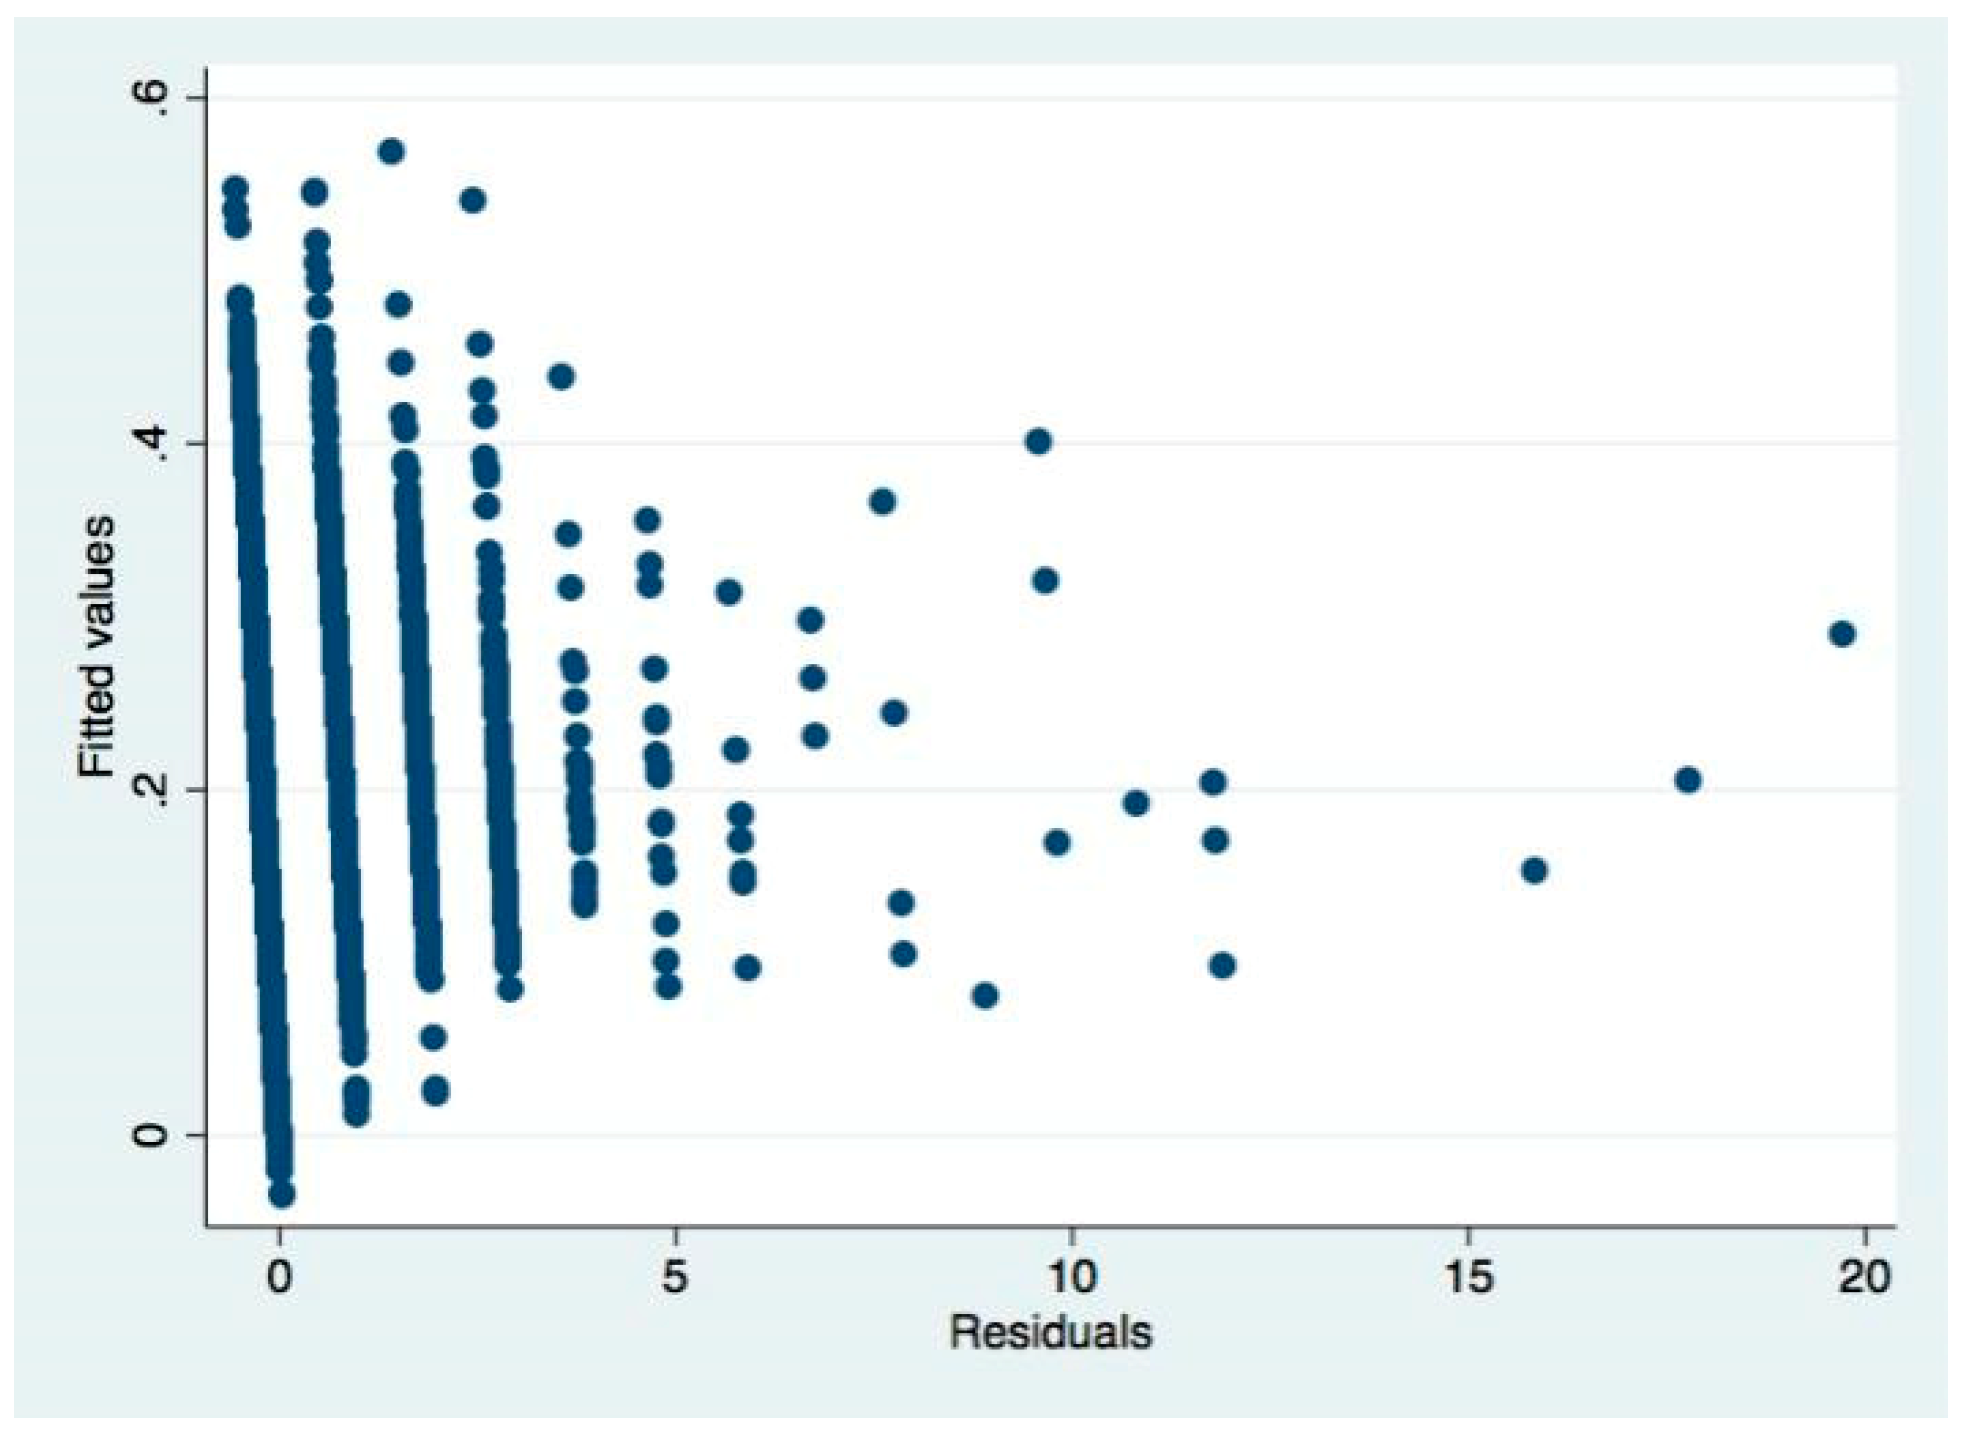
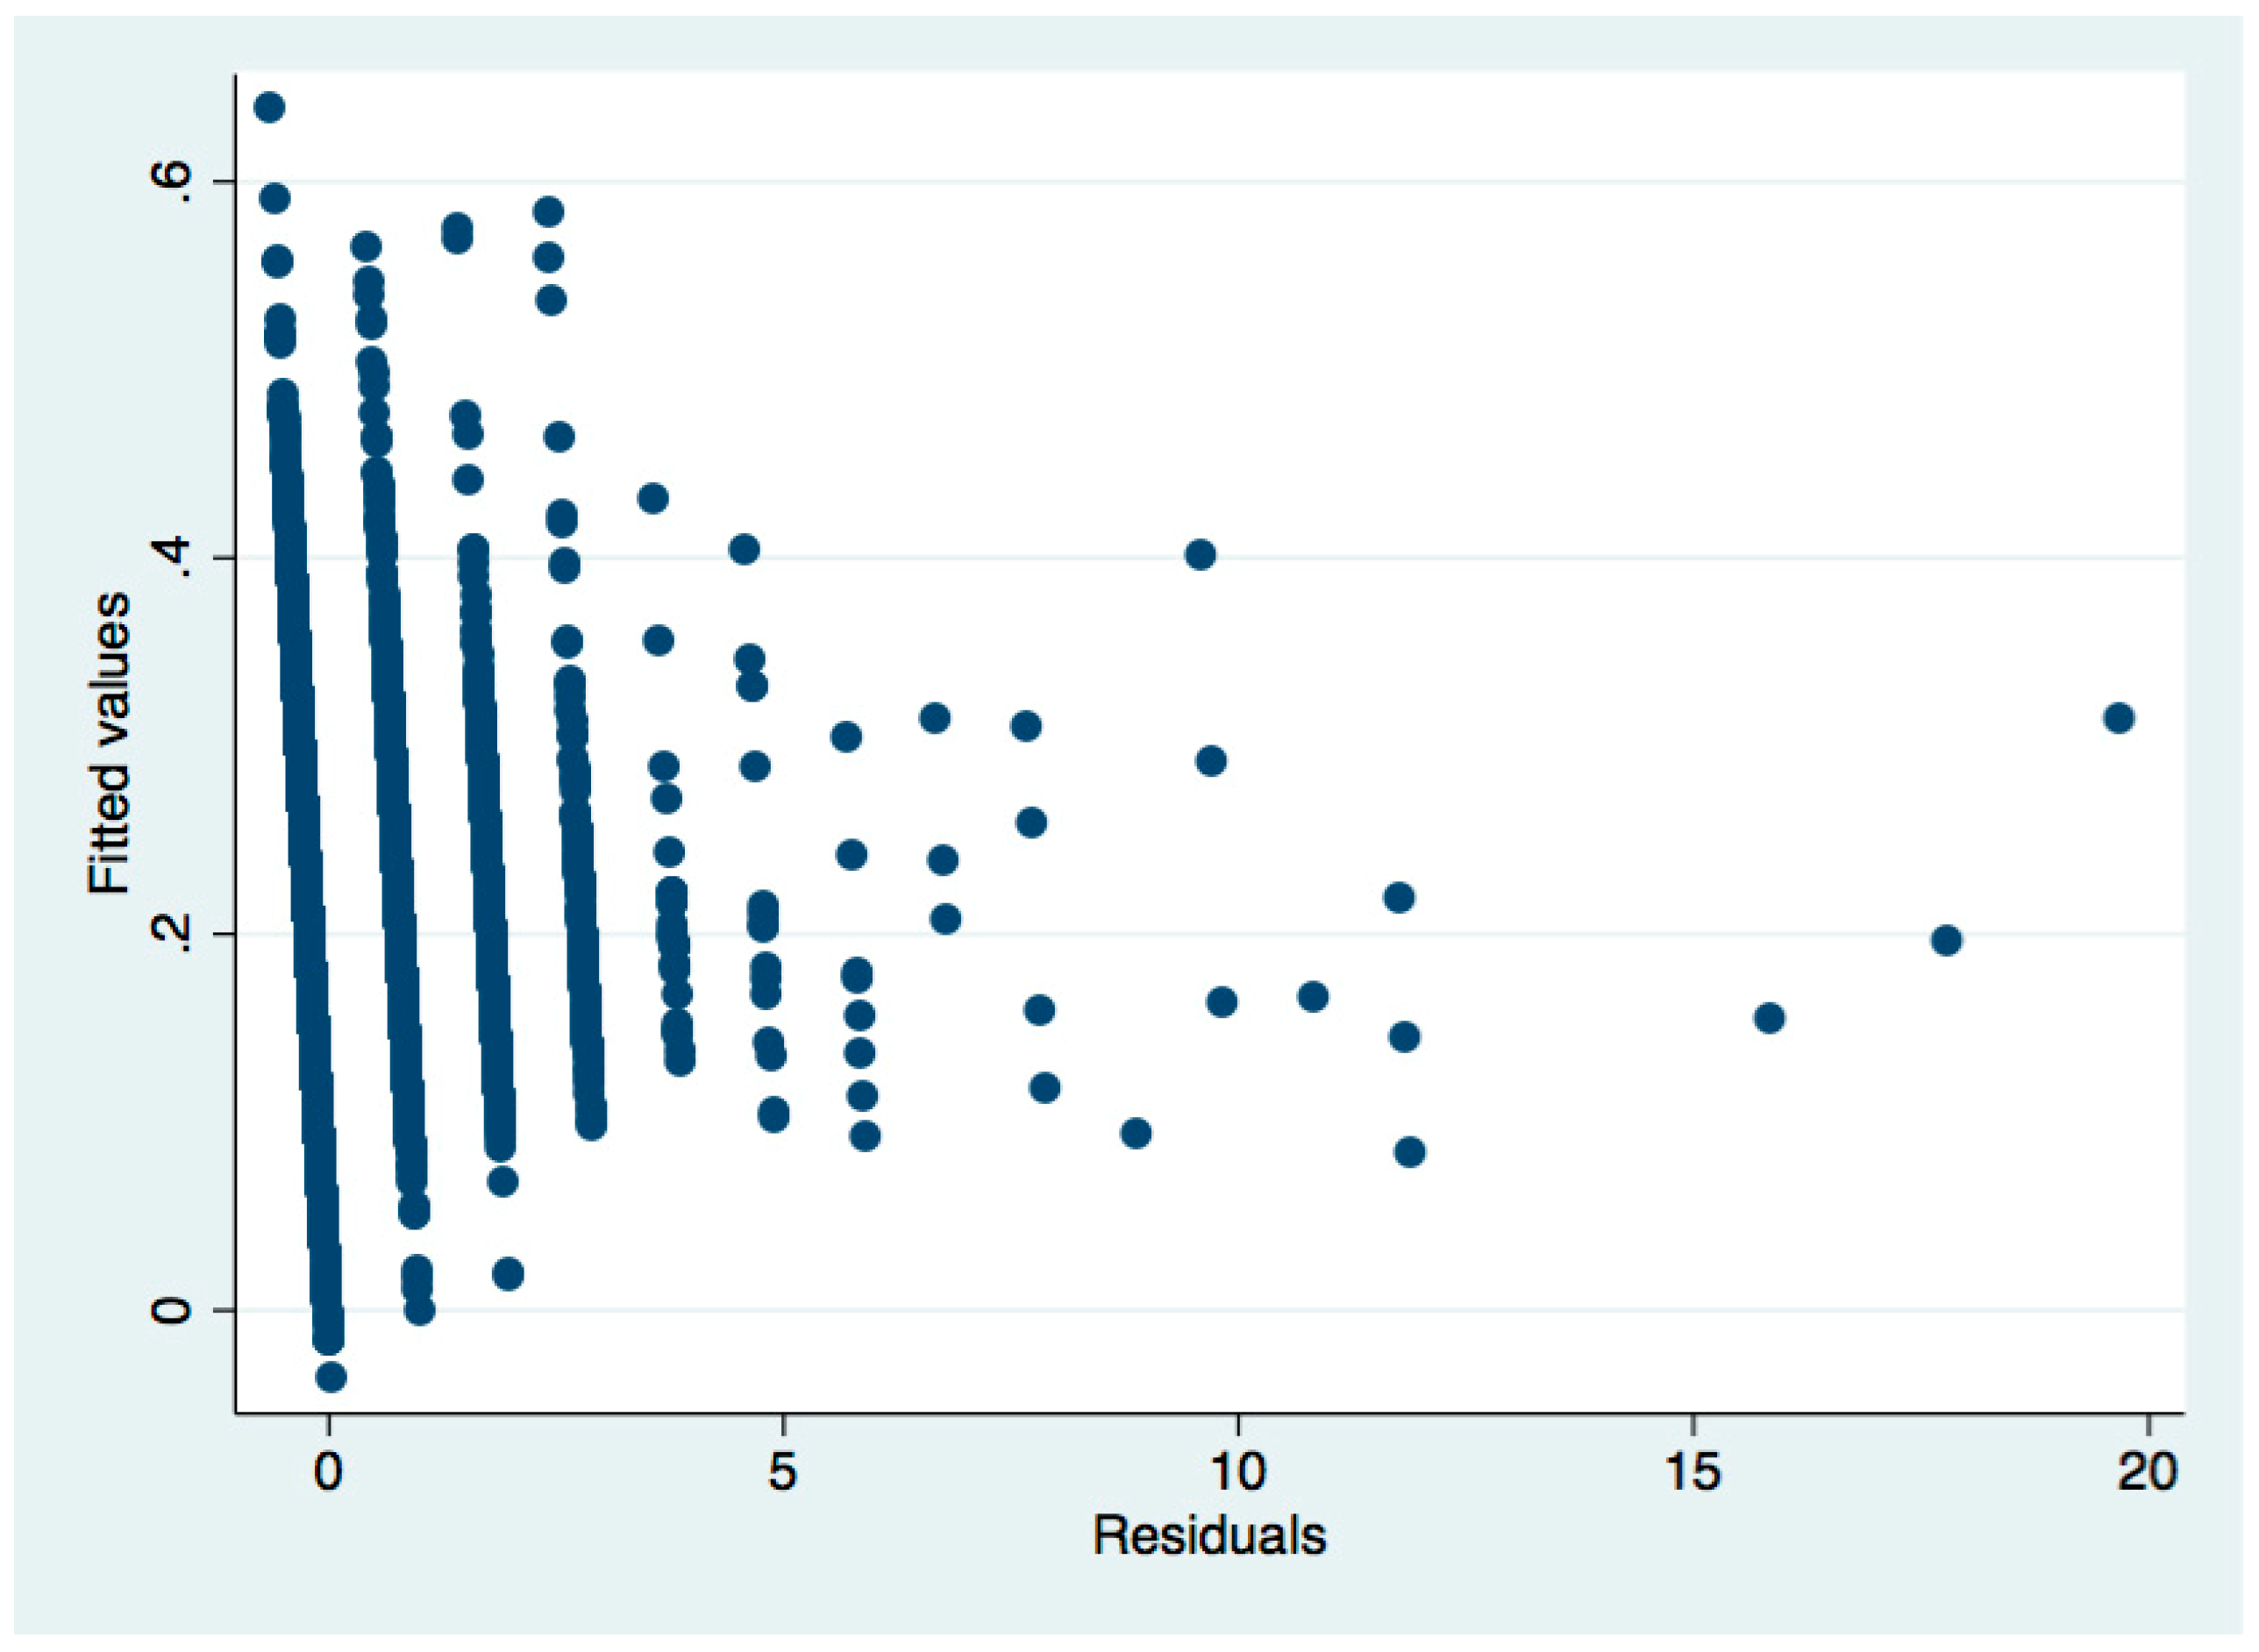
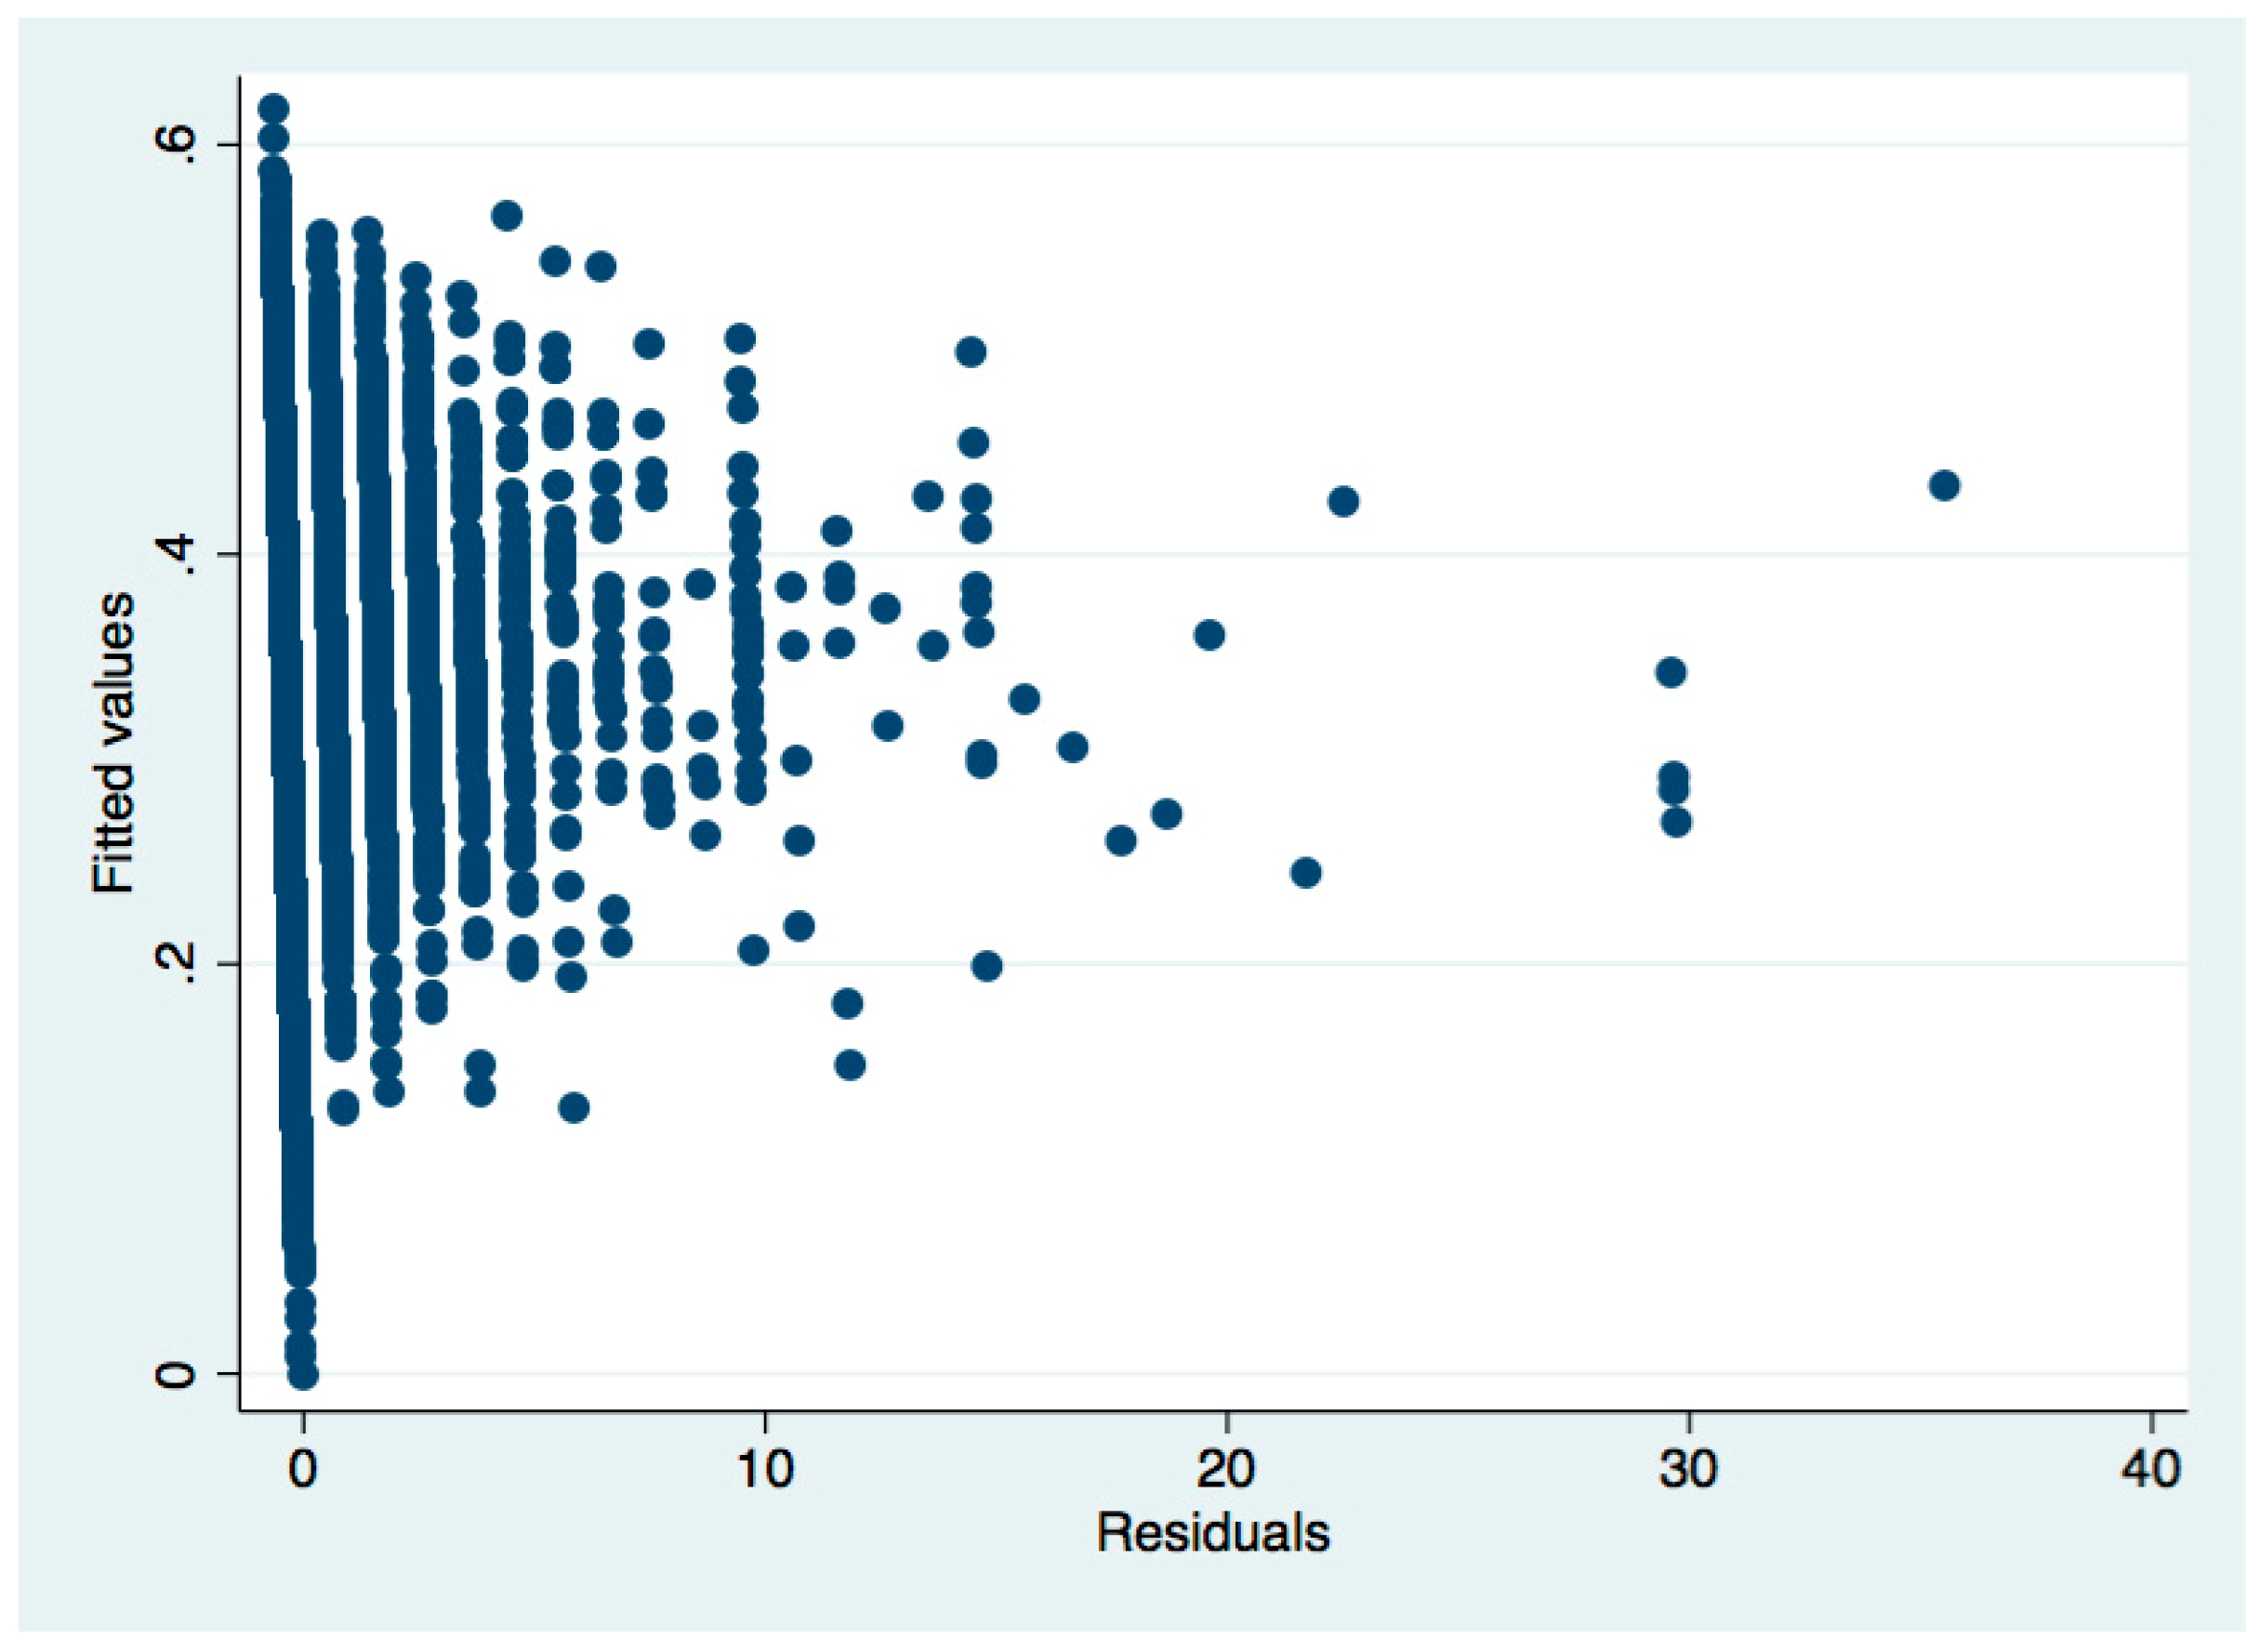
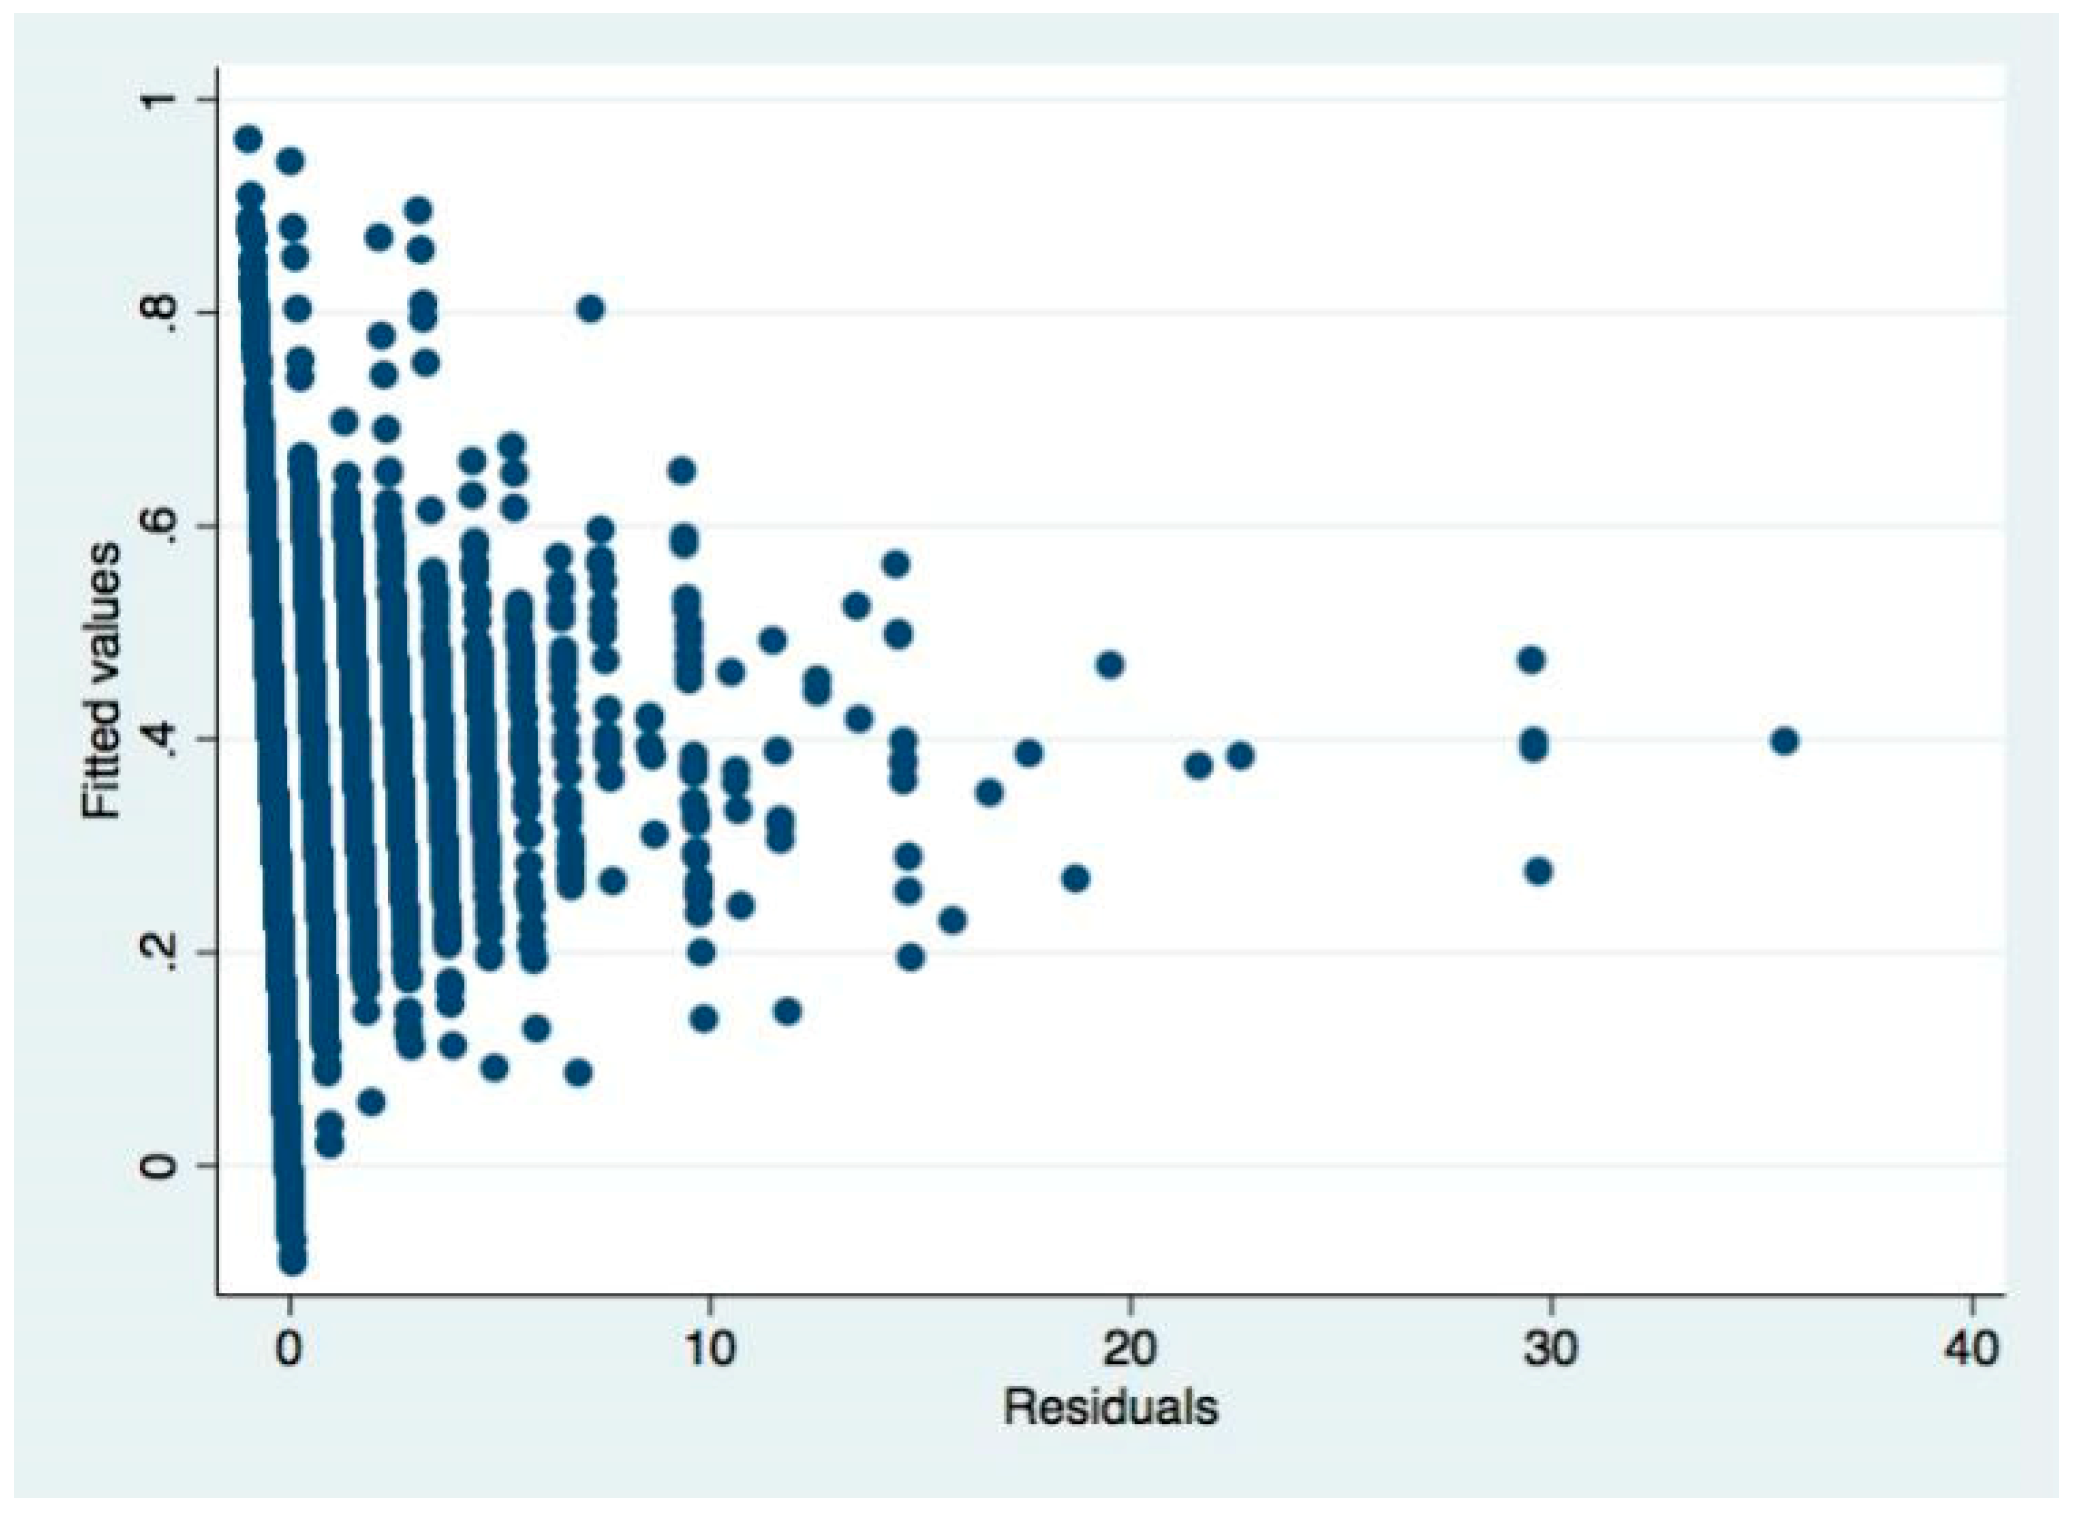
Appendix D. Residential Analysis


References
- Lelieveld, J.; Evans, J.S.; Fnais, M.; Giannadaki, D.; Pozzer, A. The contribution of outdoor air pollution sources to premature mortality on a global scale. Nature 2015, 525, 367. [Google Scholar] [CrossRef] [PubMed]
- Pope, C.A., III; Burnett, R.T.; Thun, M.J.; Calle, E.E.; Krewski, D.; Ito, K.; Thurston, G.D. Lung cancer, cardiopulmonary mortality, and long-term exposure to fine particulate air pollution. JAMA 2002, 287, 1132–1141. [Google Scholar] [CrossRef] [PubMed]
- Grant, W.B. Air pollution in relation to US cancer mortality rates: An ecological study; likely role of carbonaceous aerosols and polycyclic aromatic hydrocarbons. Anticancer Res. 2009, 29, 3537–3545. [Google Scholar]
- Li, L. Guangzhou City, Air Pollution, Meteorological and Daily Population Deaths of the Relationship between. Master’s Thesis, Southern Medical University, Guangzhou, China, 2015. [Google Scholar]
- Sun, H. Research on the Construction of China’s Health Care System under Air Pollution. Master’s Thesis, Liaoning University, Shenyang, China, 2015. [Google Scholar]
- Xu, N. Air Pollution to Public Health Hazard. Master’s Thesis, Dongbei University of Finance and Economics, Dalian, China, 2015. [Google Scholar]
- Liu, R. Statistical Analysis of Air Pollution to Population Health Risk. Master’s Thesis, Jinan University, Guangzhou, China, 2016. [Google Scholar]
- Hamedian, A.A.; Javid, A.; Zarandi, S.M.; Rashidi, Y.; Majlesi, M. Air Quality Analysis by Using Fuzzy Inference System and Fuzzy C-mean Clustering in Tehran, Iran from 2009–2013. Iran. J. Public Health 2016, 45, 917. [Google Scholar] [PubMed]
- Poursafa, P.; Mansourian, M.; Motlagh, M.E.; Ardalan, G.; Kelishadi, R. Is air quality index associated with cardiometabolic risk factors in adolescents? The CASPIAN-III study. Environ. Res. 2014, 134, 105–109. [Google Scholar] [CrossRef]
- Chen, R.; Chen, B.; Kan, H. Effects of fine particulate matter control on life expectancy of urban residents in China. Chin. Environ. Sci. 2014, 34, 2701–2705. [Google Scholar] [CrossRef]
- Carlsen, H.K. Health Effects of Air Pollution in Iceland. Ph.D. Thesis, Umea University, Umeå, Sweden, 2014. [Google Scholar]
- Wu, Y.; Huang, Y.; Lu, J. Potential Effect of Medical Insurance on Medicare: Evidence from China. Iran. J. Public Health 2016, 45, 1247. [Google Scholar]
- Wagstaff, A. The demand for health: Some new empirical evidence. J. Health Econ. 1986, 5, 195–233. [Google Scholar] [CrossRef]
- Grossman, M. On the concept of health capital and the demand for health. J. Political Econ. 1972, 80, 223–255. [Google Scholar] [CrossRef]
- Jerrett, M.; Eyles, J.; Dufournaud, C.; Birch, S. Environmental influences on healthcare expenditures: An exploratory analysis from Ontario, Canada. J. Epidemiol. Community Health 2003, 57, 334–338. [Google Scholar] [CrossRef]
- Neidell, M.J. Air pollution, health, and socio-economic status: The effect of outdoor air quality on childhood asthma. J. Health Econ. 2004, 23, 1209–1236. [Google Scholar] [CrossRef]
- Narayan, P.K.; Narayan, S. Does environmental quality influence health expenditures? Empirical evidence from a panel of selected OECD countries. Ecol. Econ. 2008, 65, 367–374. [Google Scholar] [CrossRef]
- Gerking, S.; Stanley, L.R. An economic analysis of air pollution and health: The case of St. Louis. Rev. Econ. Stat. 1986, 68, 115–121. [Google Scholar] [CrossRef]
- Zang, W.; Liu, G.; Xu, F.; Xiong, X. The Impact of Urban Residents’ Basic Medicare on Household Consumption in China. Econ. Res. 2012, 7, 75–85. [Google Scholar]
- Wooldridge, J.M. Introductory Econometrics: A Modern Approach; South-Western College Pub.: Nashville, TN, USA, 2009; pp. 186–226. [Google Scholar]
- Wang, X.; Deng, F.; Lv, H.; Wu, S.; Guo, X. Long-term effects of air pollution on respiratory symptoms of adults in Beijing. J. Peking Univ. (Health Sci.) 2011, 43, 356–359. [Google Scholar]
- Guo, Y.; Jia, Y.; Pan, X.; Liu, L.; Wichmann, H.E. The association between fine particulate air pollution and hospital emergency room visits for cardiovascular diseases in Beijing, China. Sci. Total Environ. 2009, 407, 4826–4830. [Google Scholar] [CrossRef]
- Yang, C.; Peng, X.; Huang, W.; Chen, R.; Xu, Z.; Chen, B.; Kan, H. A time-stratified case-crossover study of fine particulate matter air pollution and mortality in Guangzhou, China. Int. Arch. Occup. Environ. Health 2012, 85, 579–585. [Google Scholar] [CrossRef]
- Wu, S.; Deng, F.; Huang, J.; Wang, H.; Shima, M.; Wang, X.; Lv, H. Blood pressure changes and chemical constituents of particulate air pollution: Results from the healthy volunteer natural relocation (HVNR) study. Environ. Health Perspect. 2012, 121, 66. [Google Scholar] [CrossRef]
- Shah, A.S.; Langrish, J.P.; Nair, H.; McAllister, D.A.; Hunter, A.L.; Donaldson, K.; Mills, N.L. Global association of air pollution and heart failure: A systematic review and meta-analysis. Lancet 2013, 382, 1039–1048. [Google Scholar] [CrossRef]
- Touloumi, G.; Samoli, E.; Quenel, P.; Paldy, A.; Anderson, R.H.; Zmirou, D.; Katsouyanni, K. Short-term effects of air pollution on total and cardiovascular mortality: The confounding effect of influenza epidemics. Epidemiology 2005, 16, 49–57. [Google Scholar] [CrossRef]
- Liu, N.; Mo, Y.; Liu, L.; Pan, X. Time-series analysis of the correlation between atmospheric sulfur dioxide and residents’ daily death from respiratory diseases. J. Environ. Health 2013, 30, 385–388. [Google Scholar]
| Variable Symbol | Variable Name | Definition |
|---|---|---|
| Health | Self-rated health | Excellent, Better, Good set to 1, Fair, Bad set to 0 |
| Outpatient | Outpatient frequency | Outpatient times in the past four weeks |
| Inpatient | Hospitalization times | Inpatient times in the last year |
| PM10 | Concentration of PM10 | Unit mg/m3 |
| SO2 | Concentration of SO2 | Unit mg/m3 |
| NO2 | Concentration of NO2 | Unit mg/m3 |
| Age | Age | - |
| Gender | Gender | Female is 1, male is 0 |
| Education | Educated Years | - |
| Disease | The number of chronic diseases | - |
| Ln(GDP) | Per capita GDP | The logarithm of GDP per capita in previous year of the city |
| Medical | Medical insurance costs | Medical insurance cost last year |
| Variable | Unit | Observations | Mean | Standard Deviation | Maximum | Minimum |
|---|---|---|---|---|---|---|
| PM10 | mg/m3 | 15,892 | 0.0916 | 0.0374 | 0.2450 | 0.0240 |
| SO2 | mg/m3 | 15,892 | 0.0313 | 0.3549 | 0.0950 | 0.0080 |
| NO2 | mg/m3 | 15,892 | 0.0359 | 0.0123 | 0.0700 | 0.0120 |
| Health | Dummy Variable | 15,892 | 0.6425 | 0.4792 | 1 | 0 |
| Outpatient | Frequency | 15,892 | 0.5288 | 1.6306 | 36 | 0 |
| Inpatient | Frequency | 15,892 | 0.2312 | 0.6943 | 18 | 0 |
| Age | Year | 15,892 | 61.2500 | 10.2175 | 105 | 50 |
| Education | Year | 15,892 | 5.0200 | 5.2700 | 42 | 0 |
| Diseases | Number | 15,892 | 1.0097 | 1.3205 | 10 | 0 |
| Ln (GDP) | U.S. Dollars | 15,892 | 8.8205 | 0.6334 | 10.1686 | 6.7498 |
| Gender | Dummy variable | 15,892 | 0.5300 | 0.4910 | 1 | 0 |
| Medical | CNY | 15,892 | 983.1716 | 2486.746 | 0 | 19,000 |
| Variable | Regression (1) | Regression (2) | Regression (3) | Regression (4) | Regression (5) | Regression (6) | Regression (7) | Regression (8) | Regression (9) | Regression (10) |
|---|---|---|---|---|---|---|---|---|---|---|
| PM10 | 11.6392*** (9.3200) | 4.2043*** (8.0000) | 0.2644*** (9.3400) | 0.1050*** (4.3100) | 0.1370*** (6.1300) | 0.1990*** (6.7300) | ||||
| PM102 | −25.3428*** (−5.6900) | —— | −0.0462*** (−5.6900) | −0.0170** (−2.0900) | −0.0350*** (−4.1100) | |||||
| SO2 | —— | 0.0618** (2.4400) | 0.0242*** (3.3500) | 0.0187 (0.7300) | 0.1088 (1.2900) | 0.0854*** (3.4600) | 0.0729 (0.8500) | |||
| SO22 | —— | −0.0006 (−1.2100) | —— | −7.38 × 10⁻⁶ (−0.0100) | −0.0022 (−0.3900) | −0.0006 (−0.1000) | ||||
| NO2 | —— | —— | 0.1474*** (8.9400) | 3.5046** (2.0500) | 0.0096 (0.4400) | −0.0554*** (−2.9800) | −0.1327*** (-5.8100) | −0.1546*** (−6.5700) | ||
| NO22 | —— | —— | 0.0708*** (5.1700) | —— | 0.0579*** (4.0100) | 0.0761*** (5.4700) | 0.0628*** (4.2900) | |||
| Age | —— | —— | —— | —— | —— | −0.0252 (−1.5200) | −0.0280* (−1.6900) | −0.0304* (−1.8400) | −0.0288* (−1.7300) | −0.0293* (−1.7600) |
| Education | —— | —— | —— | —— | —— | 0.1512*** (8.4300) | 0.1514*** (8.4900) | 0.1574*** (8.7900) | 0.1542*** (8.5800) | 0.1584*** (8.7800) |
| Disease | —— | —— | —— | —— | —— | −0.3439*** (−20.96) | −0.3417*** (−20.9800) | −0.3418*** (−20.8700) | −0.3442*** (−20.9500) | −0.3452*** (−20.9200) |
| Ln (GDP) | —— | —— | —— | —— | —— | 0.3167*** (17.5700) | 0.3457*** (20.7300) | 0.3716*** (19.7800) | 0.3623*** (19.3000) | 0.3554*** (18.7200) |
| Gender | —— | —— | —— | —— | —— | −0.0509 (−1.5000) | −0.0458 (−1.3600) | −0.0437 (−1.2900) | −0.0518 (−1.5300) | −0.0500 (−1.4700) |
| C | −0.2688 | 0.5396 | 0.4831 | 0.0302 | 0.5447 | 0.6256 | 0.6058 | 0.5263 | 0.6117 | 0.5836 |
| Variable | OLS Regression |
|---|---|
| Health | −102.2384 ** (−2.4800) |
| Ln GDP | −18.3292 (−0.6000) |
| Disease | 168.6429 *** (13.3800) |
| Education | 3.8546 (1.0100) |
| Gender | −32.0054 (−0.8000) |
| Age | −0.3503 (−0.1800) |
| C | 1061.1400 |
| Variable | Medical Insurance Costs | ||
|---|---|---|---|
| No Interaction Variables | No separate Air Pollutant Variables | Adding Individual Air Pollutant Variables | |
| PM10 | −2061.9410 *** (−3.7400) | —— | −2461.5130 * (−2.5900) |
| PM10 * health | —— | −1753.2700 *** (−2.6000) | 731.5704 (0.6200) |
| SO2 | −20.9259 (−1.1000) | —— | −28.6356 (−0.5700) |
| SO2 * health | —— | −20.6674 (−0.9900) | 4.1824 (0.1500) |
| NO2 | −3523.4990 (−1.6000) | —— | −3195.8220 (−0.9200) |
| NO2 * health | —— | −3103.6500 (−1.1900) | −715.3406 (−0.1700) |
| Health | −91.3408 ** (−2.1700) | 184.8721 ** (2.0600) | −140.0211 (−1.0600) |
| Age | −0.2830 (−0.1390) | −0.2602 (−0.1300) | −0.5559 (−0.2800) |
| Gender | −28.6215 (−0.7100) | −32.2771 (−0.8000) | −30.2722 (−0.7400) |
| Education | 4.7503 (1.2400) | 3.6234 (0.9700) | 5.9962 (1.5600) |
| Diseases | 150.4636 *** (12.2100) | 157.0992 *** (12.5800) | 150.8624 *** (12.1400) |
| Ln (GDP) | 37.2540 (1.0600) | 10.2010 (0.3000) | 38.1661 (1.0900) |
| C | 910.8777 | 828.2811 | 942.2200 |
| Variable | Self-Rated Health | |
|---|---|---|
| Hypertension | Heart Disease | |
| Age | −0.1299 *** (−2.7300) | −0.0206 (−0.2900) |
| Education | 0.1677 *** (3.3400) | 0.0703 (0.9400) |
| Diseases | −0.1494 *** (−3.1900) | −0.2565 *** (−3.5700) |
| Lngdp | 0.3879 *** (8.0200) | 0.3373 *** (4.5900) |
| Gender | −0.0119 (−0.1200) | 0.3395 ** (2.3400) |
| Adj.R2 | 0.2095 | 0.0208 |
| Variable | Hypertension | Heart Disease |
|---|---|---|
| PM10 | 0.4164 *** (5.7600) | 0.3616 *** (3.0000) |
| PM102 | −0.0368 (−1.3600) | −0.0607 (−1.4400) |
| SO2 | 77.5688 * (1.7400) | 10.2429 (0.6200) |
| SO22 | 1491.7310 ** (2.4600) | 412.9760 (1.6300) |
| NO2 | −0.0059 (−0.1100) | −0.0281 (0.3200) |
| NO22 | 0.0018 (0.0400) | 0.0097 (0.1500) |
| Adj.R2 | 0.9210 | 0.0115 |
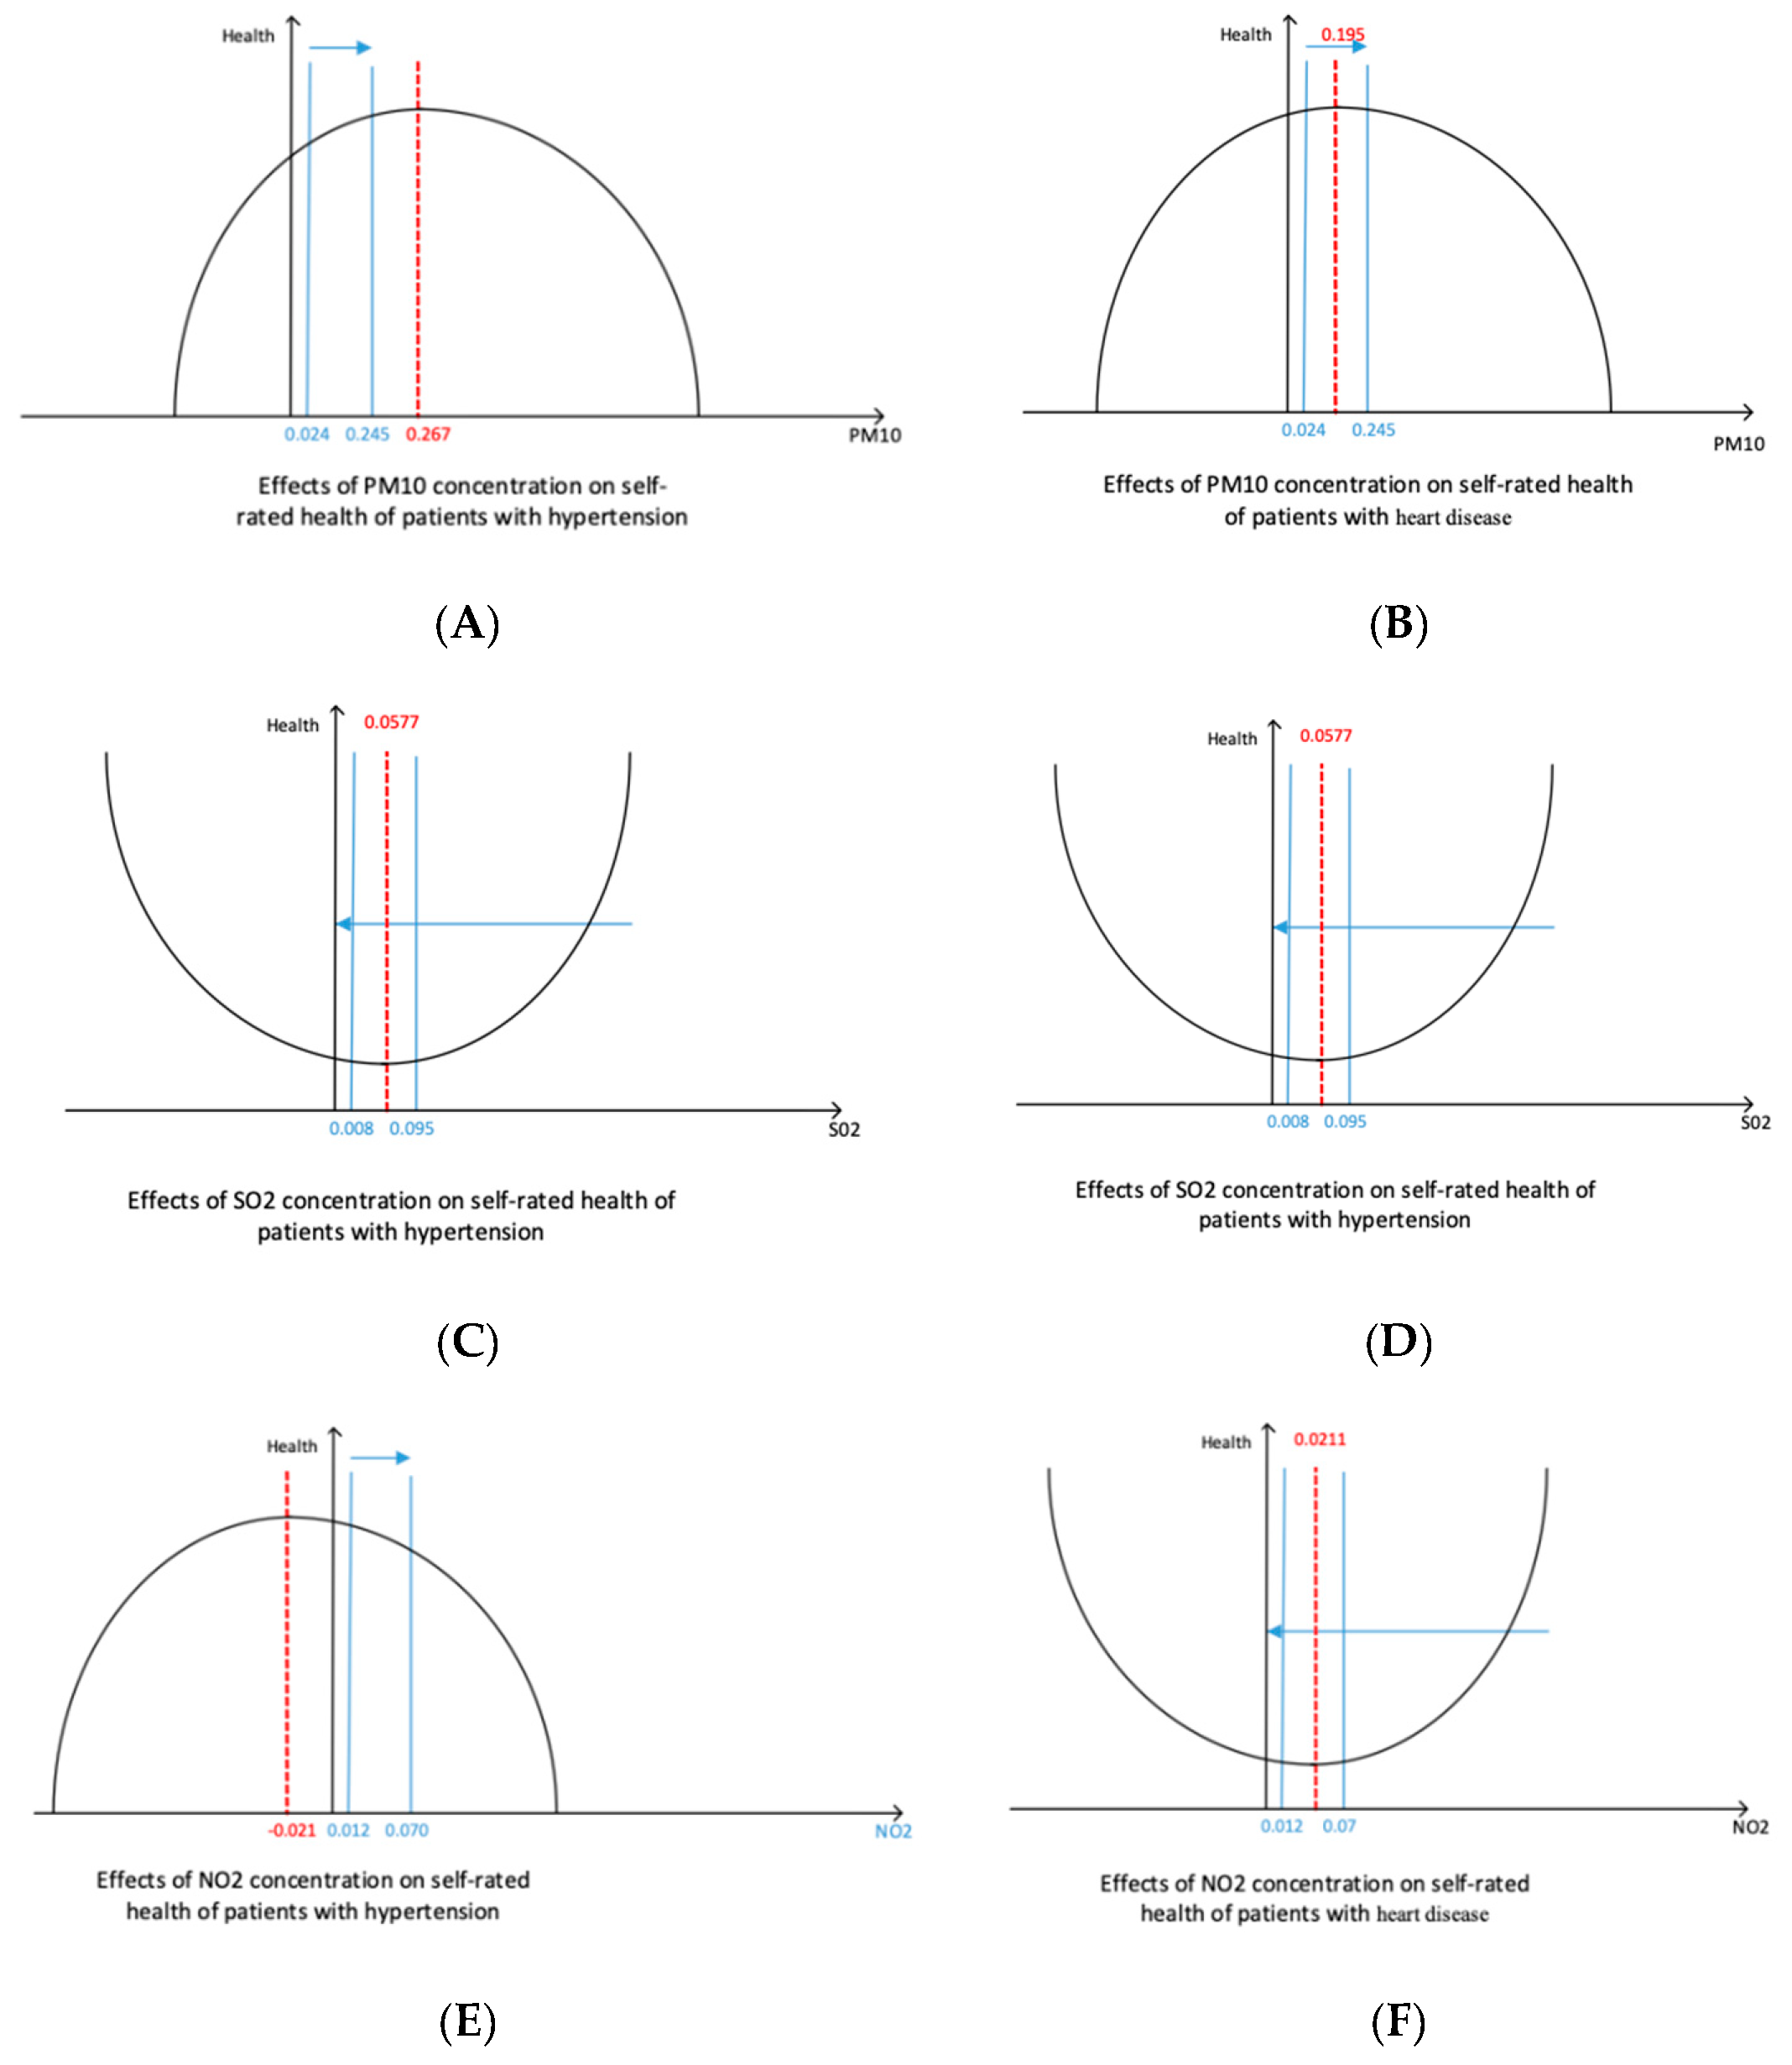
| Pollutants | Concentration Range | Hypertension | Heart Disease |
|---|---|---|---|
| PM10 | 0.0240–0.2450 | 0.2670 | 0.1950 |
| SO2 | 0.0080–0.0950 | 0.0577 | 0.0571 |
| NO2 | 0.0120–0.0700 | −0.0213 | 0.0211 |
| Variable | Regression (1) | Regression (2) | Regression (3) | Regression (4) | Regression (5) | Regression (6) | Regression (7) | Regression (8) | Regression (9) | Regression (10) |
|---|---|---|---|---|---|---|---|---|---|---|
| PM10 | 0.0153** (2.2500) | —— | —— | 0.1594 (1.0500) | 0.0127 (1.4300) | 0.0198*** (2.7100) | —— | —— | 0.2597* (1.7200) | 0.0455*** (7.1000) |
| PM102 | −0.0029 (−1.2200) | —— | —— | —— | −0.0026 (−1.0400) | −0.0019 (−0.8000) | —— | —— | —— | −0.0081*** (−4.4300) |
| SO2 | —— | −0.0020 (−0.1000) | —— | 0.0039*** (2.5900) | −0.0076 (−0.3800) | —— | 0.0052 (0.2700) | —— | 0.0042*** (2.8500) | 0.0127 (0.8900) |
| SO22 | —— | 0.0011 (0.8600) | —— | —— | 0.0014 (1.0500) | —— | 0.0008 (0.0601) | —— | —— | −0.0002 (−0.2500) |
| NO2 | —— | —— | 0.0089* (1.7700) | 0.2202 (0.42) | 0.0007 (0.1000) | —— | —— | 0.0150*** (2.6300) | 0.5577 (0.9900) | −0.0360*** (−7.0600) |
| NO22 | —— | —— | 0.0038 (0.9500) | —— | 0.0021 (0.4900) | —— | —— | 0.0056 (1.3800) | —— | 0.0131*** (4.2700) |
| Age | —— | —— | —— | —— | —— | 0.0240*** (4.7800) | 0.0239*** (4.8000) | 0.0243*** (4.8800) | 0.0024*** (4.8200) | −0.0066* (−1.8300) |
| Education | —— | —— | —— | —— | —— | −0.0198*** (−3.8400) | −0.0188*** (−3.6700) | −0.0189*** (−3.6900) | −0.0037*** (−3.7800) | 0.0326*** (8.7800) |
| Disease | —— | —— | —— | —— | —— | 0.0542*** (10.8700) | 0.0535*** (10.8300) | 0.0545*** (10.9900) | 0.0419*** (11.0500) | −0.0785*** (−21.8300) |
| Ln(GDP) | —— | —— | —— | —— | —— | −0.0027 (−0.4900) | 0.0029 (0.5800) | −0.0035 (−0.6200) | −0.0061 (−0.7000) | 0.0803*** (19.6000) |
| Gender | −0.0047 (−0.4600) | −0.0042 (−0.4100) | −0.0041 (−0.4000) | −0.0045 (−0.4400) | −0.0115 (−1.5700) | |||||
| C | 0.1886 | 0.1836 | 0.1810 | 0.1616 | 0.1849 | 0.1899 | 0.1859 | 0.1811 | 0.0278 | 0.6358 |
| Variable | Regression (1) | Regression (2) | Regression (3) | Regression (4) | Regression (5) | Regression (6) | Regression (7) | Regression (8) | Regression (9) | Regression (10) |
|---|---|---|---|---|---|---|---|---|---|---|
| PM10 | −0.0157 (−1.1700) | —— | —— | −1.0662*** (−3.5700) | −0.0994*** (−5.6800) | 0.0154 (1.0600) | —— | —— | −1.0631*** (−3.5700) | −0.0812*** (−4.6100) |
| PM102 | 0.0095** (2.0507) | —— | —— | —— | 0.0210*** (4.2300) | 0.0015 (0.3100) | —— | —— | —— | 0.0143*** (2.8500) |
| SO2 | —— | 0.0713* (1.8600) | —— | 0.0071** (2.4300) | 0.0474 (1.2100) | —— | 0.0758** (1.9700) | —— | 0.0059** (2.0100) | 0.0392 (1.0000) |
| SO22 | —— | −0.0027 (−1.0600) | —— | —— | −0.0017 (−0.6400) | —— | −0.0030 (−1.1400) | —— | —— | −0.0013 (−0.5100) |
| NO2 | —— | —— | 0.0483*** (4.8300) | 6.0536*** (5.8500) | 0.0910*** (6.8400) | —— | —— | 0.0940*** (8.3500) | 9.6786*** (8.7200) | 0.1271*** (9.0800) |
| NO22 | —— | —— | 0.0115 (1.4500) | —— | 0.0076 (0.9000) | —— | —— | 0.0046 (0.5800) | —— | 0.0031 (0.3700) |
| Age | —— | —— | —— | —— | —— | 0.0211** (2.1300) | 0.0214** (2.1700) | 0.0241** (2.4400) | 0.0024** (2.4400) | 0.0243** (2.4500) |
| Education | —— | —— | —— | —— | —— | 0.0014 (0.1300) | 0.0024 (0.2300) | 0.0004 (0.0400) | 0.0003 (0.1500) | 0.0021 (0.2100) |
| Disease | —— | —— | —— | —— | —— | −0.0371*** (−3.7600) | −0.0368*** (−3.7600) | −0.0308*** (−3.1400) | −0.0249*** (−3.3300) | −0.0308*** (−3.1300) |
| Ln(GDP) | —— | —— | —— | —— | —— | −0.0633*** (−5.9100) | −0.0597*** (−6.0300) | −0.1009*** (−9.0900) | −0.1535*** (−9.0000) | −0.0951*** (−8.4600) |
| Gender | —— | —— | —— | —— | —— | 0.0494** (2.4400) | 0.0489** (2.4400) | 0.0485** (2.4200) | 0.0507** (2.5200) | 0.0512** (2.5400) |
| C | 0.3284 | 0.3394 | 0.3252 | 0.2165 | 0.3104 | 0.3109 | 0.3141 | 0.3070 | 1.2779 | 0.2949 |
| Variable | Regression (1) | Regression (2) | Regression (3) | Regression (4) | Regression (5) | Regression (6) | Regression (7) | Regression (8) | Regression (9) | Regression (10) |
|---|---|---|---|---|---|---|---|---|---|---|
| PM10 | 17.8429*** (2.0764) | —— | —— | 4.7140*** (0.8734) | 0.2609*** (7.8800) | 0.1115*** (3.4800) | —— | —— | 0.1237*** (4.3900) | 0.1560*** (4.4600) |
| PM102 | −52.8684*** (8.7510) | —— | —— | —— | −0.0846*** (−7.7300) | −0.0207** (−2.0400) | —— | —— | —— | −0.0370*** (−3.1000) |
| SO2 | —— | 0.0570** (0.0252) | —— | 0.0199*** (0.0072) | 0.0359 (1.2900) | —— | 0.1322 (1.2000) | —— | 0.1005*** (3.1100) | 0.0639 (0.5600) |
| SO22 | —— | −0.0005 (0.0005) | —— | —— | 0.1105*** (4.9300) | —— | −0.0034 (−0.3400) | —— | —— | 0.0006 (0.0600) |
| NO2 | —— | —— | −16.2336* (8.2883) | 4.3751** (2.1504) | 0.0053 (0.0500) | —— | —— | −0.0921*** (−3.3800) | −0.1385*** (−4.6000) | −0.1449*** (−4.7000) |
| NO22 | —— | —— | 394.2988*** (109.935) | —— | 0.0040 (0.4000) | —— | —— | 0.0818*** (4.6100) | —— | 0.0835*** (3.7100) |
| Age | —— | —— | —— | —— | —— | −0.0316 (−1.4400) | −0.0325 (−1.4900) | −0.0347 (−1.5900) | −0.0330 (−15000) | −0.0345 (−1.5700) |
| Education | —— | —— | —— | —— | —— | 0.1554*** (6.4500) | 0.1504*** (6.3100) | 0.1567*** (6.5400) | 0.1610*** (6.6500) | 0.1649*** (6.8000) |
| Disease | —— | —— | —— | —— | —— | −0.3217*** (−15.0200) | −0.3152*** (−14.8900) | −0.3161*** (−14.8300) | −0.3212*** (−14.9800) | −0.3212*** (−14.9500) |
| Ln(GDP) | —— | —— | —— | —— | —— | 0.3059*** (12.6800) | 0.3395*** (15.5000) | 0.3745*** (15.1700) | 0.3615*** (14.6900) | 0.3405*** (12.9500) |
| —— | —— | —— | —— | —— | −0.0464 (−1.0300) | −0.0416 (−0.9300) | −0.0396 (−0.8800) | −0.0460 (−1.0200) | −0.0446 (−0.9900) | |
| C | −0.4249 | 0.5858 | 0.6397 | 0.0772 | 0.5878 | 0.6834 | 0.6585 | 0.5713 | 0.6646 | 0.6173 |
| Variable | Regression (1) | Regression (2) | Regression (3) | Regression (4) | Regression (5) | Regression (6) | Regression (7) | Regression (8) | Regression (9) | Regression (10) |
|---|---|---|---|---|---|---|---|---|---|---|
| PM10 | 21.1412*** (2.1062) | —— | —— | 4.8368*** (0.9669) | 0.4641*** (7.6000) | 0.3389*** (7.8000) | —— | —— | 0.2283*** (4.6800) | 0.5010*** (7.8600) |
| PM102 | −47.7789*** (6.4352) | —— | —— | —— | −0.2171*** (−7.5300) | −0.1002*** (−6.2200) | —— | —— | —— | −0.2128*** (−7.2600) |
| SO2 | —— | 11.3783** (5.2098) | —— | −1.4041 (2.1293) | −27.3279*** (−3.6200) | —— | 0.0581 (1.4600) | —— | −0.1112** (−2.4200) | −0.0129 (−0.2500) |
| SO22 | —— | −1.3500 (47.0390) | —— | —— | 362.0244*** (4.3800) | —— | 0.0011 (0.0600) | —— | —— | 0.1130*** (3.3200) |
| NO2 | —— | —— | −0.5982 (15.2933) | 13.4551*** (3.3509) | −0.0501 (−1.0100) | —— | —— | 0.0998*** (2.9200) | 0.0273 (0.6600) | −0.2061*** (−3.7900) |
| NO22 | —— | —— | 336.6407* (198.8603) | —— | −0.0342 (−1.3100) | —— | —— | 0.0157 (0.6300) | —— | −0.0461* (−1.7300) |
| Age | —— | —— | —— | —— | —— | −0.0466 (−1.6300) | −0.0427 (−1.5000) | −0.0434 (−1.5300) | −0.0501* (−1.7500) | −0.0524* (−1.8200) |
| Education | —— | —— | —— | —— | —— | 0.1842*** (5.9500) | 0.1902*** (6,1700) | 0.1898*** (6.1500) | 0.1851*** (5.9800) | 0.1819*** (5.8400) |
| Disease | —— | —— | —— | —— | —— | −0.4631*** (−15.8000) | −0.4519*** (−15.2800) | −0.4571*** (−15.7400) | −0.4643*** (−15.5600) | −0.4661*** (−15.5300) |
| Ln(GDP) | —— | —— | —— | —— | —— | 0.2744*** (8.6200) | 0.3667*** (12.3700) | 0.3297*** (9.8500) | 0.3104*** (9.1900) | 0.3131*** (9.1800) |
| Gender | —— | —— | —— | —— | —— | −0.1095* (−1.8700) | −0.0987* (−16900) | −0.0984* (−1.6900) | −0.1059* (−1.8100) | −0.1124* (−1.9100) |
| C | −1.1197 | 0.1106 | 0.0370 | −0.4554 | 1.2025 | 0.0770 | 0.6573 | 0.6432 | 0.6654 | 0.8187 |
© 2019 by the authors. Licensee MDPI, Basel, Switzerland. This article is an open access article distributed under the terms and conditions of the Creative Commons Attribution (CC BY) license (http://creativecommons.org/licenses/by/4.0/).
Share and Cite
Pi, T.; Wu, H.; Li, X. Does Air Pollution Affect Health and Medical Insurance Cost in the Elderly: An Empirical Evidence from China. Sustainability 2019, 11, 1526. https://doi.org/10.3390/su11061526
Pi T, Wu H, Li X. Does Air Pollution Affect Health and Medical Insurance Cost in the Elderly: An Empirical Evidence from China. Sustainability. 2019; 11(6):1526. https://doi.org/10.3390/su11061526
Chicago/Turabian StylePi, Tianlei, Hongyan Wu, and Xiaotong Li. 2019. "Does Air Pollution Affect Health and Medical Insurance Cost in the Elderly: An Empirical Evidence from China" Sustainability 11, no. 6: 1526. https://doi.org/10.3390/su11061526
APA StylePi, T., Wu, H., & Li, X. (2019). Does Air Pollution Affect Health and Medical Insurance Cost in the Elderly: An Empirical Evidence from China. Sustainability, 11(6), 1526. https://doi.org/10.3390/su11061526