1. Introduction
In the context of continuous urban expansion, investigation of local pedestrian traffic crashes and fatality trends is important to ensure sustainable pedestrian safety. Urban traffic safety is more and more difficult to control, leading to increased frequency of traffic crashes over the last decades correlated with increases in urbanization and population density. According to the European Commission [
1], Romania and Bulgaria were ranked among the first member states of the European Union in terms of number of fatalities caused by traffic crashes in 2016 (97 and 99 fatalities per million inhabitants, respectively). They are followed by Latvia and Poland (80 fatalities per million inhabitants) and Greece (75 fatalities per million inhabitants). At the other end of the ranking there are states like Norway (24 fatalities per million inhabitants), Sweden (27 fatalities per million inhabitants), the United Kingdom, and Switzerland (28 and 29 fatalities per million inhabitants, respectively).
The research studies conducted so far revealed that the people most exposed to traffic crashes are children and seniors [
2,
3,
4,
5]. According to the World Health Organization, the injuries caused by traffic crashes are the leading cause of death among 10–19-year-olds at a global level [
6]. Throughout the 2011–2016 period, the number of young people aged 11 to 20 injured in traffic crashes accounted for 15% of the total pedestrian–vehicle crashes in Bucharest. According to studies conducted by Hotz et al. [
4], Schwebel et al. [
7], and Blazquez and Celis [
8] most of the school-aged pedestrians were exposed to traffic crashes after school hours.
The high frequency of pediatric pedestrian crashes may be due to non-behavioral factors, such as the time of the crash (day or night) or the location (pedestrian crossings, unsignalized intersections, marked intersections with traffic signs), or due to behavioral factors, such as high traffic speed, unsafe crossing behavior, and violation of traffic rules (e.g., not giving priority to pedestrians crossing the street). Besides these factors, age plays a very important role in the degree of pedestrian injury. Research carried out by Al-Madani [
9] has revealed that life conditions of children are also a factor of traffic crashes exposure—children under 15 living with both parents are less exposed to crashes than those living without one parent.
The analysis of school-aged pedestrian–vehicle crashes was addressed in few studies [
10,
11,
12,
13,
14] by use of various methodological approaches. Research studies analyzing the traffic crashes at a city level in Romania, Cluj-Napoca, were conducted by Ivan and Haidu [
15], Ivan et al. [
16], Benedek et al. [
17], and on a country level by Ciobanu and Benedek [
18]. Although road traffic crashes per age groups were analyzed by different researchers [
19,
20,
21,
22,
23], the current paper remains one of the few studies that identify the areas prone to traffic crashes involving school-aged pedestrians. Therefore, the methodology presented hereby is not only relevant in the Romanian context, but may also be applied in other international studies.
The outcomes of the study carried out by Feng et al. [
19] have shown that in Singapore, primary-school-aged children are the most exposed to traffic crashes. Schwebel et al. [
20] and DiMaggio and Durkin [
21] have analyzed the degree of injury in traffic crashes for four categories of school-aged children: under 5, 5 to 9, 9 to 14, and 15 to 19. Their results have revealed a high degree of injury for the 6–14-year-old group. Concerns regarding the analysis of the lesions caused by traffic crashes by age groups were shared by Matzopoulos et al. [
22]. They showed that the highest mortality rates among school-aged pedestrians are recorded within the following age groups: 1–4, 5–9, and 10–14. Other studies have analyzed pedestrian–vehicle crashes by two age categories: school-aged and adult [
12,
23].
The above-mentioned literature focuses on the national level, and on the general causality of traffic crashes. To our knowledge there are no safety studies focusing on school-aged pedestrian–vehicle crashes in large urban agglomerations, although these are causing important injuries and loss of lives. Against this background, our paper focuses on identifying the areas vulnerable to school-aged pedestrian–vehicle crashes (in the 2–20 age group) in one of the largest cities in Europe—Bucharest.
2. Study Area and Database
Our study area is Bucharest, the sixth largest city in the European Union (EU) by population (2,112,483 inhabitants in 2018 [
24]). It is the capital city and the main economic hub of Romania [
25,
26]. Over the last two decades, it underwent rapid economic development and a parallel increase in the motorization rate [
27]. It was ranked first in the EU in terms of number of fatalities caused by traffic crashes [
18]. Bucharest ranks among the top places in Romania in terms of pedestrian–vehicle crashes [
15,
16,
17].
The database on traffic crashes was provided by the General Inspectorate of Romanian Police, Traffic Department (GIRPTD), which is the only Romanian authority keeping official data on traffic crashes. This contains information regarding the date; hour; location; cause; number of fatal, serious, or slight casualties; and the age of the persons involved.
The information on the location of schools in Bucharest was extracted from the Open Street Map database [
28], while the data on the number of students was extracted from the Romanian Agency for Quality Assurance in Pre-University Education (ARACIP) database [
29].
Of the total number of 6455 pedestrian crashes during the 2011–2016 period in Bucharest, 1305 school-aged (2–20-year-old) pedestrian crashes involving 222 fatal and serious casualties were analyzed.
During the analyzed period, the number of school-aged pedestrian–vehicle crashes accounted for 20.2% of the total number of pedestrian–vehicle crashes (5.7% at pre-school and primary school age, 6.2% at secondary school age, and 8.3% at high school age). The school-aged victims made up 13% of the pedestrian victims (4% were pre-school and primary school age, 3.8% were secondary school age, and 5.2% were high school age).
Figure 1 graphically displays the total number of fatalities caused by the pedestrian–vehicle crashes in Bucharest and the total number of school-aged fatalities. This illustrates that the number of fatalities had a decreasing trend throughout the 2011–2016 interval and that the number of school-aged fatalities followed a relatively linear trend with two peaks in 2012 and 2015.
Table 1 shows that in Bucharest, 55% of the school-aged pedestrian–vehicle crashes were caused by pedestrians, 34% were caused by drivers, and 4% had other causes (
Table 1).
Therefore, the high number of crashes with school-aged fatalities is a serious traffic safety issue in urban agglomerations, which needs to be empirically investigated and addressed by proper mitigation measures.
3. Methodology
The main scope of this study was to identify the vulnerable areas and the triggering factors of traffic crashes involving school-aged pedestrians in Bucharest, over the 2011–2016 interval.
Vulnerability can be defined as the consequences resulting from the occurrence of traffic crashes. This can be direct (moral or material losses) or indirect (e.g., the degree of connectivity or accessibility of the road segment) [
16].
By means of the ArcGIS software, the spatial location of each traffic crash was determined, and the severity index was calculated to determine the severity degree of the school-aged pedestrian–vehicle crashes. The severity index was successfully used by Choudharya et al. [
30] and Li and Linag [
31] to calculate the severity degree of aviation crashes in Florida during the 2002–2017 period.
3.1. Vulnerability Analysis of School-Aged Pedestrian–Vehicle Crashes
This study addresses only the direct vulnerability by computing the severity index [
30,
32]. The severity index was computed by three age categories: 2–10, 11–14, and 15–20; this enabled us to identify the vulnerable areas corresponding to pre-school, primary, secondary, and high school education.
The severity index was computed by summing up the fatal, serious, and slight casualties and by assigning weights directly proportional to their severity based on the formulas (adapted and modified from Choudharya et al. [
30]):
where
SI = severity index for school-aged pedestrian–vehicle crashes;
X1 = number of fatal school-aged casualties;
X2 = number of serious school-aged casualties;
X3 = number of slight school-aged casualties.
By adapting the equation (1), the severity index was computed by school age categories as follows:
where
SI = severity index for pre-school-aged and primary-school-aged pedestrian–vehicle crashes (
SIp), secondary-school-aged pedestrian–vehicle crashes (
SIs) and high-school-aged pedestrian–vehicle crashes (
SIh);
X1 = number of fatal casualties by age category: 2–10 (X1p), 11–14 (X1s), and 15–20 (X1h);
X2 = number of serious casualties by age category: 2–10 (X2p), 11–14 (X2s), and 15–20 (X2h);
X3 = number of slight casualties by age category: 2–10 (X3p), 11–14 (X3s), and 15–20 (X3h).
The resulting severity indices have allowed us to establish the vulnerable locations in Bucharest by school age categories.
3.2. Identification of School-Aged Pedestrian–Vehicle Crash Triggering Factors
In order to mitigate school-aged pedestrian–vehicle crashes in Bucharest we aimed to identify the triggering factors. In order of see to what extent vehicle speed could explain the severity index zones, the authors intended to examine the statistical relationship between road traffic crashes involving school-aged pedestrians and the average vehicle speed based on the statistical correlation. The dependence relationship between the two variables, average vehicle speed (X; cause) and road traffic crashes (Y; effect) is reflected by the simple linear regression model. The intensity of the linear dependence between the two variables is calculated using the Pearson correlation coefficient [
33]. Simple linear regression with the Pearson correlation is a common method used in the analysis of the relation between traffic crashes and various factors affecting the occurrence of crashes (e.g., speed and light conditions [
16], traffic flow by time intervals [
17], and import of second-hand cars [
34]) or in researching the connection between road traffic mortality rate and GDP per capita [
35].
4. Results and Discussions
4.1. Areas Vulnerable to Pre-School-Aged and Primary-School-Aged Pedestrian–Vehicle Crashes
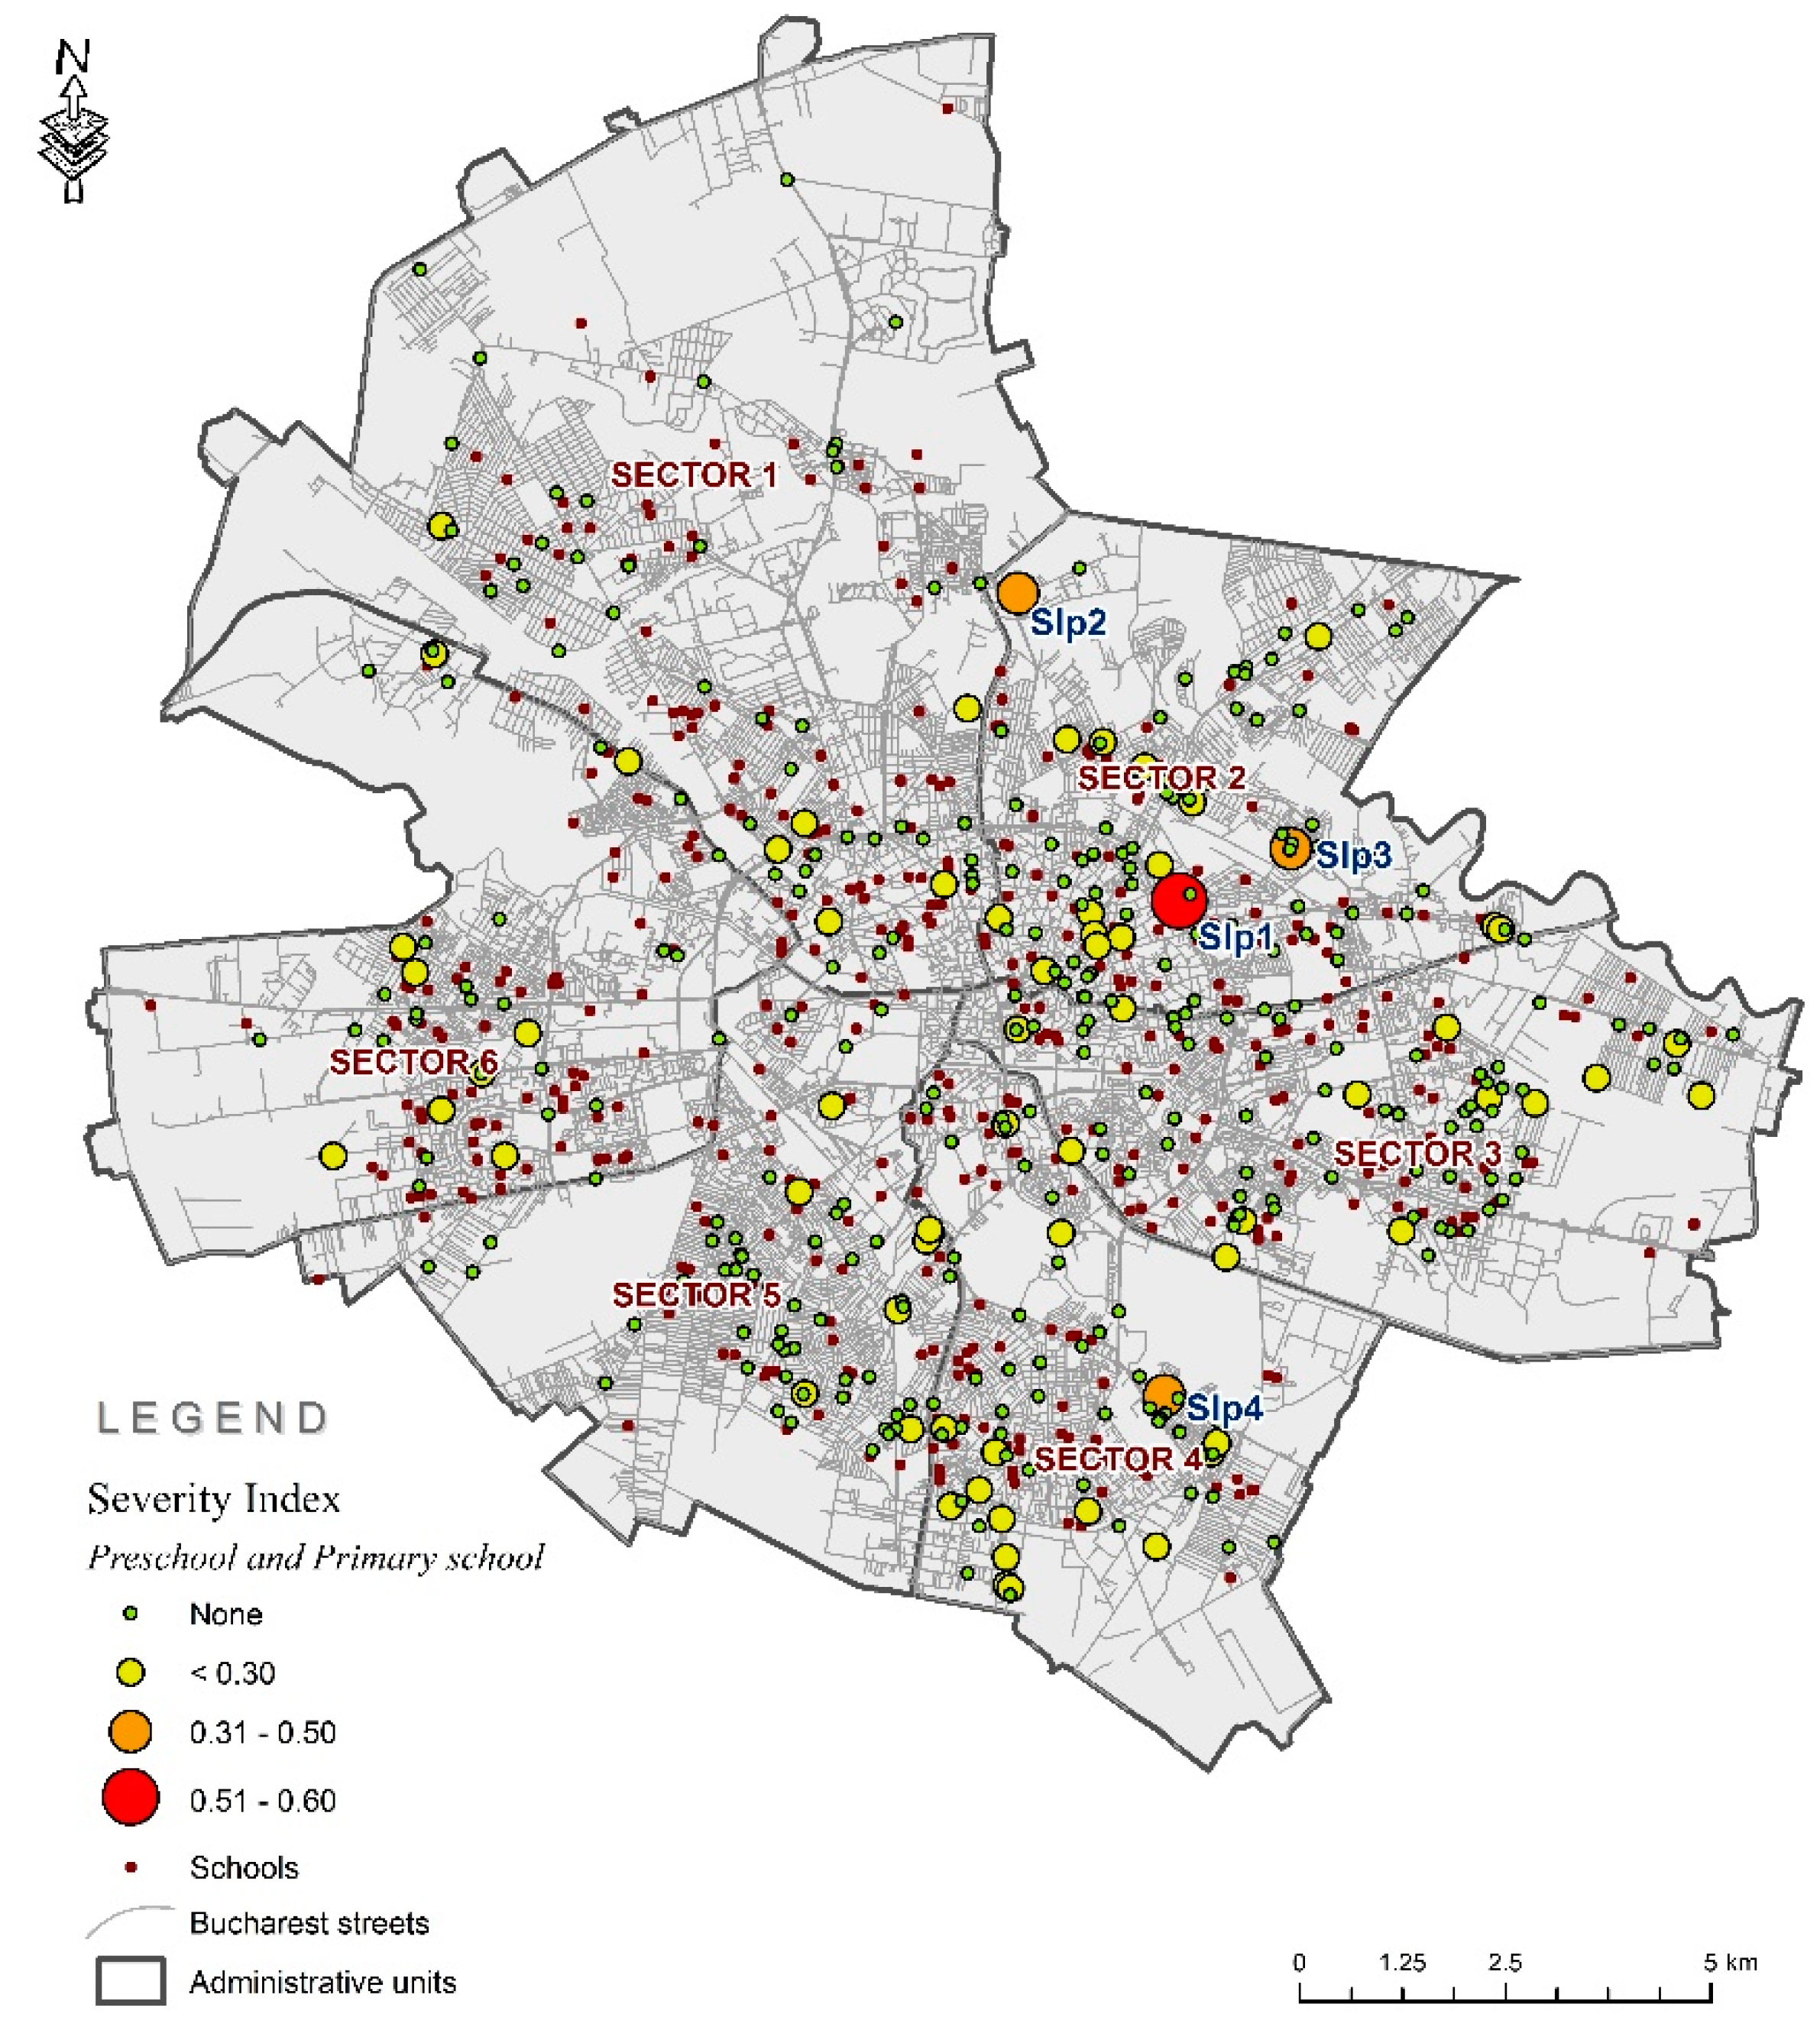
The findings of this research revealed one high-severity-index zone and three medium-severity-index zones among the pre-school-aged and primary-school-aged pedestrians, highlighted in
Figure 2 as follows: the high-rate zone (
SIp1) marked in red on the map and the medium-rate zones (
SIp2,
SIp3,
Sip4) marked in orange. All of these vulnerable areas are located in the eastern half of the city, in only two administrative districts (“sectors”) from a total of six districts.
The high-severity-index zone (SIp1) is located in district 2, at the intersection of two important streets (Ferdinand Boulevard and Ritmului Street), in the perimeter of four schools with a high number of students—Iulia Hașdeu National College (972 students), Mihail Sadoveanu Theoretical High School (543 students), Ion IC Brătianu Technological High School (400 students), and Fine Mechanics Vocational Technical High School (239 students). The high severity rate in this zone is explained by the high vehicle speed on these arterial roads (31–50 km/h). In district 2 there are also two medium-severity-rate zones, one (SIp2) located on Dimitrie Pompeiu Boulevard, in the immediate proximity of Edmond Nicolau Technological College (400 students), Constantin Brâncuşi Technological High School (401 students), Ita Wegman Bilingual Theoretical High School (328 students), and Promenada shopping mall. The second zone in district 2 with a medium severity index (SIp3) is located at the intersection of Dimitria Grozdea Street and the Paharnicul Turturea Street, in the vicinity of many shops and supermarkets. The third medium-severity-index zone (SIp4) is located in district 4 on Ciochina Street, in the proximity of Secondary School No. 133 (795 students) and close to several banks. The medium-severity-rate zones among pre-school-aged and primary-school-aged children is due to the pedestrians’ unsafe crossing behavior in the context of the absence of pedestrian crossings. One can note the fact that the areas that are most vulnerable to road traffic crashes involving pre-school-aged and primary-school-aged pedestrians are concentrated in districts 2 and 4 of Bucharest. In most of the zones, the crash severity among pre-school-aged and primary-school-aged children may be explained by high speed and by pedestrians’ unsafe crossing behavior.
4.2. The Areas Vulnerable to Secondary-School-Aged and High-School-Aged Pedestrian–vehicle Crashes
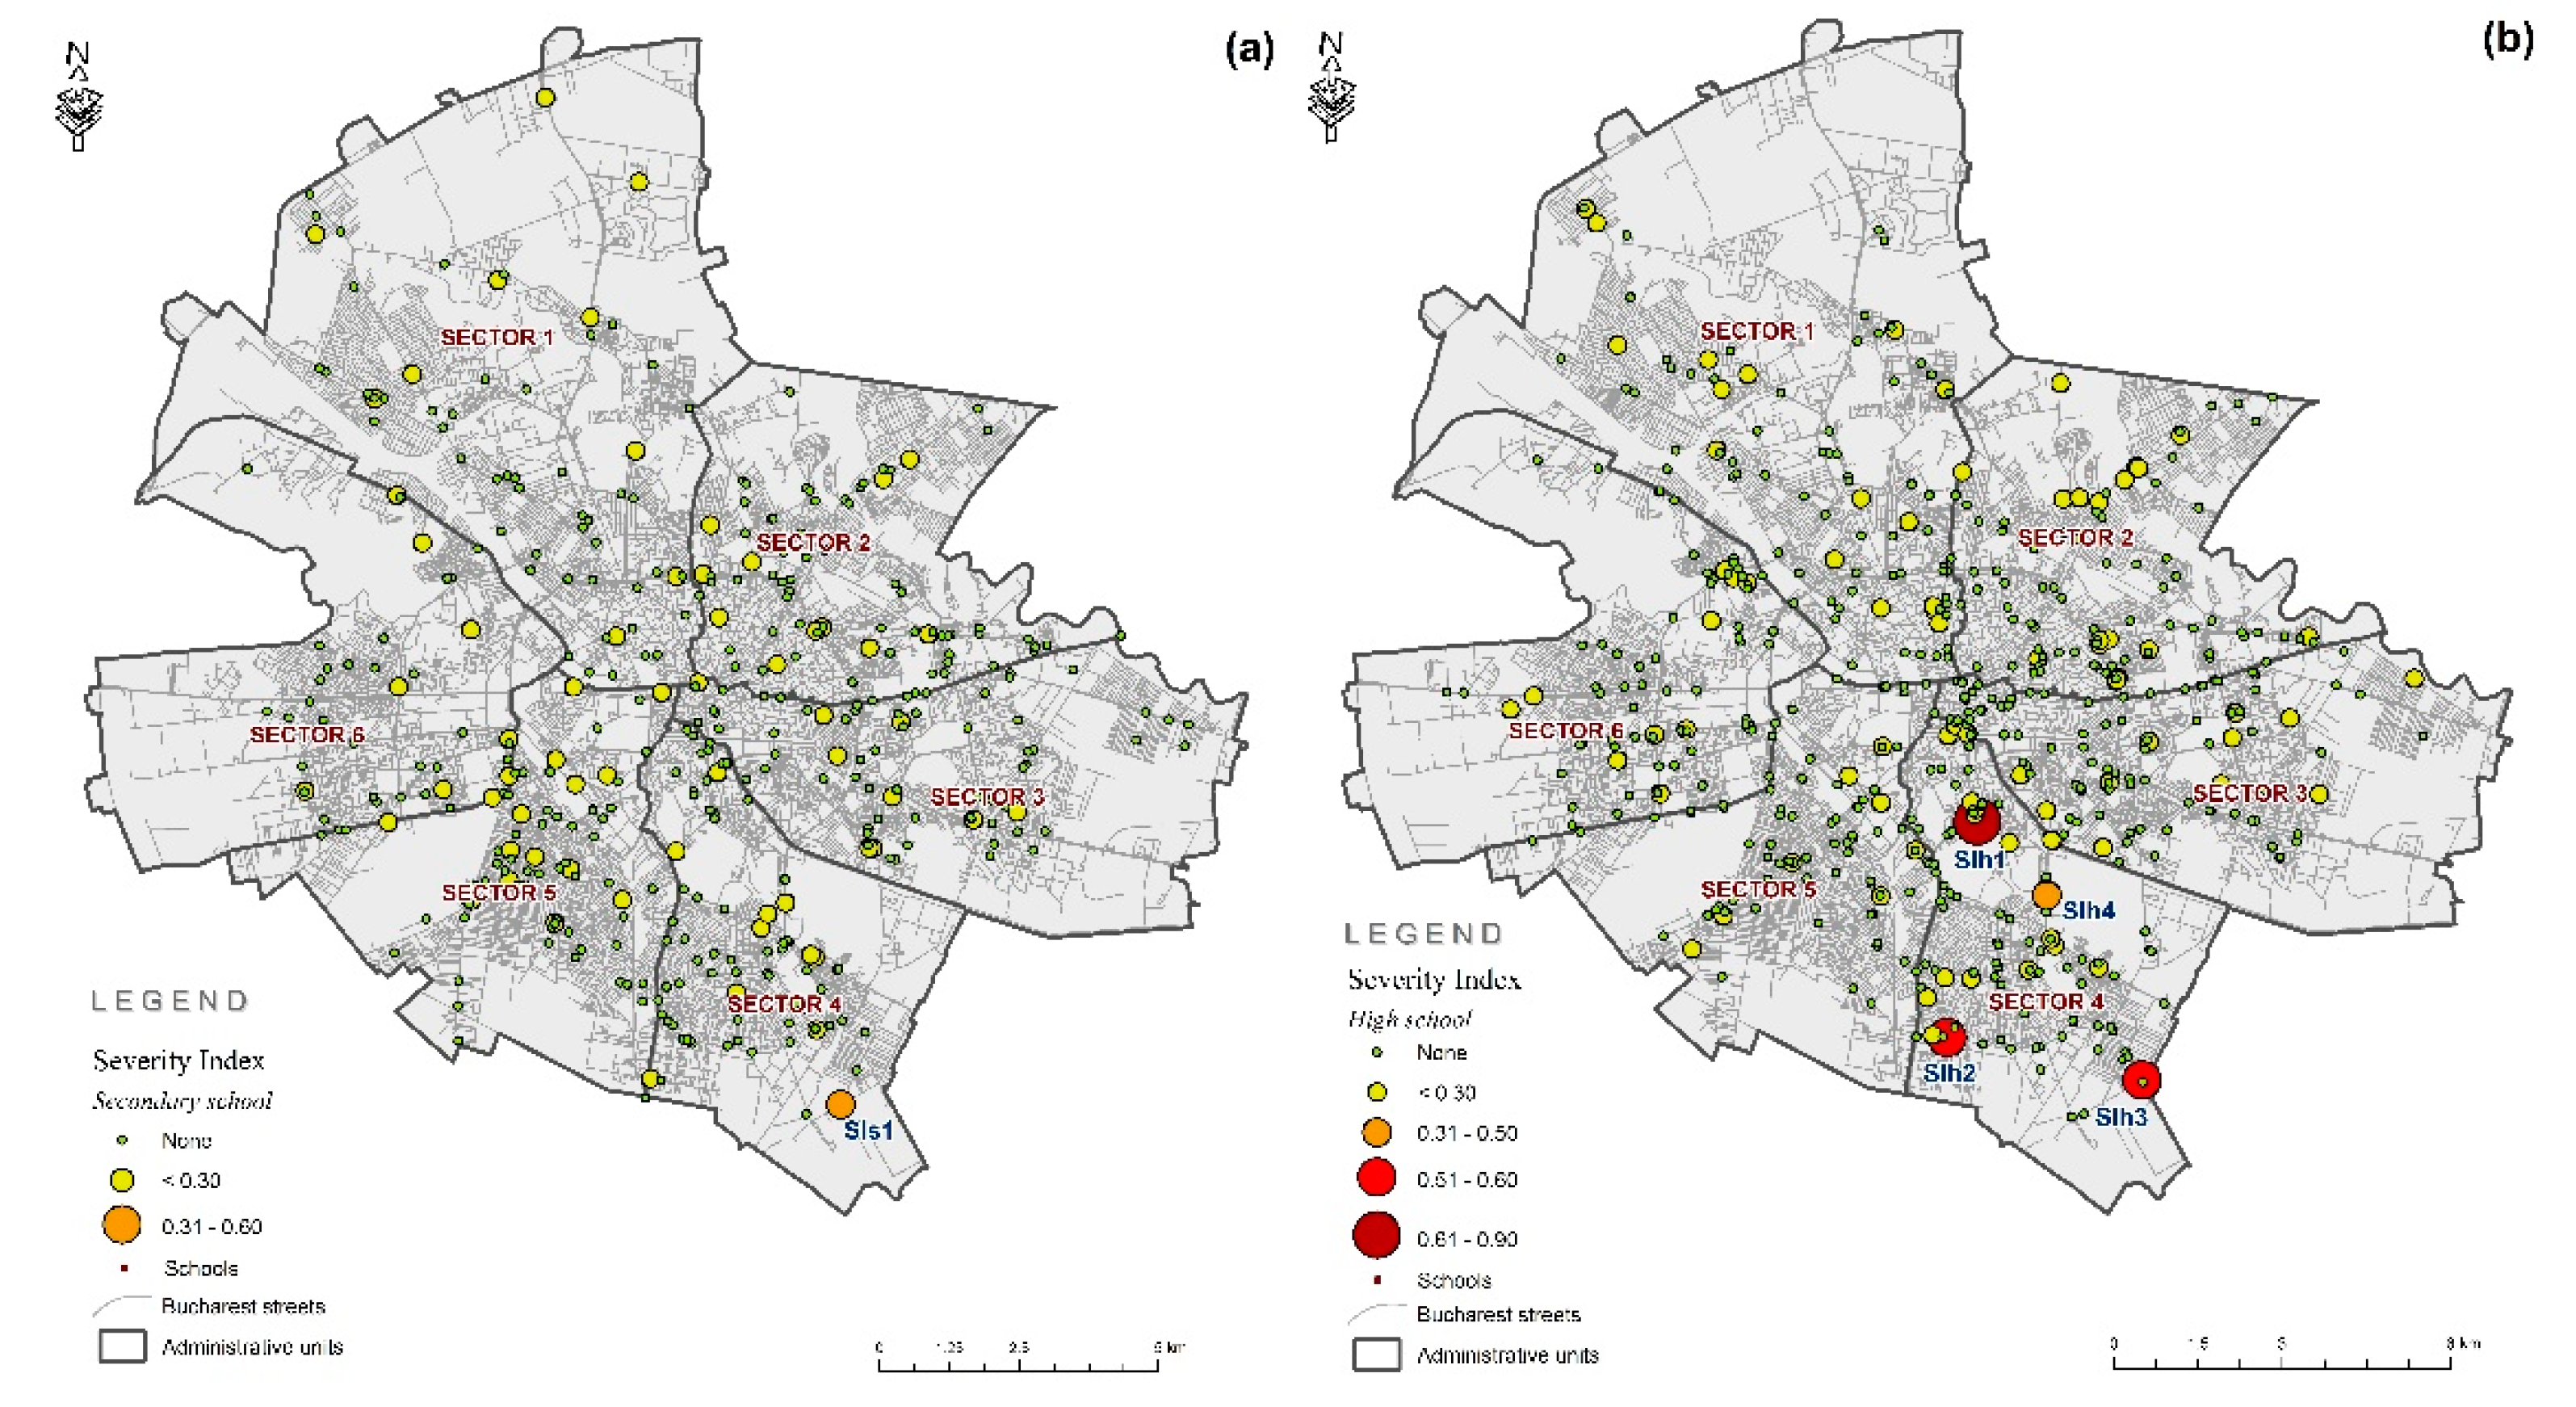
In terms of secondary-school-aged pedestrian–vehicle crashes, all hot spots are again located in district 4, in the southern part of the city. More specifically, we have identified one hot spot of medium severity index (
SIs1), at the intersection of Metalurgiei Boulevard and Dumitru Brumărescu Street, highlighted in orange on the map in
Figure 3a. This is located in the immediate vicinity of a residential area in district 4, near Miron Nicolescu Technological College (213 students), and is close to three supermarkets. The crash severity in this area is due to the high speed of vehicles (speed limit 51–70 km/h) and to pedestrians’ unsafe crossing behavior.
The high severity index zones of high-school-aged pedestrian–vehicle crashes were located also in district 4. Four zones were identified: one with very high severity index (
SIh1) marked in dark red on the map in
Figure 3b, two with high severity index (
SIh2 and
SIh3) marked in red on the map, and one with medium severity index (
SIh4) marked in orange on the map. The first zone (
SIh1) with a very high severity rate is located on Tineretului Boulevard, at one of the accessways to Tineretului Park and in the vicinity of Gheorghe Şincai National College (1000 students). Tineretului Park is one of the largest parks in Bucharest, attracting many visitors to the area. The very high severity of crashes in this zone is due to the intense vehicle flow (the average daily traffic is 17,441 vehicles) and to high vehicle speeds (31–50 km/h).
Among the high severity index zones (red) of high school pedestrian–vehicle crashes, the first (SIh2) is located at the intersection of Luica and Reşiţa Streets, near Secondary School No. 165 (757 students) and Clubul Sportiv Şcolar No. 6 and close to markets and shops. The second zone (SIh3) is located at the intersection of Şoseaua Berceni and Metalurgiei Boulevard (speed limit 51–70 km/h), in the vicinity of Miron Nicolescu Technological College (213 students). This area is located in the immediate vicinity of the area vulnerable to secondary-school-aged pedestrian–vehicle crashes. The high severity of the traffic crashes among high-school-aged children is due to high vehicle speed.
The medium-severity-index zone SIh4 (orange) for high-school-aged pedestrian–vehicle crashes is located on Calea Văcăreşti Street (31–50 km/h), at one of the entrances of Lumea Copiilor Park, which also attracts many visitors. The crash severity in this area is explained by high vehicle speed and by pedestrians’ unsafe crossing behavior (i.e., the absence of pedestrian crossings in this area).
4.3. Factors Triggering School-Aged Pedestrian–Vehicle Crashes
The identification of vulnerable areas by school age category highlighted that, for pre-school-aged, primary-school-aged and secondary-school-aged crashes, as well as the high speed (high-severity-index zone) the high number of fatalities is due to pedestrians’ unsafe crossing behavior in locations without pedestrian crossings.
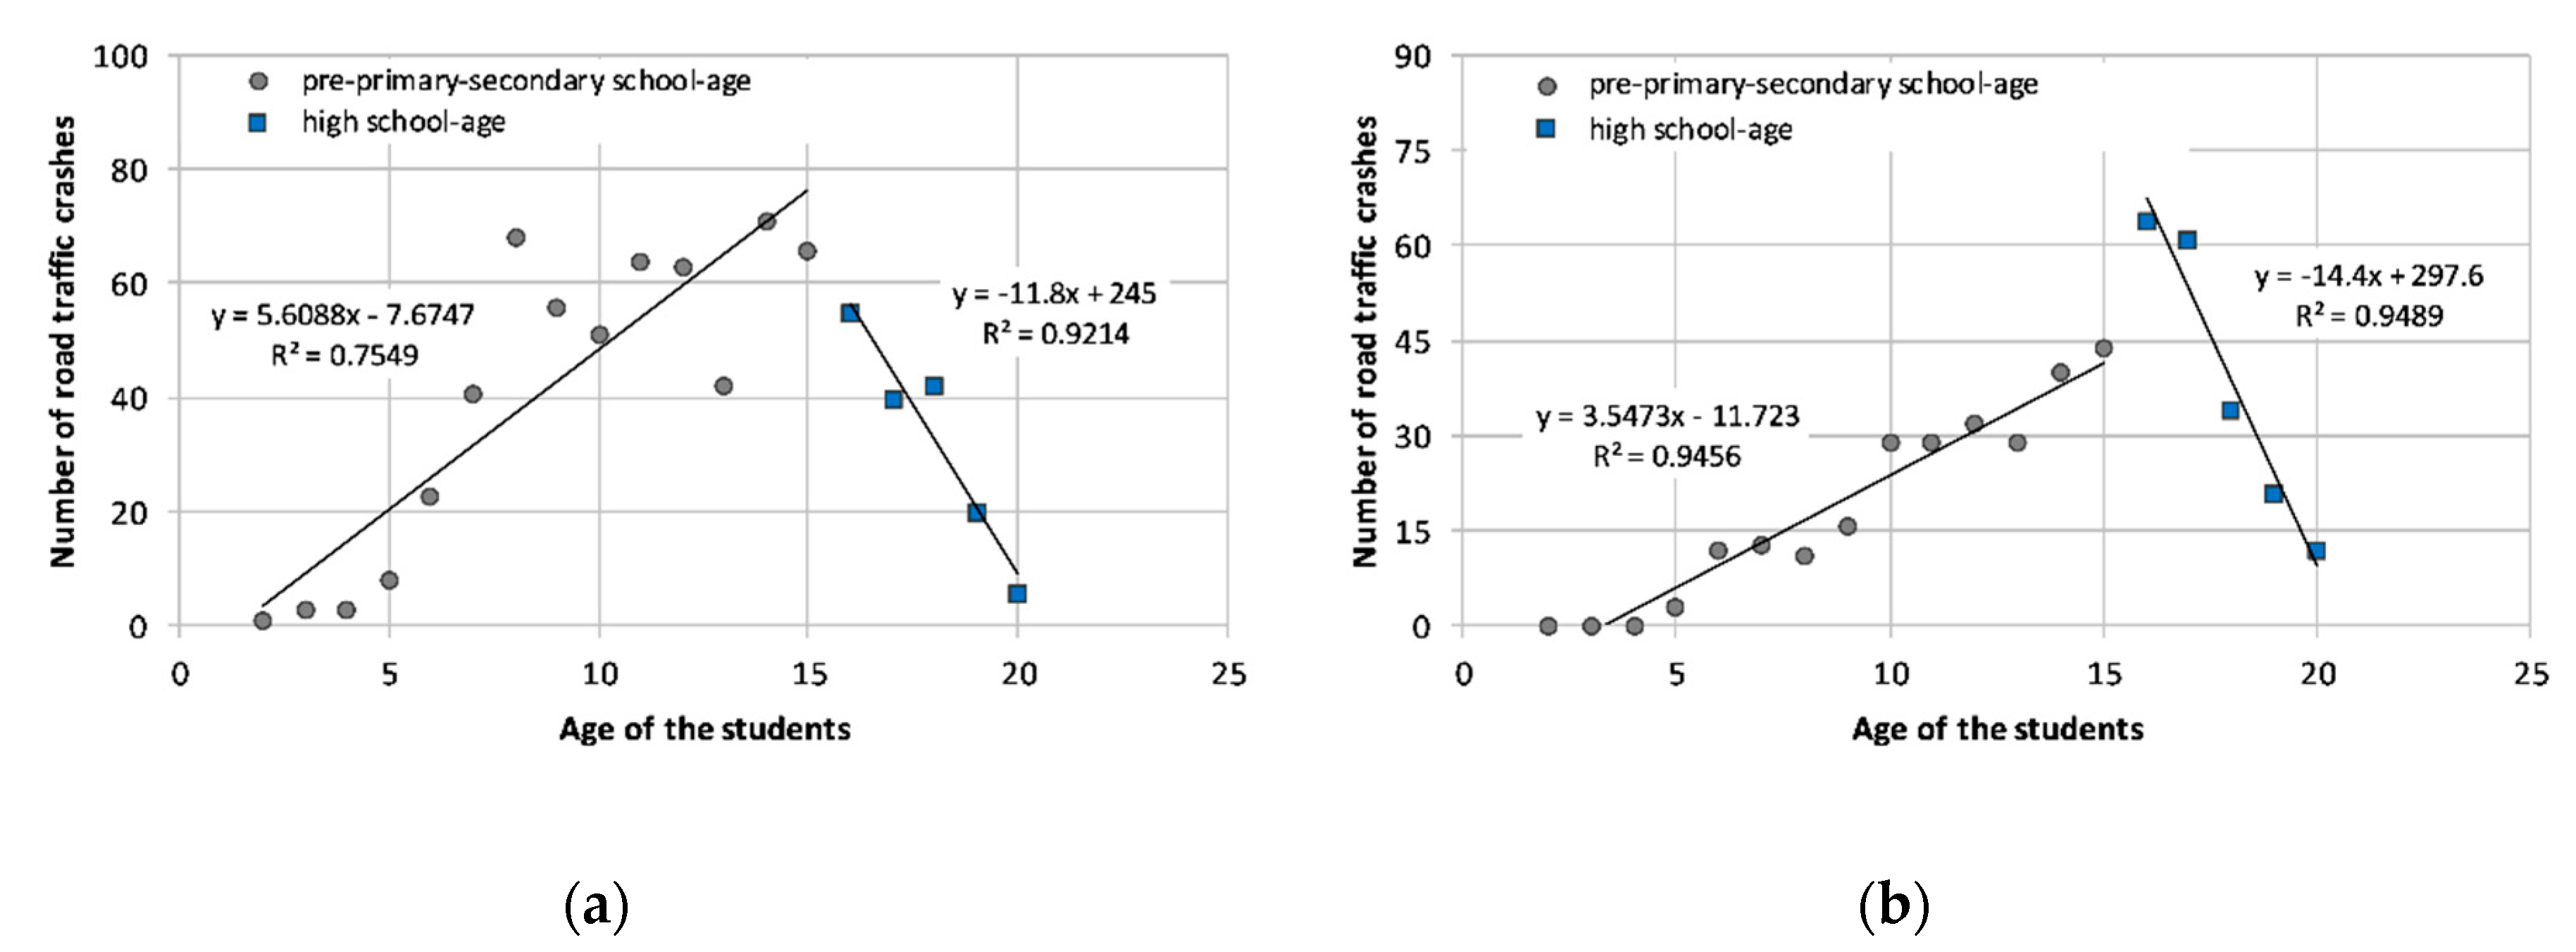
In terms of the high-school-aged category (15–20 years old), the high number of fatalities is due to high speed along certain roads. The research of the dependence degree between the school-aged pedestrian–vehicle crashes/number of fatalities (Y) and the vehicle speed limits along road networks (X) showed a direct linear connection between the two variables. The correlation graph (
Figure 4) illustrates that an increase in vehicle speed corresponds to an increased numbers of school-aged vehicle crashes (
Figure 4a) and school-aged fatalities (
Figure 4b). The determination coefficients of 0.95 (traffic crashes) and 0.92 (fatalities) indicated that the speed of vehicles explained the variation of the traffic crashes and fatalities in the ratios of 95% and 92%. The intensity of the linear dependence between the two variables is given by the correlation coefficients (Pearson): 0.98 in the case of the dependence between the speed of vehicles and vehicle crashes, and 0.96 between number of fatalities and speed limit. Abdel-Aty et al. [
10] found that the vehicle speed directly influences the frequency of traffic crashes involving school-aged (4–18 years old) pedestrians in Orange County, Florida. In a similar study, Tay et al. [
36] reported that the severity of pedestrian–vehicle crashes in South Korea was correlated with vehicle speed.
While researching the connection between age group and traffic crashes that occurred in the context of pedestrians’ unsafe crossing behavior (
Figure 5a), and by the car drivers not giving priority to pedestrians while they crossed the street (
Figure 5b), two clusters were identified—one including the age category up to 15 years and the other one corresponding to the age between 15–20 years. This illustrates the fact that the number of crashes due to pedestrians’ unsafe crossing behavior and car drivers not giving priority to pedestrians crossing roads increase with age until the age of 15. After this, the number of school-aged traffic crashes decreases continuously. The 0.75 and 0.94 (up to 15 years), and 0.92 and 0.94 (15–20 years) determination coefficients indicate the fact that age group (X) explains the variation of the school-aged pedestrian traffic crashes (Y).
These results highlighted that pre-school-, primary- and secondary-school-aged students do not follow the traffic rules, have the tendency to unsafely cross the street in places where it is not allowed, and do not exhibit safe street-crossing behavior. In high school, there is a decreasing trend of crashes and students start to be more careful when crossing the street.
These findings are in line with those achieved by Warsh et al. [
37]. These authors analyzed 2717 school-aged (younger than 18) pedestrian–vehicle crashes in Toronto and they found that the percentage of crashes was high until the age of 14 (71.4%). Starting at the age of 15, the percentage of crashes had a decreasing trend (28.6%). After analyzing school-aged (younger than 20) pedestrian–vehicle crashes in New York City, DiMaggio and Durkin [
21] also found a high frequency of injuries among 6–14-year-old students. One possible explanation could be the fact that once they grew older, the students gained more experience and were more familiar with the necessary abilities for crossing the street than the younger ones.
4.4. Unsafe Time Intervals Related to School-Aged Pedestrians
In order to identify the unsafe time intervals for school-aged pedestrians, we have analyzed the road traffic crashes corresponding to the three age groups (primary, secondary and high school) by time intervals.
The findings of the primary-school-aged pedestrian–vehicle crashes analysis by time intervals highlighted a time peak outside the 18:00–18:59 time interval, when people went back home from work or went shopping and other three peaks in the 12:00–12:59, 14:00–14:59, and 16:00–16:59 time intervals, when students traveled from school and the parents commuted from work (
Figure 6).
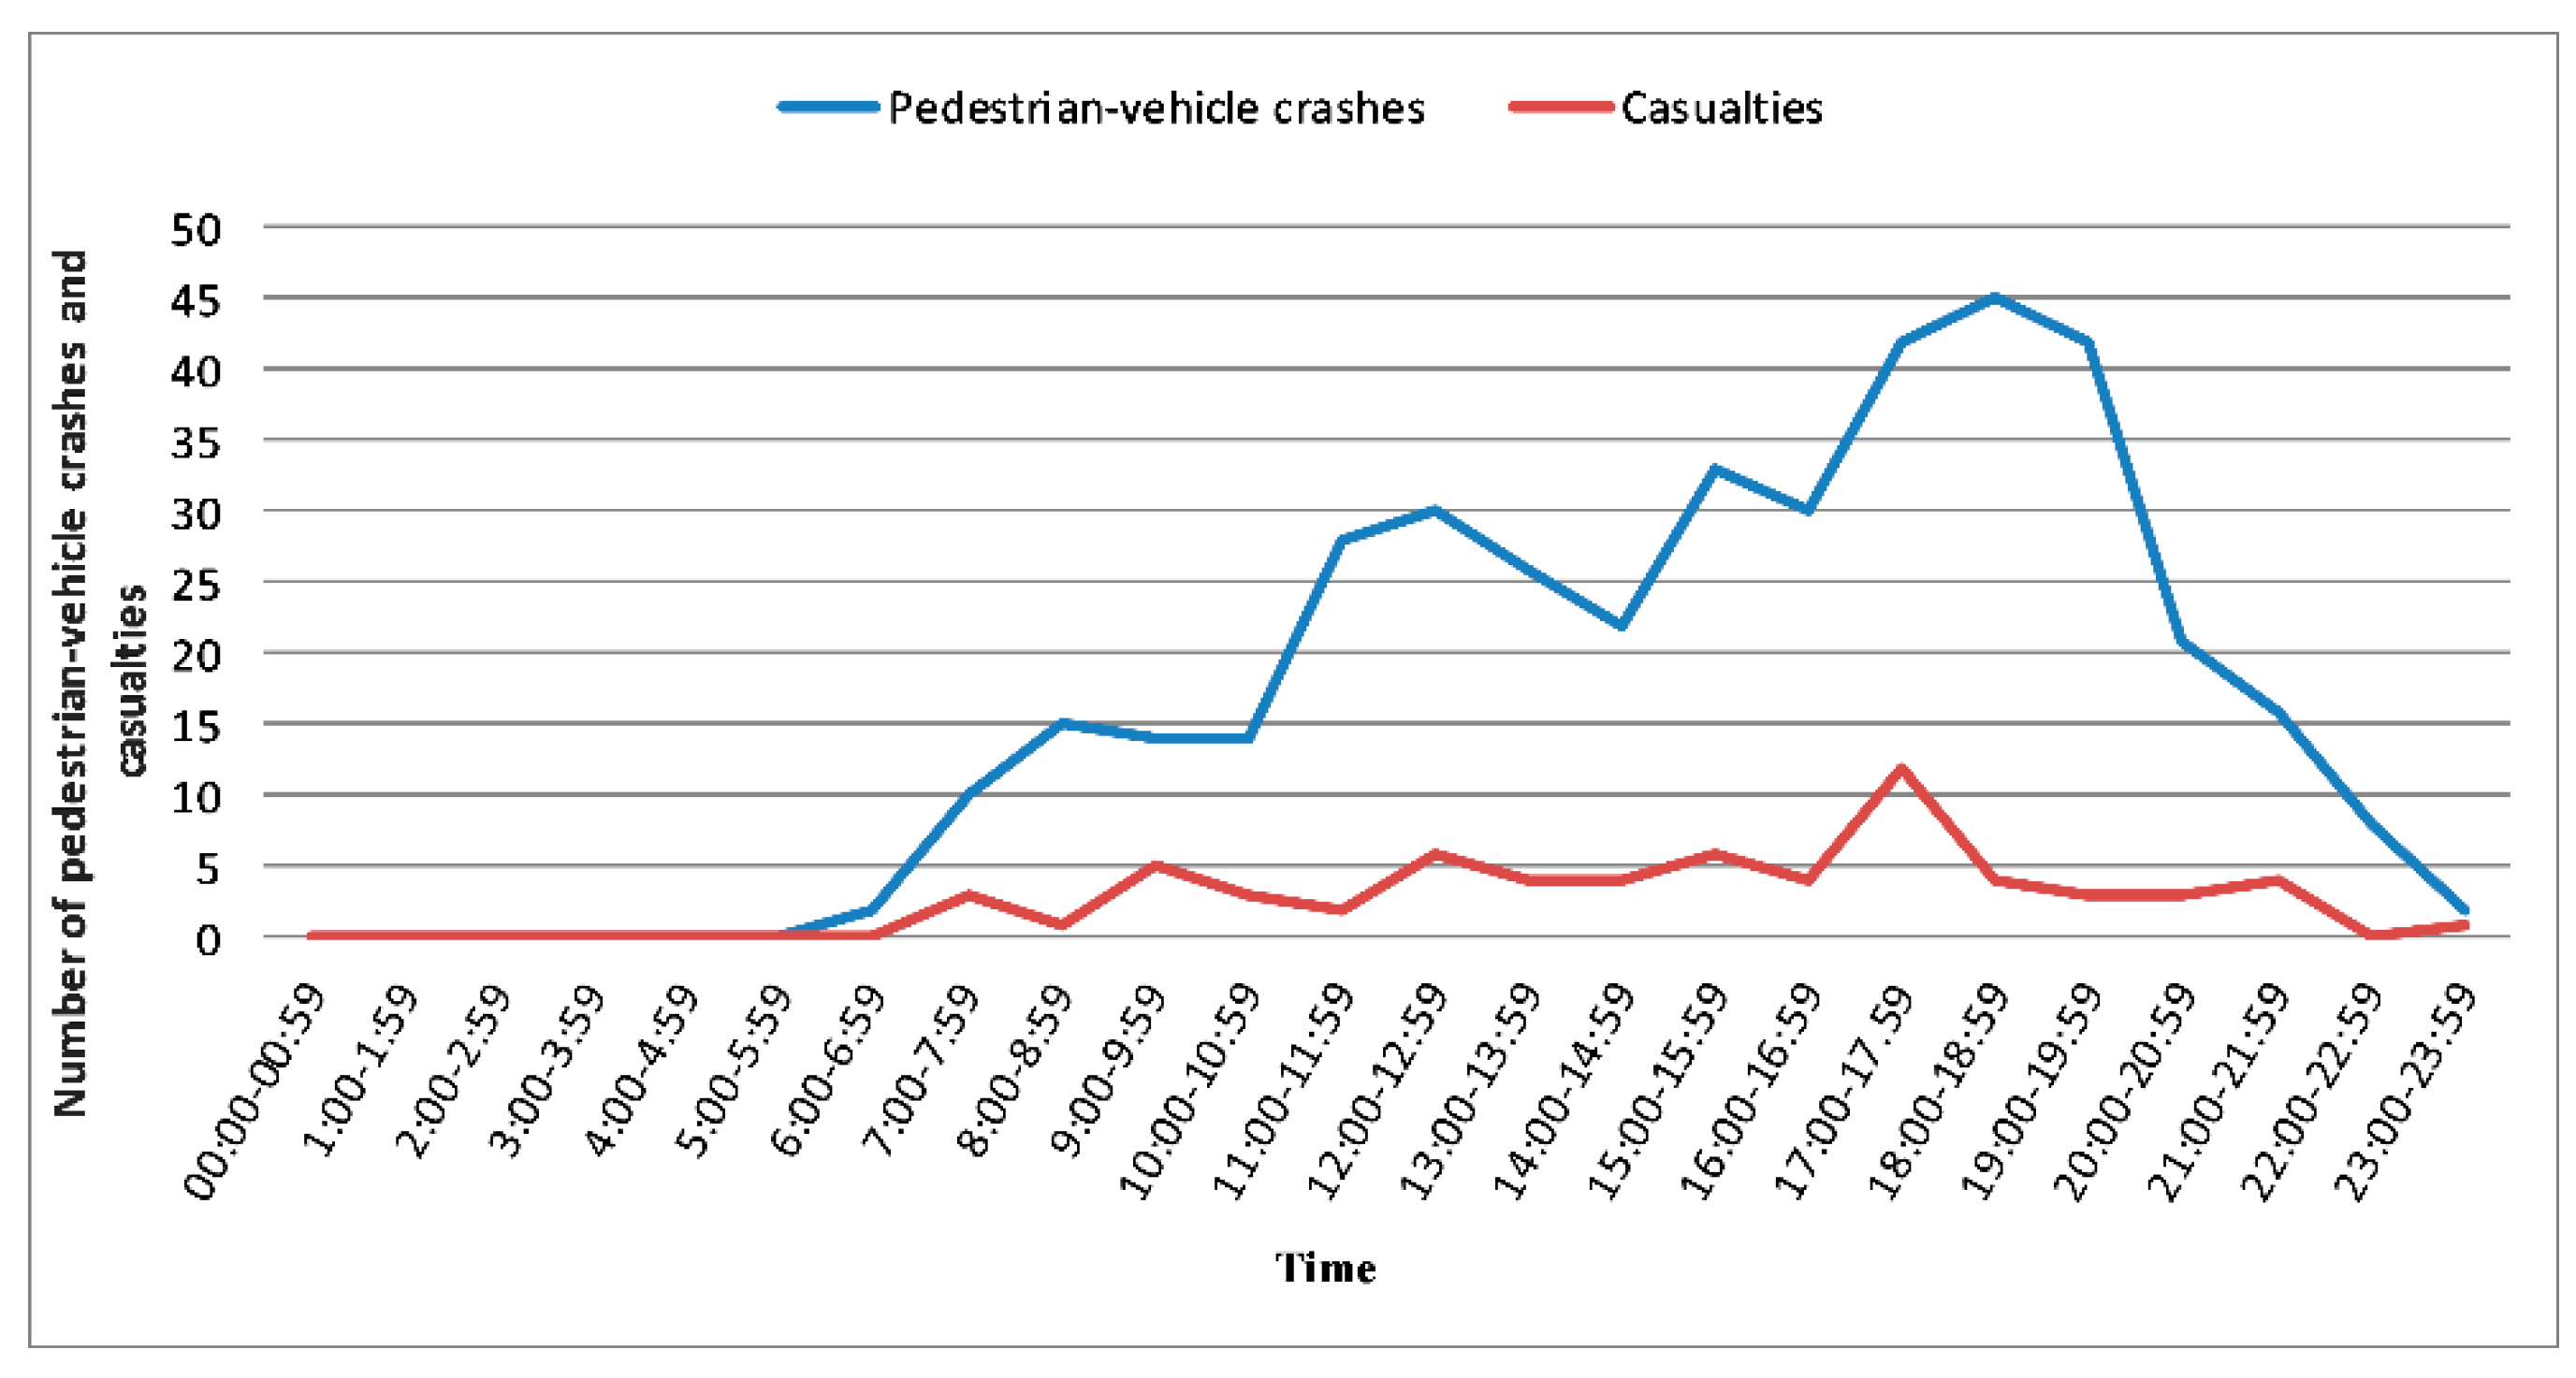
The results of the secondary-school-aged pedestrian–vehicle crashes analysis showed three time peaks with a high number of road traffic crashes and number of casualties occurring in the afternoon, still after school hours, in the 17:00–19:59 interval. Within this time interval the road traffic is high, as people commute from work and go shopping. Furthermore, a relatively high number of secondary-school-aged pedestrian–vehicle crashes can be noticed in
Figure 7, within the 12:00–16:59 time interval, when students travel from school. These findings are similar to those obtained by Warsh et al. [
37] and by Lightstone et al. [
38] who found a higher frequency of the school-aged pedestrian–vehicle crashes during the time intervals when students travelled to school.
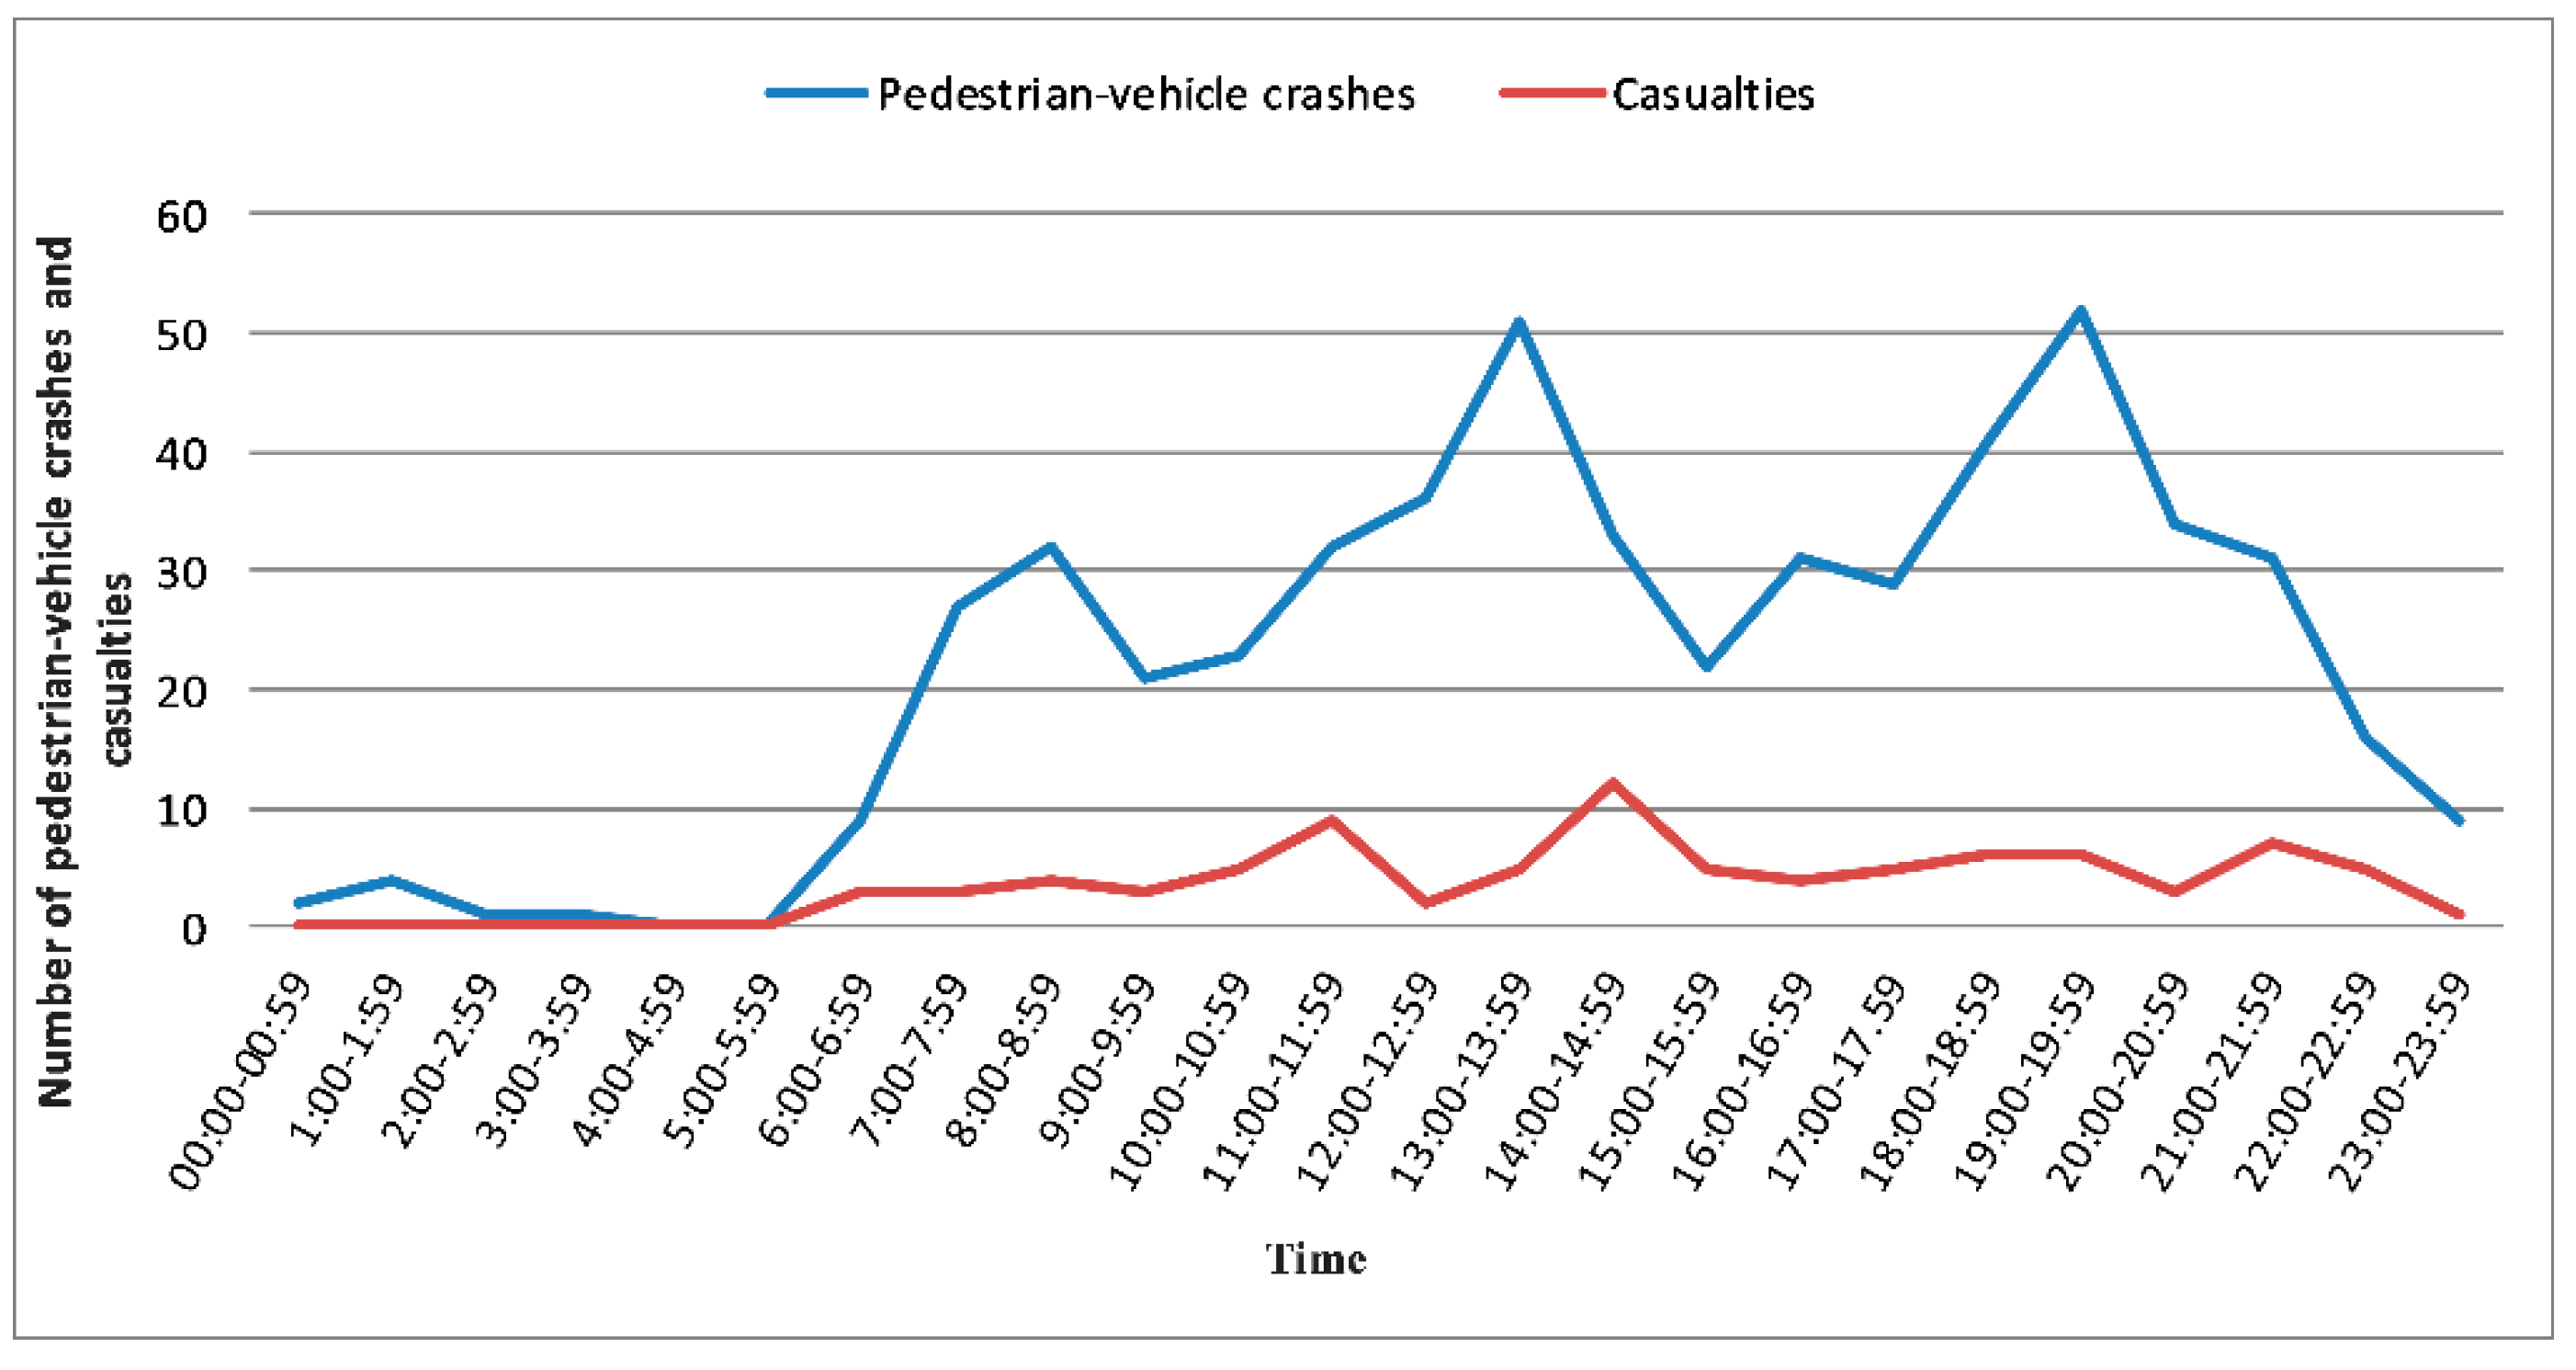
In terms of the high school age category,
Figure 8 reveals two time peaks with a high number of traffic crashes and casualties occurring in the 11:00–14.59 time interval, with a peak in the 13:00–13:59 interval, when children go home from school. Another peak is recorded in the evening, after school hours, in the 19:00–19:59 interval, when people go shopping.
The high-school-aged pedestrian–vehicle crashes, surprisingly, recorded a peak at the beginning of the day, during the 7:00–8:59 am time interval, when people commuted to work, and students to school. The lack of a morning time peak of road traffic crashes among the primary and secondary school children may be due to fact that students are accompanied to school by parents and relatives, while high school children travel alone. The high number of traffic crashes and casualties that occurred outside school hours can be explained by the fact that children are left unsupervised during these intervals. According to the European Commission report [
39], the largest number of school-aged pedestrian–vehicle crashes is recorded in the afternoon, when students go home from school or play outside. Research carried out by Russo and Comi [
40] has revealed that more than 50 % of urban traffic crashes occur at junctions.
4.5. Limitations
One of the main limitations of this study would be the lack of data regarding the traffic volume. If the authors had such a data set, the critical areas for the occurrence of the crashes would have been determined with a higher accuracy. This aspect remains under the attention of the authors for future research.
Another limitation could be the lack of data on traffic crashes over a longer period of time. In order to exclude some atypical variations, we would prefer a data base over a longer period (10–15 years). However, according to the published literature [
41], a period of 3–4 years would be enough.
5. Conclusions
The analysis of the number of school-aged casualties revealed a relatively linear trend during the study period, with no decreasing evolution. The investigation of the factors responsible for the traffic crashes occurrence revealed that 55% of the crashes were caused by pedestrians and 34% of those crashes occurred on the pedestrian crossings. The regression analysis emphasized the fact that the number of crashes due to pedestrians’ unsafe crossing behavior and car drivers not giving priority to pedestrians crossing the street successively increased until the age of 15; after this, school-aged traffic crashes decreased continuously. This means that experience enforces the learning effects in pedestrian traffic behavior.
Hot spots for traffic crashes involving school-aged pedestrians are concentrated exclusively in two administrative districts—2 and 4. These areas are highly congested due to the high number of traffic attractors like factories, schools, shopping malls, markets, and parks, which attract many visitors (both adults and school-aged children) on a daily basis. This indicates that future urban development plans should enhance measures that increase traffic safety. In addition, the land use planning and construction permits for different traffic attractors like factories, schools, or large commercial units do not take into account the traffic effects generated by the locations of these units.
The research on the degree of dependence between traffic crashes and vehicle speed, respectively, and age group illustrates the fact that speed and age are the main factors in school-aged pedestrian–vehicle crashes. The time peaks identified as unsafe correspond to the afternoon hours, when both pedestrians and drivers are less focused and traffic is intense; one time peak overlaps the time interval when students commute from school and another time peak overlaps the evening hours, when people go shopping. In terms of high school students, one time peak was also identified in the morning, when they go to school. We can thus notice that school-aged pedestrian–vehicle crashes happen when students are left unsupervised, near schools, parks, and shopping malls.
The identification of areas vulnerable to school-aged pedestrian–vehicle crashes and the knowledge regarding the triggering factors of these crashes at a local level may help implement new urban traffic safety measures such as speed limitations, establishment of new signalized intersections, introduction of new crossings, and raising awareness among students. Overall, it will contribute to the strengthening of the sustainability dimensions of urban development and planning [
42,
43].


