1. Introduction
Road traffic accidents are a major contributing factor causing death among young people aged between 15 and 29 years, and it cost governments approximately 3% of the GDP [
1]. Although the number of road traffic fatalities has decreased in the past few decades, this proportion has remained unchanged [
2]. Therefore, the prevention of road traffic accidents of novice drivers is an important issue to ensure the safety of young peoples’ lives and property. Speeding, generally defined as exceeding a speed limit, is one of the main contributing factors to road traffic crashes [
3]. Speeding is closely related to the accident probability [
4]. However, speeding reflects complex motivations, including the fact that they do not realize their speeding behavior [
5], which has long-term stability and is hard to reduce [
6]. How to effectively reduce young drivers’ speeding behavior becomes an essential issue.
Intervention is an effective way to combat speeding behavior [
7]. Police enforcement is the traditional way to solve the problem of speeding. It turns out that police enforcement has effectively reduced the mean speed. In Walter’s study, practical investigations have been conducted to explore the relationship between traffic policing levels and speeding behavior. Operation Radar worked for four weeks and the police appeared simultaneously, combining static and mobile policing methods. The results showed that the vehicle speed was systematically reduced and the effect of the intervention continued until two weeks after the end of the operation [
8]. Police intervention is a valid approach, but it is not always useful for all people and in all driving environments; it also has some limitations. The researchers studied the penal rules for speeding behavior and the driver’s perception of speed limits. The results have shown that drivers overestimated the possibility of being caught by speeding and the driver’s expected penalty was twice the real penalty, which may result in more reckless driving [
9].
Another traditional way to solve the problem of speeding is to try to influence the general norms through educational intervention. Educational intervention (e.g., training and media campaigns), changing the motivation of drivers is the first choice, other than the law, for most managers. The interventions based on imagining the emotional aftermath of being the perpetrator of a severe accident can lead to a heightened awareness of the potential adverse outcomes of accidents and lead to the reduction of speeding [
10]. The advertising campaign is used to control urban speeding in Scotland. It has proven to have been effective in changing the attitudes regarding speeding [
11]. Some researchers verified the effectiveness of anti-speeding information by analyzing qualitative and quantitative data [
12]. Additionally, Bernice indicated that after viewing the anti-speeding advertisements, the average speed decreased modestly [
13]. The brief psychological intervention proved itself to be another effective method for improving traffic safety. Some researchers evaluated the efficacy of a psychological intervention on novice drivers’ speeding behavior. The intervention was led by a psychologist and consisted of driving school lessons. The drivers that experienced no interventions had double as many speeding violations compared to the drivers that experienced an intervention [
14]. Other studies have also concluded that speeding is habitual and interferes with the process of translating motivation into action [
15]. Educational intervention against speeding is an insufficient solution due to the following reasons: the educational interventions are intermittent and only act at a specific time; the effect of the intervention decreases with time, which affects the efficiency of the intervention. So, some researchers have tried to find a new method to intervene at a higher frequency. For example, Sharon gave work-related driver weekly feedback on their speeding performance and goal setting exercises using an objective measurement tool. However, this may be still not timely and frequent enough, additionally requiring many specialized managers to analyze the driving data and guide the exercise [
16]. The brief summary of the practical interventions aimed at combating speeding behavior is shown in
Table 1.
Nowadays, more timely and frequent interventions are being developed. The warnings contained more detailed hazard information, can improve the general drivers’ power of concentration [
17] and warning information has proven effective in reducing traffic accidents caused by the reduction of the driver’s vigilance [
18]. For instance, this study verified that in-vehicle warning information can improve drivers’ performance on decision-making and emergency response [
19]. In addition, it was found that the driver’s deceleration will be higher when the audio warning system is implemented [
20]. If we add educational information in speeding warning and combine the advantages of warning and education, the novel intervention is capable of intervening with drivers in a more frequent and timelier manner while driving. However, an intervention strategy which can provide the best performance is not clear now.
Voice warning, visual warning, and tactile warning are the three main traditional intervention methods. The lighting and the steering wheel vibration are the most common visual and tactile intervention methods which have been used as early warnings. So, this paper will mainly study those three intervention modalities. Some research has proved that the combination of two or more warning methods is more effective. Navarro demonstrated that the combination of tactile warning signals and audible warnings produced a significant improvement both in validity and acceptance [
21]. In another study, it was verified that drivers’ performance would be effectively improved when warning information was presented through multiple modalities [
22]. In this study, we will test the intervention effect of a different combination of the three intervention modalities.
In summary, research on speeding behavior focused on the impact on safety and the factors that cause accidents, for example, high speed is an important risk factor for fatal accidents triggered by drivers at work [
4]. Some researchers explored the factors affecting speeding behavior such as occupation, operation mode, working time, driving distance, the attitude of speeding. However, there is limited research on the intervention measures for speeding behavior. Existing interventions mainly included police intervention and educational intervention. To date, no research in the literature exists on the evaluation of specific interventions which could effectively reduce speeding. This paper mainly explores the impact of demographic factors on the intervention effect and establishes an intervention strategy for drivers to achieve optimal intervention effect. Drivers with different characteristics, such as personality, driving experience and gender, should be intervened using different intervention. Previous studies have proved that traditional intervention methods and speeding warnings both have a positive effect on speed reduction. This provides researchers with an opportunity to combine the strengths of the two methods to achieve a better intervention effect, which contributes to managing and improving the issue of speeding behavior. To the best knowledge of the authors, this paper is one of the first attempts to design a timely and practical intervention method with more information and test the direct intervention effect and education effect, then applying the effective intervention method to improve the speeding behavior. The contributions of this paper can be summarized as follows:
- (a)
This study explores the differences in the intervention effect between various interventions and voice intervention designed with various modes. In general, the combined intervention of single voice, lighting, and steering wheel vibrations have the best performance of the intervention effect, and the voice intervention designed with Emotional Styles works better than Rational Styles.
- (b)
Previous studies did not pay attention to the impacts of the driver’s demographic factors on the intervention effect, viewing drivers as a general group. In contrast, in this paper the most representative factors (driving experience, gender, personality and driving style variable) were chosen to be analyzed, revealing the potential influence of demographic factors.
- (c)
Validated by the speed and subjective questionnaire data, the authors proposed a novel and precise intervention strategy which takes the demographic features into consideration. This can provide guidance for drivers to select an appropriate intervention and theoretical basis for engineers to design smart in-vehicle systems aimed at combating speeding behavior. Moreover, it can facilitate the intelligent management of speeding behavior, instead of limiting it to anti-speeding signs and police penalties.
The purpose of this article is to find the link between demographic factors and the intervention effect and to design a more direct and practical intervention strategy to combat speeding. This article mainly explores the following: (1) the intervention effect of the four combined interventions (2) the intervention effect of the voice intervention designed with the five modes (3) the impacts of the driving experience, gender, personality, and driving style variables on the intervention effect, and finally, the best intervention strategy is formulated based on the demographic features of the driver.
The paper is organized as follows. In
Section 2, the experimental method is presented.
Section 3 presents the results of the experiment, moreover, a new driving style variable was designed and the intervention strategy was proposed in
Section 3. Finally, in
Section 4, the conclusion was drawn.
2. Materials and Methods
2.1. Participants
In this study, for the purpose of revealing the impacts of different intervention information, a natural distribution group of participants was recruited to avoid biases resulting from other factors, such as gender, age, and personality. All of the drivers were in good physical condition without simulator sickness. Therefore, 80 drivers were recruited, in which 60 drivers were young and with poor driving experience. The other 20 drivers were experienced and with at least 3 years of driving experience. A total of 60 novice drivers were recruited using the three inclusion criteria: (1) age between 20 and 25 years old, (2) a driver’s license, (3) no more than one year’s driving experience at the time of testing. The novice drivers (n = 60, Mean-Age = 23.0, SD-Age = 2.6) were divided into the choleric personality group (n = 19, 31.7%), the sanguine personality group (n = 16,26.7%), the phlegmatic personality group (n = 15,25.0%) and the melancholic personality group (n = 11,18.3%) according to the four types of personality in EPQ. There are 11 female drivers and 49 male drivers in 60 drivers. The 20 experienced drivers (n = 20, Mean-Age = 32.8, SD-Age = 6.4) included 15 male drivers and 5 female drivers. There are 6 choleric, 4 sanguine, 5 phlegmatic and 5 melancholic personalities in the experienced drivers, the melancholic personality proportion of which is higher than in novice drivers.
2.2. Apparatus
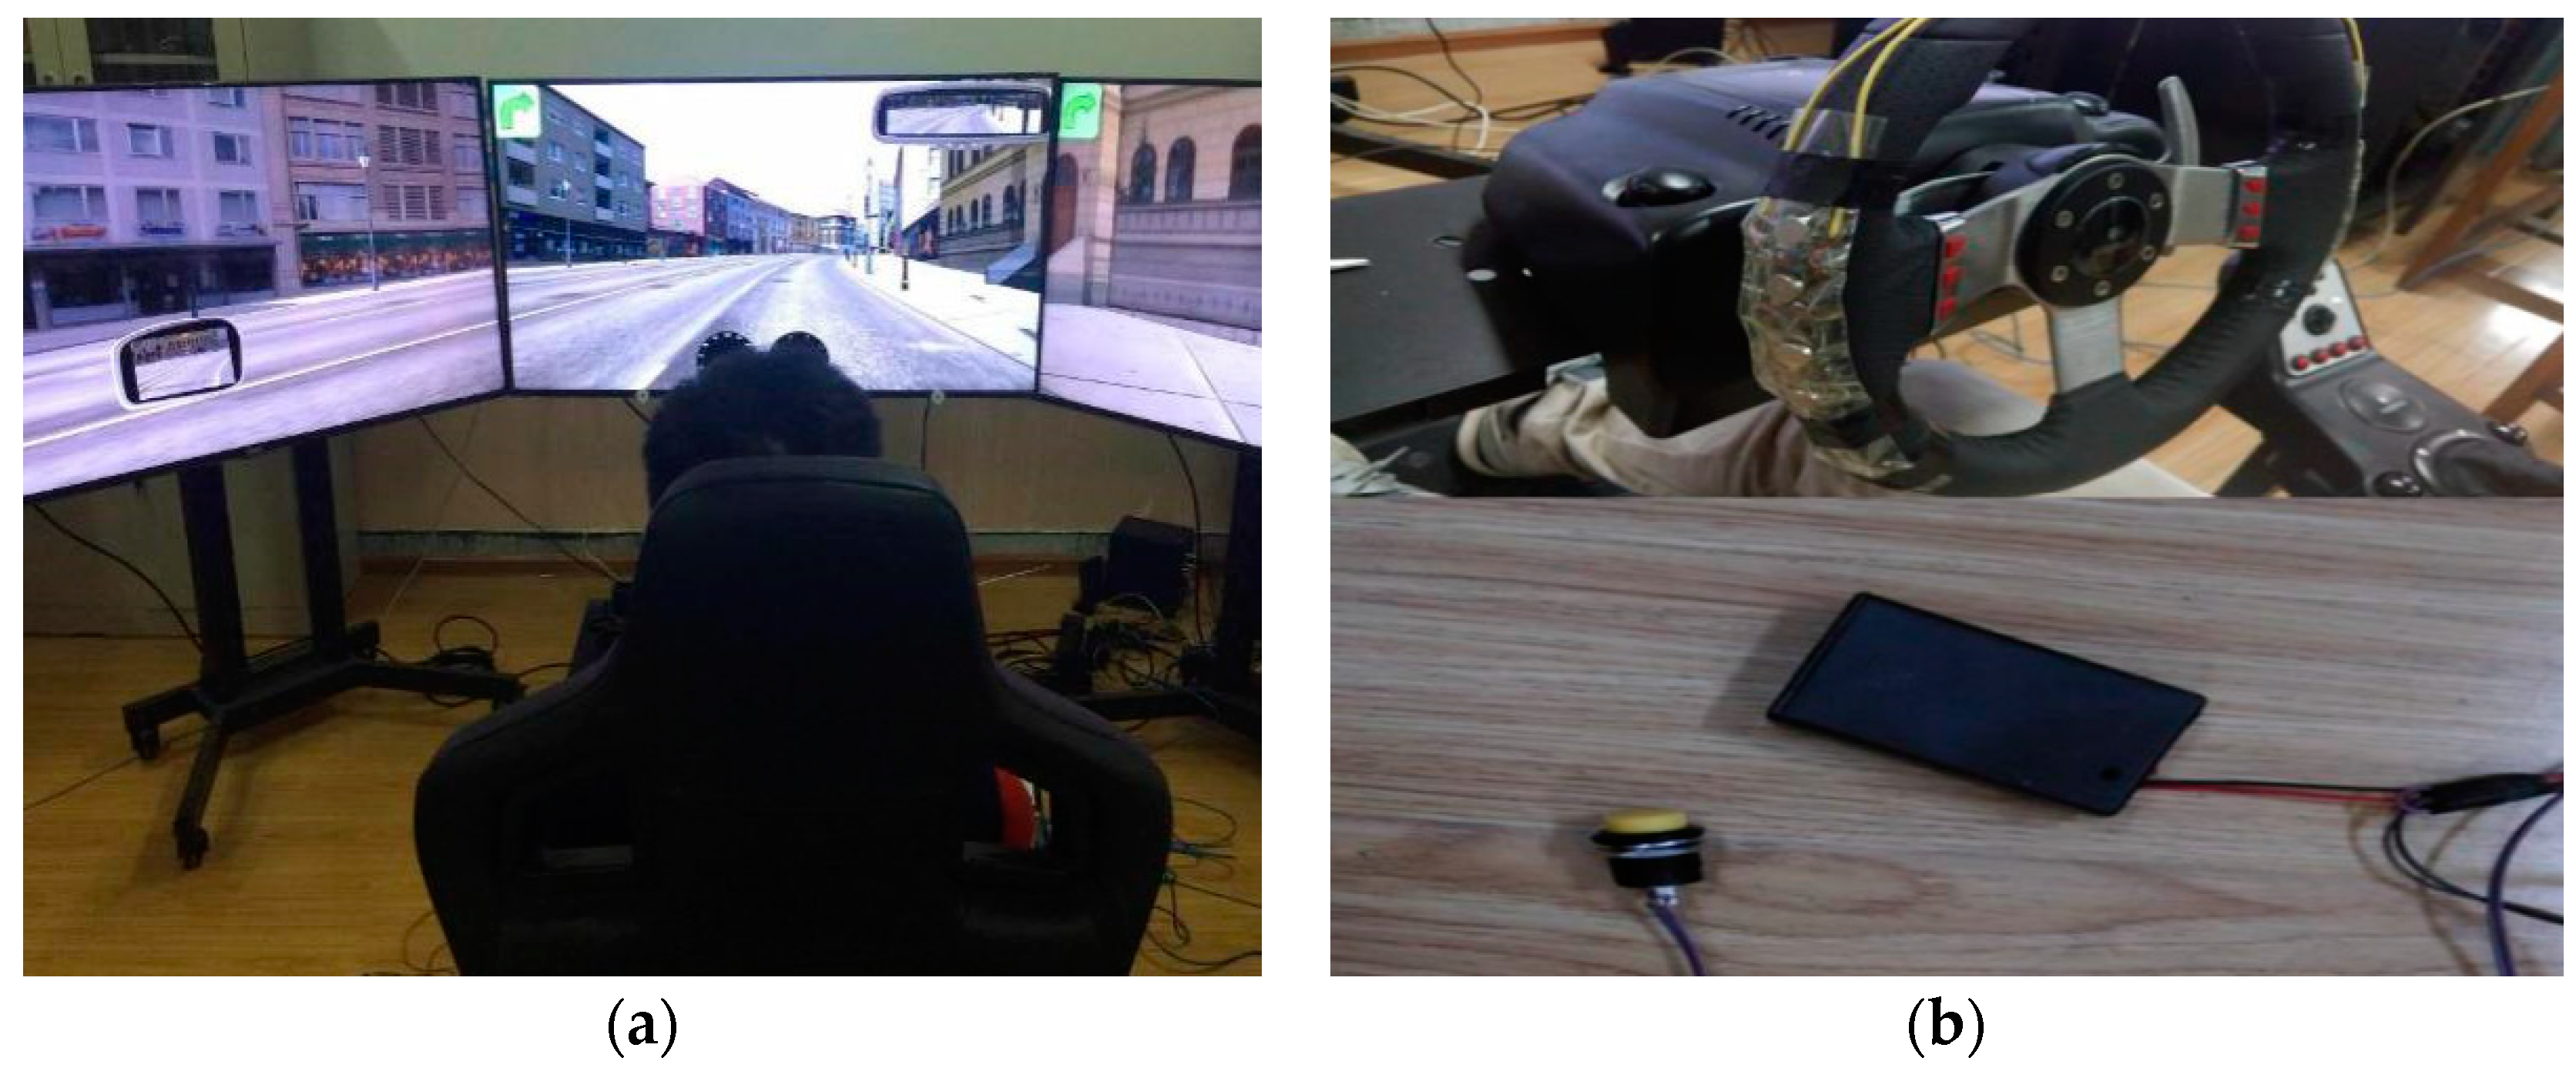
As shown in
Figure 1a, the experiments were conducted on a triple screen driving simulator with an advanced and reliable SILAB Version 4.0 system (WIVW Inc, Wuerzburg Institute for Traffic Sciences). The simulator platform consists of a steering wheel, a driver’s seat, brackets, three screens and five computers (three responsible for running the scenarios, one for the main controller and the last for recording data). The display system is composed of three connected screens, which can give the driver a more realistic 3D field. The system can be employed for many different tasks, including operating driving simulators at a variety of configuration levels, recording and processing experimental data, and generating signals in a real test environment and providing those signals in different ways. The DPUDataFile is responsible for the time-synchronous recording of measured data typically at the frequency between 50 Hz and 150 Hz which is considered sufficient to detect the speed change in the driving simulator.
The computer was employed to present the voice, the well-designed voice files were stored in the computer, and voice information would appear sequentially according to the experimental requirements. The earphones were selected for the study in order to prevent noise.
As shown in
Figure 1b, vibrotactile stimulation presented via the steering wheel was selected for the study. The device consisted of many vibrators delivering vibrations to participants.
2.3. Intervention Effect Measured Approach
This paper mainly studies two effects of the intervention on speeding. The first is the direct effect on speeding when the intervention was applied to speeding; the second is the education effect on speeding after the intervention.
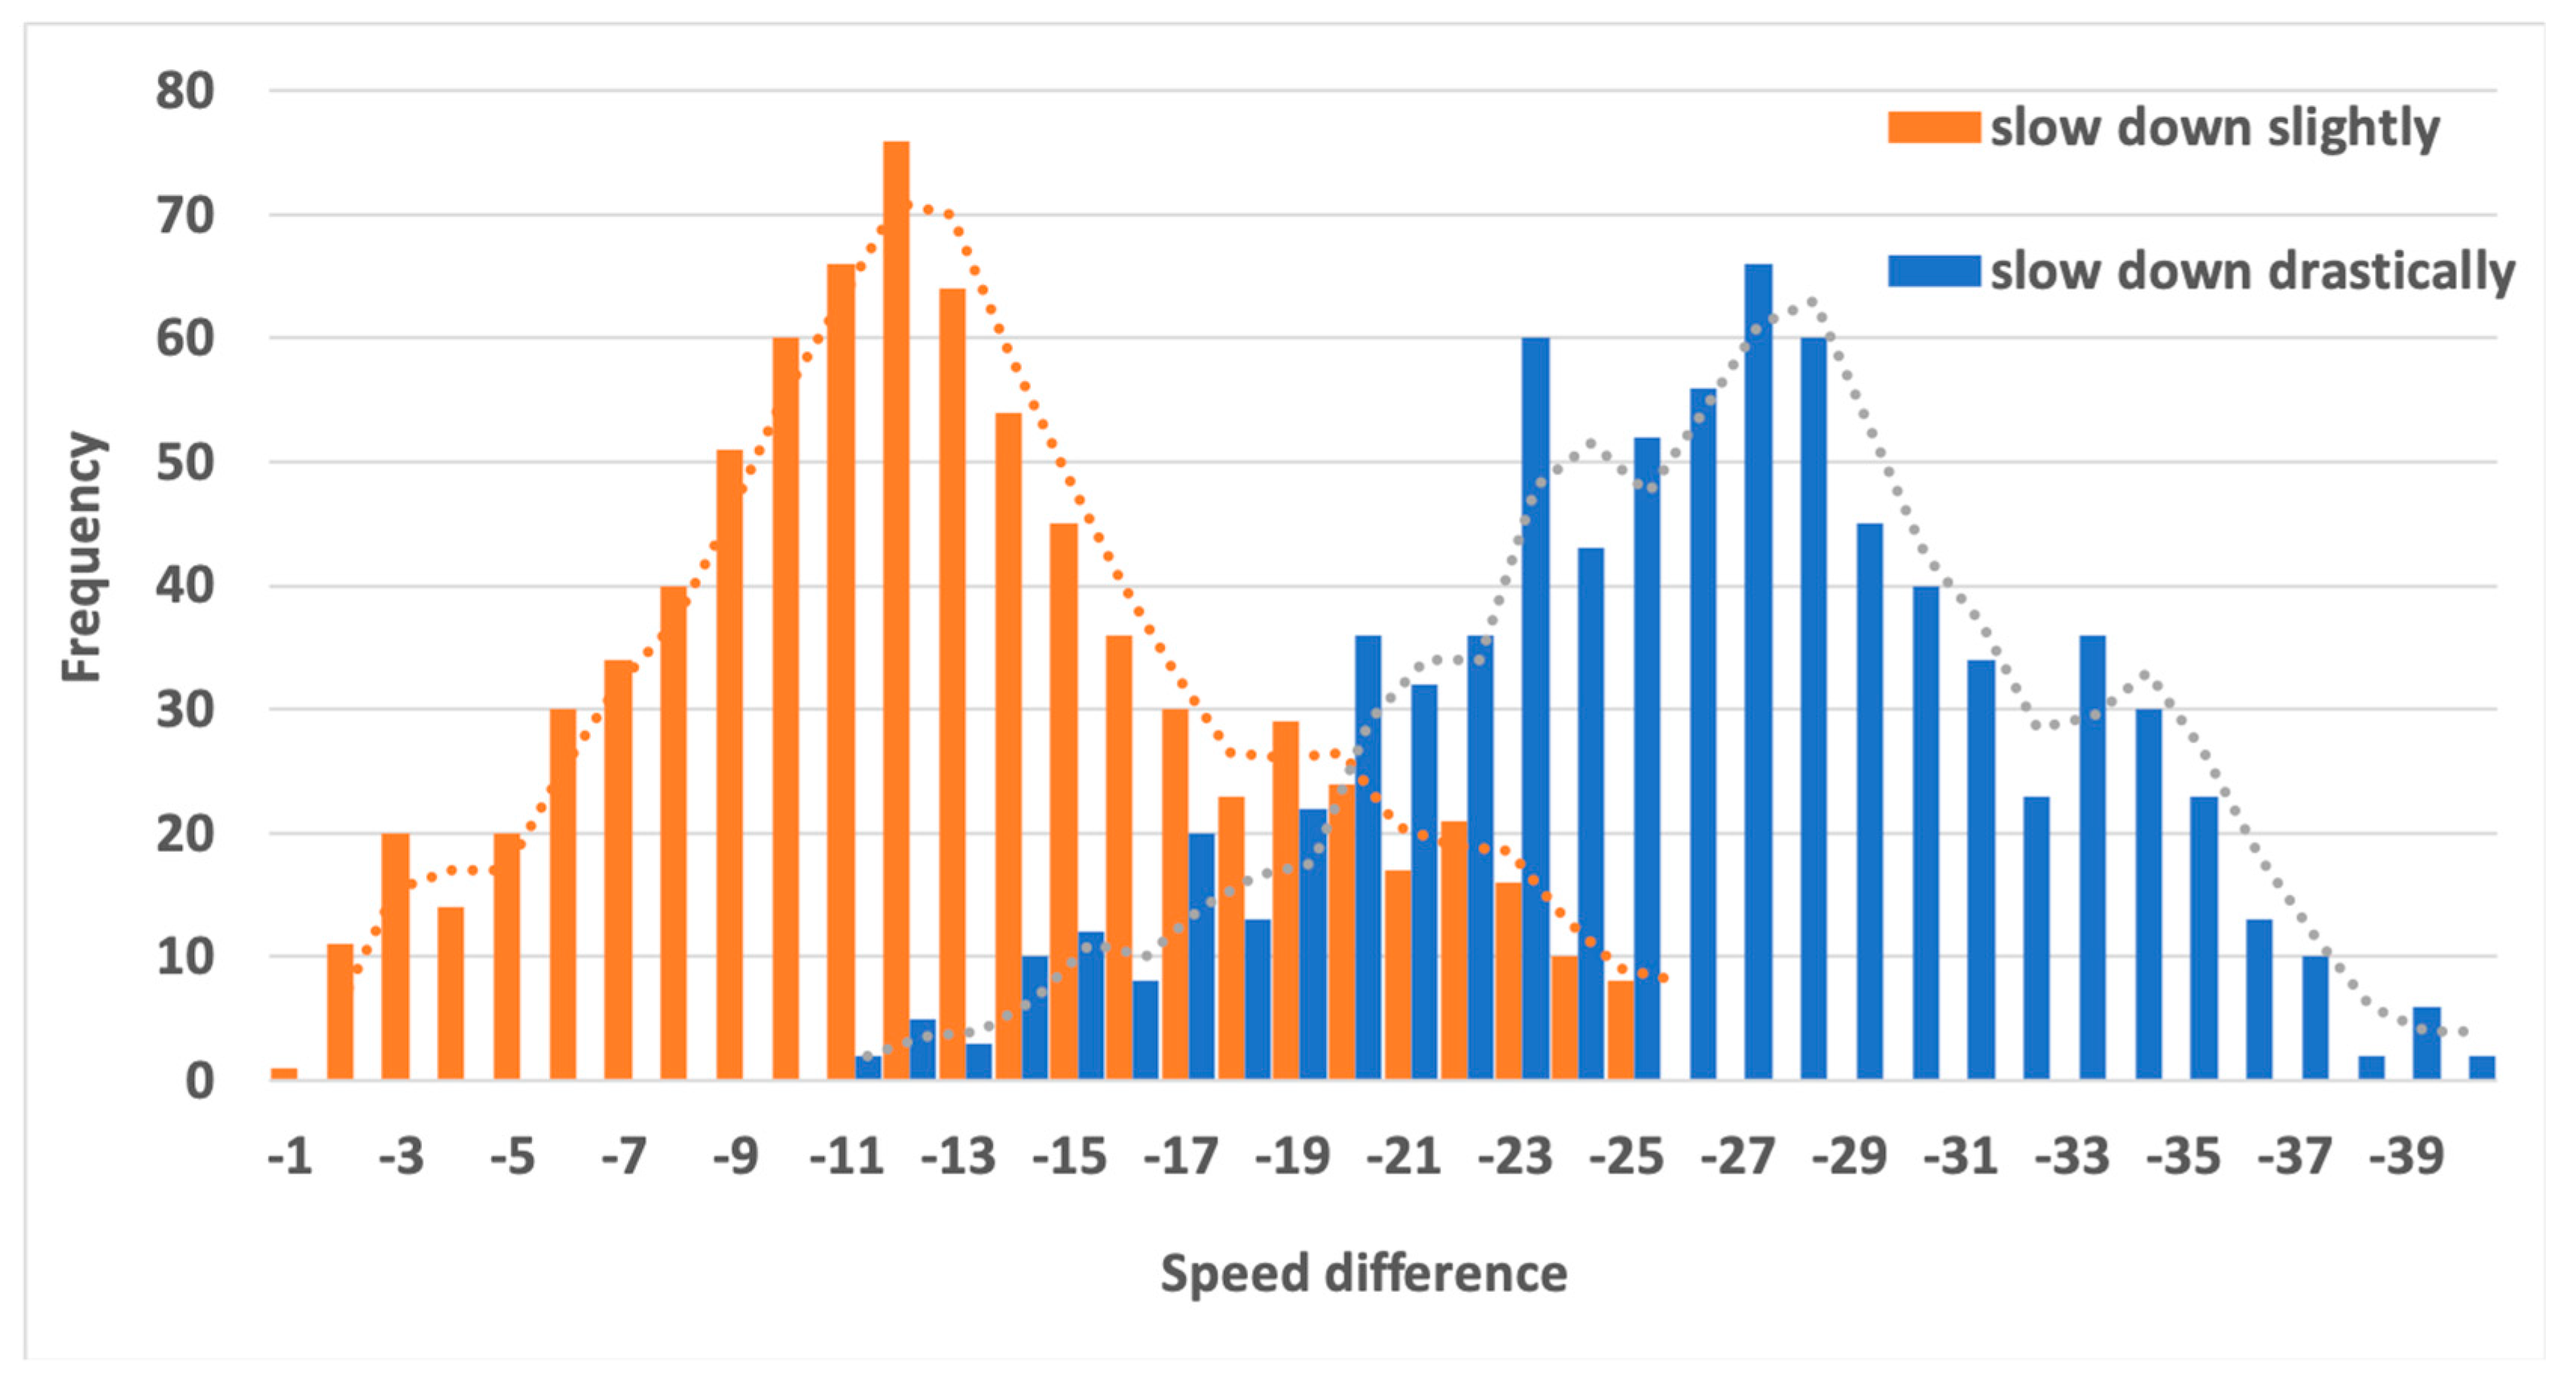
The first effect was measured by the reduction in speed when the interventions were applied to the driver during driving. The speed data was recorded by the system. In the experiment, we found that it was difficult for most drivers to control deceleration accurately according to their intentions. Since the brake pedal force feedback of the simulator was less than that of the real vehicle, and the driver’s perception of speed in the simulated scene would become weaker. At the end of the whole experiment, all participants were asked to slow down slightly, then drastically, 10 times, separately while driving at speeds of more than 60 km/h. A total of 1600 data points of the speed fluctuation for “slow down slightly” and "slow down drastically” were recorded and are shown in
Figure 2.
As shown in
Figure 2, when the driver intends to slow down slightly, the value of the speed difference varies from −25 to 0 and follows the normal distribution. This means that the intervention effect may be the same when the value of speed difference is in the range of −25 to 0. When the driver intends to slow down drastically, the value of the speed difference follows a similar pattern. In order to measure the intervention effects more accurately, this paper divided the intervention effects into four levels.
Intervention Level, extracted from the value of the speed difference, could reflect the performance of controlling the drivers’ speed. The Intervention Level was defined as follows:
- Level 1:
the value of the speed difference < −20 km/h. This indicates that the intervention effects are significant, and the speed significantly decreased after the intervention.
- Level 2:
3 km/h < the value of speed difference ≤ −20 km/h. This indicates that the intervention effects are good, and the speed slows down after the intervention.
- Level 3:
−3 km/h ≤ the value of speed difference < 3 km/h. This indicates that the intervention has no effects, and the speed remains almost unchanged after the intervention.
- Level 4:
3 km/h ≤ the value of the speed difference. It indicates that the intervention has a diametrically opposed effect on the speed reduction; the speed increased after the intervention.
Level 1 and Level 2 are called positive effects on the speed reduction in this paper. Level 3 was defined as having no effect on speed reduction, and Level 4 was called a negative effect on speed reduction.
Subjective questionnaires were selected to evaluate the education effect. Participants were encouraged to select the intervention which had the best performance of controlling their operating speed.
2.4. Intervention Design
The whole experiment contains two parts. In the first part, we try to test the effectiveness of the various combinations of three traditional interventions: voice (V), voice + lighting (VL), voice + steering wheel vibration (VSW) and voice + lighting + steering wheel vibration (VLSW).
voice (V): single voice intervention served as a baseline intervention.
voice + lighting (VL): the combination of voice intervention and lighting
voice + steering wheel vibration (VSW): the combination of voice intervention and steering wheel vibration.
voice + lighting + steering wheel vibration (VLSW): the combination of voice intervention, lighting, and steering wheel vibration.
The voice intervention would bring up the following message: “you are speeding, please slow down”
The second part mainly tests the effects of different voice intervention styles. Based on the psychology of advertising, intervention styles are divided into the rational style and the emotional style. A total of 16 voice styles containing 8 rational styles and 8 emotional styles were evaluated subjectively by 30 subjects using the Delphi Method. Five voice interventions produced the most enormous difference and are likely to achieve the best effect on speed reduction. The voice interventions designed with the rational style contained 3 intervention modes: the reasonable mode, supervisory mode, and statistical mode and the voice intervention designed with the emotional style contained 2 intervention modes: the persuasive mode and humorous mode. The specific settings are as follows:
(1) Emotional style
Persuasive Mode: “You have been speeding. For yours and others’ safety, please don’t exceed the speed limit!”
Humorous Mode: “You have been speeding, but you are not superman, please slow down!”
(2) Rational style
Reasonable Mode: “You have been speeding. 24% of traffic accidents occurred in intersections in our country. Please slow down!”
Supervisory Mode: " You have been speeding. this is an accident-prone area, If you do not slow down, the system will send messages to inform your family and company.”
Statistical Mode: “You have been speeding three times within the last ten kilometers. This proportion is much higher than the average. Please slow down!”
2.5. Procedure
(1) When participants arrived at the research laboratory, they were asked to sign an informed consent form, then they were explained the experimental process and related notes by the researcher. The participants, who were told that their responses would be confidential and used only for scientific research, were asked to complete a self-personality assessment questionnaire, and then personal information such as social demographic status and driving experience were collected.
(2) The researcher turned on the simulator and opened the practice scenario. In the practice session, participants were instructed to drive as they normally do, practice the operations of the driving simulator and adapt to the environment of the traffic simulation scene until the driver was completely familiar with the driving simulator and scene-related operations.
(3) Then the experiments were started. The driver started driving in the simulator. Three researchers were involved in the experiment. Researcher A was responsible for observing the speed of the driver in the simulation scene and for sending an order to researcher B when the driver was speeding. Researcher B carried out different interventions according to the experimental plan and researcher A’s orders. Researcher C was in charge of recording the time when the intervention occurred.
(4) The first part and second parts of the experiments were carried out separately. The experimental scene was closed after the first part experiment. The second part experiment was followed by a break of more than fifteen minutes.
(5) After the two parts of the experiment, the participant was asked to slow down slightly 10 times and to slow down drastically 10 times while driving at speeds of more than 60 km/h.
(6) When the experiment was completed, the driver selected the most memorable voice intervention by filling out a subjective questionnaire. Additionally, a subjective questionnaire was filled out again by the driver two weeks later.
(7) The intervention experiments in the simulator were completed and the experimental data were organized and saved correspondingly.
3. Results
The voice intervention was considered as a basic intervention. The intervention effect of different combined interventions and single voice intervention was analyzed in this part.
The k-related samples Friedman(F) test was conducted to test the difference of the intervention effect among the four interventions due to the fact that the Intervention Level did not follow the normal distribution. The Intervention Level of different interventions (V, VL, VSW, VLSW) were coded as variables. The IBM SPSS v18.0 was chosen in the statistical analysis tool. The means were viewed as significantly different at the 0.05 alpha level. If the Friedman test results indicated that there was a significant difference, Wilcoxon tests were performed for pairwise comparison of the variables.
The Wilcoxon test for paired samples, with the equivalent effect of the paired samples t-test, is a non-parametric test. It is applied to ordinal data or data that violate the normal distribution [
23]. The Intervention Level does not follow the normal distribution, so Wilcoxon Signed Rank tests were conducted to find the detailed differences between the various combined interventions. The means were regarded as significantly different at the 0.05 alpha level.
3.1. The Effects of Different Interventions on the Novice Drivers’ Speeding
As shown in
Table 2, the
p-values of VL-V, and VLSW-VSW were both higher than 0.05. Combining lighting does not produce a significant difference, in other words, the lighting does not affect the intervention effect significantly.
The
p-values of VSW-V and VLSW-VL were both smaller than 0.05. This indicated that steering wheel vibration has a significant influence on the intervention effect. Adding the steering wheel vibration intervention resulted in a significantly different intervention effect. The
p-value of VLSW-V was smaller than 0.05. Combining two intervention methods (lighting and steering wheel vibration) with the voice intervention method also resulted in a significant difference in the intervention effect. The
p-value of VSW-VL was also smaller than 0.05. This indicated that the intervention effect of lighting was significantly different from that of steering wheel vibration. As shown in
Figure 3, the intervention effect of steering wheel vibration was more significant than lighting.
Overall, the steer wheel vibration has a significant influence on the intervention effect, but lighting does not.
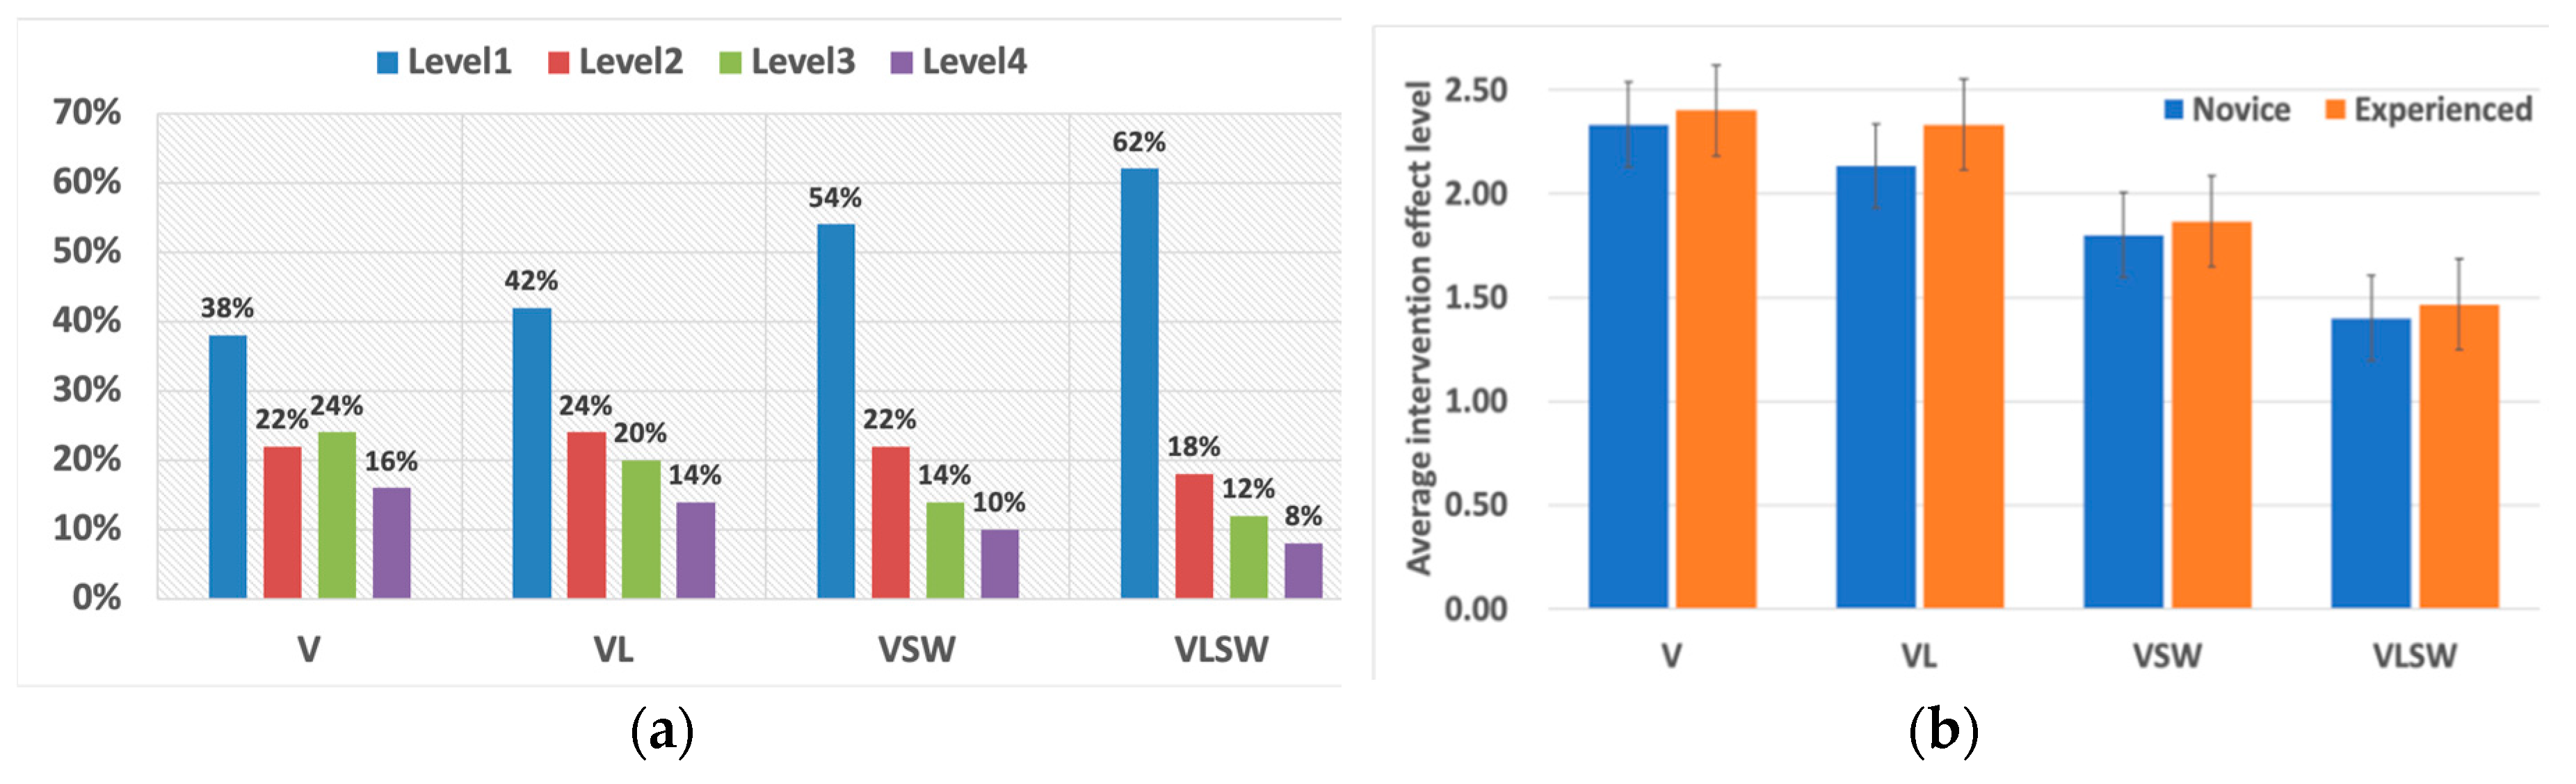
As shown in
Figure 3a, when the V intervention is experienced, 60% of participants were observed at a lower speed. The proportion was significantly less than those of VL (66%), VSW (76%) and the VLSW (80%). The VL, VSW and VLSW interventions all produced a positive effect on the speed reduction. Moreover, when experiencing the V intervention, 38% of participants belonged to level 1, which was a proportion of participants lower than those of VL (42%), the VSW (54%) and VLSW (62%).
The intervention effects of the 3 combined interventions are all better than single voice intervention. The intervention effects are enhanced with the increase of the intervention intensity. The more intervention methods that were combined, the better the intervention effects shown. VLSW shows the strongest effect on speed reduction. Furthermore, the steer wheel vibration produces a stronger effect than lighting on the speed reduction.
As shown in
Figure 3b, for experienced drivers, the Intervention Level after VSW (M = 1.87, SD = 0.72) and VLSW (M = 1.47, SD = 0.50) was lower than 2, indicating that VSW and VLSW produced a positive effect on the speed reduction. The Intervention Level after V and VL was (M = 2.40, SD = 0.80) and (M = 2.33, SD = 0.87) respectively. For novice drivers, the average Intervention Level of VSW (M = 1.80, SD = 0.75) and VLSW (M = 1.40, SD = 0.49) was lower than 2, showing that VSW and VLSW produced a good effect on the speed reduction. While, the Intervention Level of V and VL was (M = 2.33, SD = 0.79) and (M = 2.13, SD = 0.96) respectively, it can be concluded that the VL intervention had a slightly positive effect on the speed reduction. Compared with the baseline (V), the Intervention Levels of VL, VSW, and VLSW were all lower than V, indicating that the performance of the combined interventions would strengthen. Moreover, lighting has a limited influence. As long as the steering wheel vibration was applied, the speeds would significantly decrease.
Lighting has a limited intervention effect for experienced drivers and it produces a positive effect on novice drivers, the steering wheel vibration has a good effect on speed reduction for both novice and experienced drivers. In addition, experienced in the same intervention, the Intervention Level of novice drivers is lower than that of experienced drivers, indicating that the interventions produce a stronger effect on novice drivers. In other words, when the four interventions were implemented, novice drivers have a higher deceleration. A rich driving experience makes the drivers weigh more of the intervention information compared to actual driving conditions before making a decision. This makes experienced drivers less likely to follow the intervention information.
3.2. The Intervention Effect of Voice Intervention with Different Modes
The Intervention Level of the voice intervention designed with various modes did not follow the normal distribution either. A K-related samples Friedman(F) test was conducted to test the difference of the intervention effect among the five modes. The chi-square value and
p-value were 50.764 and 0.000, respectively. This indicated that there were significant differences among the intervention effects of the 5 voice intervention modes. In order to understand more about the differences between the different intervention modes, the author conducted a series of related samples Wilcoxon Signed Ranks Tests to find the effect differences between every pair of the voice intervention mode. The results are shown in
Table 3.
As shown in
Table 3, the intervention effect of most intervention modes had a significant difference with other intervention modes. The intervention mode had a significant influence on the intervention effect in most case. In the Emotional-Rational group, the
p-value of the 4 tests were smaller than 0.05 and the
p-values of the other two tests were larger than 0.05. The intervention effect of the Humorous Mode and Statistical Mode which belong to different intervention styles were both significantly different from the other modes. There was no significant difference between the other three intervention modes. The difference in intervention effect may be caused by intervention mode rather than the intervention style did. Overall, the mode of the voice intervention had a higher influence on the intervention effect than the intervention style. The Humorous Mode and Statistical Mode had a significantly better intervention effect on speeding than the other 3 voice intervention modes.
The Kruskal–Wallis test was conducted due to the non-normal distribution of the Intervention Level, testing whether there would be significant differences in the Intervention Levels after the five modes between different groups (novice vs. experienced, male vs. female, choleric vs. sanguine vs. phlegmatic vs. melancholic). The results of the Kruskal–Wallis Tests are presented in
Table 4.
As shown in
Table 4, driving experience has a significant impact (
P-value < 0.05) on the intervention effect of the Reasonable Mode and Statistical Mode. It was more likely to affect the intervention effect of the Rational Style.
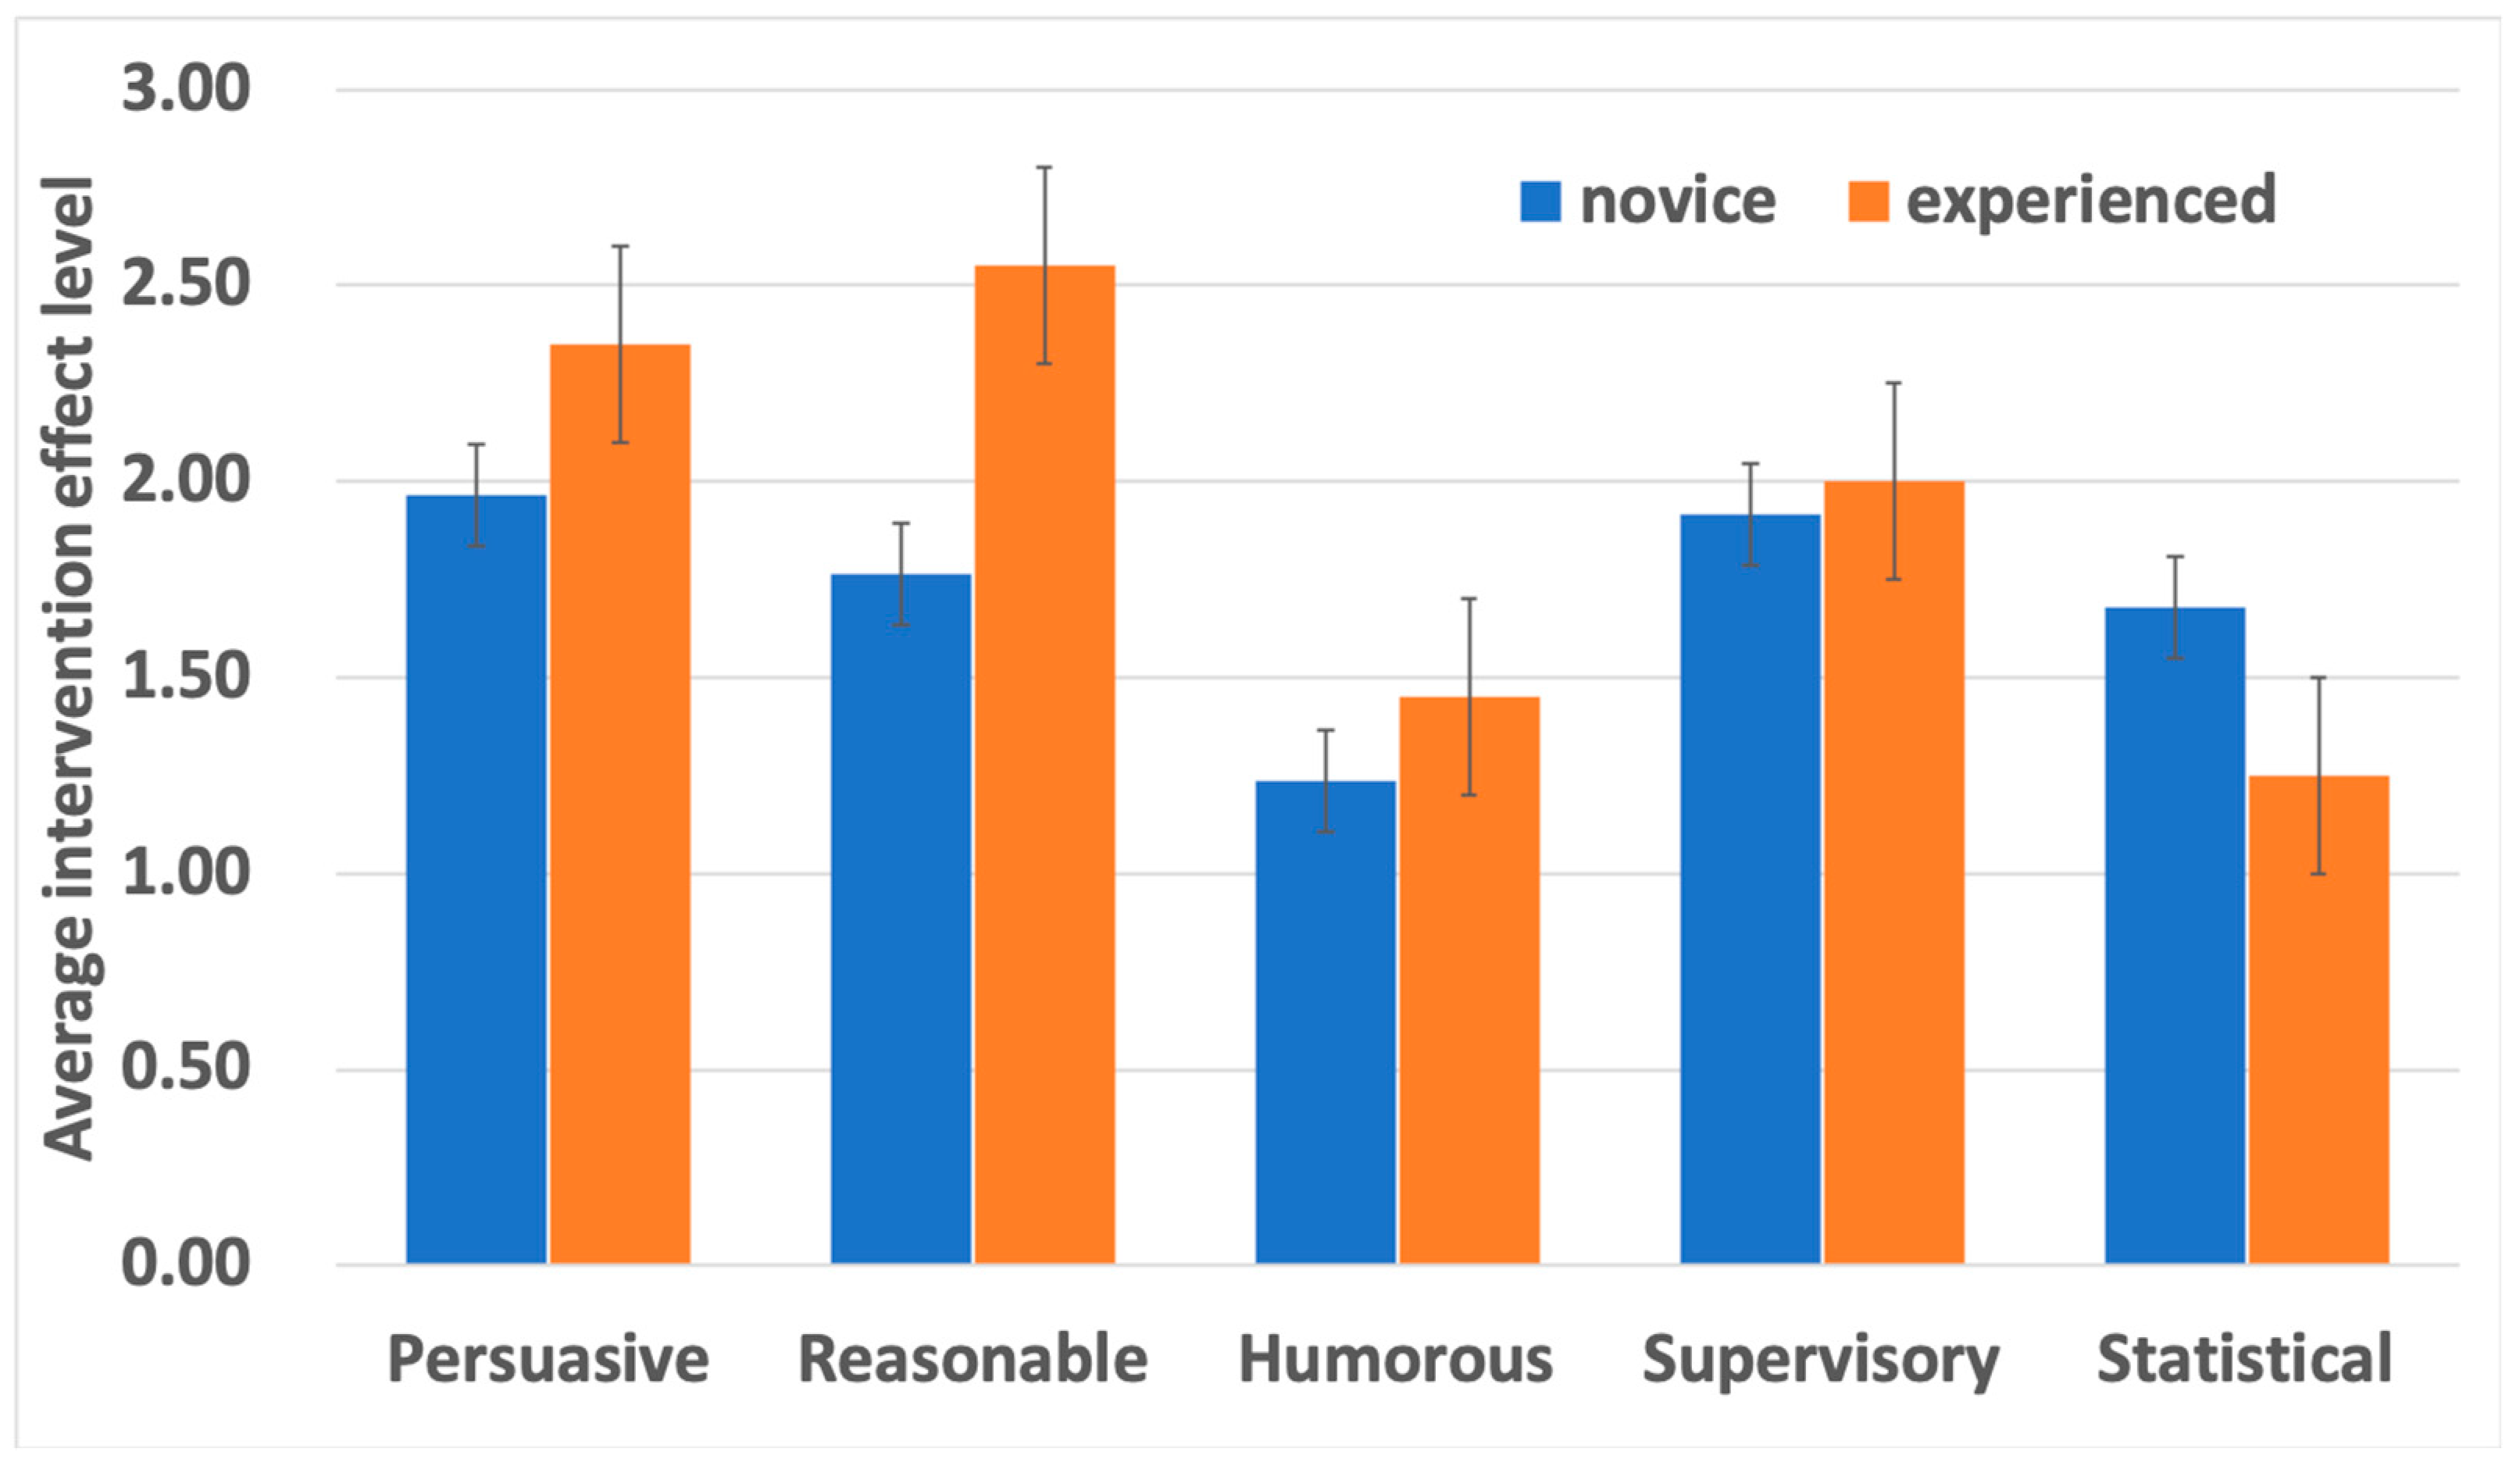
As shown in
Figure 4, for experienced drivers, the Humorous mode (M = 1.45, SD = 0.60) and Statistical mode (M = 1.25, SD = 0.55) produced a good effect on the speed reduction, with the average Intervention Level both being lower than 2. The Intervention Level experienced in Supervisory mode (M = 2.00, SD = 0.92 ), Persuasive mode (M = 2.35, SD = 0.67), Reasonable mode (M = 2.55, SD = 0.94 ) was equal or higher than 2, showing these three modes produced smaller positive effects on speed reduction than the first two modes. For novice drivers, the Intervention Levels experienced in the five modes were all lower than 2, showing that the five modes all produced good effects of speed reduction. Moreover, the Intervention levels experienced in the Humorous mode (M = 1.24, SD = 0.54) and Statistical mode (M = 1.68, SD = 0.84) were lower than in the Reasonable mode (M = 1.76, SD = 1.03), Supervisory mode (M = 1.92, SD = 1.00), Persuasive mode (M = 1.97, SD = 1.20).
The intervention effects of the Humorous Mode and Statistical Mode were better than the other 3 intervention modes.
Humorous Mode had the best effect on novice drivers, while the Statistical Mode had the best effect on experienced drivers.
Voice intervention had a better effect on novice drivers than in experienced drivers in all modes except the Statistical Mode.
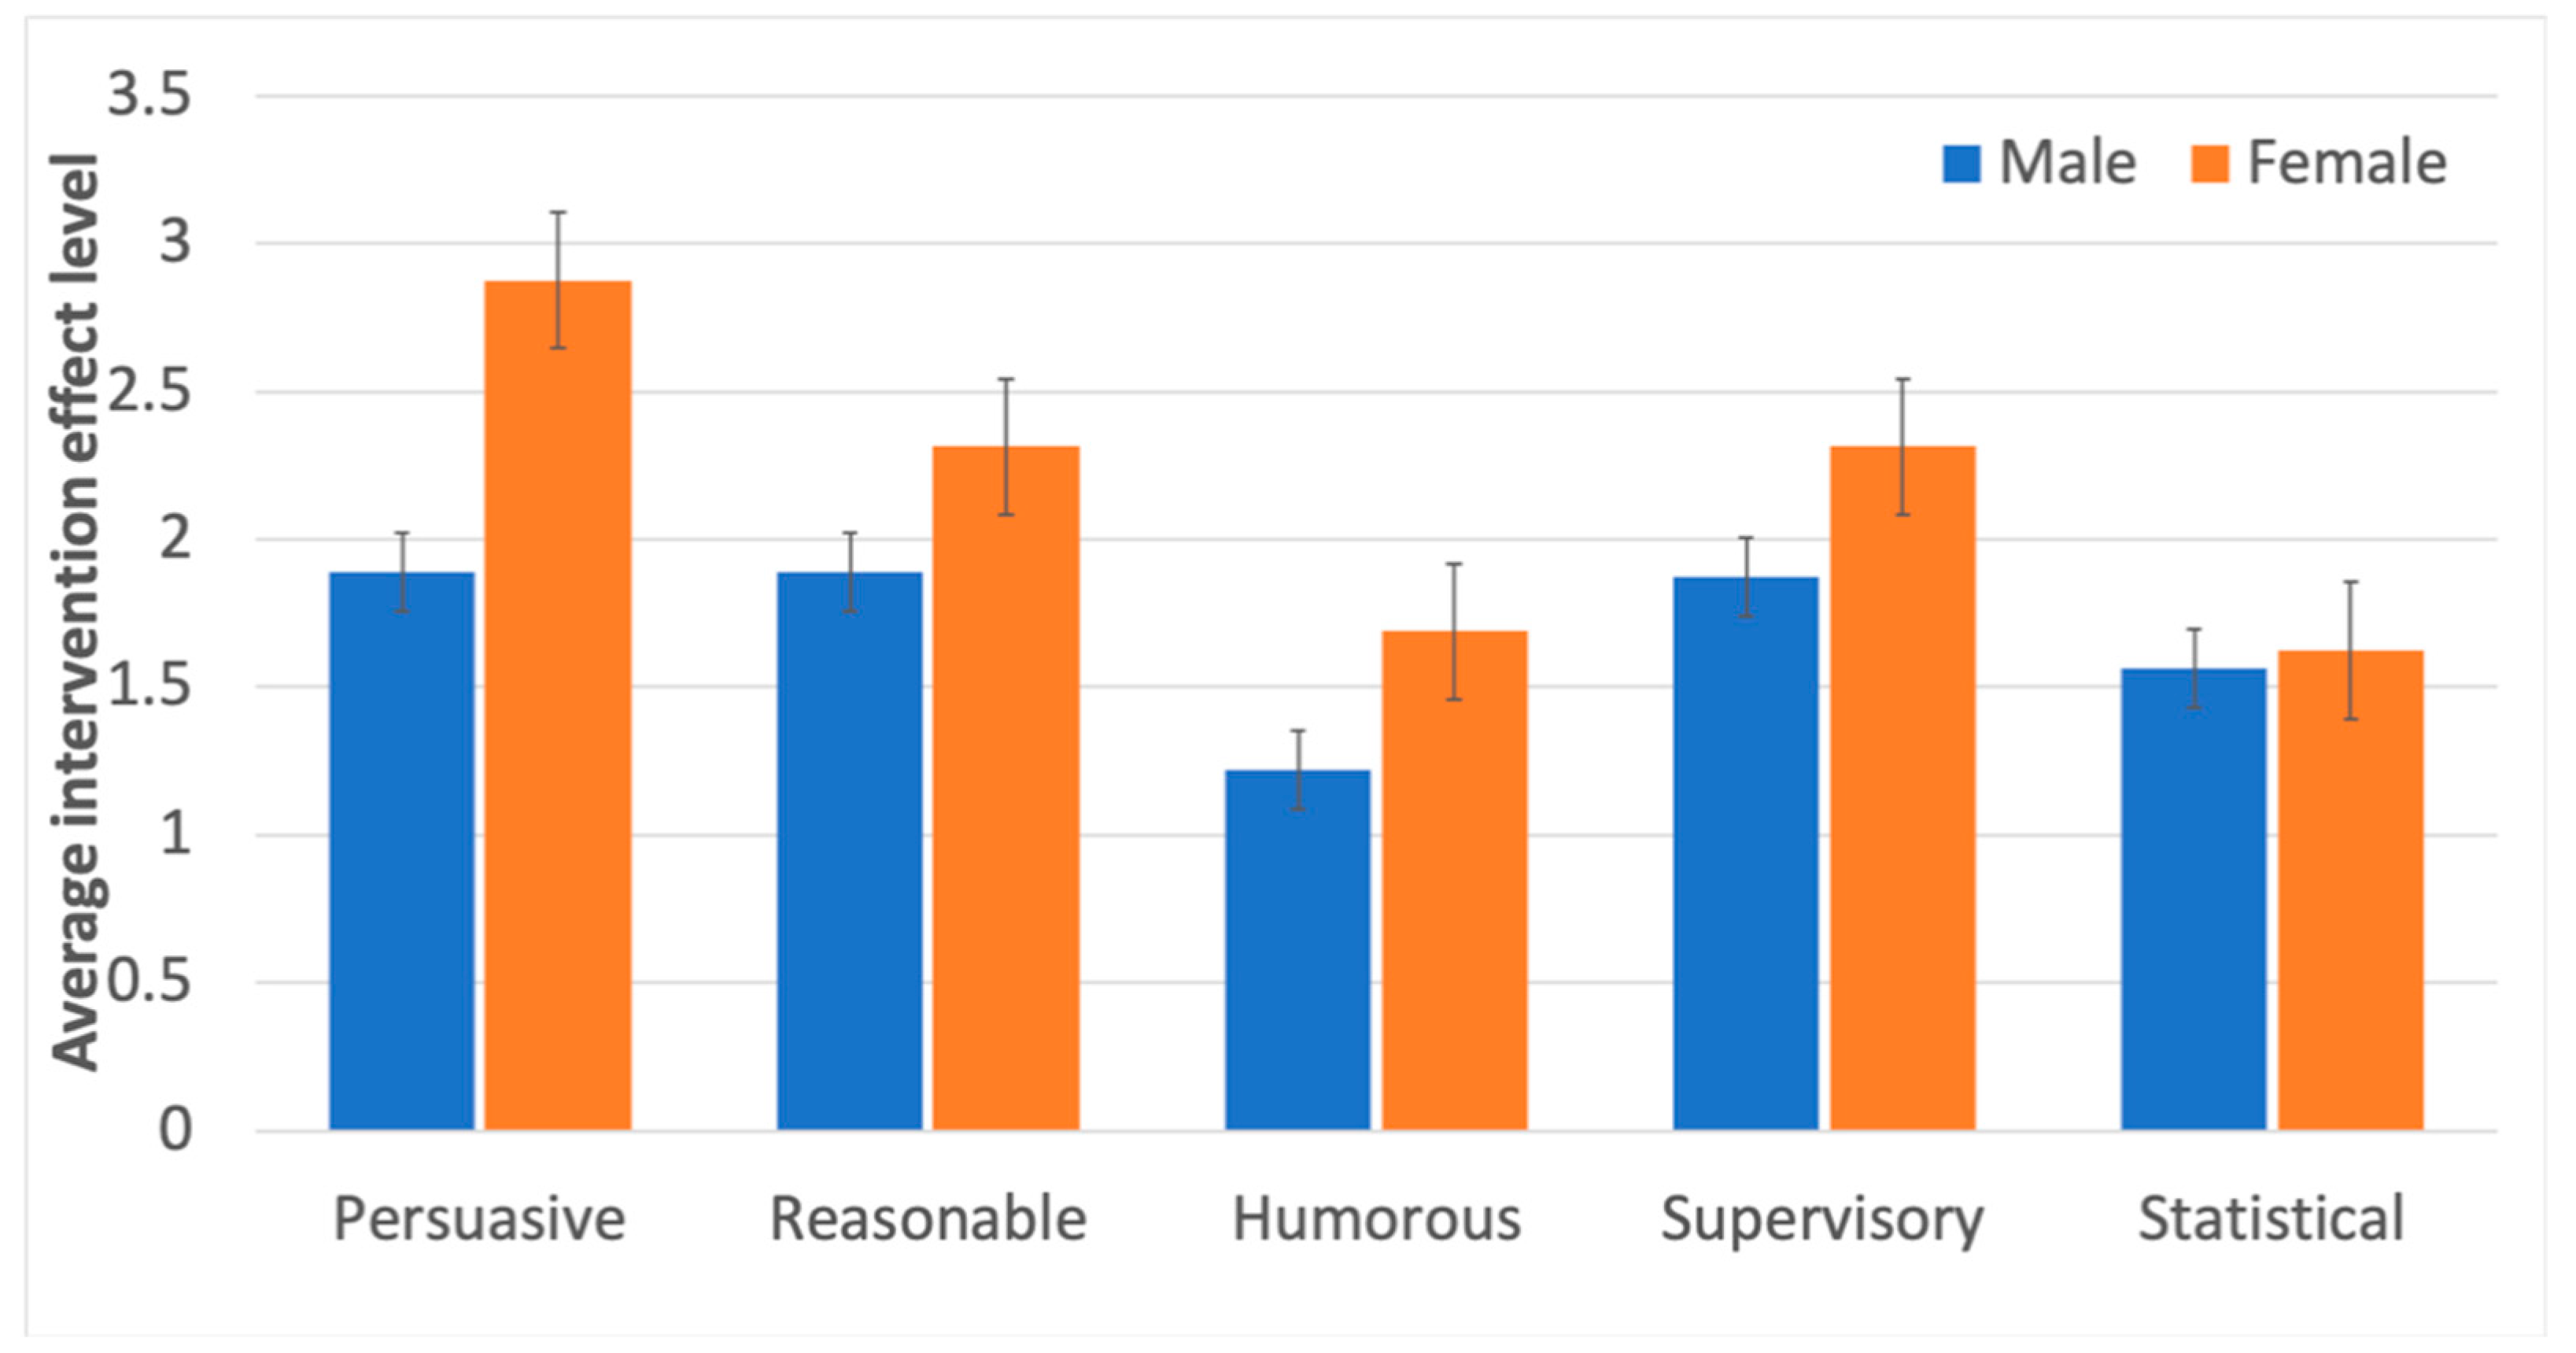
As shown in
Table 4, gender has a significant impact (
P-value < 0.05) on the intervention effects of the Persuasive Mode and Humorous Mode. It can be concluded that gender only affects the intervention effect of the voice intervention designed with the Emotional Style. As shown in
Figure 5, for male drivers, the Intervention Levels of the 5 modes were all smaller than 2, indicating that the 5 intervention models all produced good effects on improving the speeding behavior. For female drivers, the Intervention Levels of the Humorous Mode (M = 1.69, SD = 0.85) and Statistical Mode (M = 1.63, SD = 0.70) were smaller than the other modes. Moreover, when experiencing the voice intervention designed with other 3 modes, the Intervention Levels were all higher than 2, indicating that the speed has a substantial reduction only after the Humorous Mode and Statistical Mode.
The Humorous Mode and Statistical Mode were viewed as the better modes both for males and females.
The five modes all had a stronger intervention effect for males than for females.
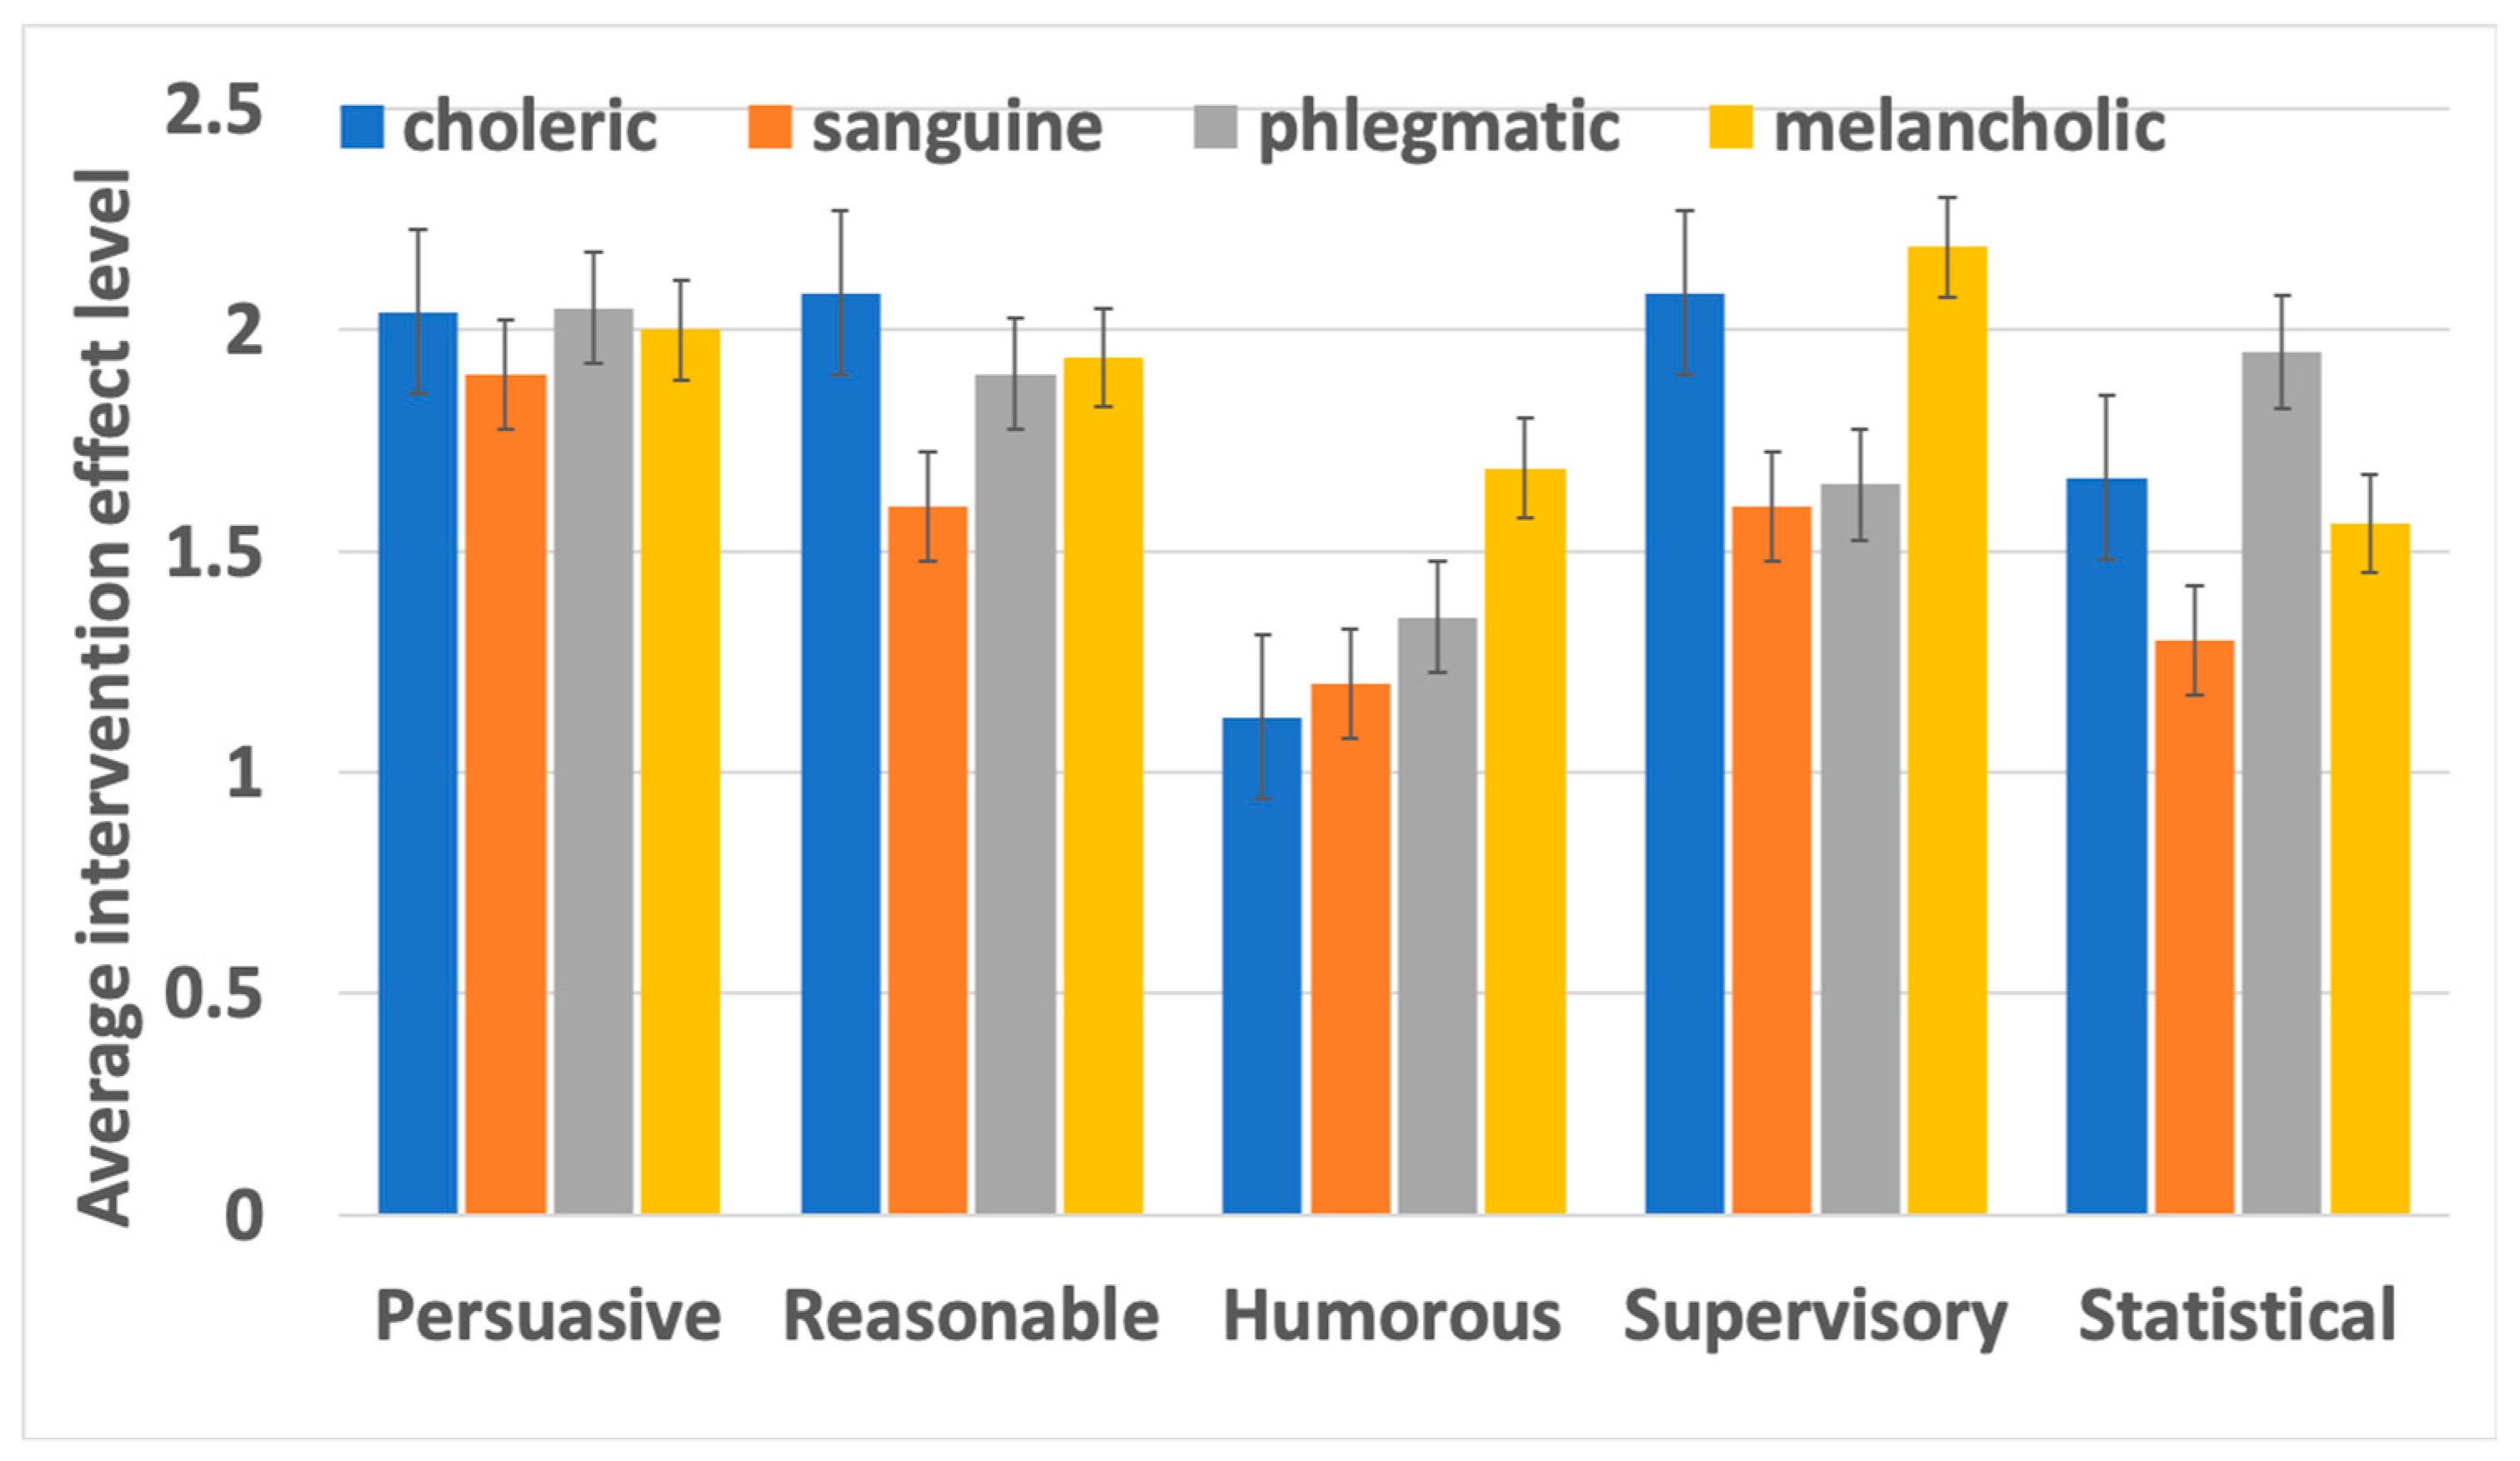
As shown in
Table 4, the personality has a significant influence (
P-value < 0.05) on the Humorous Mode, while, the personality does not affect the intervention effect produced by the other four modes (
P-value was higher than 0.05). As shown in
Figure 6, for the melancholic group, the Intervention Level experienced in the Statistical Mode was lower than that of the four other modes. In other words, the Statistical Mode produces the highest deceleration. For drivers of other types of personality (choleric, sanguine and phlegmatic), the Intervention Level experienced in the Humorous Mode was lowest among the five modes, indicating that the Humorous Mode had the best performance in controlling speed.
For melancholic drivers, the Statistical Mode performs best, for drivers of other types of personality (choleric, sanguine and phlegmatic), the Humorous Mode performs best.
A brief summary of the intervention effects of the voice intervention designed with five modes and four interventions is shown in
Table 5.
3.3. The Education Effect of Different Voice Intervention
The researchers asked participants to choose which intervention mode was the most memorable using questionnaires just after the experiment and two weeks after the experiment. The intervention mode that was frequently selected was considered to be stronger in its education effect. As shown in
Table 6, the Persuasive mode was the most selected intervention mode in both surveys, and the Humorous mode was the third and second most frequently selected intervention mode in the first and second surveys. This indicated that the education effect of voice intervention with the Emotional Style was better than the Rational Style.
There is a certain inconsistency between the participants’ subjective feelings when compared to the objective speed data. From the subjective survey results, the Persuasive Mode had the best intervention effect, while the Humorous Mode had the best effect on the objective data. There may be some difference between the education effect with the intervention effect produced by the same voice intervention mode.
In the second survey, many participants were unable to remember how they felt when the intervention occurred, thus, they may have tended to choose the most memorable intervention mode based on memory and accumulated knowledge. Only 43% of participants chose the same intervention mode in the first and second surveys. This indicated that less than 43% of participants could remember the intervention effect for more than two weeks. It was easy for drivers to forget the intervention effect. Increasing the frequency of the intervention was an effective way to strengthen the role of education.
In general, the education effect of the Emotional Style was better than the Rational Style. The education effect and the intervention effect of the same voice intervention were not consistent. So, when the intervention strategy is designed, both the education effect and the intervention effect should be taken into consideration.
4. Discussion
This research article is the first investigation of the benefits of specific intervention methods for the behavior of speeding. The study demonstrates the effects of a specific intervention method on the speed reduction for different types of drivers. The present study was designed to explore the effectiveness of different intervention methods and to compare differences between the different voice modes. The analysis further indicated that the VLSW intervention method provided the best performance for speed reduction. The steer wheel vibration had a significant influence on the intervention effect, but light intervention did not. There is an explanation for this phenomenon, it can be assumed that after the visual interventions occurred, the driver’s glances may stay on the warning message for a long time, thus, ignoring critical situations. In this case, visual warning interventions may not arise in the driver’s awareness. In addition, the value of speed reduction produced by the Humorous Mode and Statistical Mode was greater than the other 3 voice intervention modes.
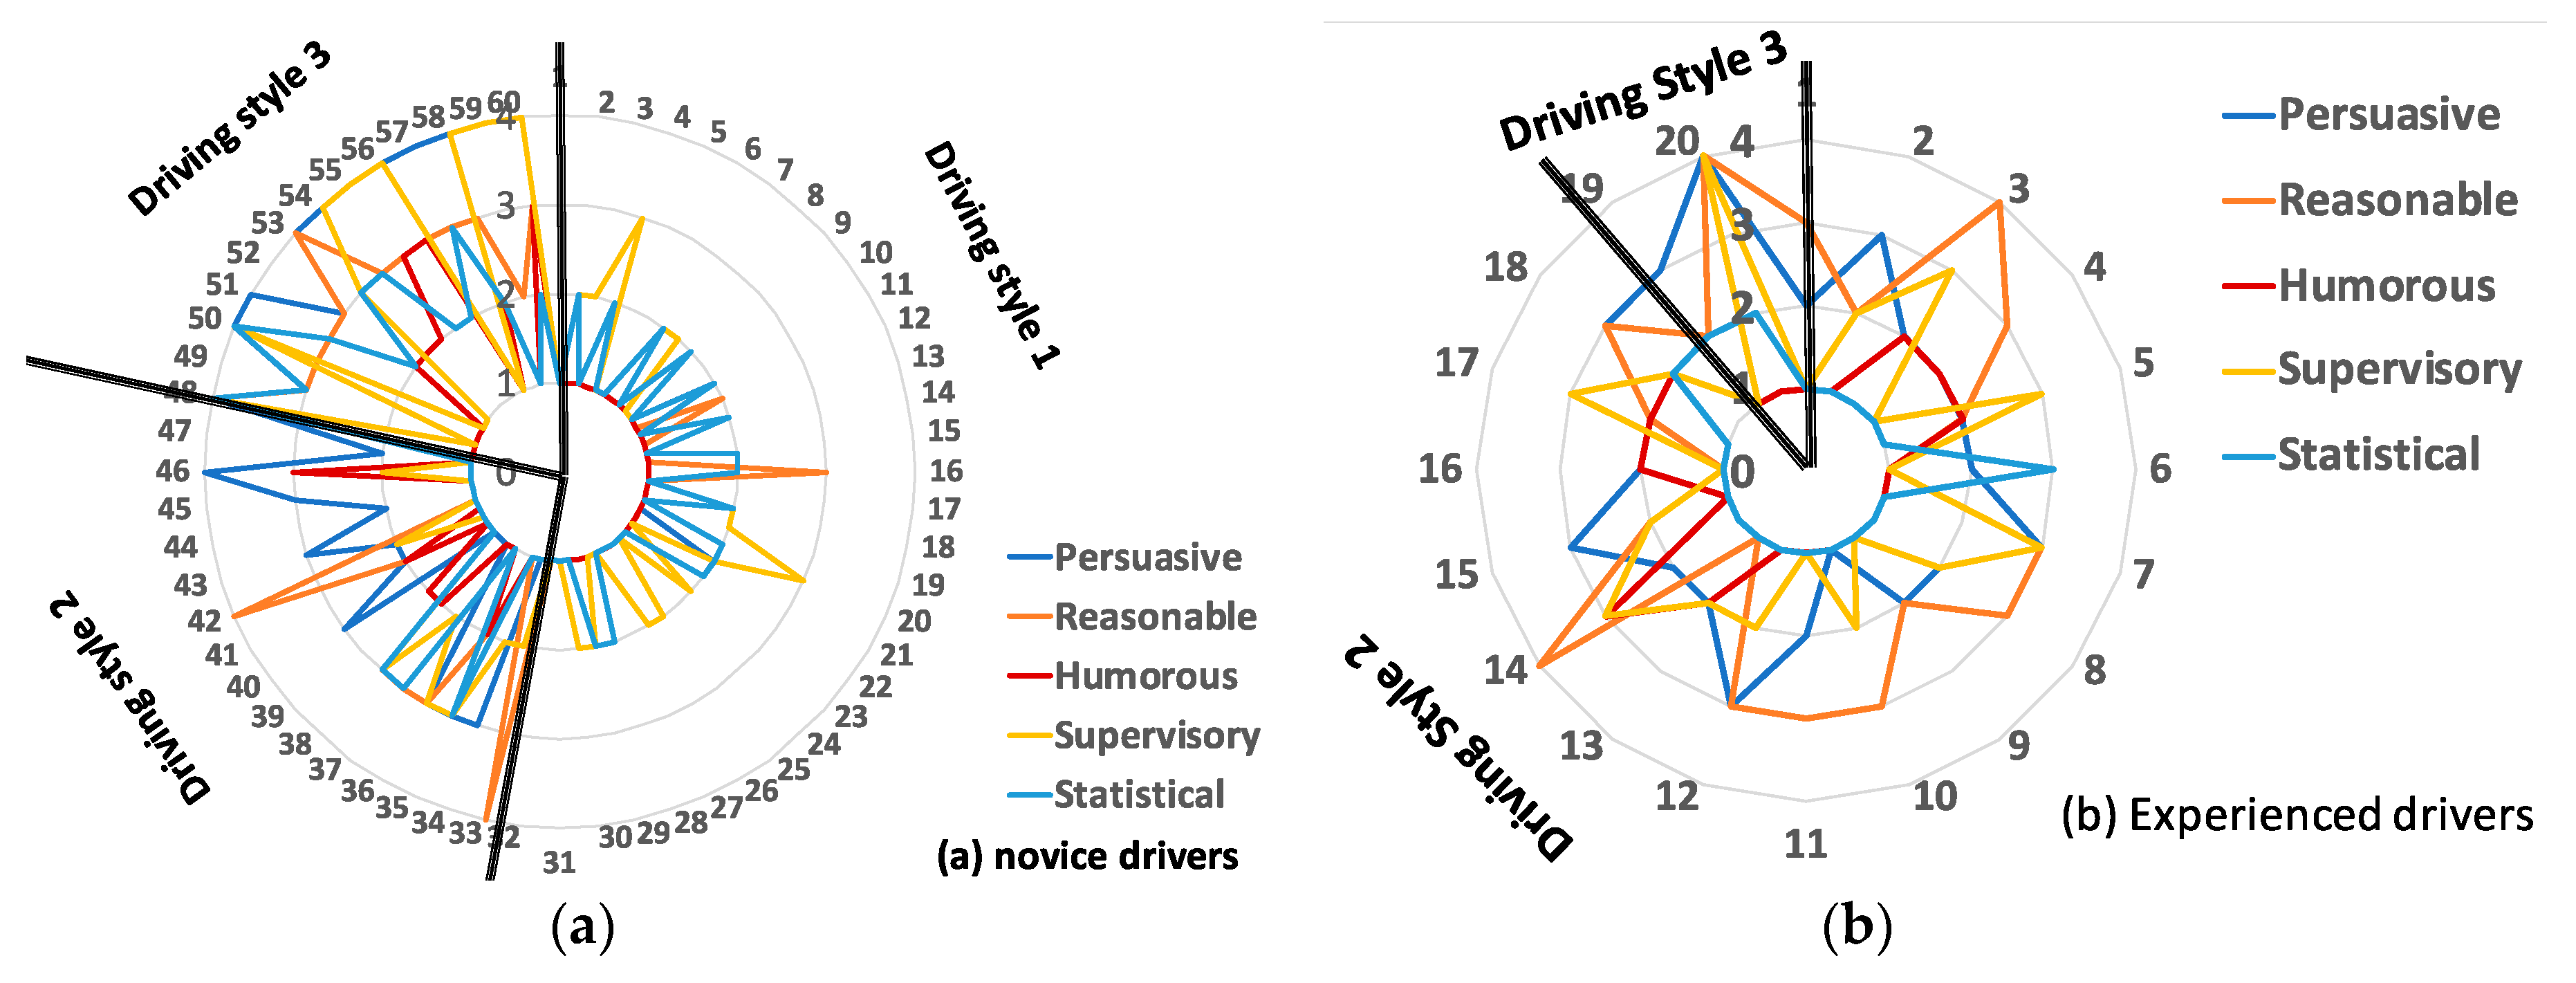
Both gender and driving experience had a certain impact on the voice modes. In contrast, research has shown that the personality from EPQ did not have a significant influence on the intervention effect, which broke the primary idea that the author had that drivers with different personalities should be intervened using different interventions. At the same time, the research found that some drivers complied with most voice interventions, while some drivers did not comply with most of the intervention. There were significant differences. It can be assumed that the personality collected by EPQ cannot capture the characteristics of their driving style. Thus, a new driving style variable was proposed to study the relationship between the various modes of voice intervention. The new driving style variable should be able to be calculated automatically from the speed data. The author attempted to use the cluster method to find the new driving style variable which would have a significant influence on the intervention effect. The K-means algorithm was used to classify the drivers. The K-value was decided on by using the two-step cluster method. The driving style was divided into three groups according to the effects of five modes of voice intervention. The classification results were shown in
Figure 7.
The drivers of driving style 1 responded positively to most of the voice interventions and they were all novice drivers. No experienced drivers were observed in the driving style 1 group.
The drivers of driving style 2 were observed to respond positively only for specific intervention modes. Most experienced drivers and 25% of novice drivers belonged to this style.
The drivers of driving style 3 were observed not to respond or responded negatively to most of the voice intervention modes. Only 10% of experienced drivers and 20% of novice drivers belonged to this style.
The driving style variable was observed to reflect the driver’s responsiveness for different intervention modes and was closely related to driving experience. Most novice drivers belonged to driving style 1 and they responded positively to all intervention modes. Most experienced drivers belonged to driving style 2 and they would only respond to certain intervention patterns with the increase of driving experience, drivers gradually form their own preferences and will not give a positive response to all interventions. Some novice drivers and experienced drivers belonged to driving style 3 and they would not respond positively to most intervention modes. We believe that most of the novice drivers of driving style 1 and 3 will gradually transform into driving style 2 with the increase of driving experience. In addition, warning strategies should be adapted to different situations and intervention strategies. It should, as a general warning, be designed to accustom various cases, pursuing a fast and strong effect [
24]. This research follows this requirement that the intervention strategy was designed according to the characteristics of the driver to pursue the best intervention effect. As shown in
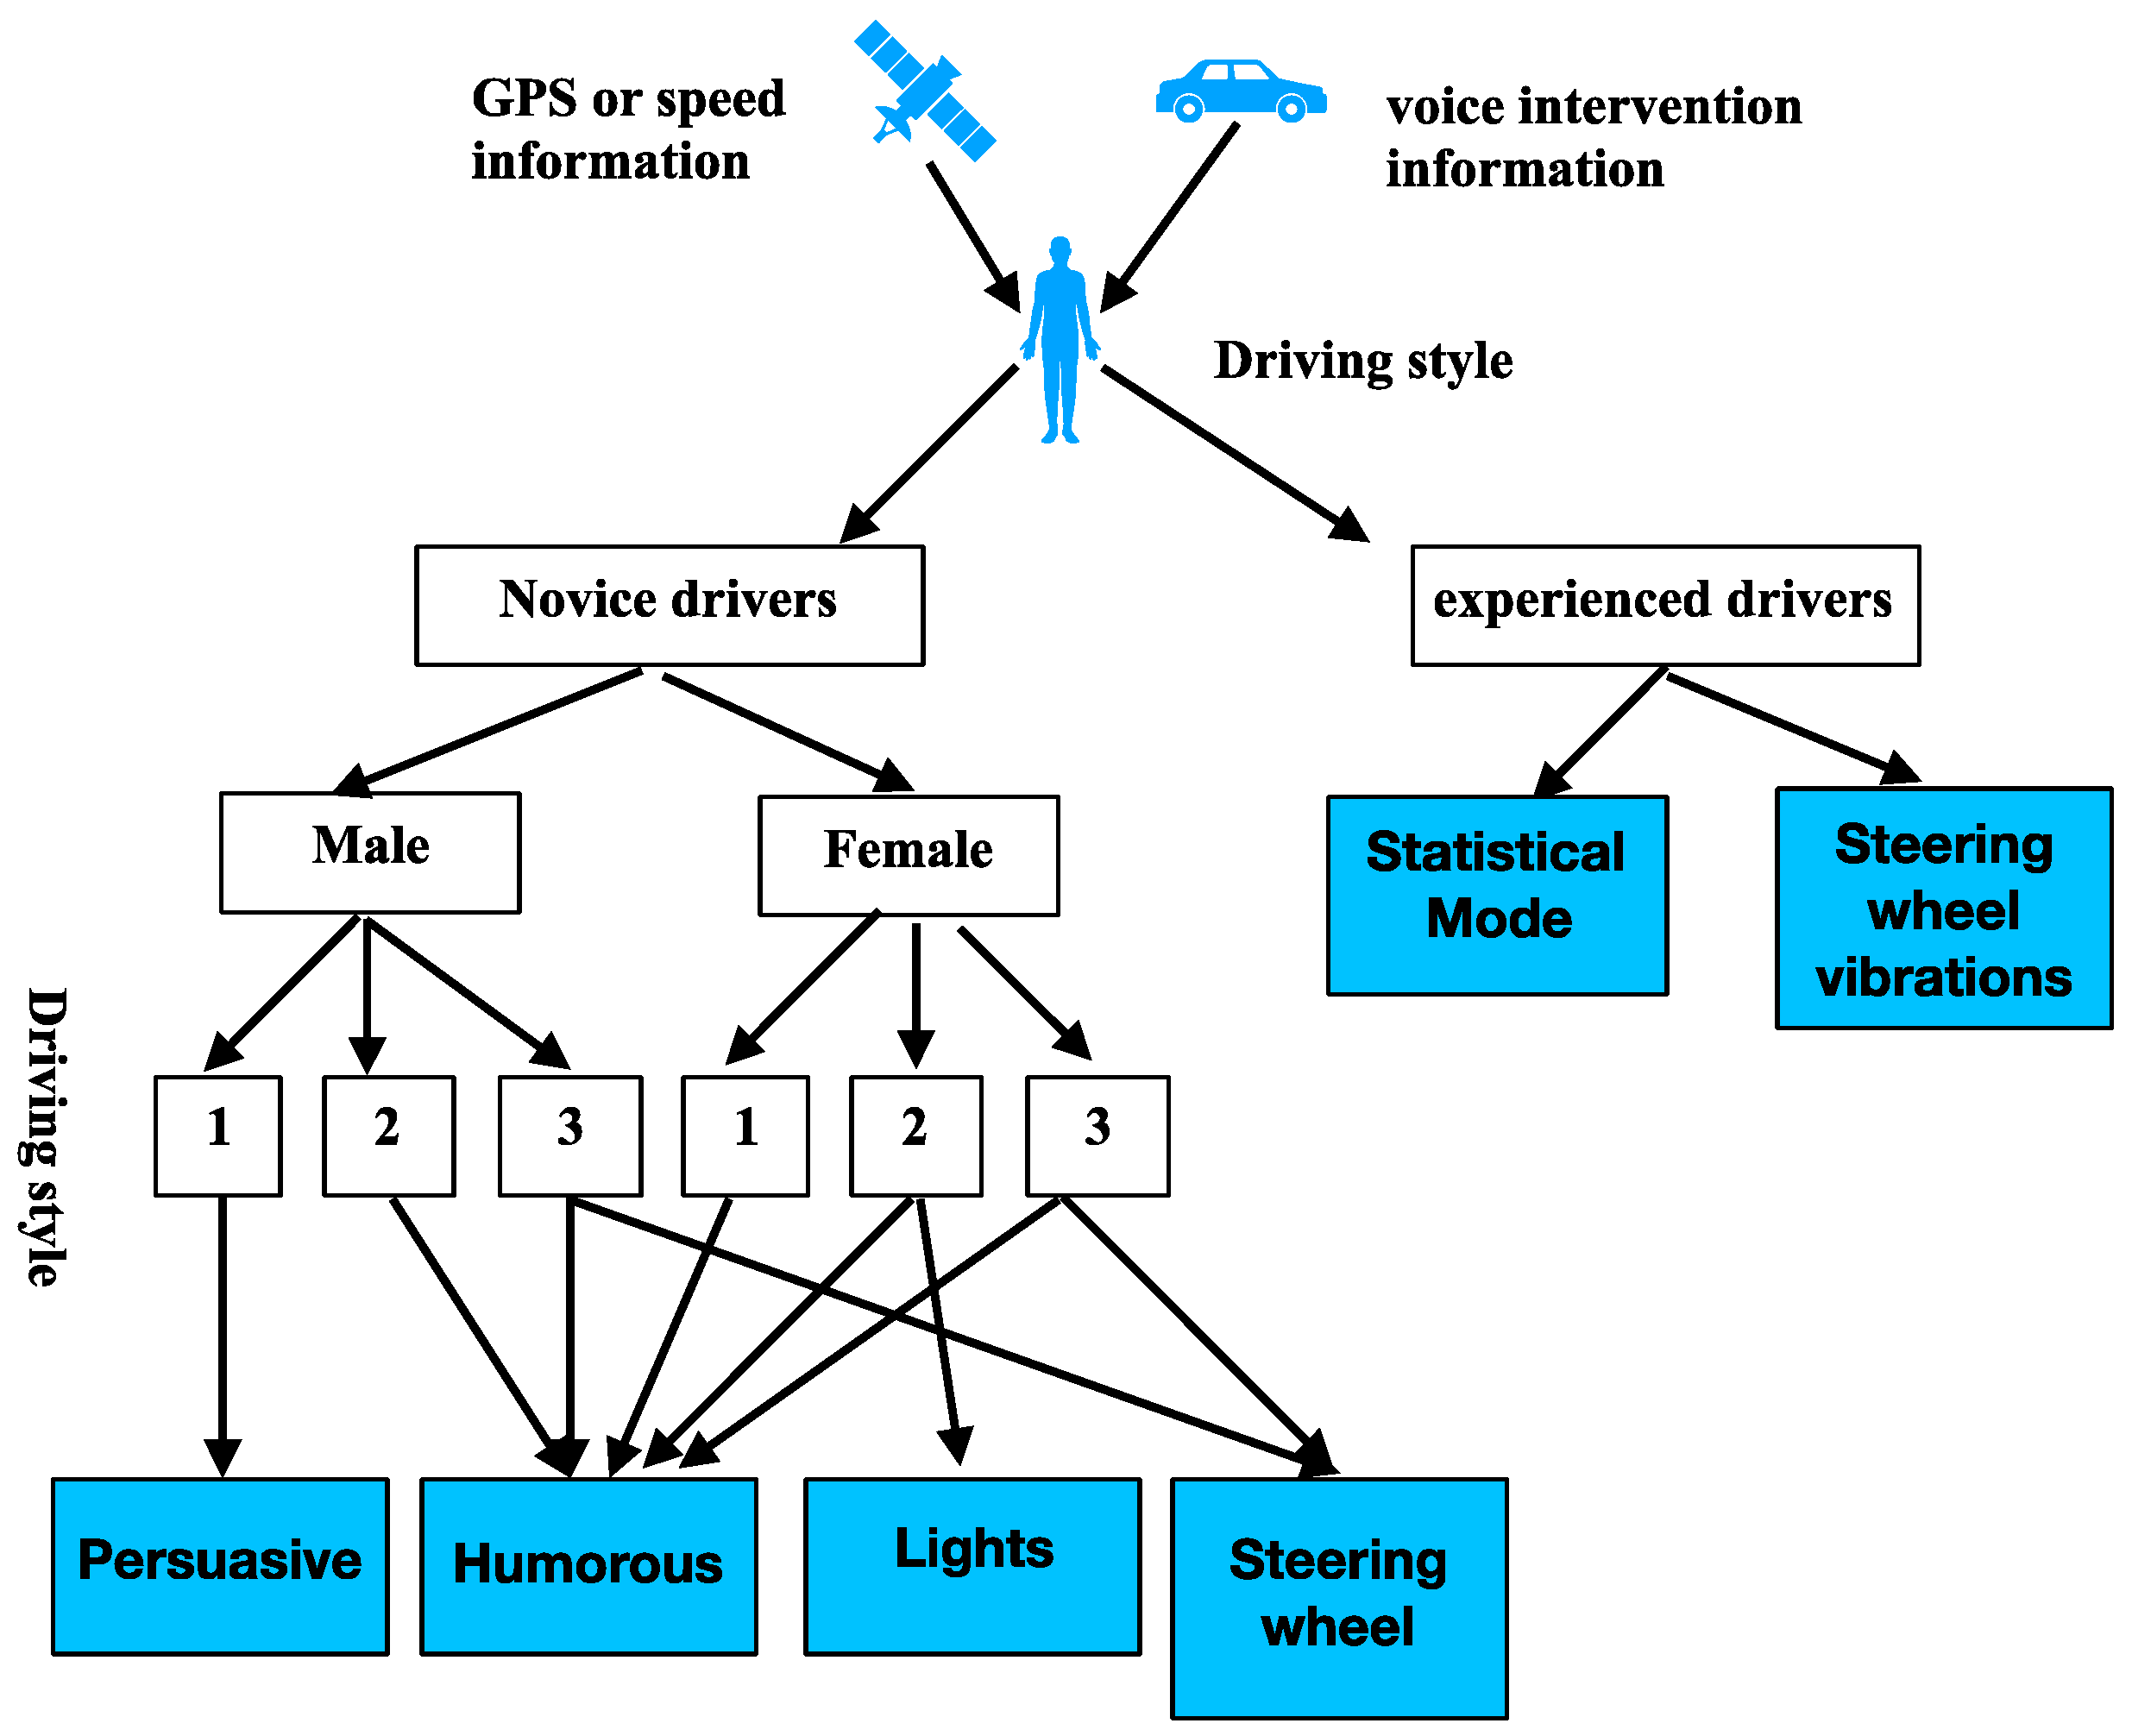
Figure 8, the process of determining the best intervention method was recommended based on the above studies.
Step 1: The drivers’ driving style is determined dynamically according to the effects of the different modes of voice intervention.
Step 2: If the driver is an experienced driver, a “voice intervention designed with statistical mode + lighting + steering wheel vibration” is adopted. If the driver is a novice, we need to consider the impacts of gender and driving style.
Step 3: The intervention method is chosen according to gender and driving style.
- (1)
Male + Driving style 1: Because the effect of voice intervention on males is better than in females, and because drivers in driving style 1 respond positively to almost all modes of voice interventions, we chose the “voice intervention designed with the Persuasive Mode”, which has the best education effect, as the final intervention method.
- (2)
Male + Driving style 2: the “voice intervention designed with Humorous Mode” was chosen as the final intervention method, which has the best intervention effect and a good education effect.
- (3)
Male + Driving style 3: the “voice intervention designed with Humorous Mode + steering wheel vibration” was chosen as the final intervention method to enhance the intervention effect.
- (4)
Female + Driving style 1: the “voice intervention designed with Humorous Mode”.
- (5)
Female + Driving style 2: the “voice intervention designed with Humorous Mode + lighting”.
- (6)
Female + Driving style 3: the “voice intervention designed with Humorous Mode + lighting + steering wheel vibration”.
There are some limitations to this study. One of the limitations shows that the education effects of the various intervention modes are based on subjective questionnaire data. The effectiveness of the self-reporting questionnaire tool depends on the subject’s sincerity in answering the questions. Although we ensured that the questionnaire is only used for research, it is still impossible to avoid the influence of social desirability, the educational level and the differences in memory and other factors. Another limitation is that it is not clear what effect will be produced in the real world, compared to the design in the driving simulator. The third limitation is the setting of the sample. The study selected young college students as the main sample of novice drivers to evaluate the effect of different interventions because the researchers wished to obtain easily a higher quality sample and to control the intervention process better, ignoring the unknown influence of this special group on the intervention effect. Sample excluding the college group could be used to increase the statistical power. Therefore, future studies should be designed to explore the performance of the speed reduction produced by different intervention methods during the actual driving condition, and additional samples should be included.
This research article contributes to revealing the impact of several factors (driver characteristics and intervention methods) on the intervention effect. In the actual driving stages, accurate calculations are carried out for drivers with different characteristics to provide the best intervention mode and method, so that the driver can receive the feedback information in time and then adjust their speed. This also provides a new platform for real-time speeding intervention. With the rapid development of technology, GPS data collection is becoming more and more simple. The smartphone can collect speeds and produce voice prompts, flashing light and vibrations. Once speeding is detected, a precise intervention strategy can be provided according to the characteristics of the driver to achieve the strongest intervention effect on speeding, which is beneficial for the safety of the driver himself and the other users on the road, such as pedestrians and other motorists. This finding will be useful for the development of a more practical safety system. Management of speeding behavior is now limited to the use of anti-speeding signs and police penalties. The finding facilitates the intelligent management of speeding behavior for managers. This finding serves to promote the sustainable development of transportation. Intervention measures should be designed to improve traffic safety, expecting to reduce the crash risk caused by speeding behavior.
5. Conclusions
Our findings allow us to draw a number of highly pertinent conclusions. First and foremost, the intervention effects were strengthened with the increase of the intervention intensity. Additionally, the more intervention methods were combined, the better the intervention effects were demonstrated. The steer wheel vibration has a significant impact on the intervention effect, but lighting intervention does not. Secondly, the mode of voice intervention had more influence on the intervention effect than the intervention style. The Humorous Mode and Statistical Mode have a significantly better intervention effect on controlling the speed than the other 3 modes. Thirdly, the driving experience is more likely to influence the intervention effect of the voice intervention designed with the Rational Style, and gender mainly influences the intervention effect of the Emotional Style. Voice intervention has a better effect on novice drivers than experienced drivers, and it has a better intervention effect on males than females, while the personality from EPQ does not have a significant influence on the intervention effect. Fourthly, the education effect of the voice intervention designed by the Emotional style was better than the Rational style. There is a certain inconsistency between participants’ subjective feelings and objective operations. This may be because the education effect and the intervention effect of the same voice intervention were inconsistent. Finally, a new driving style variable, which is calculated automatically from driving data, was designed. More importantly, a precise intervention strategy was proposed. The results of this study may make contributions to institutions of traffic safety management to select the most appropriate interventions to improve speeding. This may provide a safer traffic condition for drivers and pedestrians.
Overall, the steering wheel vibration resulted in a substantial deceleration and voice intervention designed with the Humorous Mode produces the best intervention effect. An apparently sensible intervention strategy is recommended by taking the driver’s individual differences, direct intervention effect, and education effect into consideration. In essence, the findings provide guidance for combating the issue of speeding.


