Review

Are We Doing ‘Systems’ Research? An Assessment of Methods for Climate Change Adaptation to Hydrohazards in a Complex World

1
Water Resilient Cities, Institute for Infrastructure & Environment, School of Energy, Geoscience, Infrastructure & Society, Heriot-Watt University, Edinburgh Campus, Edinburgh EH14 4AS, UK
2
National Research Institute of Science and Technology for Environment and Agriculture (IRSTEA), 1 Rue Pierre-Gilles de Gennes, 92160 Antony, Île-de-France, France
*
Author to whom correspondence should be addressed.
Sustainability 2019, 11(4), 1163; https://doi.org/10.3390/su11041163
Submission received: 31 December 2018 / Revised: 30 January 2019 / Accepted: 19 February 2019 / Published: 22 February 2019
(This article belongs to the Special Issue Human Nature Interactions)

Abstract

:
Climate change is a product of the Anthropocene, and the human–nature system in which we live. Effective climate change adaptation requires that we acknowledge this complexity. Theoretical literature on sustainability transitions has highlighted this and called for deeper acknowledgment of systems complexity in our research practices. Are we heeding these calls for ‘systems’ research? We used hydrohazards (floods and droughts) as an example research area to explore this question. We first distilled existing challenges for complex human–nature systems into six central concepts: Uncertainty, multiple spatial scales, multiple time scales, multimethod approaches, human–nature dimensions, and interactions. We then performed a systematic assessment of 737 articles to examine patterns in what methods are used and how these cover the complexity concepts. In general, results showed that many papers do not reference any of the complexity concepts, and no existing approach addresses all six. We used the detailed results to guide advancement from theoretical calls for action to specific next steps. Future research priorities include the development of methods for consideration of multiple hazards; for the study of interactions, particularly in linking the short- to medium-term time scales; to reduce data-intensivity; and to better integrate bottom–up and top–down approaches in a way that connects local context with higher-level decision-making. Overall this paper serves to build a shared conceptualisation of human–nature system complexity, map current practice, and navigate a complexity-smart trajectory for future research.

1. Climate Change and Sustainability in the Anthropocene

1.1. Needs for Future Research in Complex Human–Nature Systems

The current Anthropocene age is a period where human activity has been the dominant influence on climate and the environment. In this era, climate change has compounded human–nature complexity. Deep changes to research and practice will be required to address the human–nature interactions in the systems we use and build, and effectively adapt to climate change.
The traditional approach to ‘managing’ the environment reduces hazards to only natural aspects. These tend to produce exclusively physical solutions, which have long struggled to cope with the reality of human–nature systems (e.g., [1,2]). As a result of climate change, the limitations of this human–nature dualism are becoming more apparent. Hazards are projected to occur with greater magnitude, frequency, and duration (e.g., for floods and droughts, otherwise referred to as hydrohazards [3]). In March 2018, the UK Environment Agency’s Chief Executive warned practitioners against outdated approaches. He presented two options: Rethink the status quo of simply installing ‘taller, stronger and costlier concrete defences’, or consider the future relocation of at-risk communities [4]. This highlights that the traditional ways of conceptualising and approaching human–nature systems are now at the boundary of their ‘performance envelope’.
This illustrates a strong need to move away from siloed, dualistic, and oversimplified approaches. New perspectives, such as those in resilience engineering [5] and ‘social cascades’ [6], are beginning to acknowledge the importance of human-centred characteristics. Current sustainability transitions literature calls for integrated research and “intensive cooperation” between natural and social sciences [7] (p. 4). Similar calls have increasingly been made over the last decade (e.g., [8]). However, such collaborations continue to be rare.
One reason for this might be that different research areas conceptualise complex systems in different ways. In the words of Brondizio et al. [9] (p. 318), the Anthropocene concept has also “brought front-and-center epistemological divides between and within the natural and social sciences, and the humanities”. Human–nature systems defy oversimplification, and as each discipline explores what complexity issues are most critical to effective research in their area, differing perspectives are developed. A shared conceptualisation of what is important about complex human–nature systems would benefit research in the area of climate change, to facilitate more effective collaborations.
Some of these shared issues are highlighted in seminal theoretical papers on sustainability transitions [7,9,10,11]. Table 1 synthesises these core challenges of complex systems research for the Anthropocene. These challenges fall under three categories: Advancing interdisciplinarity, improving ethics, and coping with complexity.

1.2. What Now?

Researchers working in systems, complexity, and climate change are at least tacitly aware of the high-level challenges in Table 1. However, little guidance is available to translate these into the practical: An effective application of methods. It is natural for researchers, after coming across an inspiring yet primarily theoretical call to action, to ask: What now?
Building a shared conceptualisation of complex human–nature systems does not just facilitate smoother collaborations. It also provides a framework against which to map our current methods, how well they address human–nature complexity, and what might currently be neglected. By using this shared conceptualisation to relate theoretical ideas to methods, we can move beyond hypothetical calls to action into specific next steps for improving our approaches. This tractability is now critical for the realisation of sustainability transitions.
This paper performs a structured assessment of the literature on methods for climate change adaptation, using hydrohazards (floods and droughts) as an example hazard. This determines what methods are typically used for climate change adaptation, how complexity concepts are currently addressed, and what remains to be done to perform true ‘systems’ research. In other words, this paper serves to overview current research practices, rather than recommend specific adaptation options.
By consolidating the theoretical complexity challenges in Table 1 and linking these to research methods used across 737 hydrohazard papers, our current shortcomings are revealed. A more in-depth analysis tracks 70 individual variables through this knowledge base, to characterise the typical context of existing research and examine the complexity concepts in finer detail. This structured review process not only maps past research but also identifies which complexity concepts require more emphasis and how best to apply this emphasis. This navigates the path forward for systems research in climate change adaptation to hydrohazards. It also unearths exemplary past papers which might serve as waypoints, using an approach outside the norm of a traditional citation score.
For the purposes of this review, we pose a number of questions: What methods or approaches exist to address climate change adaptation to hydrohazards? Are complexity concepts broadly acknowledged by this area of research? Where complexity challenges are acknowledged, how well are they addressed by the applied methods? Do any important patterns exist in our current approaches? And how might we improve our incorporation of complexity concepts in future research? The following sections explain how these questions were tackled and what we might learn from their answers.

2. Materials and Methods

The structured literature review was designed in four parts: (1) To collect literature on climate change adaptation to hydrohazards; (2) to broadly check if these papers intend to address six core complexity concepts (condensed from Table 1), using a keyword search; (3) to describe the context of papers addressing at least one complexity concept; (4) to assess these papers in depth, to examine the coverage and convergence of the complexity concepts in more specific detail, and to test for patterns in existing approaches.

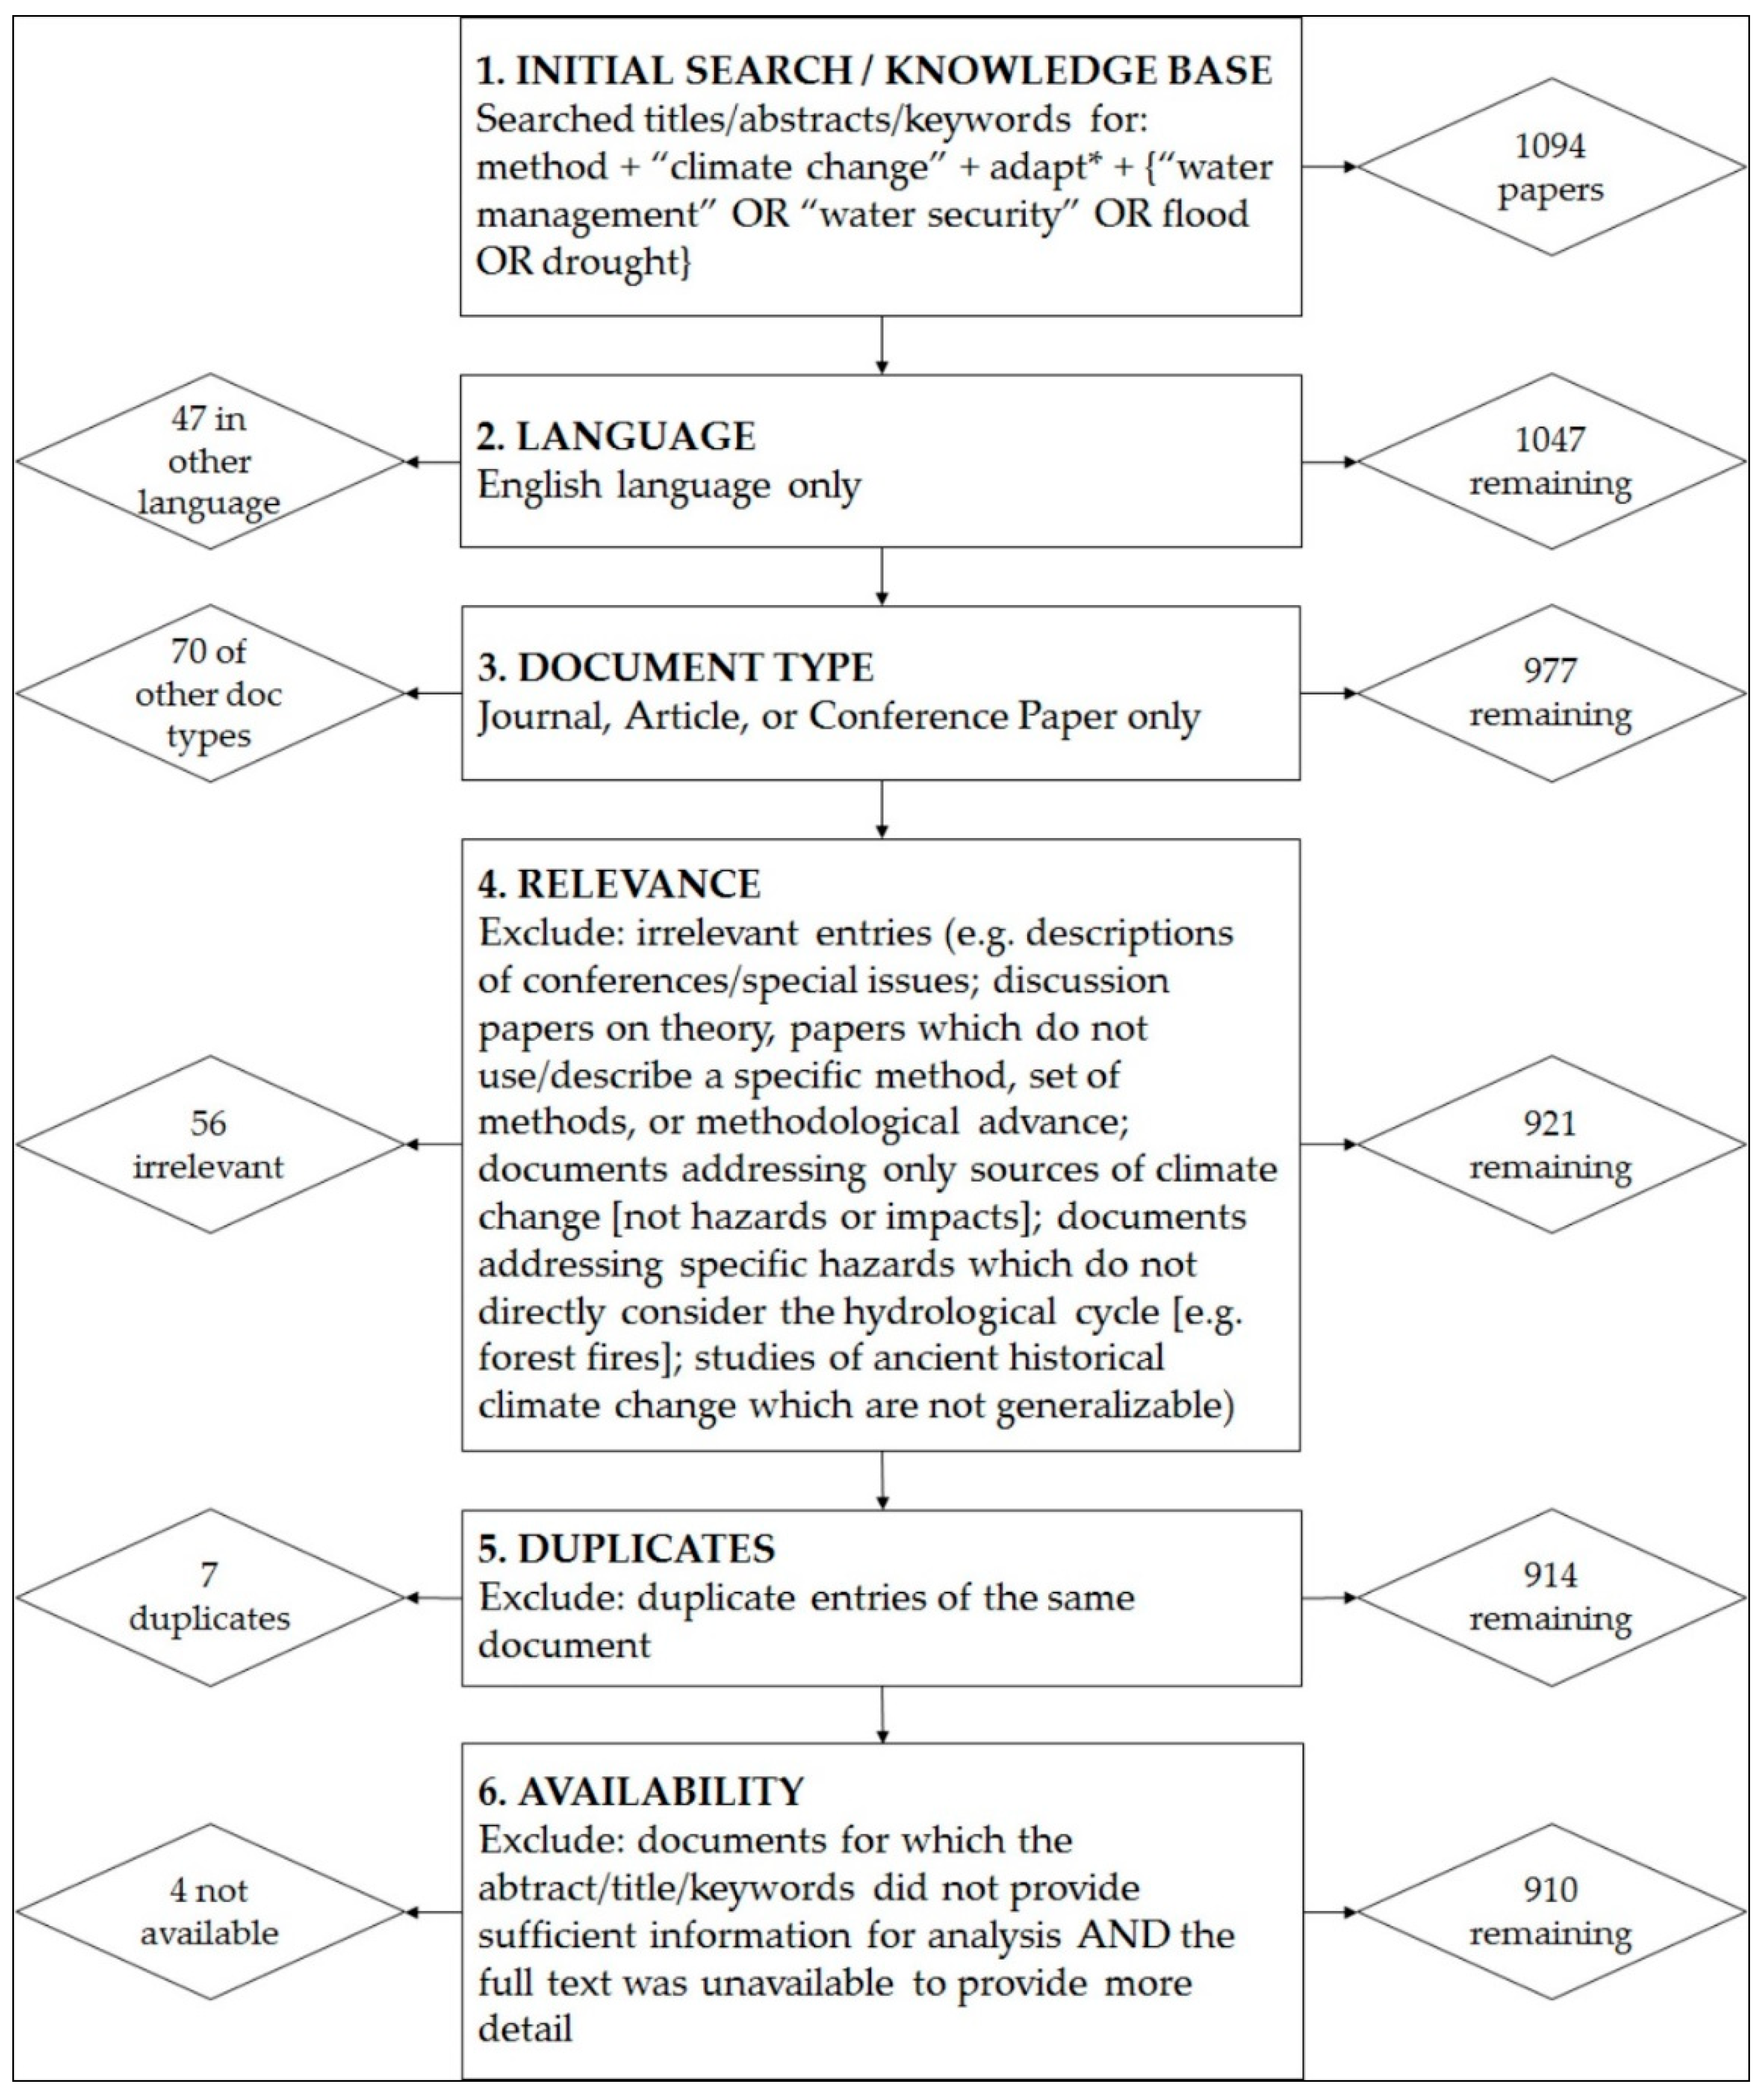
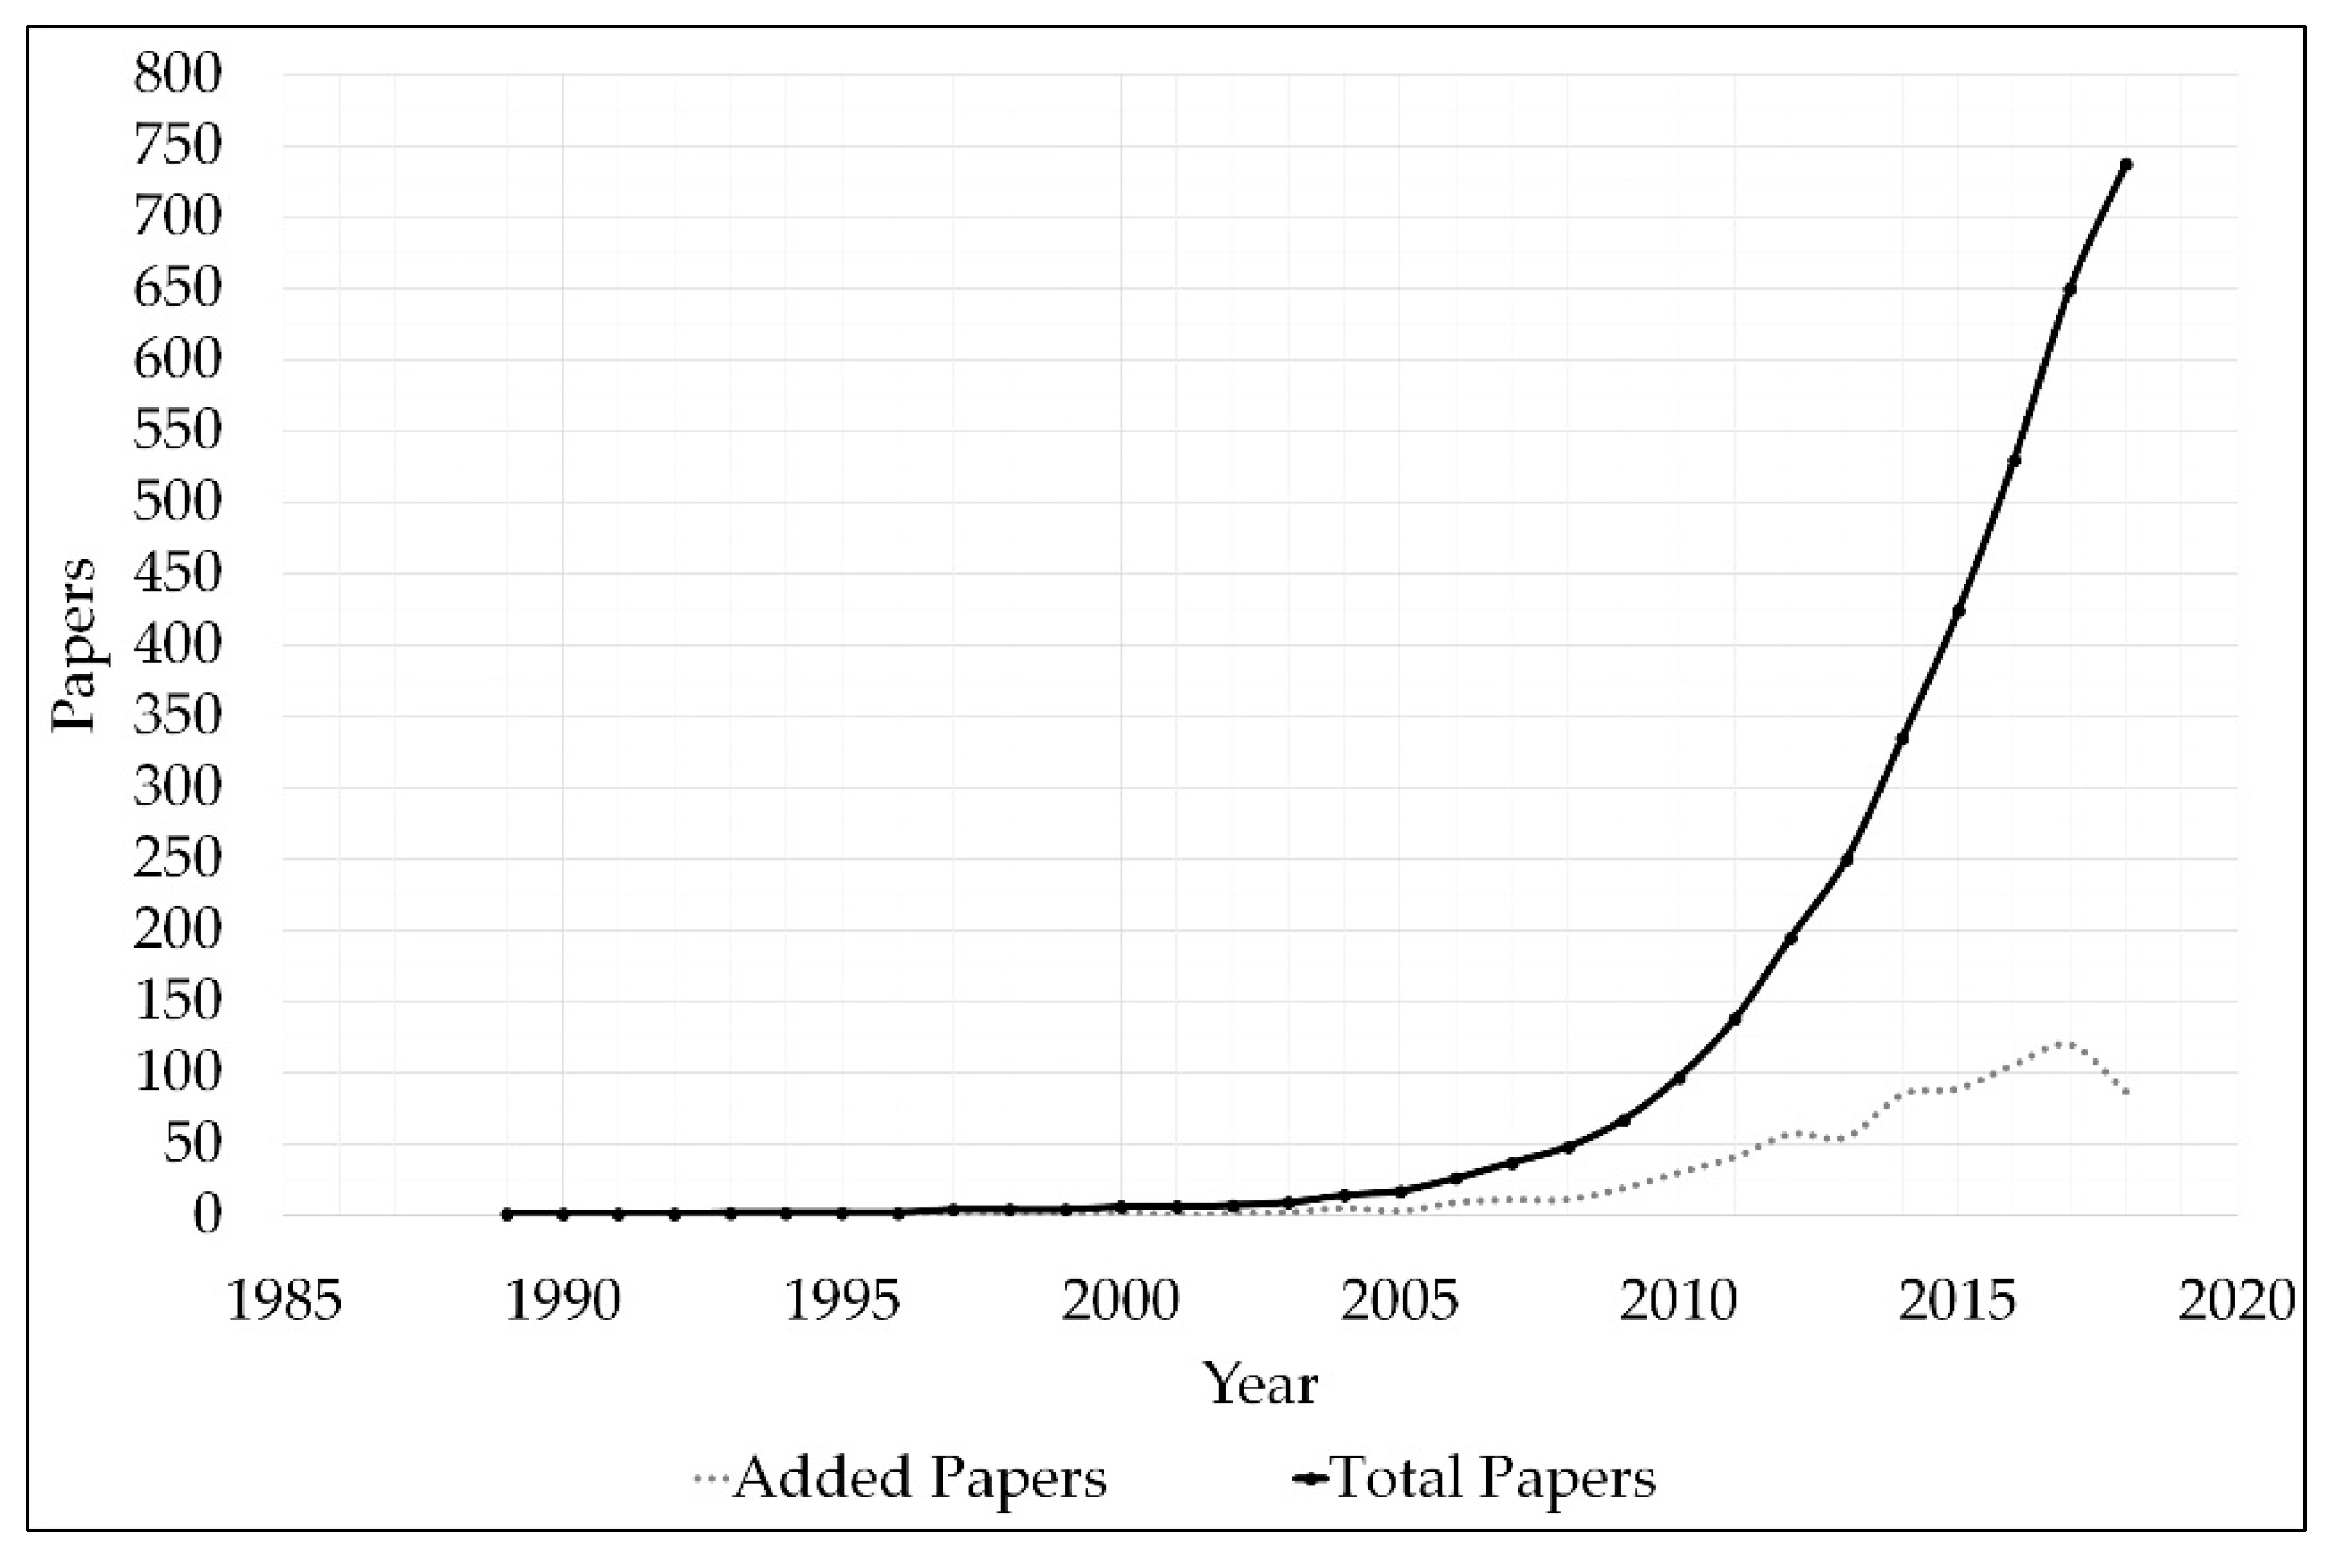
2.1. Collect the Literature: Initial Search and Exclusion Strategy

The first part of the assessment was to collect and refine a suitable knowledge base of research. This is presented in Figure 1 below and was performed by a single author to ensure consistency.
Step 1 was to perform an initial search. This was based on the question: What methods or approaches exist to study climate change adaptation to hydrohazards? Due to the abundance of research on climate change, the design of this question was key to providing a manageable knowledge base focusing on hydrohazards. From this, a Scopus search of titles, abstracts, and keywords was performed on 28 August 2018 for the terms: Method + “climate change” + adapt* + {“water management” OR “water security” OR flood OR drought}. This search strategy implicitly emphasised the dominant fields around hydrohazard study (e.g., climate modelling) with relatively mature methods. This may have unintentionally excluded other promising fields which contribute valuable theoretical framing (e.g., climate justice), where specific methods may be less emphasised or mature. Thus, the presented results are influenced by this initial selection. An initial 1094 documents were returned. Article records were downloaded from Scopus into a single Excel file. Each row contained the article’s title, authors, year of publication, abstract, keywords, journal or publication source, and other information.
Steps 2 and 3 excluded foreign language documents (47) and documents that were not journal, article, or conference papers (70).
Step 4 required a manual review of each abstract in more detail. This determined their relevance to this study. Papers were deemed irrelevant when they addressed only:
  • Theoretical principles or conceptual discussions, without the accompanied use, comparison, or recommendation of specific methods (though theoretical discussions were arguably useful to the field, their exclusion ensured the review’s practical focus);
  • Non-hydrohazards, without some consideration of associated hydrohazards (e.g., forest fire threats, without explicit consideration of droughts);
  • The causes of climate change (e.g., socioeconomic trends) without linking to consequent hazards or impacts;
  • Summaries of conference proceedings or journal issues;
  • Ancient historical climate trends, sometimes in relation to the eradication of a specific civilisation (as these were not generalisable to the practical study of modern adaptation).
Based on these criteria, irrelevant papers (56) were removed.
Step 5 involved removal of any duplicate entries (7).
Step 6 required a manual check of each abstract, for a sufficient level of information provided to perform the second part of the review in Section 2.2. In checks for a full copy of each paper, 36 papers were found to be unavailable. However, based on the abstract alone, an estimated assessment was possible. In four cases where a full copy was unavailable, the abstract did not provide sufficient information to proceed. As such, these four papers were excluded. These included one paper from 2005 and three from 2009. These were all nearly 10 years old at the time of writing this review. It is assumed that their exclusion would have no substantial impact on the trends identified in the results, and any minimal impact may be outdated.
This process resulted in a reduction from 1094 to 910 documents. Both the initial and reduced sets are available on request from the authors.

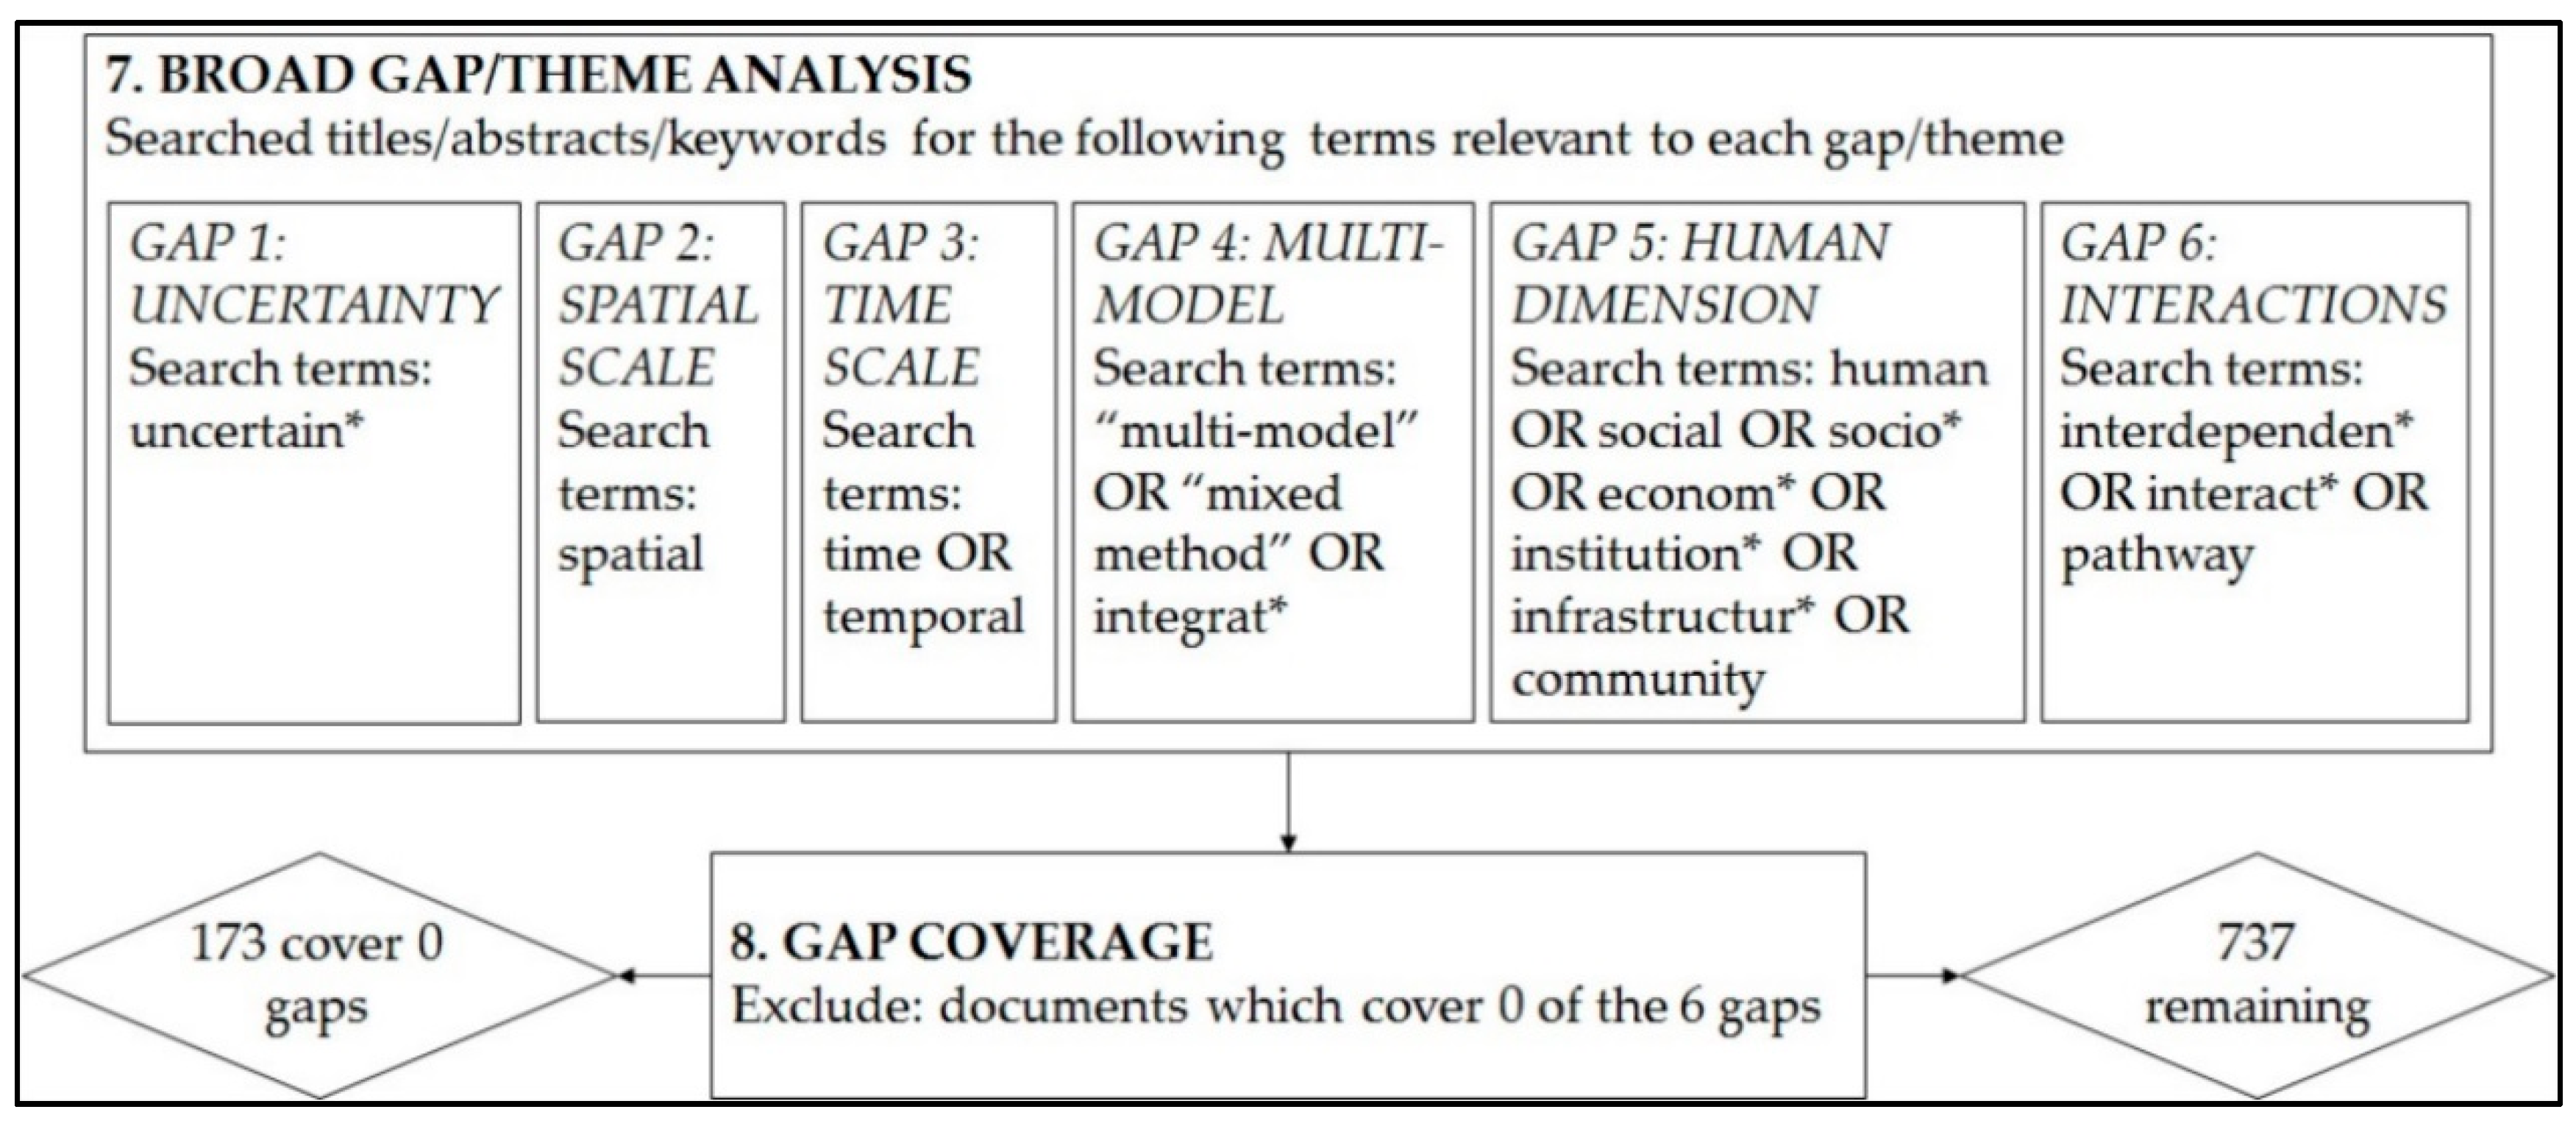
2.2. Broad Check for Complexity Concepts

The third part of the review design was to address if current complexity concepts are being broadly met by existing research. The 18 challenges for interdisciplinary research into sustainability in complex human–nature systems are presented in Table 1. This review focuses on points 7 through 18: Challenges around ‘coping with complexity’. Points 1 through 6 were not used in the structure of this review. During conceptualisation of this assessment, these were deemed nebulous to detect in a structured review of hundreds of papers. Additionally, the direct design and application of research methods to cope with complex systems (i.e., points 7 through 18) leads indirectly to interdisciplinarity and integrating ethical concerns.
Thus, points 7–18 from Table 1 were used as a basis for the development of six core complexity concepts, against which papers could be evaluated. Three co-authors discussed each point in Table 1 during a brainstorming session and distilled these into main parts.
For example, Challenge 8 in Table 1 mentions system boundaries. It is often noted that complexity creates unclear system boundaries. In Table 2, we have considered the ‘fuzziness’ of complex system boundaries as an aspect of uncertainty. Dealing with complex systems means that boundaries are in flux; therefore, the use of methods which can acknowledge future uncertainties is imperative.
The six resulting complexity concepts are described in Table 2 below.
Step 7 is depicted in Figure 2. This sought to answer the question: How many complexity concepts are addressed by current research? The occurrence of each of the above concepts was assessed for each paper. Specific search terms were brainstormed by the authors for each complexity concept, shown in Figure 2. In particular, search terms for concepts 5 and 6 were taken from common categories of sociohydrology indicators (e.g., from References [12,13,14,15]). Coverage of a complexity concept was determined by the presence of its specific search terms. These search terms were applied as filters to the 910 papers remaining in the knowledge base from Section 2.1., to each paper’s title, abstract, or keywords. As article records were initially downloaded from Scopus in an Excel spreadsheet, each search term searched using CTRL+F. Six additional Excel columns were created to represent each complexity concept. Where any search term related to a complexity concept was present, this was indicated as a ‘1’ in the appropriate cell. This only provided a broad indication of which concepts were intended to be addressed in an article, as explicitly used by its authors. At the end of this process, 173 articles covered 0 complexity concepts and were thus removed from the database. This final database of 737 papers is available on request from the authors.
The Excel spreadsheet database was imported into R as a CSV file. The R package UpSetR [16,17] was used to process results. Results were reported through Euler diagrams. Euler diagrams are a representation of sets, similar to a Venn diagram. They are often used when a traditional Venn diagram is illegible due to a high number of intersecting variables. In a Euler diagram, intersections of variables can be represented as mutually exclusive ‘bins’, in a bar char format. An example of the reported Euler diagrams is found in Figure 3 and these contain:
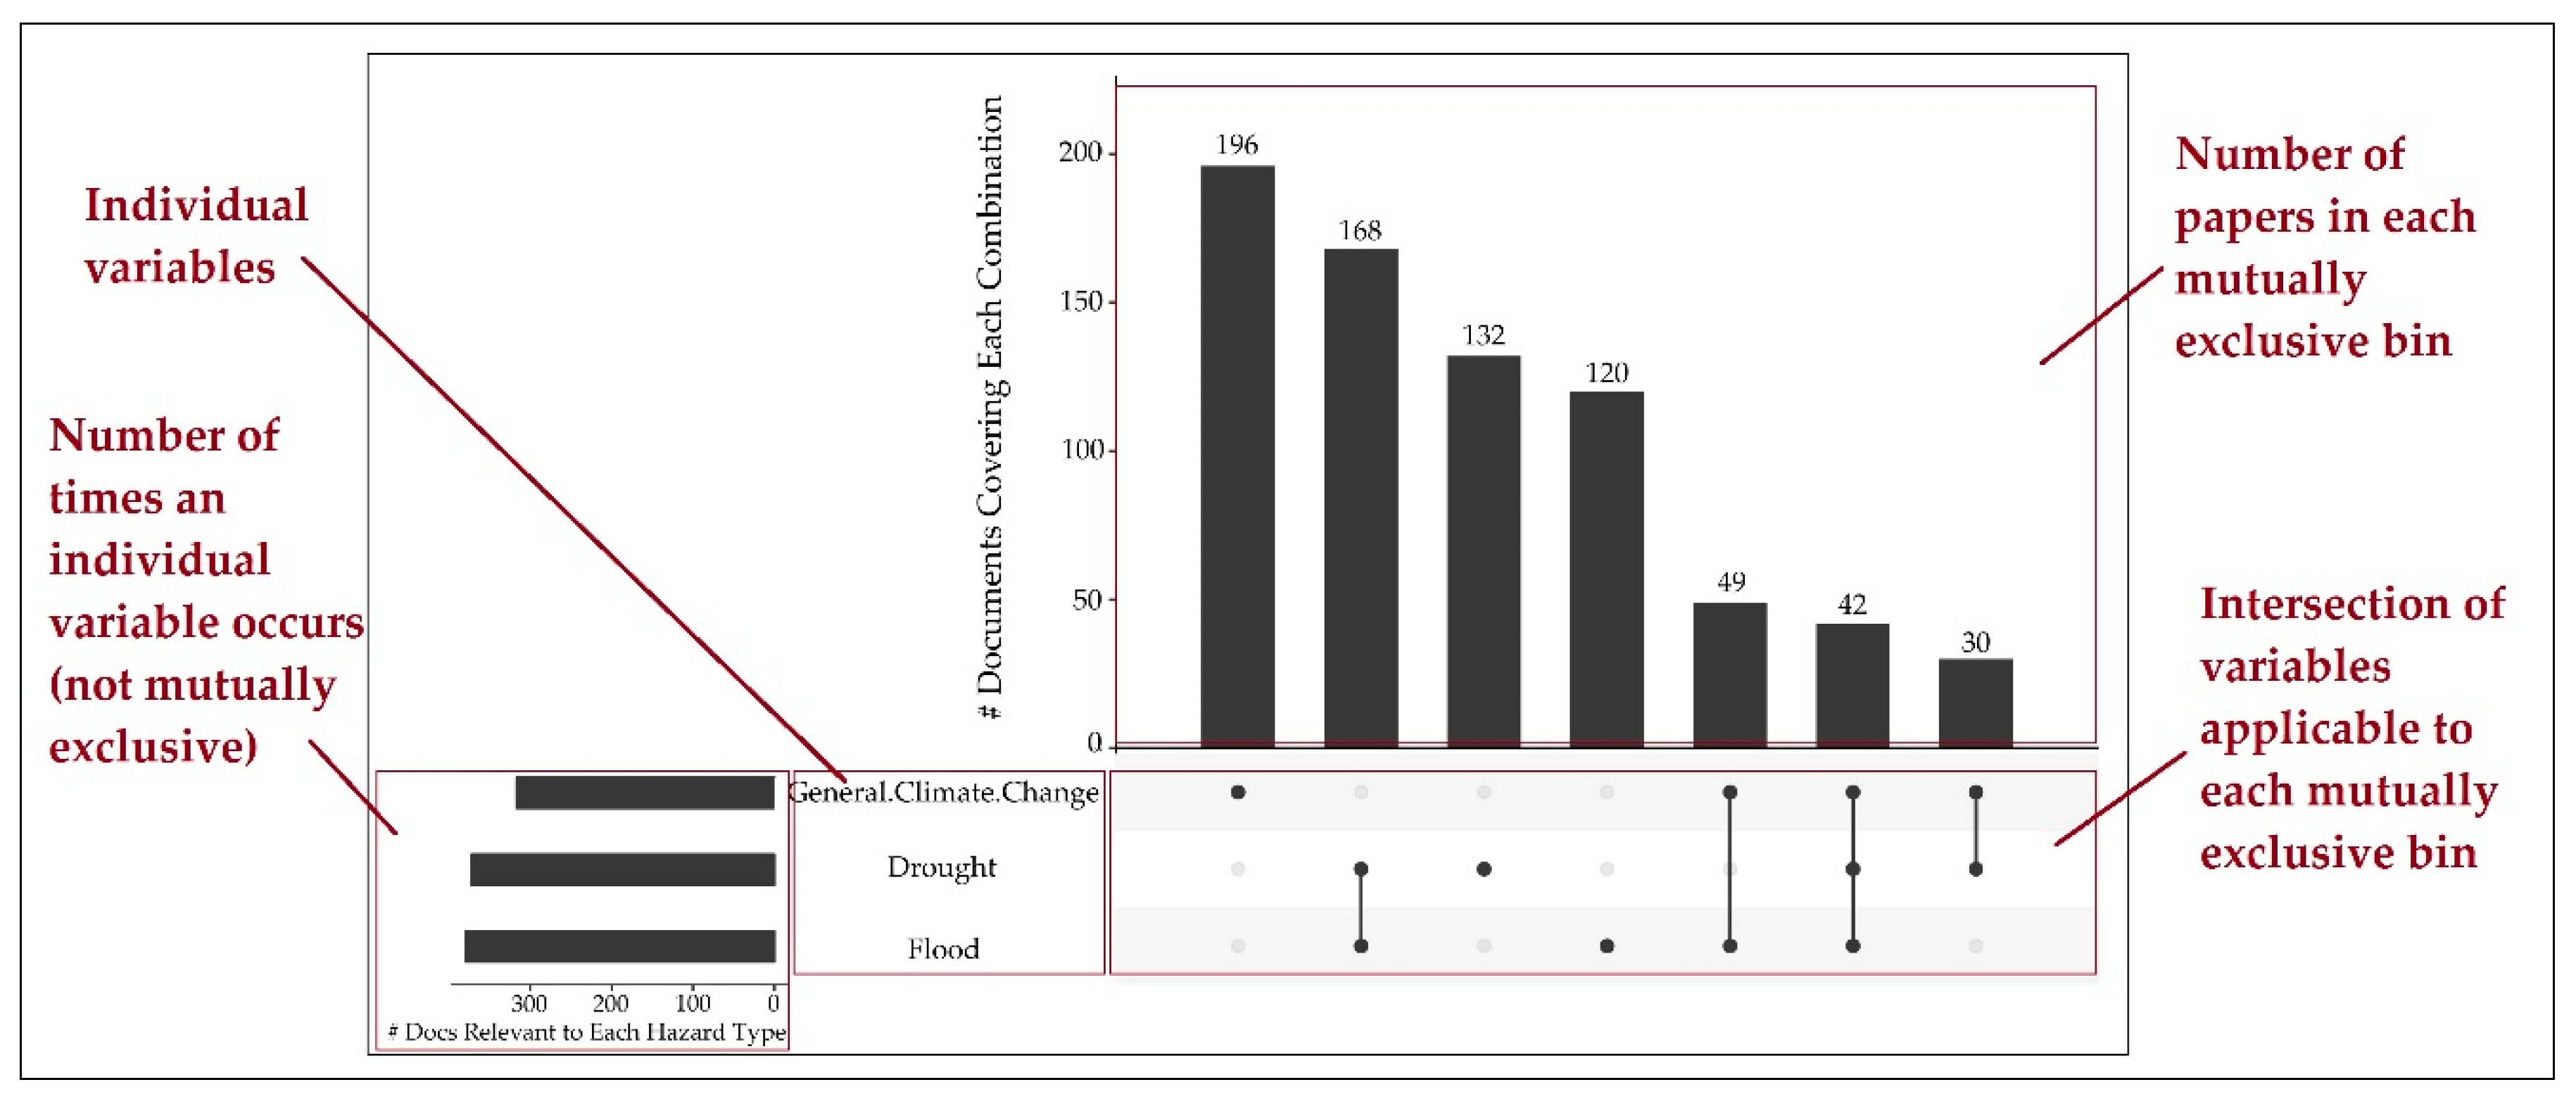
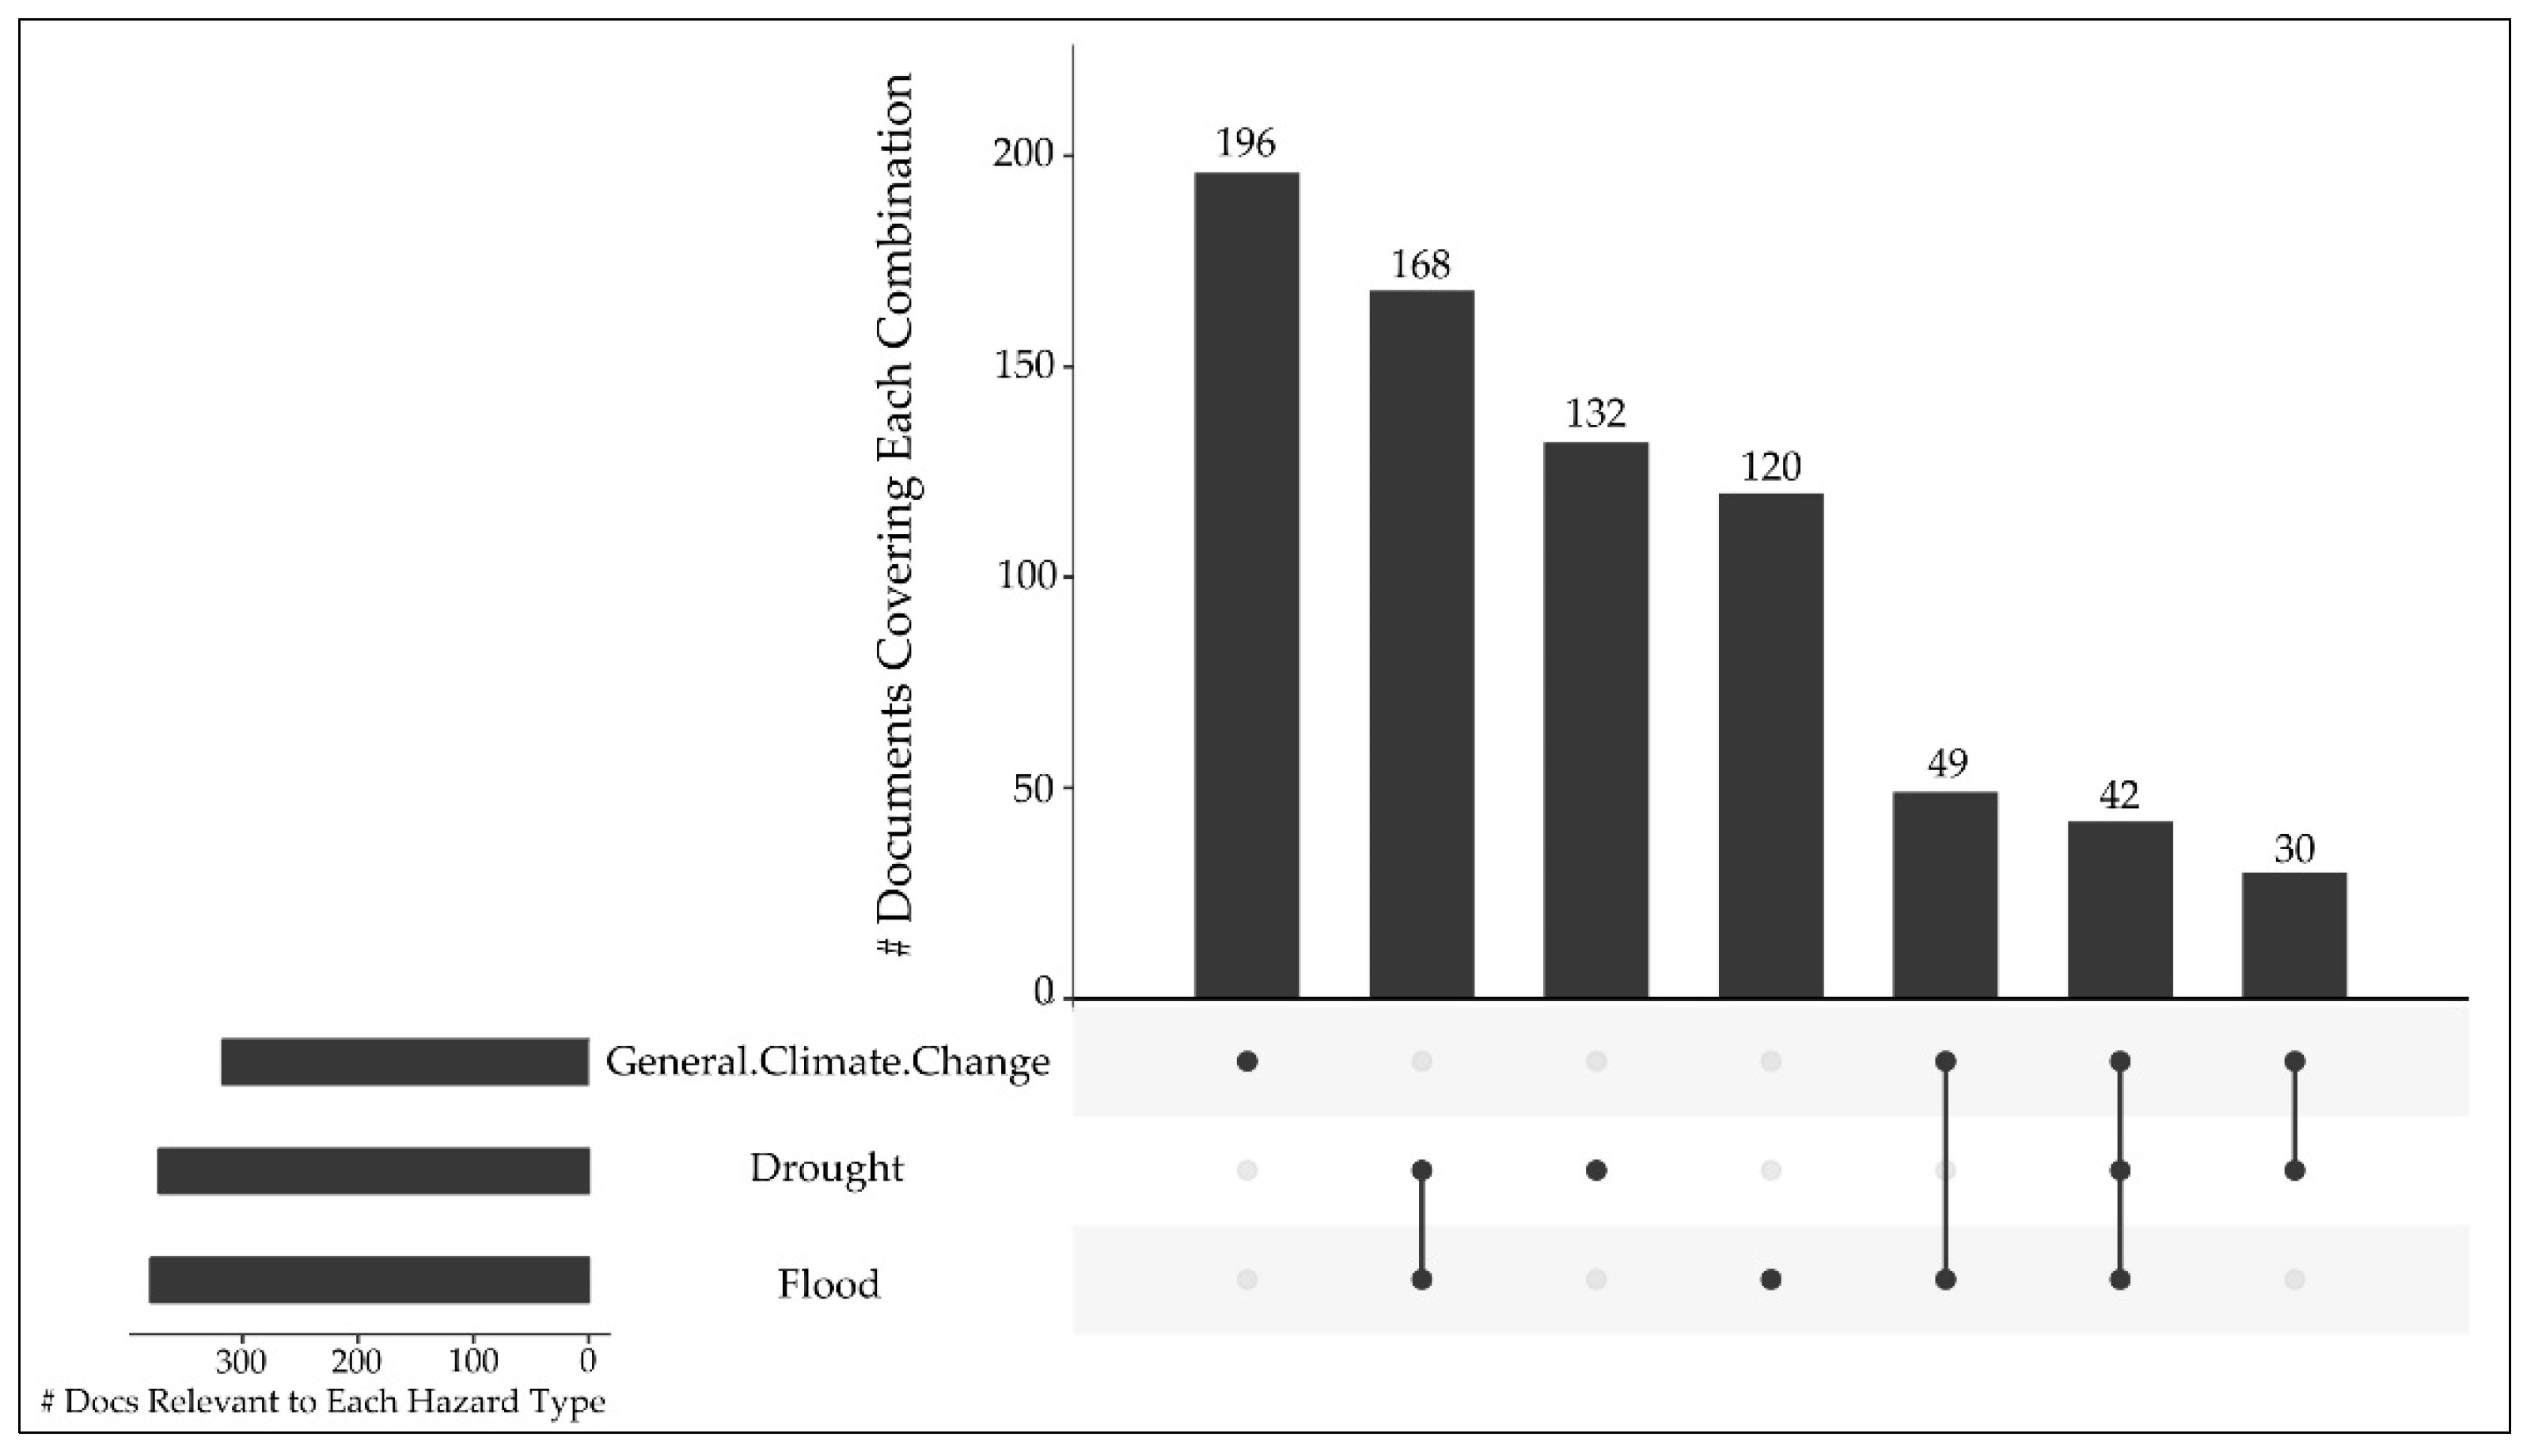
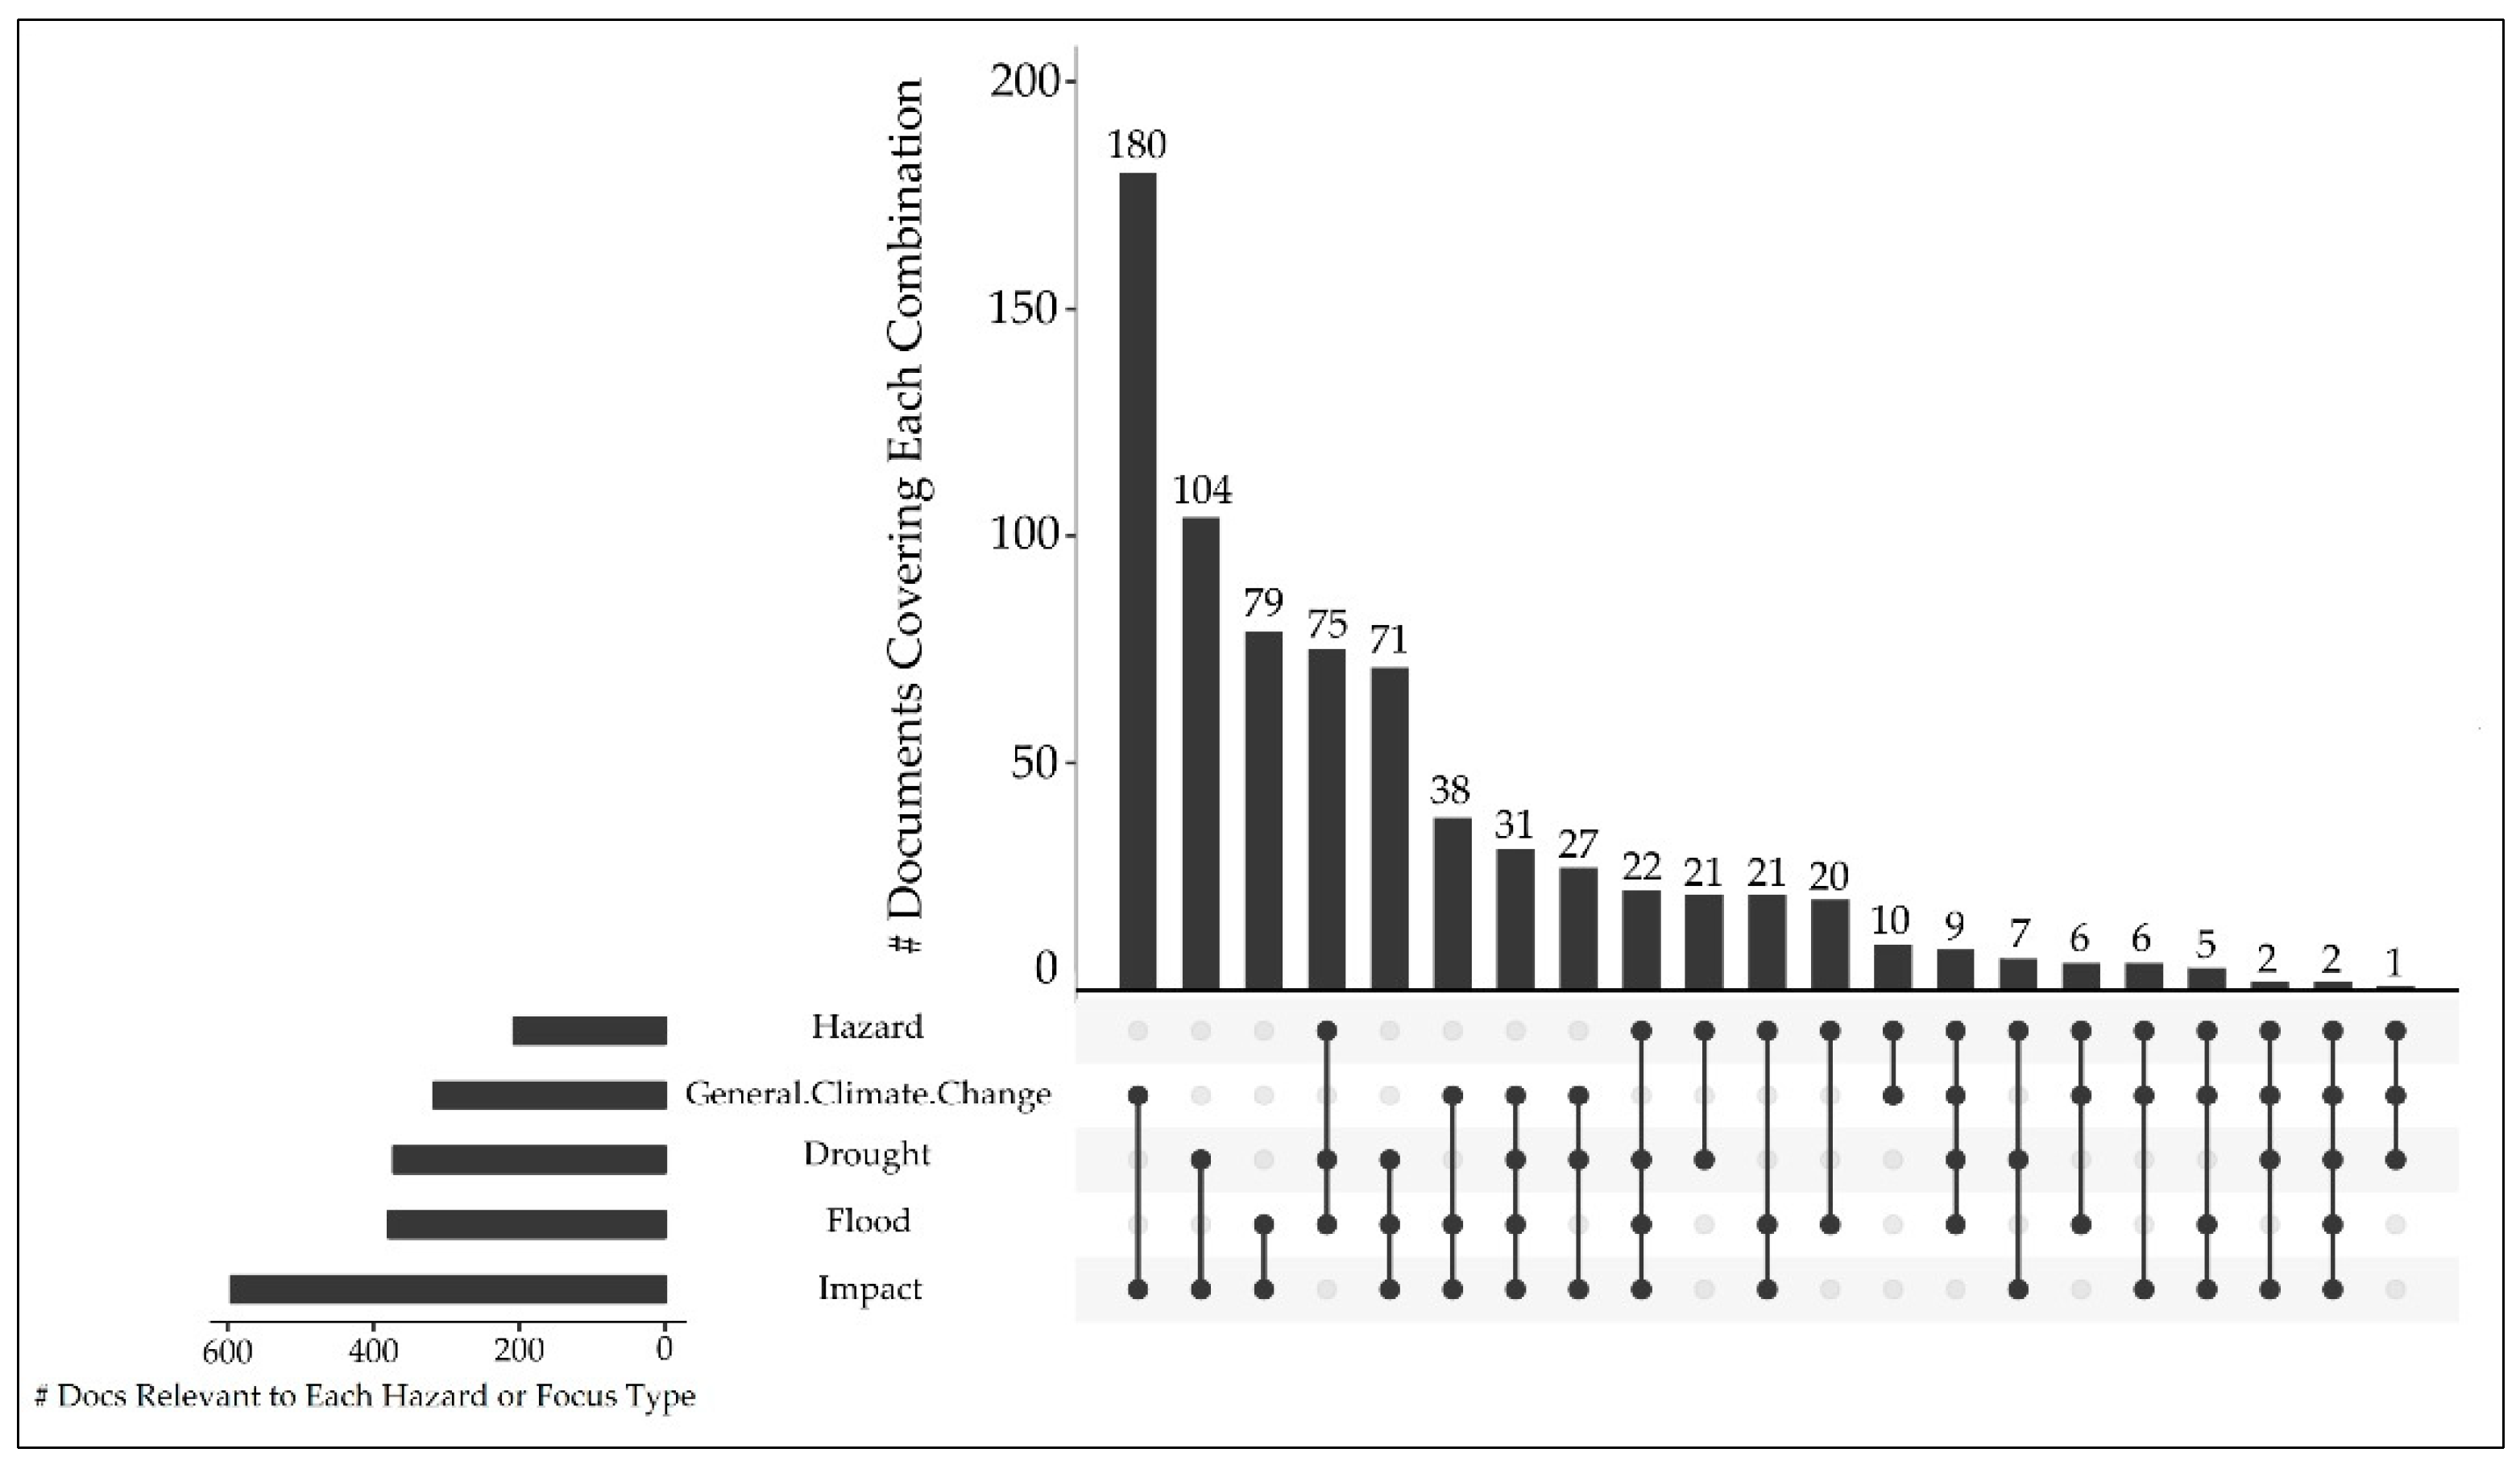
  • a horizontal bar chart portraying each variable with their respective overall, nonmutually exclusive, occurrence;
  • a vertical bar chart portraying the number of papers allotted to mutually exclusive ‘bins’, with each bin representing a distinct combination of variables, signified by applicable variable intersections indicated by dots and lines.

2.3. Characterise the Typical Research Context

The third part of the review design was to generally describe the knowledge base. This step was performed only for the 737 final papers found in Section 2.2, as these were deemed the most useful for understanding how complexity concepts are currently covered. A timeline of the knowledge base was produced.
This stage required one author to manually read and review the abstract of each paper. Where insufficient information was provided in the abstract, the reviewing author read the full paper. As article records were initially downloaded from Scopus in an Excel spreadsheet, a column was added to the database to reflect whether papers reviewed or compared methods. This counted the existing work to perform reviews that may be in any way similar to this effort.
It was also considered whether papers addressed multiple or compound hazards. This was identified in Table 1, Challenge 10. However, this was not incorporated into the six complexity concepts from Table 2, as it was instead deemed a sustainability concept. Thus, whether floods and droughts are covered separately or jointly was tracked through all 737 papers. Specifically, the reviewing author identified which types of hazard were covered and the emphasis of each paper on its study of a hazard and/or impact. Table 3 shows the five variables considered in this step: Drought hazards, flood hazards, general climate change hazards, focus on hazards, and focus on impacts.
The reviewing author read each abstract to determine the applicability of each variable. Five additional spreadsheet columns were created to represent each of the above variables. Where a variable was applicable, this was indicated as a ‘1’ in the appropriate cell. This took a ‘select all that apply’ format. In other words, these variables are not mutually exclusive.
For example, one paper studied the effects of drought stress on different potato cultivars. This paper had received a ‘1’ in the columns for:
  • Drought hazard type;
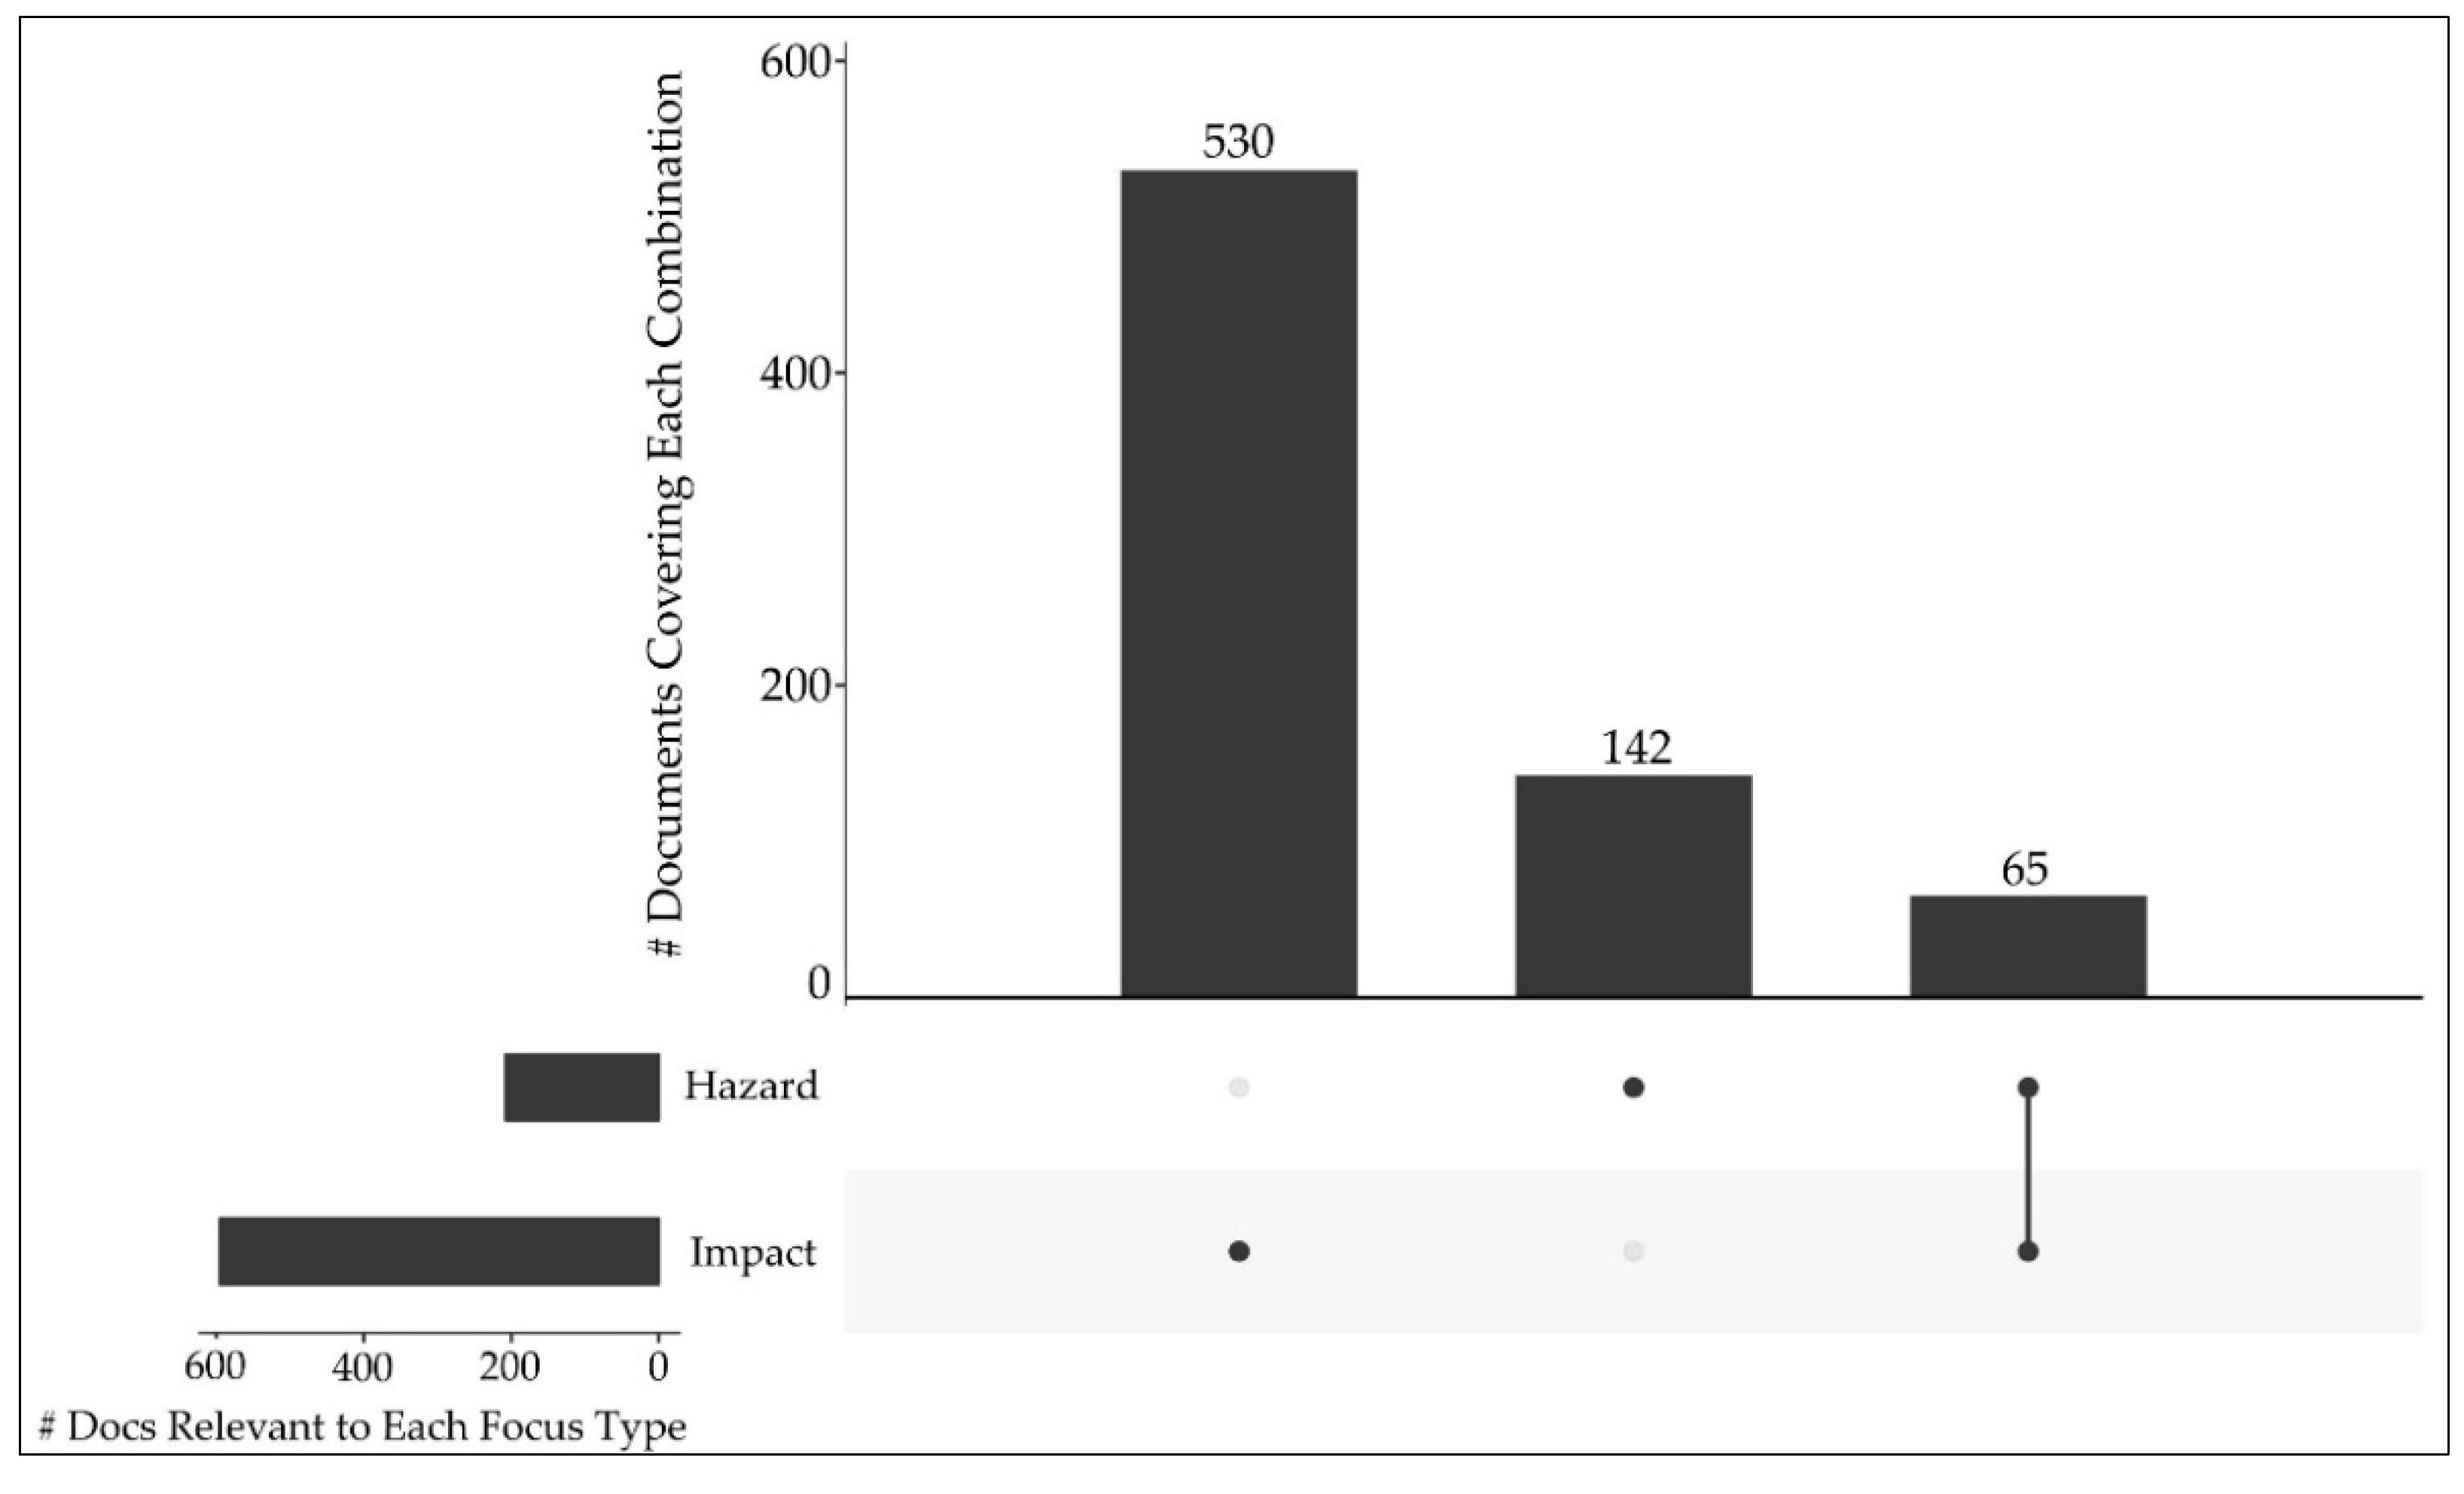
  • Focus on quantification of a hazard; and
  • Focus on quantification of an impact.
The updated Excel spreadsheet database was imported into R as a CSV file. The R package UpSetR [16,17] was used to process results. Results were reported through Euler diagrams, as described in Section 2.2 and depicted in Figure 3.

2.4. In-Depth Assessment

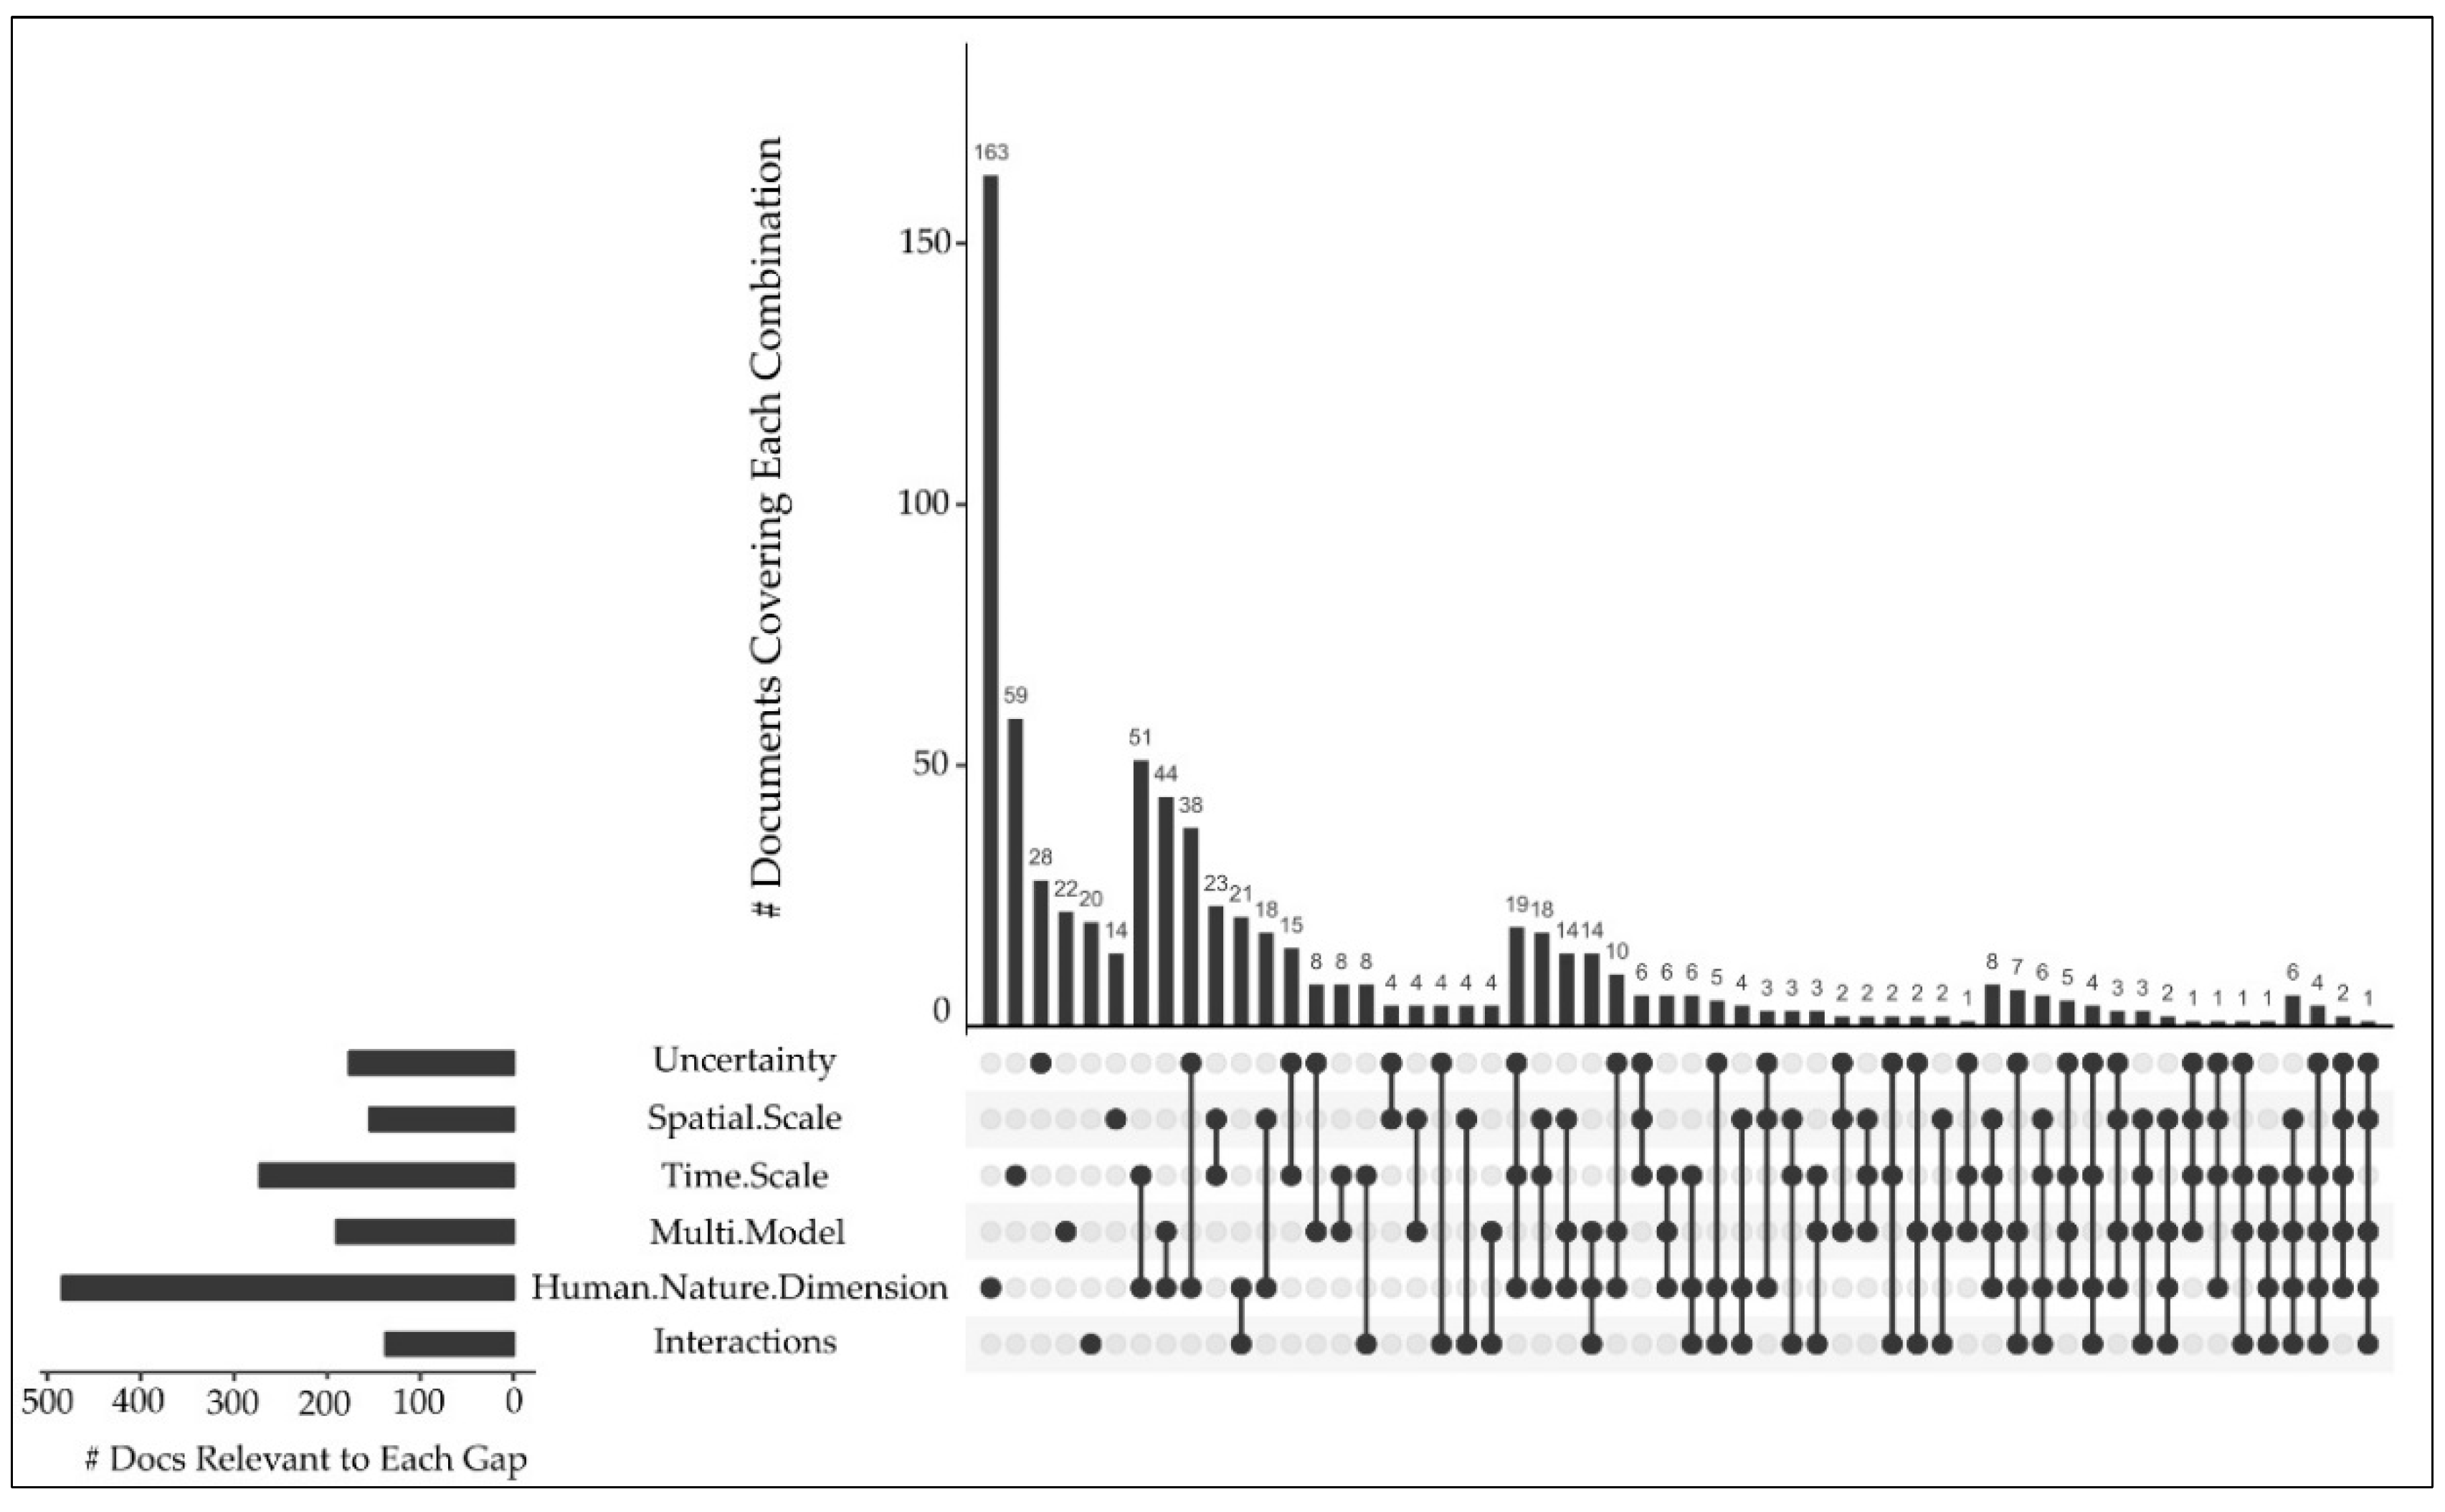
2.4.1. Frequency and Co-Occurrence of Variables

The in-depth analysis required one author to manually read and review the abstract of each paper. Where insufficient information was provided in the abstract, the reviewing author read the full paper. The six complexity concepts from Table 2 were broken down into more detailed variables to examine not just if, but also how well, complexity challenges are covered.
Table 4 presents each detailed variable, in relation to the six general complexity concepts. These variables and their descriptions were used to assess if they occurred within each abstract (or full paper where insufficient information was provided). As article records were initially downloaded from Scopus in an Excel spreadsheet, additional columns were created to represent each detailed variable. Where a detailed variable was applicable, the reviewing author indicated this as a ‘1’ in the appropriate cell.
The first step was to identify the specific methods used in each paper (e.g., content analysis). Before the start of analysis, several commonly used methods were brainstormed. An Excel column representing each of these methods was added to the spreadsheet. Each time a new method arose (e.g., transect walks), another spreadsheet column was created so that the use of this method could be tracked through the remainder of the papers. At the end of analysis, 42 specific methods had been tracked. A Euler diagram with 42 variables and all of their possible combinations proved difficult to produce and interpret. Results for specific methods were presented selectively, not fully, for maximum clarity.
To further ease the presentation of results, each of the specific methods was also placed under the umbrella of a higher-level category (e.g., content analysis was categorised as a classic qualitative method). These categories emerged from the common aims of the specific methods, rather than a standard set of methodological approaches. (For example, categorising simply as qualitative vs. quantitative, or categorising as action research vs. ethnography vs. scientific.) Descriptions for each category are provided in Table 4 for clarity.
After identifying the methods used, the reviewing author examined which of the other detailed variables (i.e., uncertainty, spatial scales, time scales, and human–nature dimensions) were covered by that set of methods. For example, one paper measured physiological traits of potato cell membranes every day over a 2-year period and performed a statistical analysis on the data to study their drought response. This did not include the consideration of multiple possible futures, or probabilistic assessments. This paper received a ‘1’ in the columns for:
  • Physical measurement or lab experiment method (under the umbrella of classic quantitative methods);
  • Statistical analysis method (under the umbrella of classic quantitative methods);
  • the cellular spatial scale;
  • the short-term time scale (hours to days to weeks);
  • the medium-term (months to years) time scale;
  • the agricultural human–nature dimension; and
  • the ecological human–nature dimension.
This approach means the frequency count of each detailed variable was attached to what was actually measured by the methods used. The theoretical rigour and the quality of discussion within each paper were disregarded. Inferred recommendations based on findings were also disregarded. For example, if the above paper on drought stress of potato cultivars made recommendations for long-term agricultural policies, the long-term time scale was not ticked, because this study was not measured over decades or centuries.
Variables were updated as themes emerged during an initial sample of 50 papers. Small additions were made to the examples of these variables as they arose throughout the analysis.
The updated Excel spreadsheet database was imported into R as a CSV file. The R package UpSetR [16,17] was used to process results. Results were reported through Euler diagrams, as described in Section 2.2 and depicted in Figure 3.

2.4.2. Associations between Variables

There were a high number of variables considered in this review. To test for patterns, statistical tests were applied.
The first step was to test for associations between variables. This involved a Pearson chi-square test adjusted for multiresponse categorical variables. This review takes a ‘select all that apply’ approach (answers are not mutually exclusive). To this end, the R package MRCV (Methods for Analyzing Multiple Response Categorical Variables) was applied [16,18]. Statistical significance was determined at p ≤ 0.05.
The second step was to determine the Cramer’s V correlation coefficients. These measure the strength (or weakness) of relationships between paired variables (ranging from 0, no relationship, to 1, perfect relationship) [19]. Typically, Cramer’s V < 0.10 is indicative of a weak relationship. Due to the ‘select all that apply’ approach in this review, a large number of pairs where both variables are zero are present. This skewed the weight of Cramer’s V towards appearing relatively weak. However, differences in Cramer’s V still made it possible to rank the significant pairs found in step 1.

3. Results

3.1. Broad Check for Complexity Concepts

3.1.1. Are the Complexity Concepts Acknowledged?

A total of 173 papers were excluded in Section 2.2, because the broad check showed these did not address any complexity concepts. This is noteworthy because 173 papers make up 19% of the research on climate change adaptation to hydrohazards. The requirements for this broad check were minimal; thus, it is possible that an even higher proportion of research neglects complexity issues.
The horizontal bar chart in Figure 4 shows the nonmutually exclusive occurrences of complexity concepts. The human–nature dimension was referenced most by a significant margin, in 66% (484) of papers. Following this, the second most referenced aspect, time scale, was at 37% (272) of papers, and the other four aspects were referenced in 19–26% of papers each. In general, the least referenced concept was interactions at 19% (137) papers.
The vertical bar chart in Figure 4 shows the mutually exclusive coverage of combinations of complexity concepts, with each bar representing a combination or ‘bin’. In other words, where a paper covered both the human–nature dimension and time scale concepts, this is counted in the ‘bin’ or bar above the two black dots for human–nature dimension and time scale. On average, each paper covered 1.92 concepts. The majority of papers (75%) covered only one or two concepts. The breakdown of coverage is as follows:
  • 41% (305) papers covered only one concept;
  • 34% (254) papers covered two concepts;
  • 17% (122) papers covered three concepts;
  • 6% (42) papers covered four concepts;
  • 2% (13) papers covered five concepts;
  • 0% or none of the papers covered all 6 concepts.
More specifically, the top three most covered combinations of complexity concepts, by a significant margin, were: Human–nature dimensions, 22% (163) of papers; time scale at 8% (59) of papers; and human–nature dimensions + time scale at 8% (51) of papers.

3.2. Description of the Research Context

This section appears after the broad check for complexity concepts, as these results apply to the final 737 papers that covered at least one complexity concept. These 737 papers underwent more detailed examination (i.e., manual reading of abstracts). This gives an indication for the original set of 910 papers. Figure 5 depicts a timeline of this knowledge base. The solid line shows total cumulative papers, and the dotted line shows number of papers added each year.
The first paper in this set was published in 1989. After this, there was a steady increase of 1–10 papers per year until the mid-2000s. Between the mid- to late-2000s, there was a burst of activity around climate change adaptation to hydrohazards. This rapid expansion of the knowledge base saw the largest annual addition of papers on the topic for three consecutive years in 2015, 2016, and 2017. This review covers the first eight months in 2018, and this trend appears likely to continue. Just 22 papers (3%) included some degree of review or comparison of different methods or approaches.
The horizontal bar chart in Figure 6 shows overall (not mutually exclusive) occurrences of each hazard type across the set of papers. Floods and droughts were covered equally (referenced in 51% (379) vs. 50% (372) of papers, respectively).
The horizontal bar chart in Figure 7 shows overall (not mutually exclusive) occurrences of a focus on a hazard or an impact, across the set of papers. Results show there was nearly three times more emphasis on impacts as opposed to hazards (595/81% vs. 207/28% of papers). The vertical bar chart in Figure 7 shows the mutually exclusive coverage of combinations of hazards and/or impacts, with each bar representing a combination or ‘bin’. In other words, where a paper’s methods covered both a hazard and an impact, this is counted in the ‘bin’ or bar above the two black dots for hazard and impact. Results show only 9% (65) of papers covered both a hazard and its impact.
Figure 8 shows when different hazard types from Figure 6 and the emphasis on hazard or impact from Figure 7 are considered together. Impacts from a range of natural hazards (general climate change and impacts) were the most covered combination at 24% (180) of papers. Drought impacts were the second-most covered at 14% (104) of papers. Flood impacts were the third-most covered at 11% (79) of papers. This means that drought impacts and flood impacts had about equal coverage. The fourth-most covered was the study of hydrohazards—covering the whole hydrological cycle at both ends of the spectrum, with a focus on estimating the hazard itself—at 10% (75) of papers. When considered as a distinct and separate hazard, drought and flood hazards were still covered approximately equally at 3% (21) vs. 3% (20) papers, respectively. Collectively, this shows floods and droughts are given near equal consideration.

3.3. In-Depth Assessment: Frequency and Co-Occurrence of Variables

The above concepts were broken down into more detailed variables in order to examine not just if but how well complexity challenges are covered in the existing literature. These more detailed variables are shown with descriptions in Table 4. Specifically, frequency of occurrence was examined for uncertainty, spatial and temporal scales, human–nature dimensions, and methods used.

3.3.1. How Well Are We Accounting for Future Uncertainties?

Throughout the detailed analysis, references to multiple possible futures were noted. These indicated consideration of uncertainty. Just 22% (160) of papers involved a form of some such scenario analysis. These papers undertook analyses which allowed for future uncertainties around both the human and natural aspects of systems (for example, a range of future scenarios or probabilistic future hazard assessments, etc.). This is slightly lower than when the “uncertainty” search term was used alone in the broad check for complexity concepts, which found 176 papers as reported in Section 3.1.1.

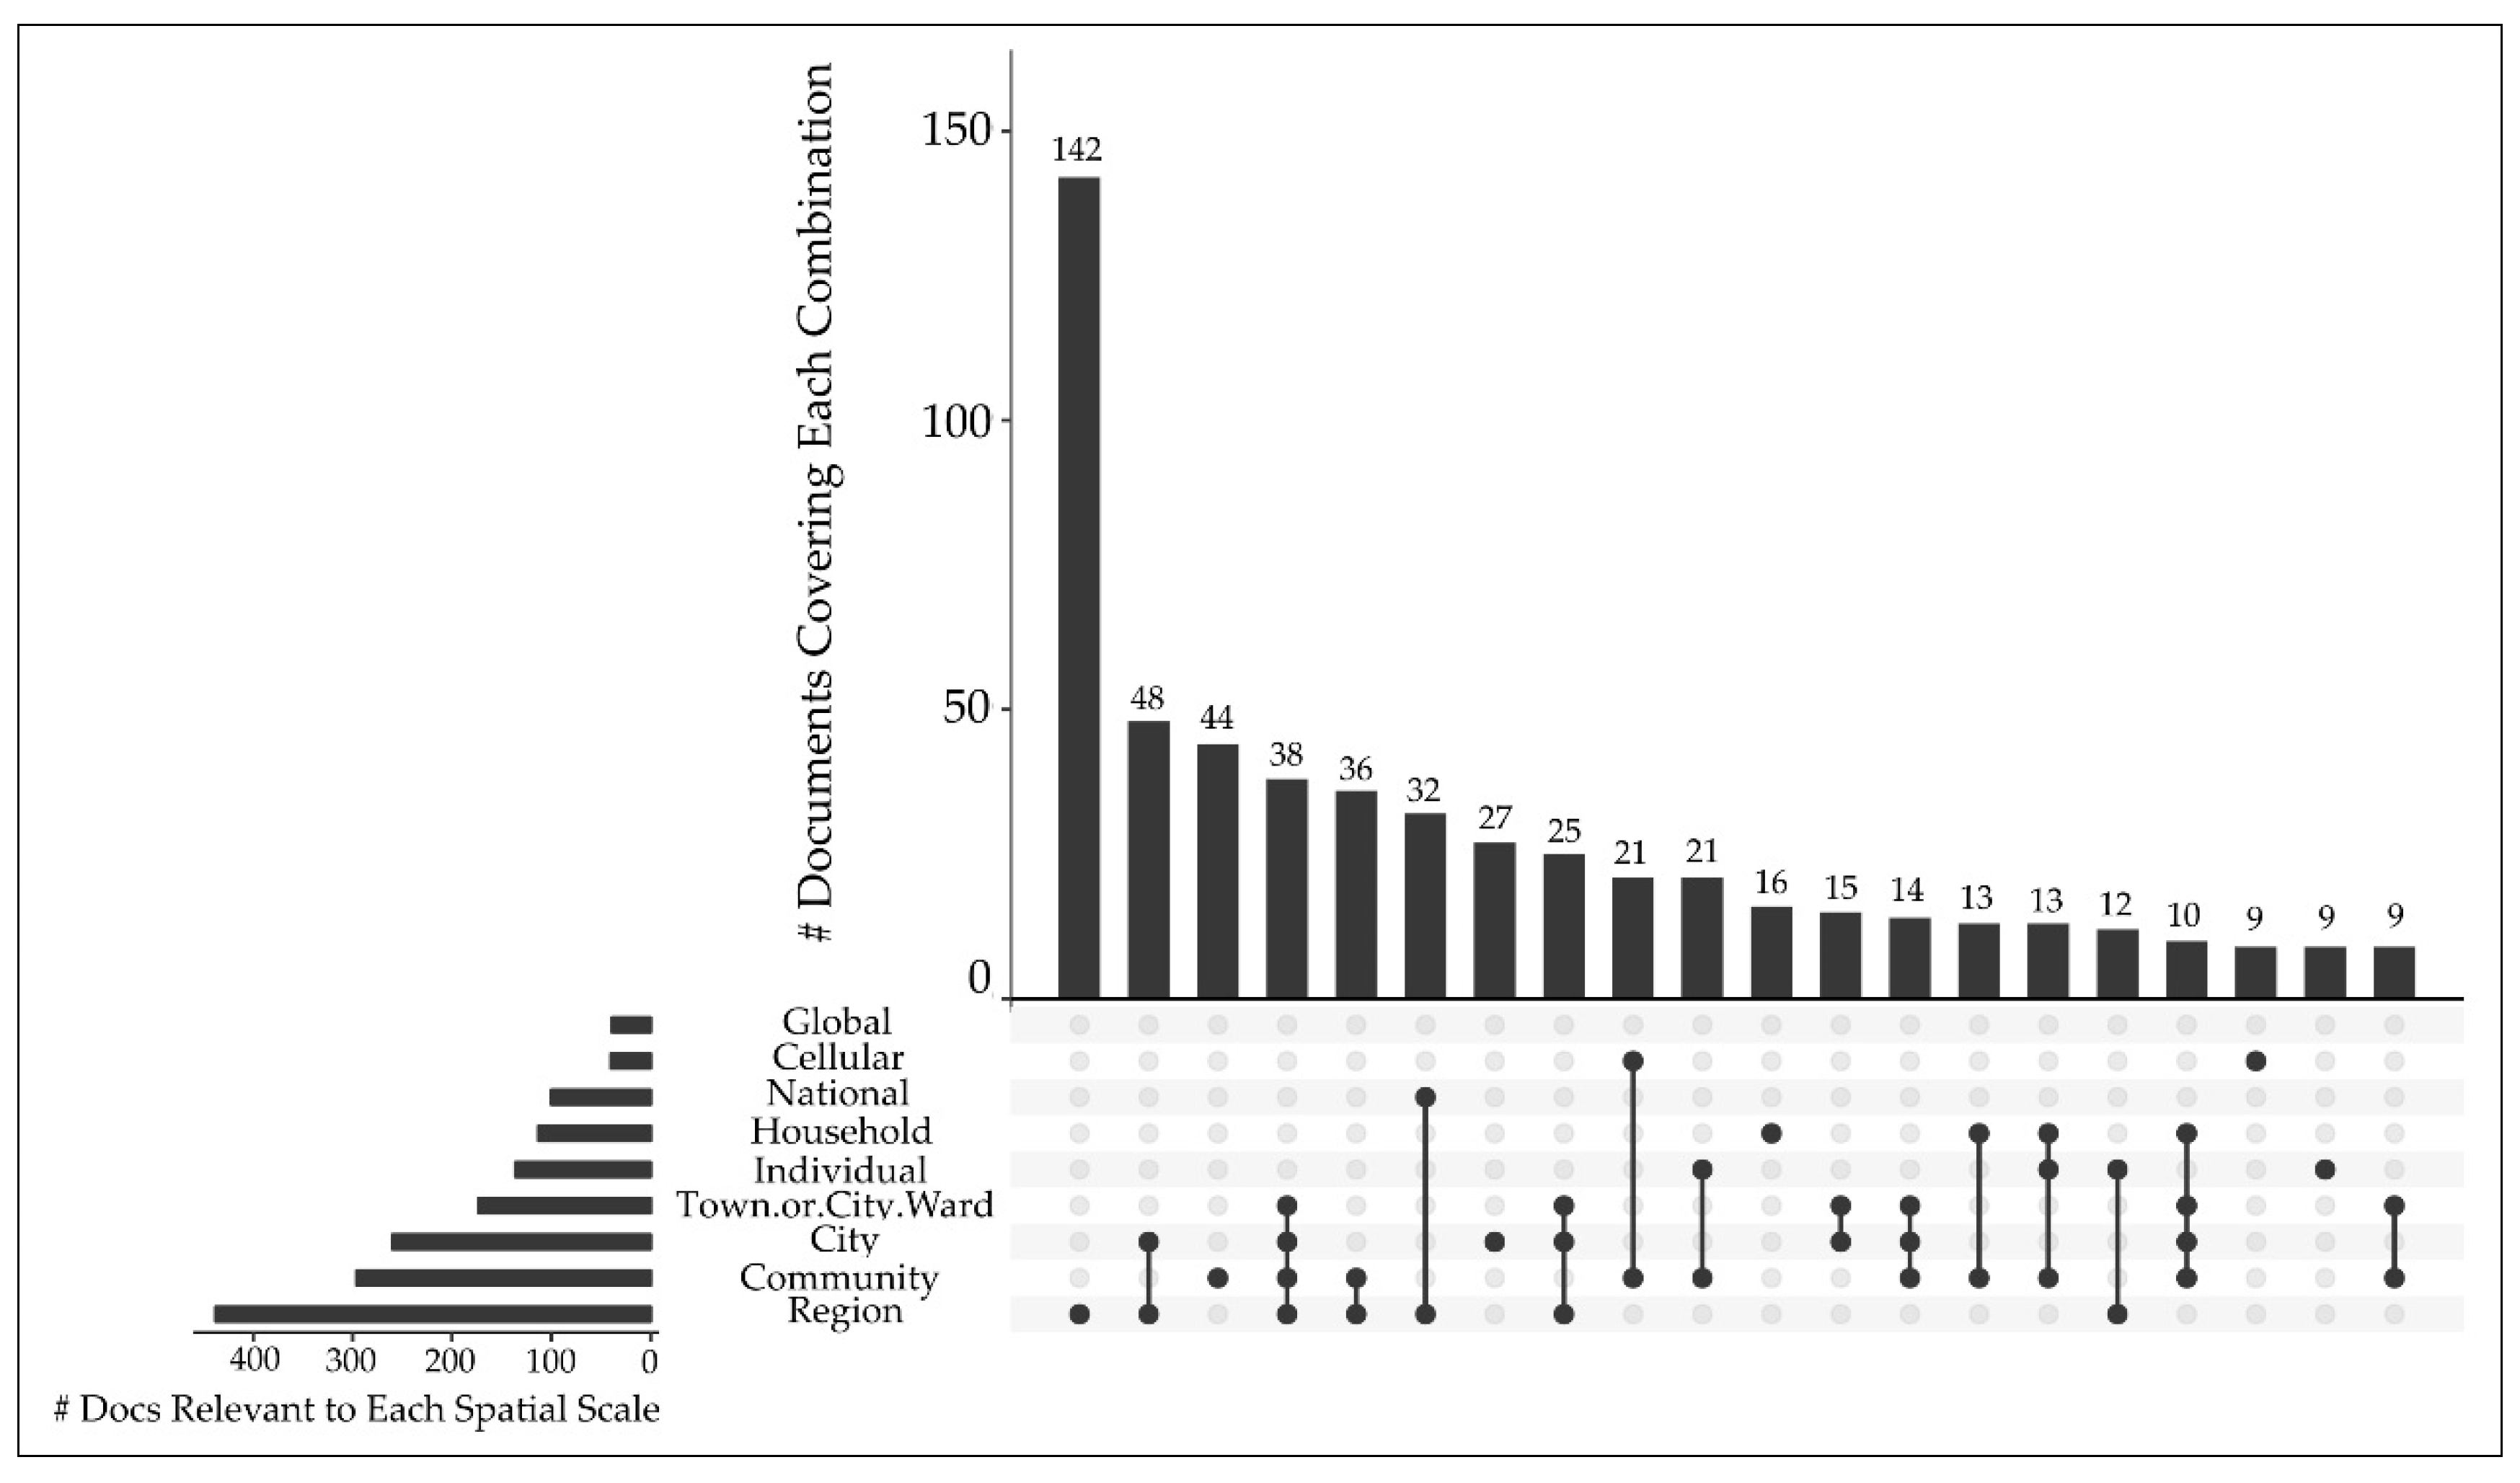
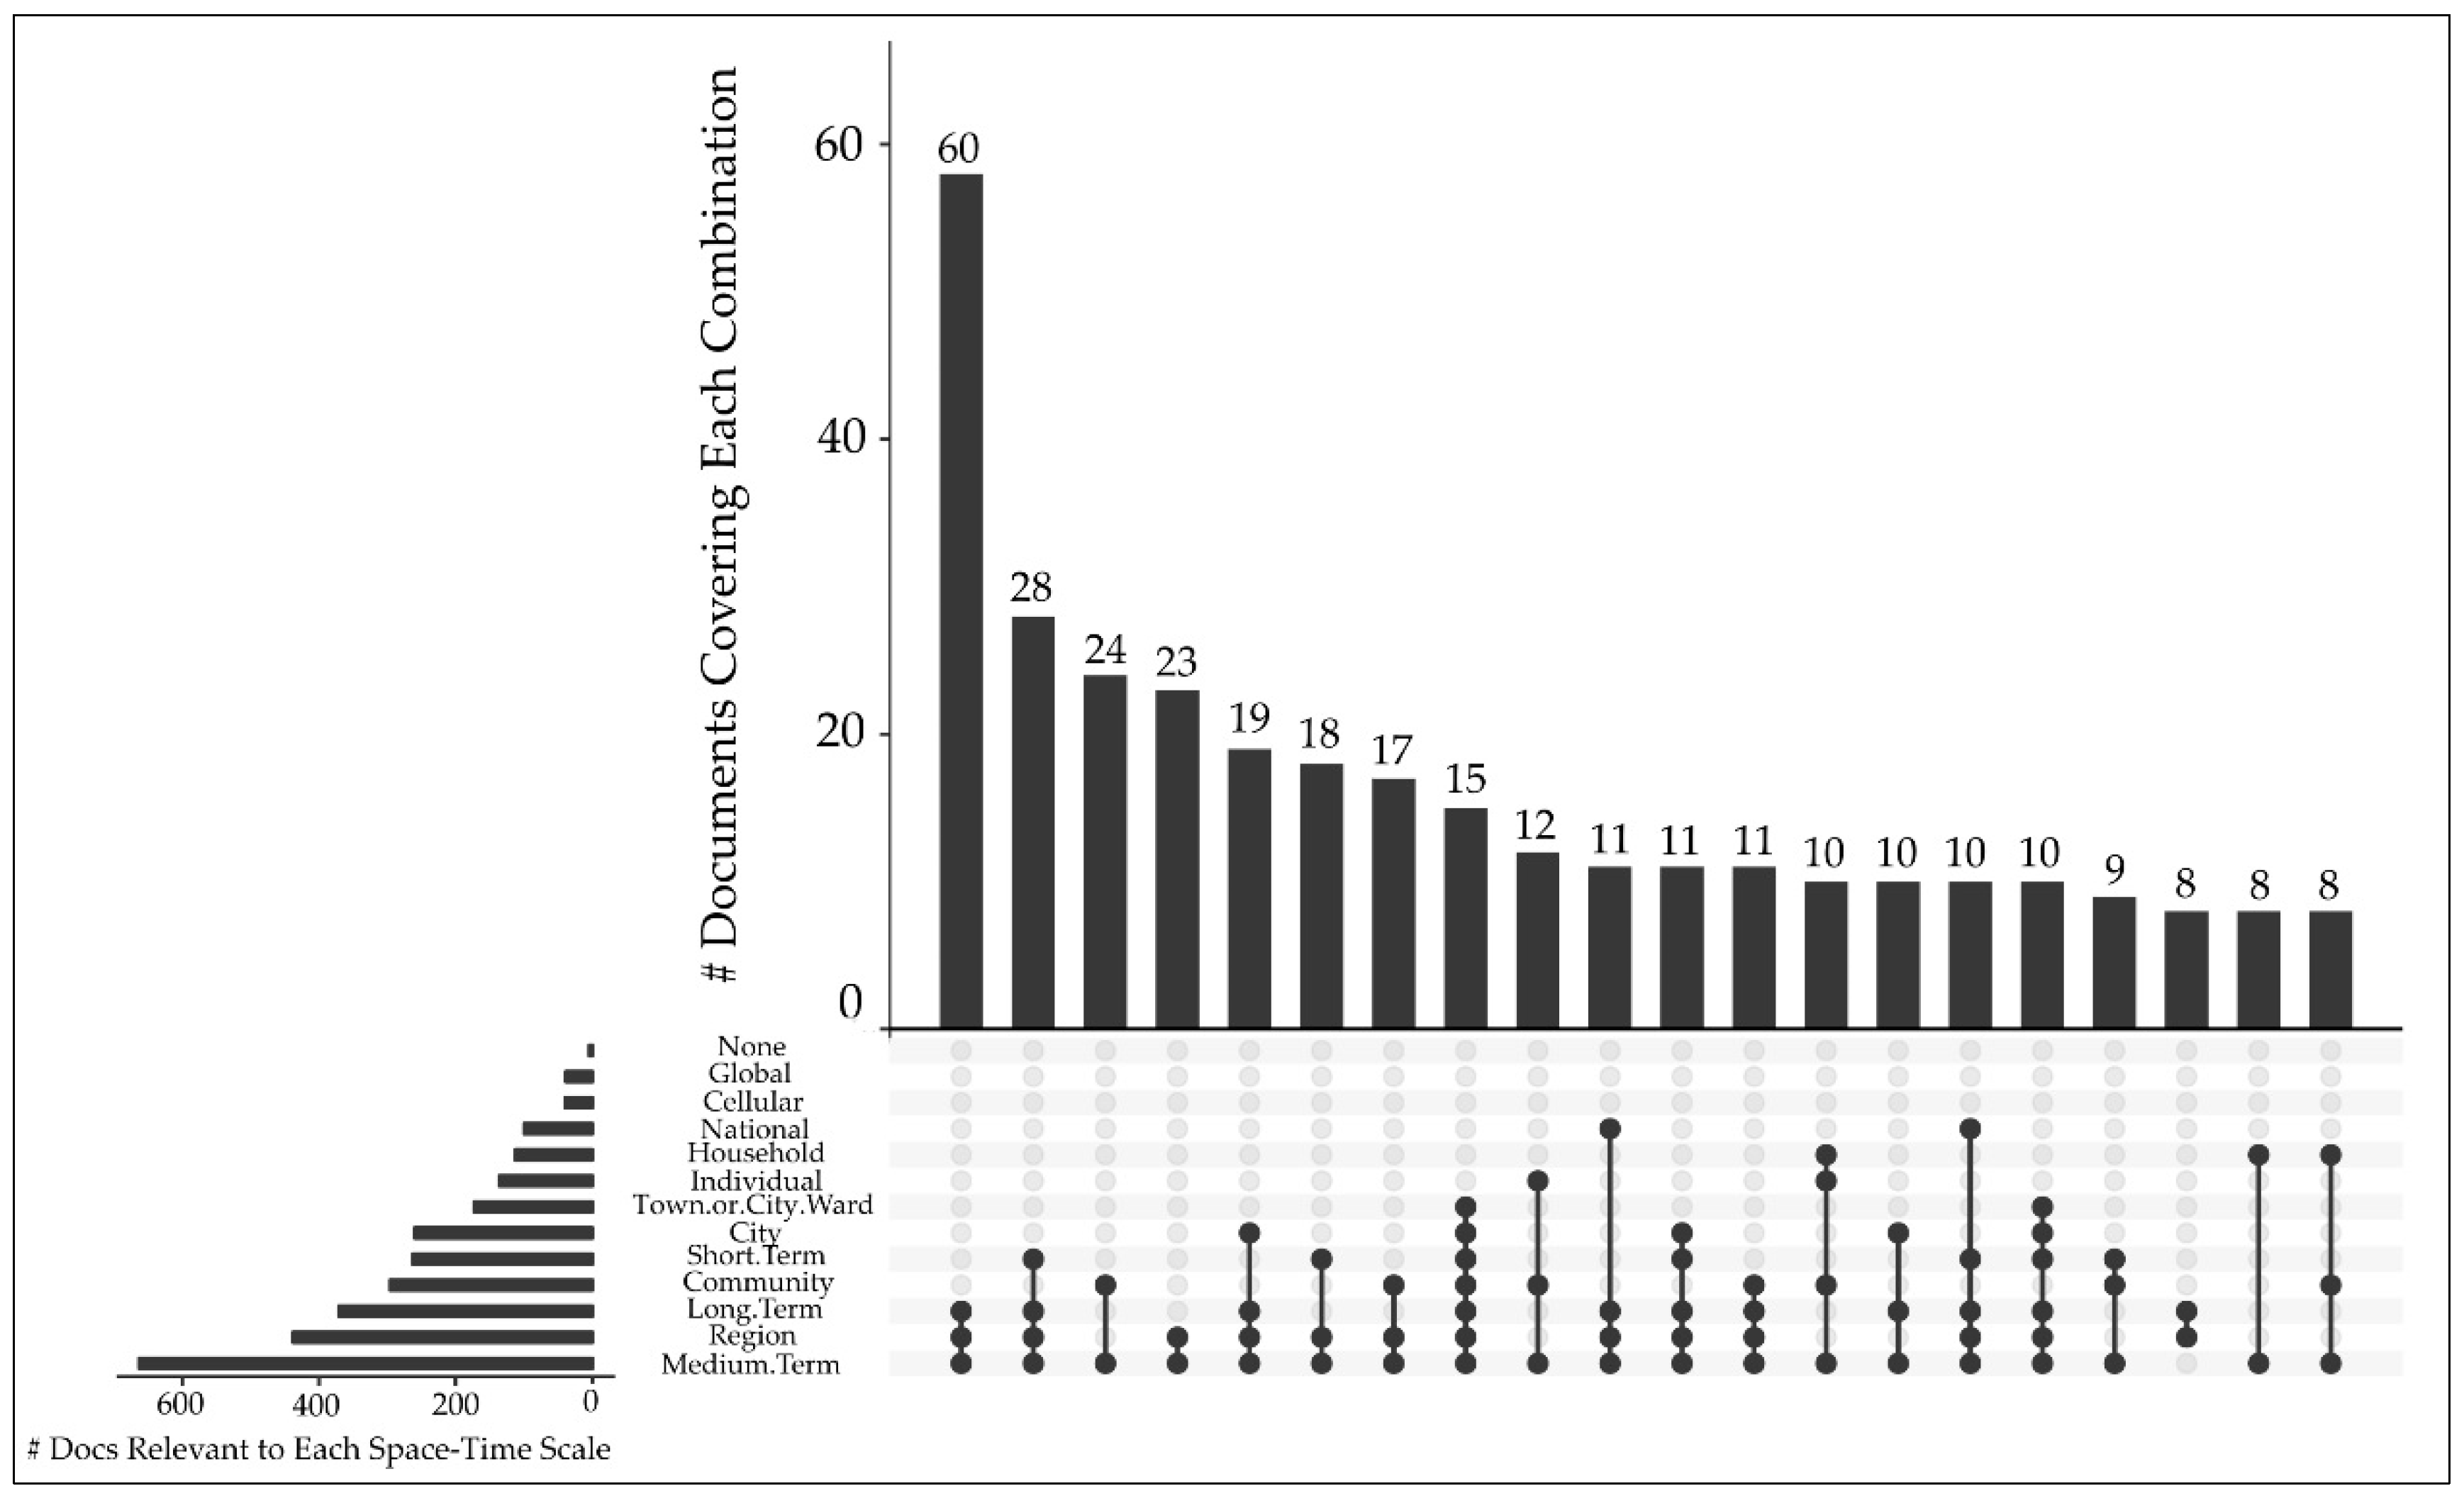
3.3.2. How Well Are Different Spatial and Temporal Scales Covered?

Results for coverage of different spatial scales are shown in Figure 9. The horizontal bar chart in Figure 9 shows the overall occurrence of each spatial scale across the set of papers, which were not mutually exclusive. The regional spatial scale was the most referenced by a wide margin, in 59% (438) of papers. Second-most referenced was the community spatial scale at 40% (296) of papers. In general, the least covered were the cellular and global scales, at either end of the spatial spectrum. Each of these occurred in about 5% of papers.
The vertical bar chart in Figure 9 shows the mutually exclusive coverage of combinations of different spatial scales, with each bar representing a combination or ‘bin’. In other words, where a paper covered both household- and community-level spatial scales, this is counted in the ‘bin’ or bar above the two black dots for household- and community-level. The breakdown of coverage was as follows:
  • 36% (265) covered just one spatial scale;
  • 34% (252) covered two spatial scales;
  • 14% (103) covered three spatial scales;
  • 10% (79) covered four spatial scales;
  • 4% (28) covered five spatial scales;
  • 1% (9) covered six spatial scales;
  • 0.1% (1) covered seven spatial scales;
  • 0% or none of the papers covered all eight or all nine spatial scales.
Results for different temporal scales are shown in Figure 10. The horizontal bar chart in Figure 10 shows the overall occurrence of each temporal scale across the set of papers, which were not mutually exclusive. Medium-term (months to years) was the most frequently referenced by a wide margin, occurring in 90% (663) of papers. This was followed by the long-term (decades to centuries) at 50% (371) and the short-term (hours to days to weeks) at 36% (263). A handful of papers were time-independent (1% or 5), for example, focusing on the general study of how people understand climate change, not in relation to specific events.
The vertical bar chart in Figure 10 shows the mutually exclusive coverage of combinations of different time scales, with each bar representing a combination or ‘bin’. In other words, where a paper covered both short- and medium-term time scales, this is counted in the ‘bin’ or bar above the two black dots for short- and medium-term. Coverage in mutually exclusive bins can be seen in the vertical bar chart in Figure 10. Ignoring time-independent papers, the breakdown of coverage was as follows:
  • 40% (295) covered one time scale;
  • 43% (319) covered two time scales;
  • 17% (123) covered all three time scales.
There was a good linkage of medium- to long-term time scales. However, linkage between of short-term to medium-term was half this strength, whilst linkage of the short-term to long-term was almost negligible.
Figure 11 depicts when spatial scale and time scale are considered in tandem. The vertical bar chart in Figure 11 shows the mutually exclusive coverage of combinations of different spatial and time scales, with each bar representing a combination or ‘bin’. In other words, where a paper covered both a regional spatial scale and a medium-term time scale, this is counted in the ‘bin’ or bar above the two black dots for regional and medium-term. The most covered bin was medium-term + long-term + regional scales (8%, 58). The second-largest grouping covered short-term + medium-term + long-term + regional (4%, 28). The third-largest grouping was a tie—both medium-term + community and medium-term + regional—at 3%, or 24 or 23 papers, respectively.
Figure 12 shows the top 20 combinations of time and space covering the greatest breadth of coverage. These ‘best covered’ groupings reached across nine scales. These four bins were:
  • Short-term + medium-term + cellular + individual + household + community + town or city ward + city + regional (0.1% or 1 paper) short-term + medium-term + long-term + individual + household + community + town or city ward + city + regional (0.1% or 1 paper);
  • Short-term + medium-term + long-term + individual + community + town or city ward + city + regional + national (0.1% or 1 paper);
  • Short-term + medium-term + long-term + individual + town or city ward + city + regional + national + global (0.1% or 1 paper).
In total, the top 20 bins only consisted of 30 papers—just 4% of the knowledge base. This indicates a generally wide spread of coverage for spatial and time scales, with a low number of papers covering a high number of these.

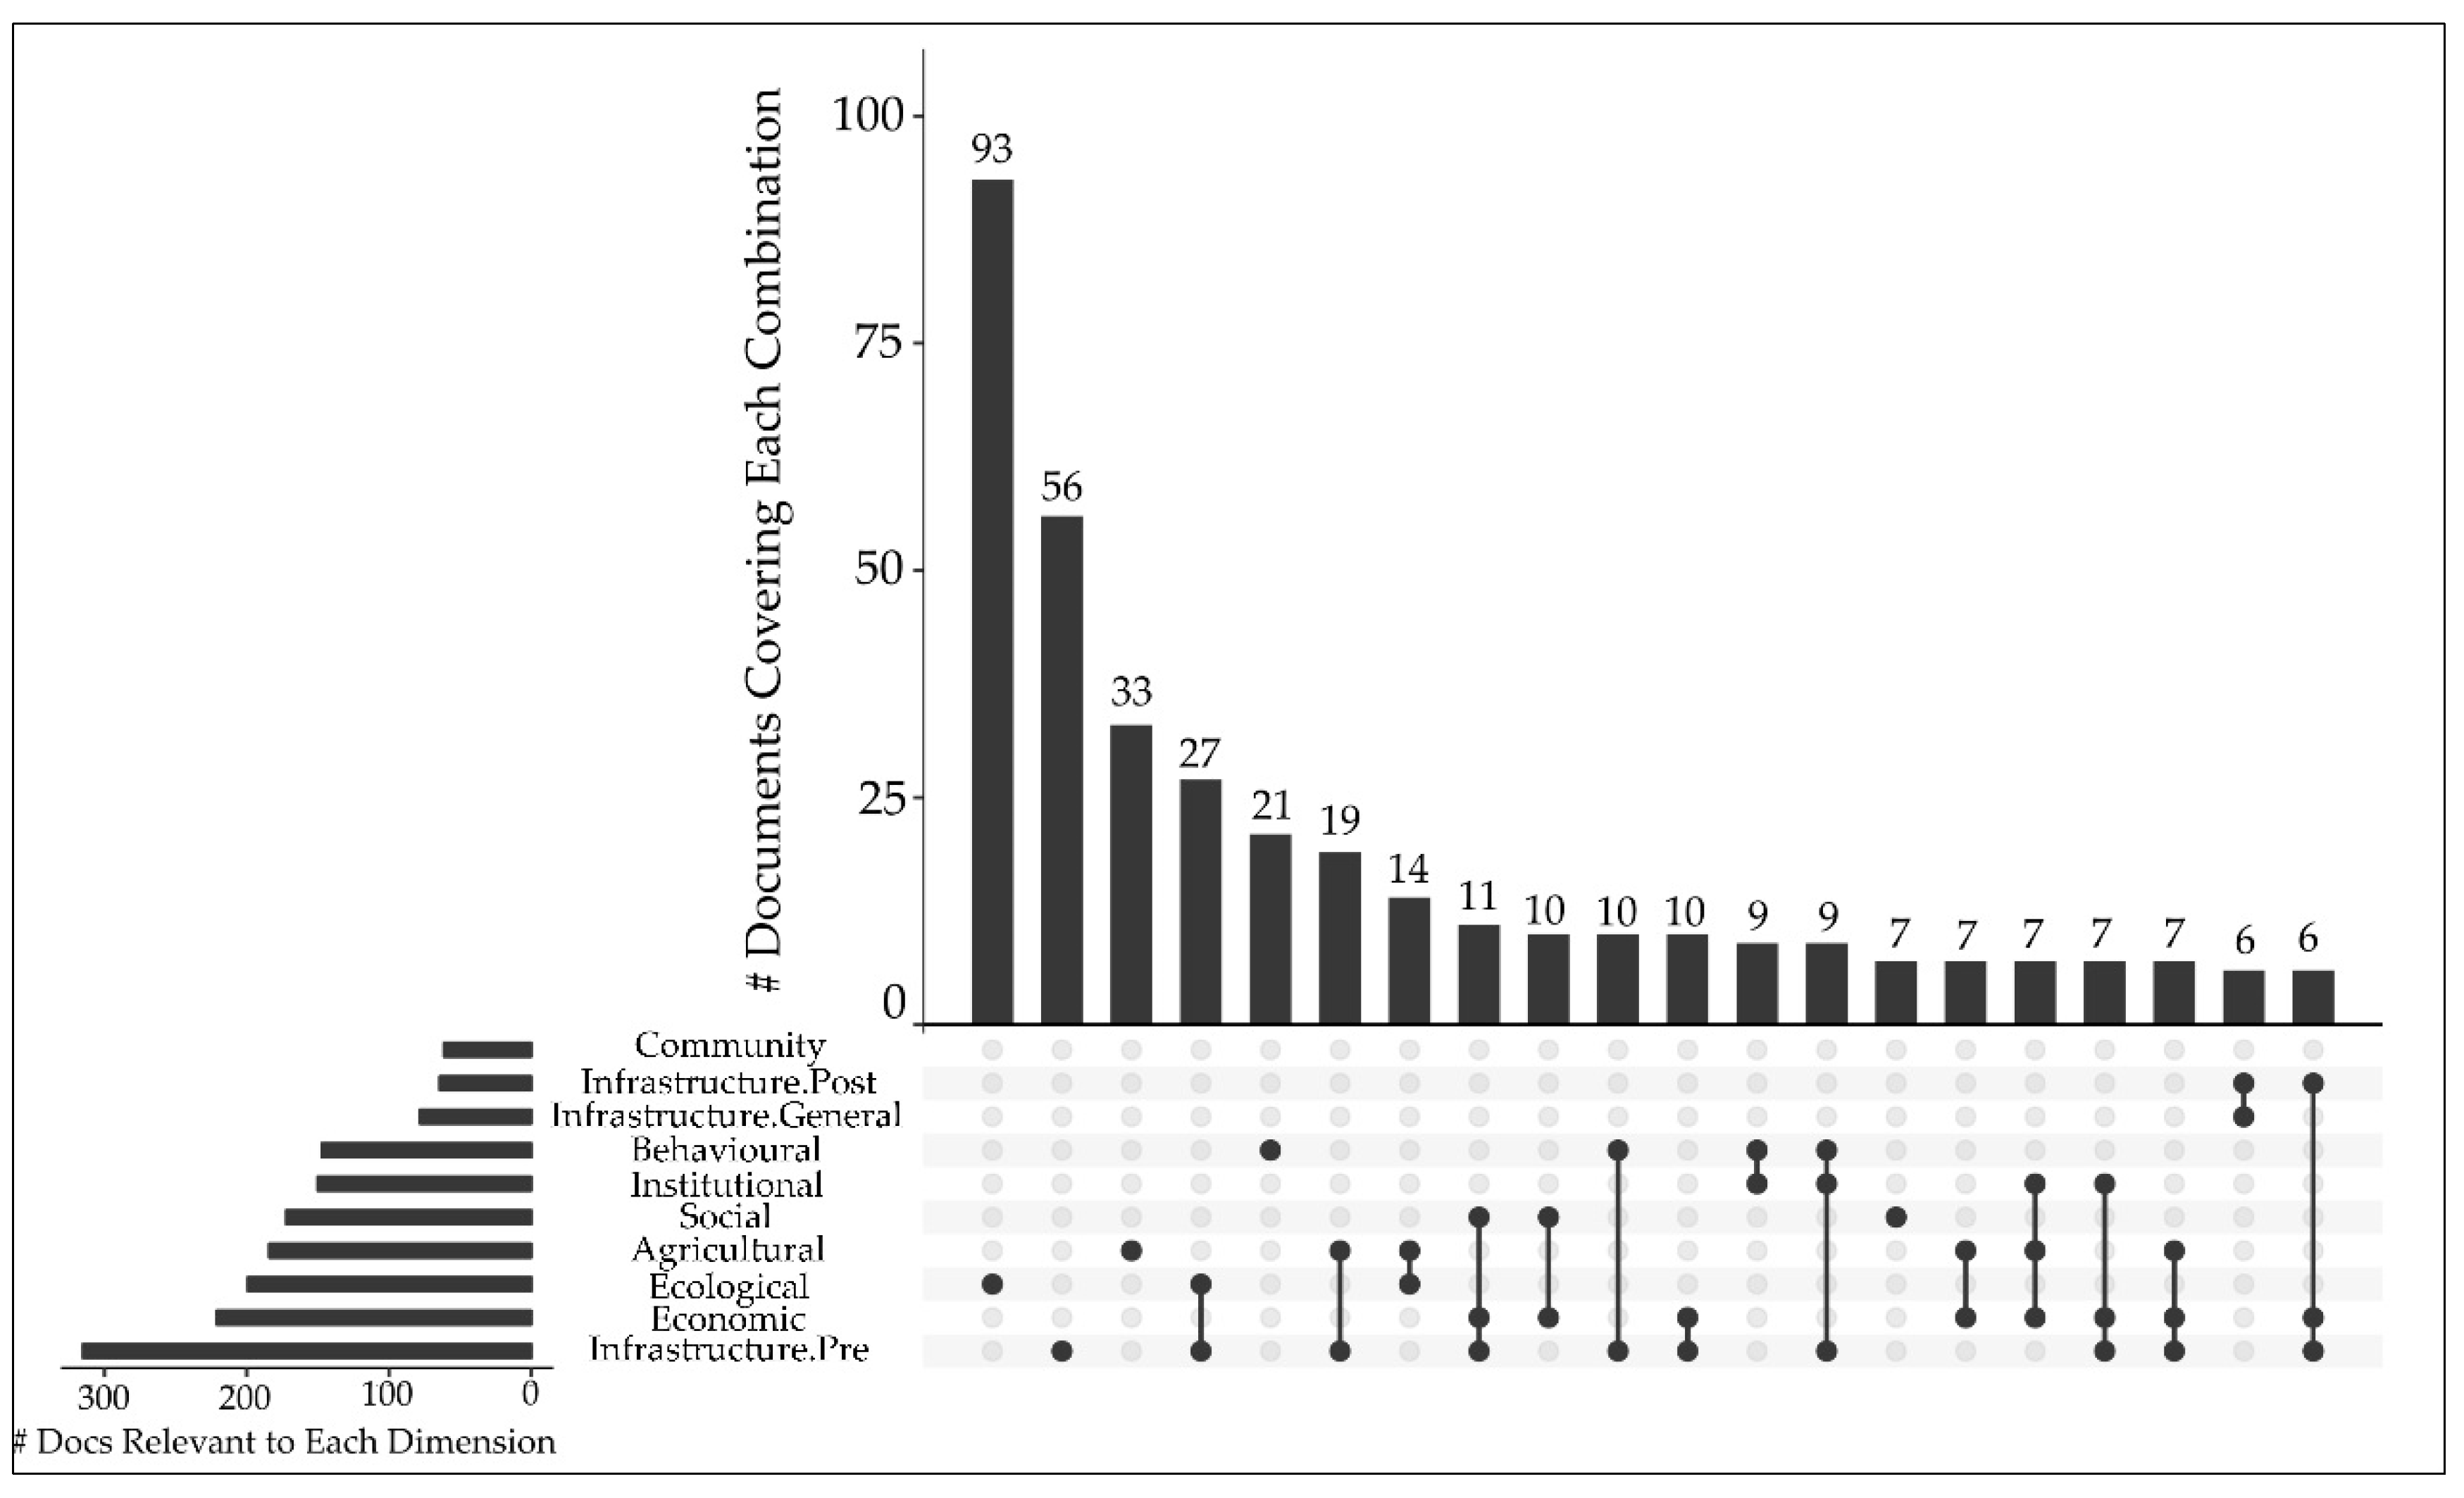
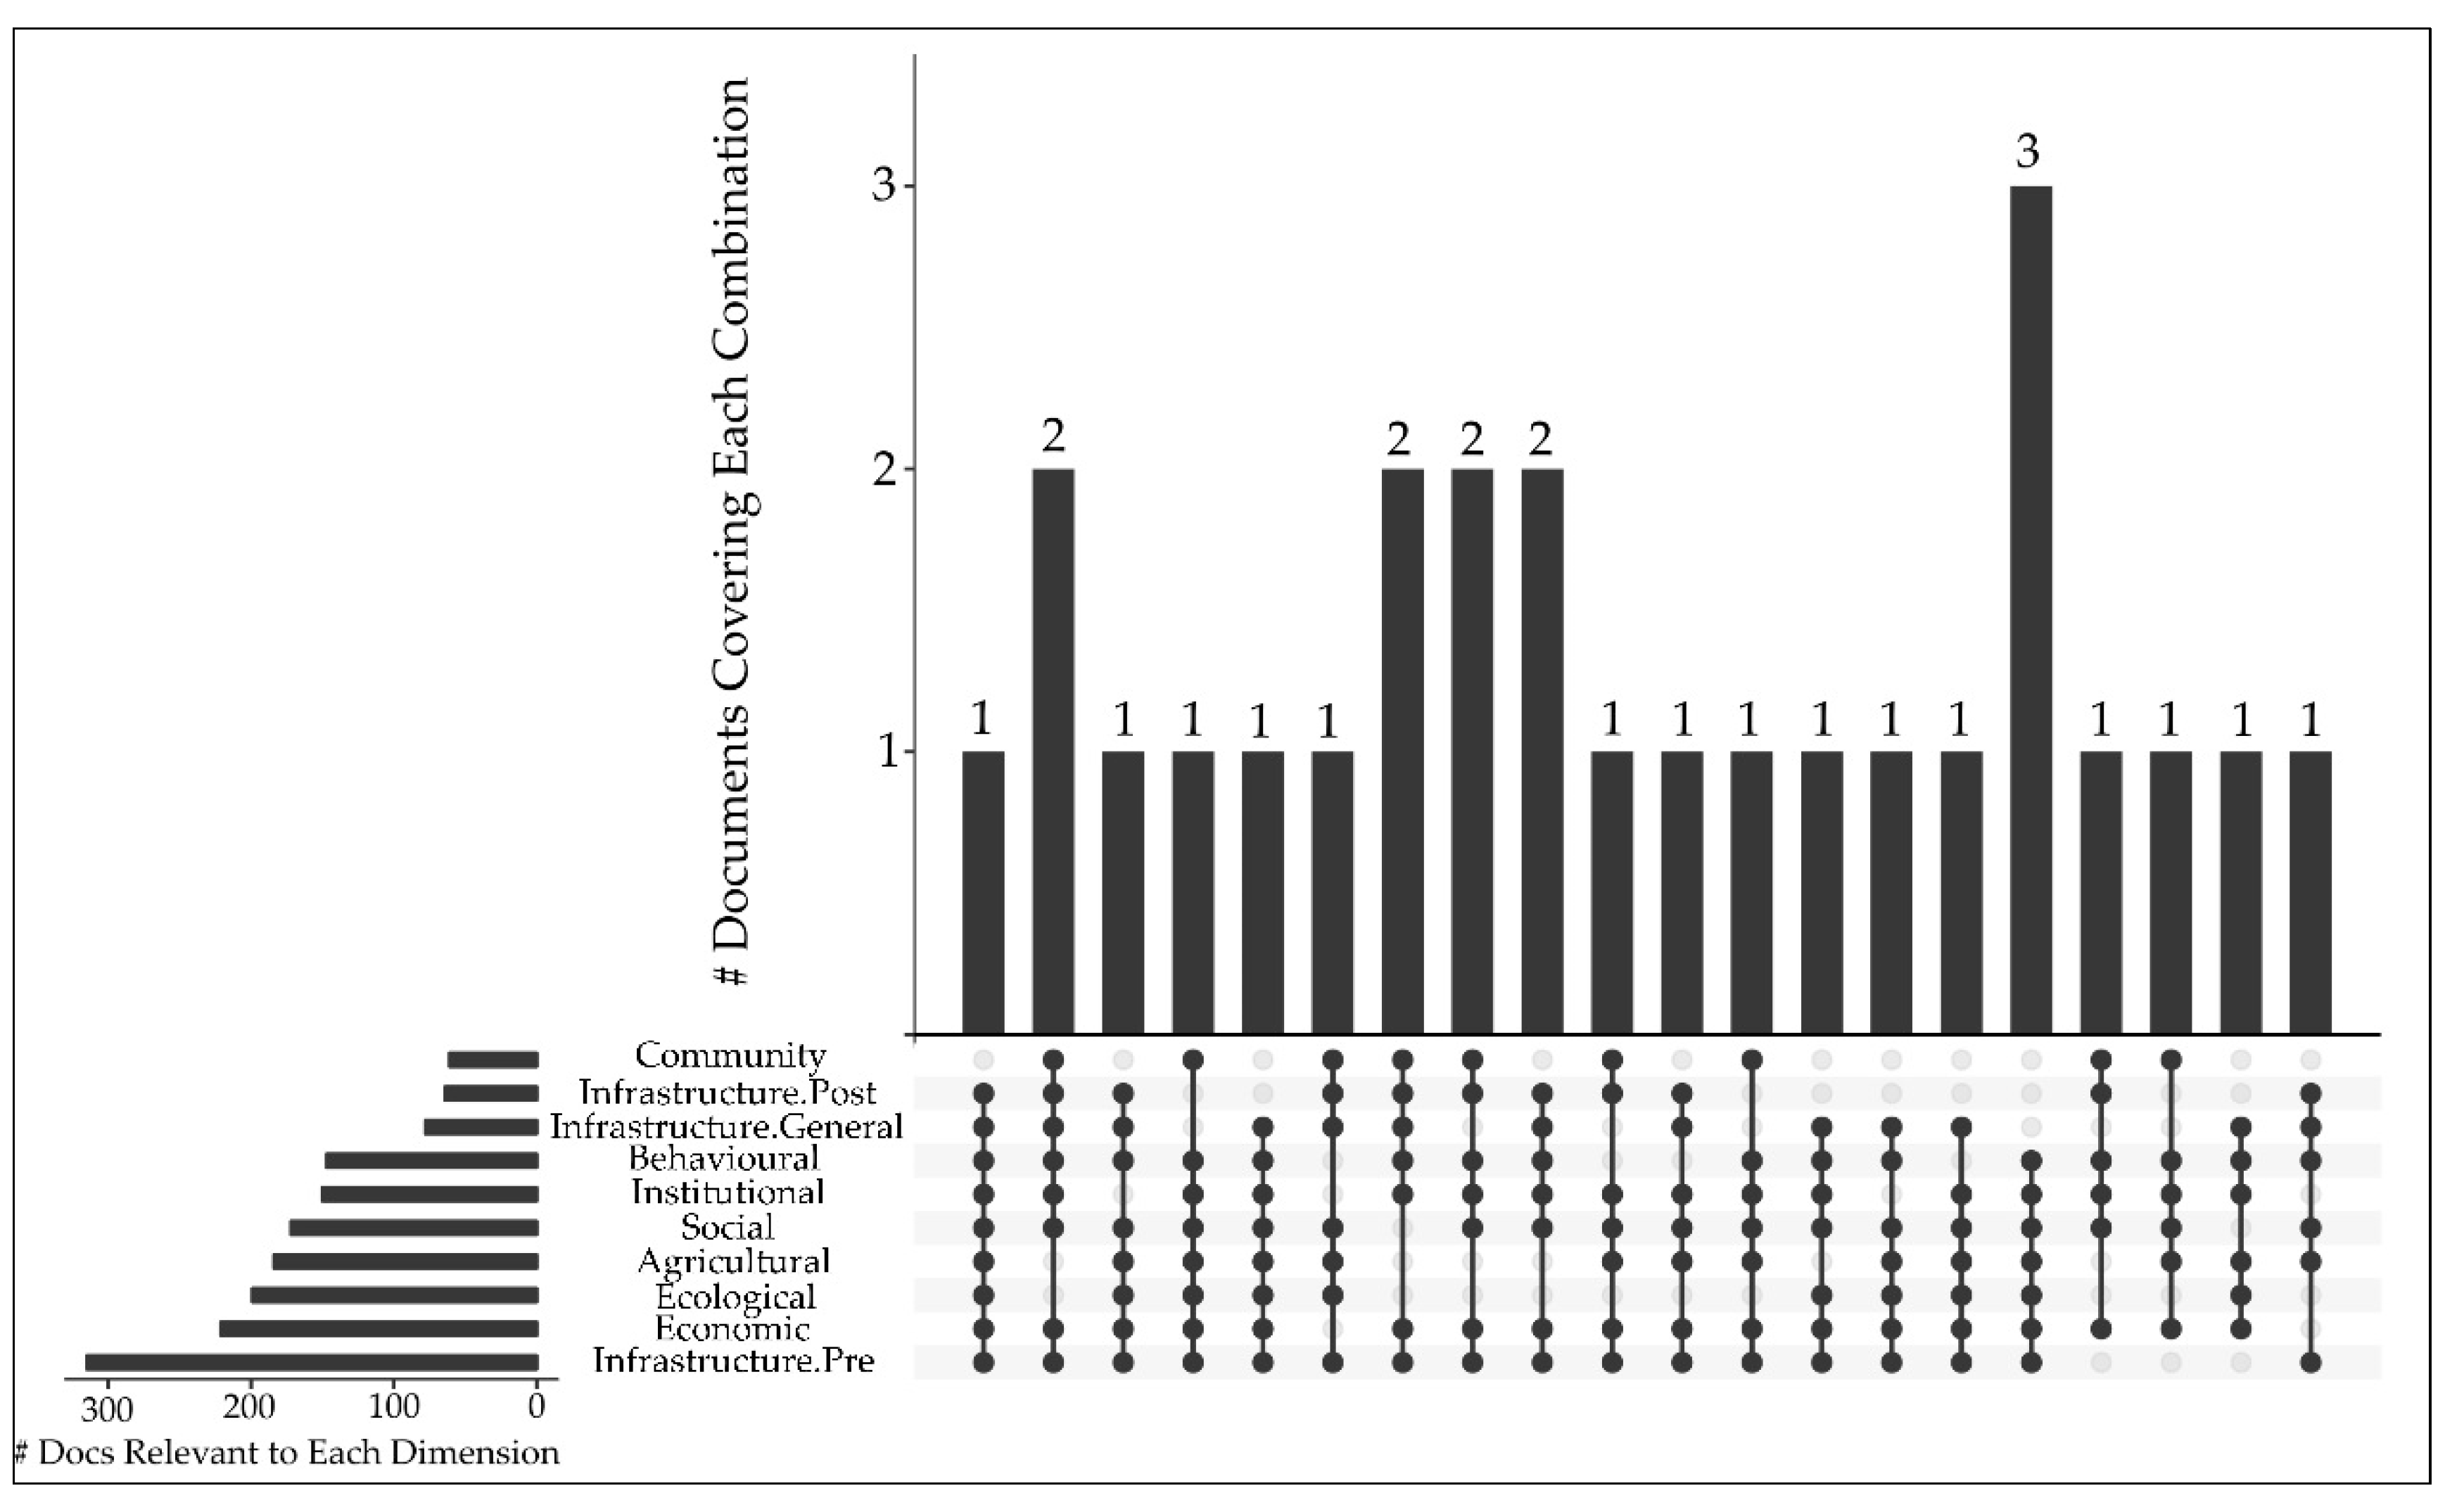
3.3.3. How Well Are Human–Nature Dimensions Actually Covered?

The horizontal bar chart in Figure 13 shows the overall occurrence of each human–nature dimension across the set of papers, which were not mutually exclusive. Infrastructure (pre-hazard) dimensions were referenced the most in 43% (315) papers. The next most referenced was economic dimensions at 30% (221) of papers, followed by ecological dimensions at 27% (199) of papers. Infrastructure (post-hazard) (9%, 64) and community (8%, 61) dimensions were the least referenced. Definitions for each dimension can be found in Table 4, and it is important to note that infrastructure (pre-hazard) dimensions cover preparatory planning aspects such as urban extent, land cover, and engineering. By contrast, infrastructure (post-hazard) dimensions cover the infrastructure considered important to hazard response, e.g., evacuation or shelter capacity.
The vertical bar chart in Figure 13 shows the mutually exclusive coverage of combinations of different human–nature dimensions. Here, each bar represents a combination or ‘bin’. In other words, where a paper covered both a community dimension and an economic dimension, this is counted in the ‘bin’ or bar above the two black dots for community and economic. The breakdown of coverage was as follows:
  • 14% (102) did not address any human–nature dimensions;
  • 30% (223) referenced just one dimension;
  • 21% (158) referenced two dimensions;
  • 16% (119) referenced three dimensions;
  • 7% (52) referenced four dimensions;
  • 5% (40) referenced five dimensions;
  • 3% (21) referenced six dimensions;
  • 2% (16) referenced seven dimensions;
  • 0.7% (5) referenced eight dimensions;
  • 0.1% (1) referenced nine dimensions;
  • 0% or none referenced all ten dimensions.
The top three bins addressed only one dimension each. These were ecological (13%, 93), infrastructure (pre-hazard) (8%, 56), and agricultural (4%, 33) aspects. Fourth-highest was the combination of ecological + infrastructure (pre-hazard) (4%, 27). Community was the only dimension absent from any combination in the top 20 most frequently covered combinations.
Figure 14 depicts the top 20 bins with the greatest coverage of human–nature dimensions. The top ‘bin’ referenced nine human–nature dimensions, and this bin represented only 0.1% (1) of papers. The community dimension was the only excluded aspect. The next three largest bins included eight dimensions and covered similarly low proportions of the knowledge base. This was broken down as follows:
  • Agricultural + behavioural + ecological + economic + infrastructure (general) + infrastructure (pre-hazard) + infrastructure (post-hazard) + social (1 or 0.1% of papers);
  • Agricultural + behavioural + community + ecological + economic + infrastructure (pre-hazard) + institutional + social (1 or 0.1% of papers);
  • Agricultural + behavioural + ecological + economic + infrastructure (general) + infrastructure (pre-hazard) + institutional + social (1 or 0.1% of papers);
  • Behavioural + community + economic + infrastructure (general) + infrastructure (pre-hazard) + infrastructure (post-hazard) + institutional + social (2 or 0.3% of papers).
Behavioural, economic, infrastructure (pre-hazard), and social dimensions were present in all of the top 5 most covered combinations. The top 20 combinations included a combined 27 papers, or 4% of the knowledge base. This indicates a wide spread of coverage and a small number of papers covering multiple dimensions.

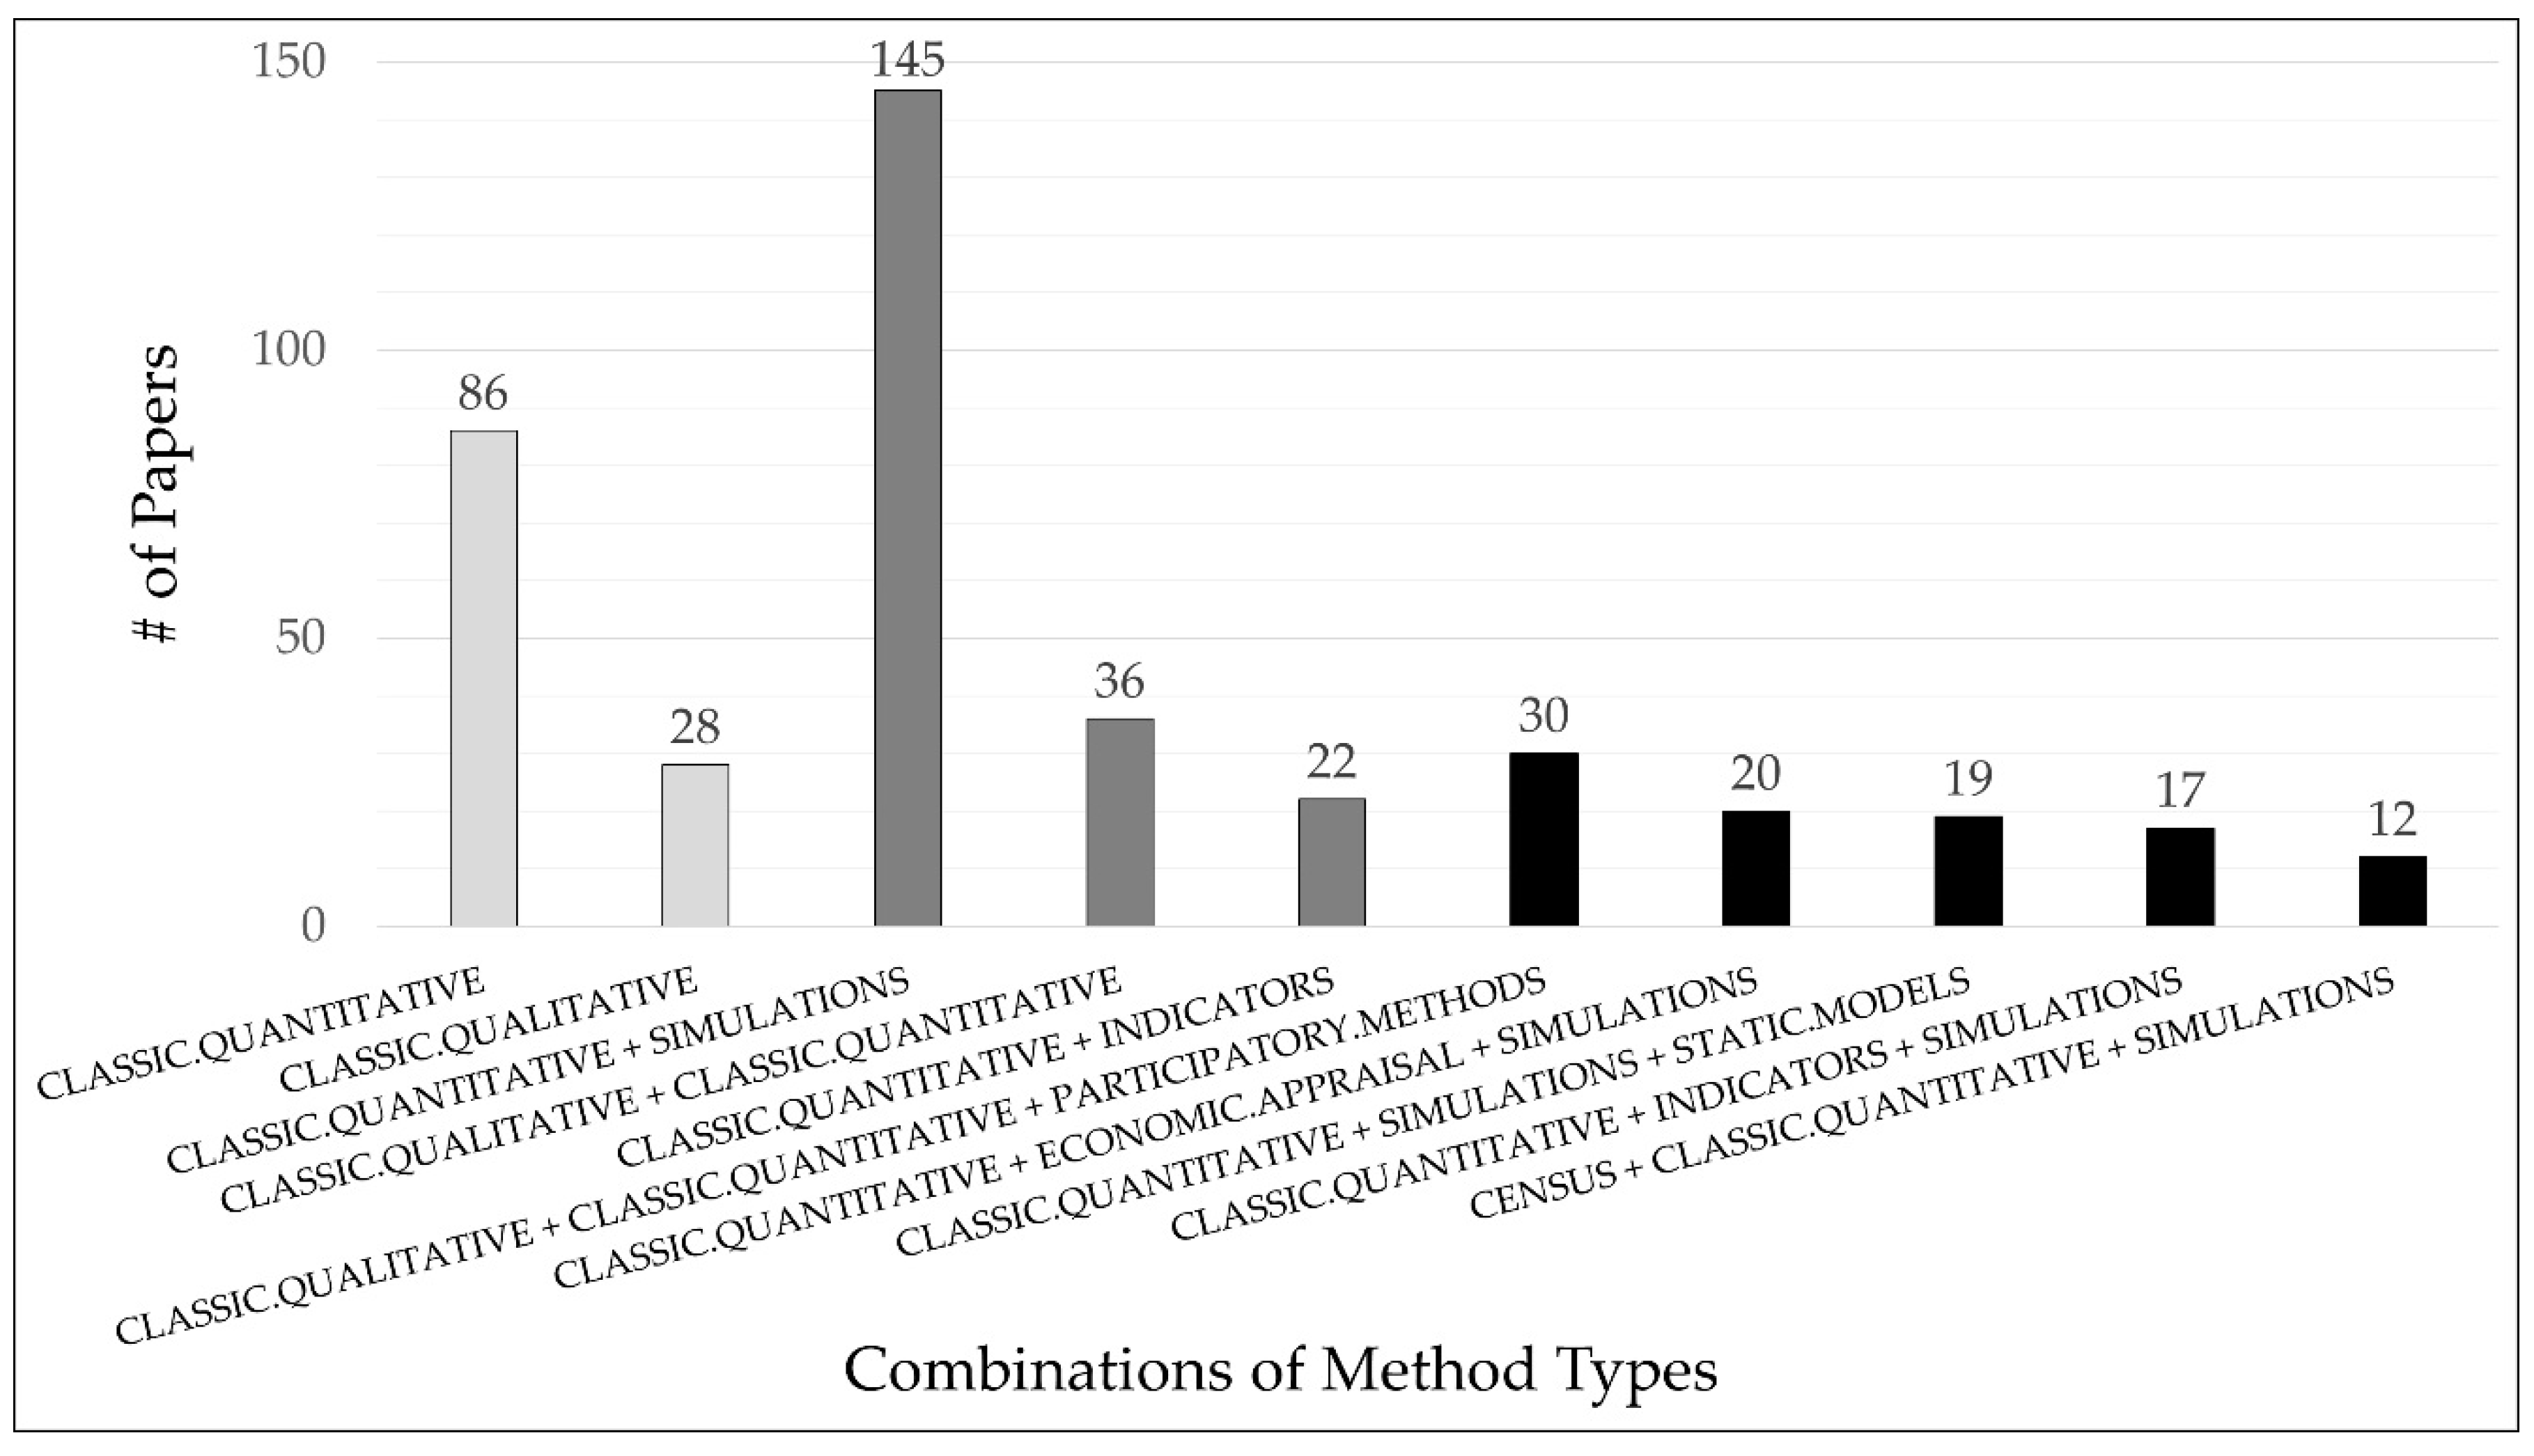
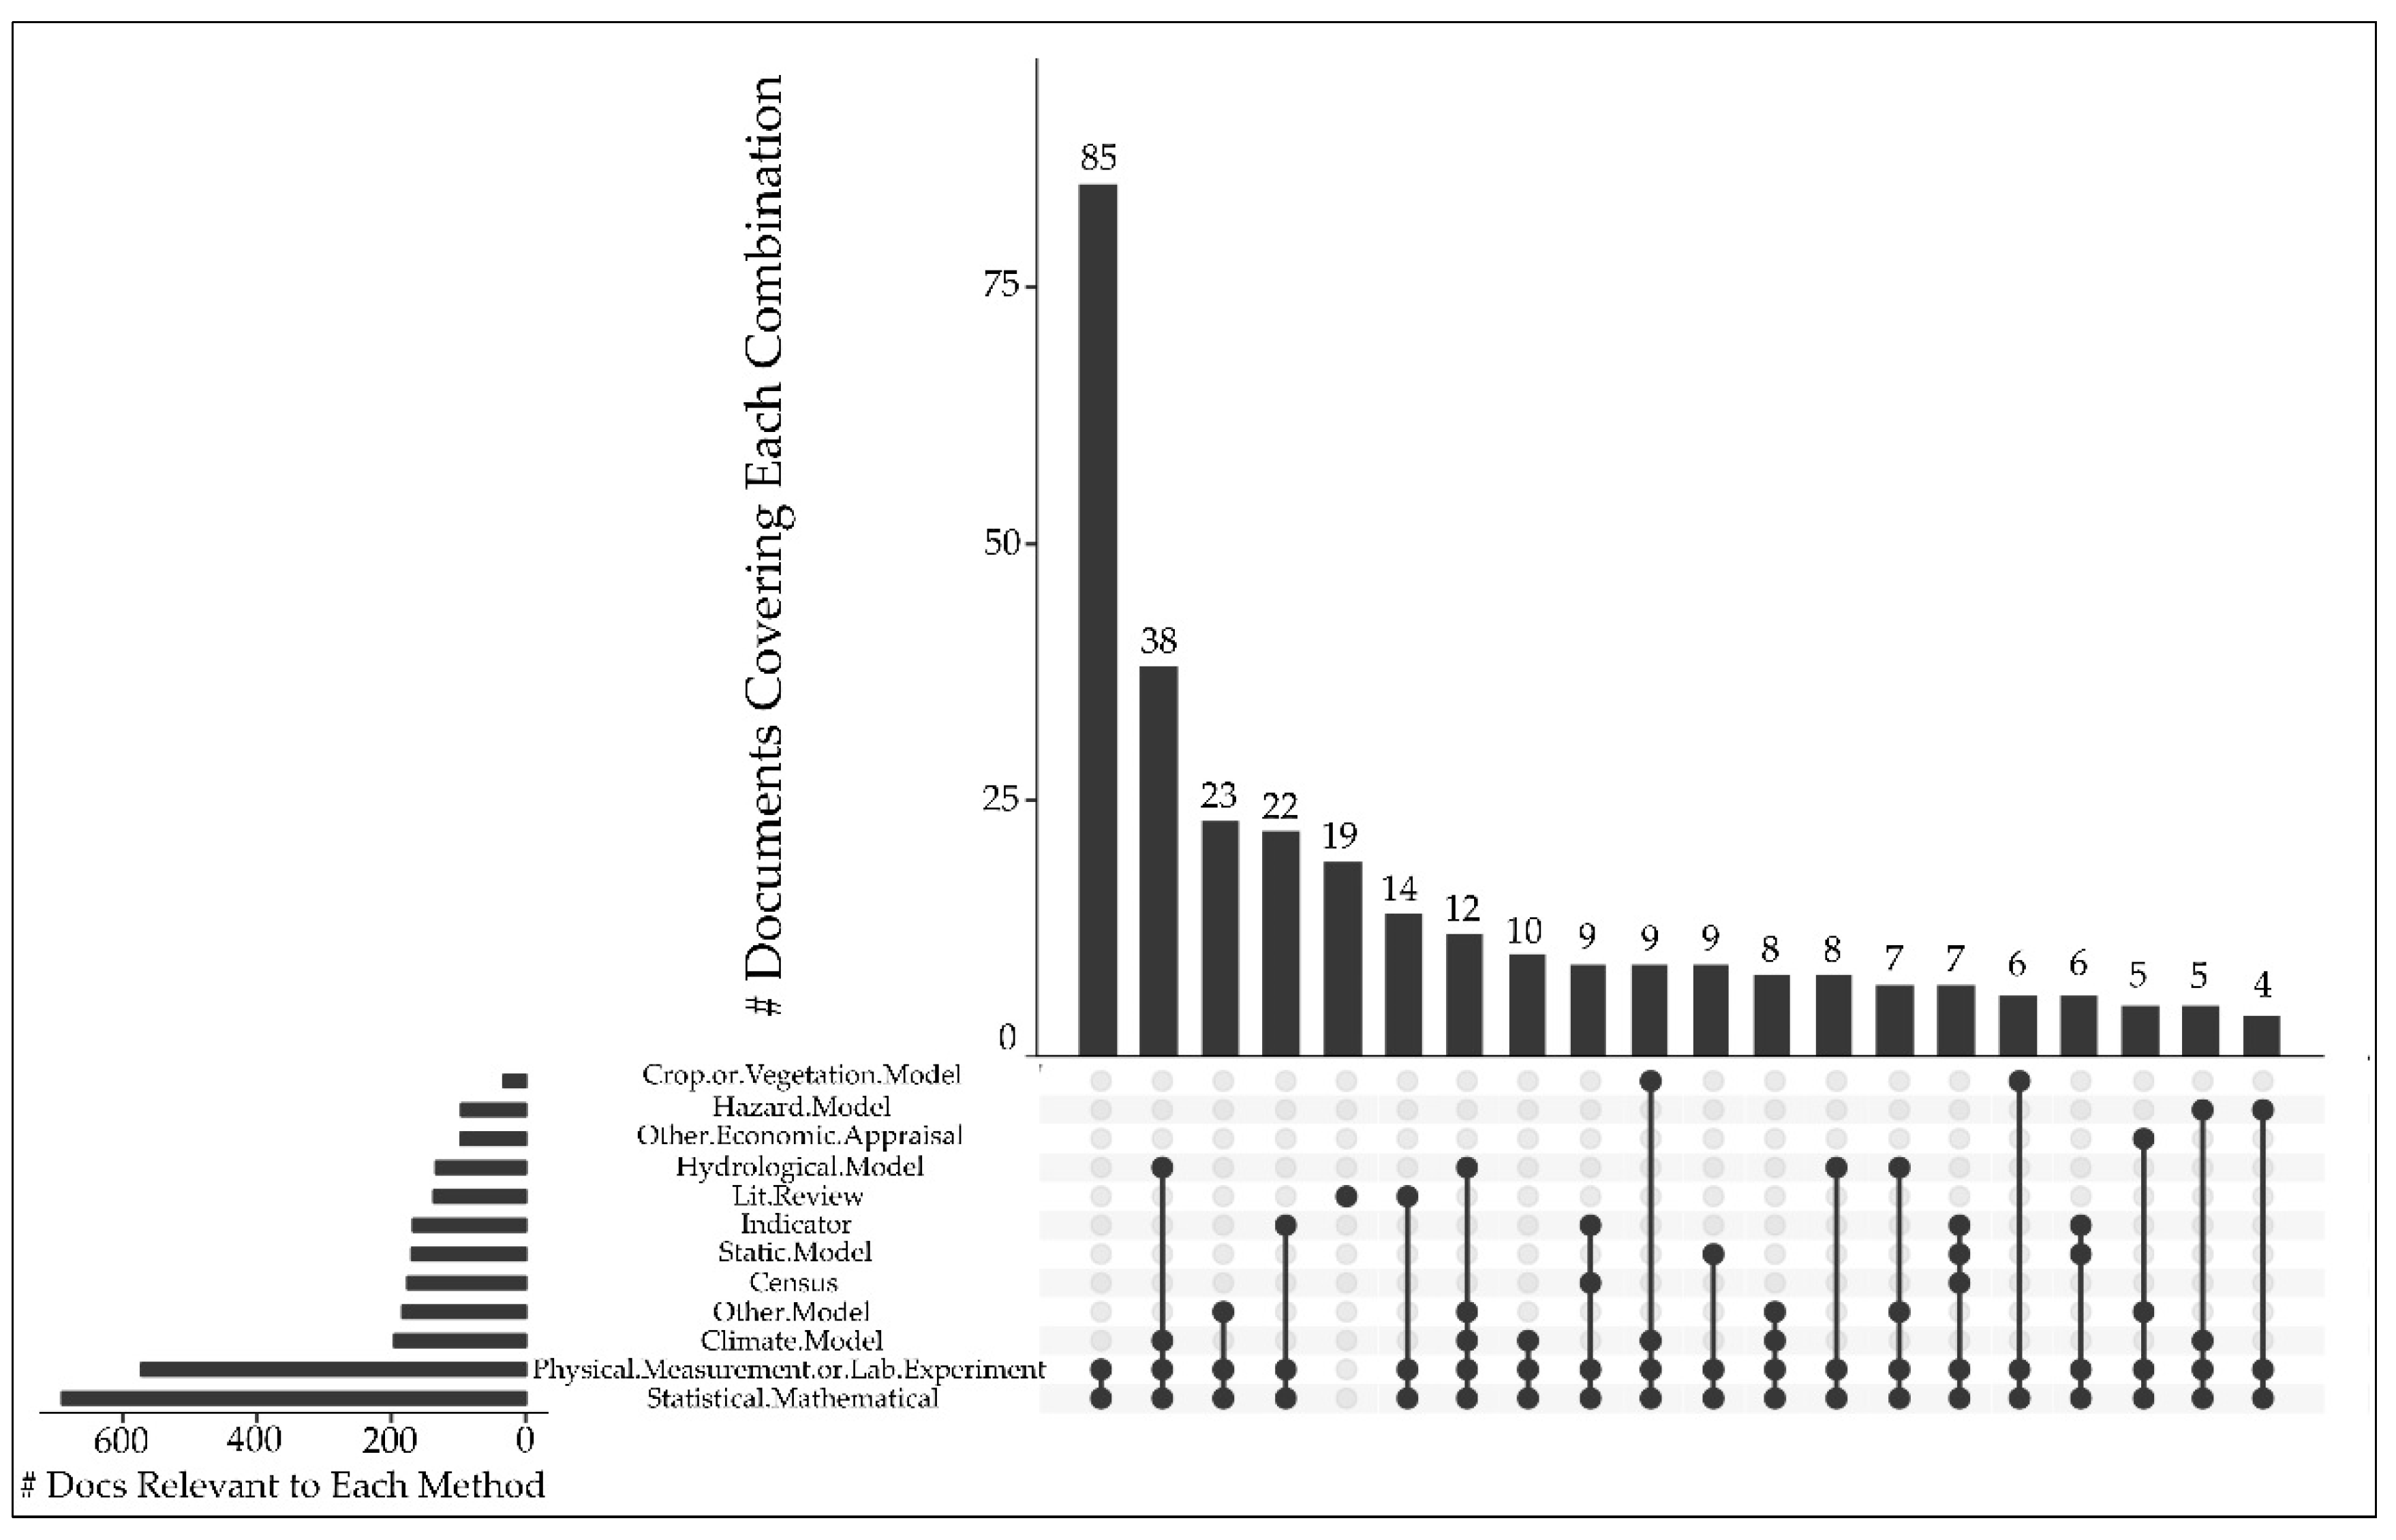
3.3.4. How Are Methods Applied to Climate Change Adaptation for Hydrohazards?

Results are first discussed in terms of overall method categories. The most frequently used method category was classic quantitative methods (including physical measurement, lab experimentation, and mathematical or statistical analysis). This was referenced 1262 times. Second-most frequent was simulations at nearly half this frequency (651 occurrences). Third-most frequent was classic qualitative methods (including methods such as surveys, interviews, and content analysis), which was referenced 454 times. The remaining method types were in roughly equal use, with census, static models, indicators, participatory methods, decision-making analyses, and economic appraisal all within a range of 121–175 occurrences.
The breakdown of coverage was as follows:
  • 16% (120) covered one method type;
  • 32% (238) covered two method types;
  • 23% (166) covered three method types;
  • 14% (102) covered four method types;
  • 10% (73) covered five method types;
  • 3% (22) covered six method types;
  • 2% (15) covered seven method types;
  • 0 or none covered eight method types;
  • 0.1% (1) covered nine method types.
Figure 15 depicts the top 10 most frequently covered combinations of method categories. Here, each bar represents a mutually exclusive combination method categories, or ‘bin’. In other words, where a paper used both a classic quantitative and a simulation method, this is counted in the ‘bin’ or bar above the label classic quantitative + simulation. The most covered combination was classic quantitative + simulations at 20% (145) of papers. The second-highest combination was classic quantitative alone, at 12% (86) of papers. The third-highest combination was classic quantitative + classic qualitative at 5% (36) of papers.
Going into more detail, 42 individual methods were applied at some point in the knowledge base. The most frequently occurring methods by a wide margin were statistical and mathematical (690 occurrences) and physical measurement or lab experiment (572 occurrences). This was followed by climate models (195), other models (183), census (175), static or conceptual models (169), and indicators (167). Not all 42 methods can be presented here; however, Figure 16 presents the top 20 most used sets of methods.
The most used combination was statistical and mathematical + physical measurement (12%, 85), followed by statistical and mathematical + physical measurement + climate model + hydrological model (5%, 38). Third-most used was the combination of statistical and mathematical + physical measurement + other model (3%, 23).

3.4. In-Depth Assessment: Associations between Variables

3.4.1. Are There Statistically Significant Patterns in How Complexity Concepts Are Studied?

Several statistical tests were applied in order to detect any significant associations between variables. Figure 17 depicts these correlations. Table 5 describes their p-values and Cramer’s V correlations. In Table 5, these are ranked in descending order of correlation strength.
Of the 70 variables outlined in Table 3 and Table 4, only 12 had significant associations. This resulted in 13 linked pairs. These pairs covered the: Type of hazard, focus of the paper on hazard or impact, six complexity concepts intended to be addressed from Table 2, specific time scale, specific spatial scale, and type of human–nature dimensions (if any). There were no significant associations to, or between, specific methods or their ‘umbrella’ method categories.

4. Discussion

This paper comprehensively and systematically assessed the available methods for climate change adaptation to hydrohazards. It also illustrated how we currently incorporate complexity concepts into this research area, in order to build a potential research agenda for the future.
Theoretical reviews are common in this area (particularly floods) [20,21,22], but application of methods is rarely addressed. Despite the fact that this review specifically looked for papers focusing on methods, just 22 existing papers (3%) attempted to compare or review methods. Often, these compared a handful of methods for a specific aim (e.g., decision-making analyses). Coupled with the fact that 173 (19%) of papers addressed none of the targeted complexity concepts, it is clear that the journey to truly ‘doing systems research’ has just begun. However, this review serves to map the current surroundings and the road ahead.
In exploring the context of the current knowledge base, it was found that floods and droughts are covered equally overall. However, floods and droughts are considered together only in about 23% of cases. As suggested in challenge 10 (Table 2) and cutting-edge climate projections [3,23,24,25], it will become increasingly important to address both ends of the hydrological spectrum in a comprehensive way. Some studies in this paper addressed highly specific issues at a low level of scale (e.g., genetic makeup of drought-resistant crops). Here, it may not always be appropriate to study both ends of the hydrological spectrum. However, this paper found 59% of the existing literature covers the regional scale. Consideration of the whole hydrological spectrum at this level is not only feasible, but also advisable. This suggests the aforementioned 23% coverage is inadequate. In other words, consideration of the entire hydrological cycle is essential, possible, and often unaddressed.
The study of general climate change hazards, including floods and droughts but also other hazards such as forest fires and hurricanes, was significantly correlated with the study of interactions and with the use of multimodel approaches. This indicates that tackling multiple hazards necessitates addressing complexity, including the capture of salient interactions and the integration of multiple forms of evidence relevant to those interactions. Inversely, approaches focusing on interactions and using multiple models have greater potential to be extended across hazard types (i.e., from application of floods to application of forest fires). Thus, a high priority for future climate change research is to develop and apply methods that are ‘hazard-agnostic’, to consider not just floods and droughts together, but any combination of multiple, interacting, or compound hazards.
At first glance, some findings give the impression that current approaches are highly inclusive of local communities and ‘end users’. Impacts are covered three times more than hazards. The broad check for complexity concepts suggests human–nature dimensions are well-covered, as they are referenced in 66% of the knowledge base. Furthermore, the in-depth assessment of spatial scales showed that research is done at the community level about 40% of the time.
However, do the full results bear this out? Spatial scale refers to the level at which data are collected, rather than a type of outcome. Thus, researchers may be working with communities to collect physical data, or working at the community-level of scale, but are frequently missing the explicit exploration of what climate change means for that community. In fact, the human–nature dimensions of community and infrastructure (post-hazard) were addressed the least (occurring in 8% and 9% of papers, respectively). These dimensions cover aspects of climate change such as place attachment, social connectivity, transport infrastructure, and emergency shelter capacity, all of which will be key to planning for future hydrohazards. The low level of coverage for these dimensions—in contrast to infrastructure (pre-hazard) (43%) or ecological (27%) dimensions, which address aspects such as vegetation, land use, and the engineering of flood defences—reveals that we are not yet deeply studying the human side of climate change.
This is also reflected in the existing patterns observed for the most frequently applied methods. Results showed that using multiple method types in a single approach is common. One third of papers used four or more method types. However, results also showed that ‘bottom–up’ physical data (e.g., rainfall measurement) are often used or integrated mainly with ‘top–down’ social data (e.g., census datasets, indicators). Although some participatory methods are used in tandem with classic qualitative and classic quantitative methods, this often means a participatory method (e.g., focus group) has been used in addition to a qualitative data collection survey and corresponding statistical analysis. Thus, multimethod approaches are used, and often quantitative methods are developed with ‘softer’ decision-making tools. These approaches continue to be extremely data- and time-intensive, requiring multiple sophisticated models. What is missing—and what could arguably alleviate the data-hunger of higher-level policy- and decision-making analyses—is the ‘end user’ and their insights into local context. On this basis, a future research priority is the fuller integration of ‘bottom–up’ social methods (e.g., participatory) with higher level policy and practice processes, to inform more effective and equitable outcomes.
The focus on medium-term time scale impacts, without strong connections to the study of short-term time scale hazard or impacts, highlights a gap in current practice. This focus on the medium-term is not unexpected because the impacts of a hazard can take more than hours, days, or weeks to be fully realised, for example, impacts of a hazard on a city’s wider healthcare system. However, without a robust understanding of how short-term dynamics lead to medium- or long-term effects (e.g., stressors) being realised, it will be difficult to create effective interventions and transformative adaptation. Indeed, the medium-term time scale is significantly correlated to the study of ecological, economic, and social impacts. The latter two of these are currently studied in a primarily top–down fashion (e.g., using census data) which could be a barrier to the unpicking of system dynamics and interactions. In addition, interactions are the least addressed of all six complexity concepts covered in this review, despite the wider complexity literature pointing to these as an underlying source of emergence. A challenge in this area is that attempts to study interactions at multiple timescales is an inherently data-intensive exercise, so it is no surprise that the strongest association between any two variables was the link between intention to study interactions and a short-term time scale. As such, a future research priority is to increase and further develop the study of interactions, particularly linking the short- to medium-term timescales, and ideally in a way that minimises data requirements.
It appears that a ‘silver bullet’ solution to complexity does not exist. No existing approach has the ability to cover all six complexity concepts. Few significant associations were found between the studied variables. No significant patterns were found between methods applied to different hazards, impacts, time scales, spatial scales, or human–nature dimensions.
We do not argue that a single solution should be sought, or that approaches which ‘check the most boxes’ will always effect optimal outcomes. Indeed, Verburg et al. [11] (p. 328) warn against “the convergence towards single models that are able to answer a wide range of questions, but without sufficient specificity”, and our findings show that some approaches (e.g., multicriteria decision-making) can skirt this line. However, this assessment of existing patterns in the knowledge base sheds much-needed light on how little is being done to address complexity. Indeed, it could be argued that impacts are covered more frequently in the literature because in dealing with a greater reach of natural and human aspects, we are dealing with fewer deterministic rules and greater complexity. This would explain a higher quantity of investigation to determine which methods are effective for which complexity problems, through trial and error. Understanding if and how our traditional ways of working are limited and exploring how they can be stretched or combined is a necessity. For effective climate change adaptation, full coverage of complexity is not possible—but greater acknowledgment of complexity is critical.
In the future, as we move forward in climate adaptation for hydrohazards, and indeed in the study of all complex human–nature systems, we need a consistent framework to build and navigate a shared conceptualisation of complexity. This provides a way to map what is being covered, and what may be neglected. It also aids in understanding the possibilities and constraints around how we can develop and integrate novel approaches. The above complexity concepts may be used as framing reference points, to build a shared understanding of real-world complexity and guide the selection and critique of our approaches. This methods review was applied exclusively to research addressing hydrohazards (floods and droughts) but can be replicated for other hazards. Applying this review structure to forest fires, for example, would test the strength of such a framework.
This assessment provides some tractable next steps. A comprehensive reference list of existing methods for climate change adaptation to hydrohazards has been presented in Table 4. Appendix A, Table A1 presents a condensed timeline of ‘best practice’ examples of their past use. Table 6 summarises the current state of play (existing patterns) and provides recommendations to bridge existing gaps (future needs).
Ultimately, this review underscores the need to be bolder in exploring new frontiers and drawing from other methodologies, such as human factors, participatory action research, and any other fields which emphasise cost-effective data collection to capture context, human behaviour, and interactions.

5. Conclusions

It is not novel to say that methods are needed which acknowledge the role of uncertainty, multiple spatial and time scales, multiple forms of evidence, human dimensions of systems, or interactions. What this work does contribute, in the form of a systematic assessment, is a rigorous evaluation of if and how well these six complexity challenges are met. From the results, it is clear that in climate change adaptation to hydrohazards, there is a substantial lack of complexity-smart approaches. Of a total 910 papers, no single study addressed all six of these complexity concepts. A lack of consistency was also in evidence, even in cases where one or two complexity concepts were addressed.
The findings of this paper provide a clarification of exactly which areas are most in need of development to improve the study of complex human–nature systems. Though it is not always feasible or desirable to cover all six complexity concepts in any single design and each method has a unique fit to the system, it is clear that complex climate change challenges are quickly outgrowing our ‘classic’ approaches. Moving forward, complexity concepts can be better incorporated to further build the knowledge base in sustainability transitions. Specifically, future applications of research methods in this area should first aim to cover some type of interaction; to minimise use of data-hungry approaches; and to incorporate deeper levels of context-specific insights. Looking to new horizons and fresh disciplines, climate change adaptation research can take tractable steps to meet the modern challenges of complex, human–nature systems.

Author Contributions

Conceptualisation, M.B., L.B., and L.C.; methodology, M.B., L.B., L.C., and A.V.; formal analysis, M.B. and A.V.; investigation, M.B.; writing—original draft preparation, M.B.; writing—review and editing, M.B., L.B., L.C., and A.V.; visualisation, M.B. and A.V.; supervision, L.B.

Funding

This research was funded by the Water Resilient Cities project, granted by the EPSRC (EP/N030419).

Conflicts of Interest

The authors declare no conflict of interest.

Appendix A

In the main text, this review mapped current practice and proposed methodological recommendations. Table A1 below supports these findings by illustrating a timeline of exemplary past research, which meets various complexity challenges.
Table A1. Timeline of key past literature exemplary of complexity-smart research.
YearAddressed 5+
Complexity Concepts in Broad Check
Addressed 8+
Spatiotemporal Scales
Addressed 7+
Human–Nature Dimensions
Spanned across 7+
Method Types
2018Liu, et al., 2018†,Ψ [26]Aslam, et al., 2018 [27]Shah, et al., 2018 [28]
Cabal & Erlich, 2018 [29]
Ling & Chiang, 2018 Ψ [30]
Jayanimita, et al., 2018 [31]
2017Honti, et al., 2017 Ψ [32]
Stigter, et al., 2017 †,Ψ [33]
Toimil, et al., 2017 [34]
Gahi, et al., 2017 [35]
Toimil, et al, 2017 [34]Espada, et al., 2017 [40]
Kumasi, et al., 2017 [36]
Parry, et al., 2017 [37]
Rizzi, et al., 2017 [38]
Kaspersen & Halsnaes, 2017 [39]
2016 Schaphoff, et al., 2016 Ψ [41]Sample, et al., 2016 [42]Kingsborough, et al., 2016 Ψ [47]
van Ruiten, et al., 2016 [48]
Weis, et al., 2016 [49]
Herslund, et al., 2016 [43]
Bailey & Buck, 2016 [44]
Hasse & Weingaertner, 2016 [45]
Kim, et al., 2016 Ψ [46]
2015Dunford, et al., 2015†,Ψ [50]Van der Knaap, et al., 2015†,Ψ [54]
Gombault, et al., 2015 [55]
Antwi, et al., 2015 [56]
Lee, et al., 2015 Ψ [57]
Spyridi, et al., 2015 [58]
Kane, et al., 2015 [59]
Lee, et al., 2015 Ψ [57]
Espada, et al., 2015 Ψ [51]
Syed, et al., 2015 Ψ [52]
Yazdanfar & Sharma, 2015 [53]
2014Pulido-Velazquez, et al., 2014†,Ψ [60]
Ulrich & Rauch, 2014 †,Ψ [61]
Ronchail, et al., 2014 [62]Krellenberg, et al., 2014 [66]
Haasnoot, et al., 2014 Ψ [67]
Krellenberg, et al., 2014 [66]
Ronco, et al., 2014 [63]
Giupponi, 2014 Ψ [64]
Ronco, et al., 2014 [63]
Giupponi, 2014Ψ [64]
Van Bodegom, et al., 2014 Ψ [65]
2013 Zischg, et al., 2013 [68]
Lung, et al., 2013 [69]
Parker & Wilby, 2013 [70]
Liu, et al., 2013 [71]
2012Chang, et al., 2012 Ψ [72]
Georgakakos, et al., 2012 [73]
Verburg, et al., 2012 [74]Malik, et al., 2012 [75]
Chaliha, et al., 2012 [76]
Rijcken, et al., 2012†,Ψ [77]
2011Haasnoot, et al., 2011†,Ψ [78] Ceccato, et al., 2011 Ψ [79]
Verma & Negandhi, 2011 [80]
Sokolewicz, et al., 2011 [81]
2010 Williams, et al., 2010 [82]Stakhiva & Stewart, 2010 Ψ [83]Lempert & Groves, 2010 [84]
2009Angus, et al., 2009†,Ψ [85]Angus, et al., 2009†,Ψ [85]
2008 Dewals, et al., 2008Ψ [86]
Kazama, et al., 2008 [87]
Dewals, et al., 2008Ψ [86]
2004 Hooijer, et al., 2004 [88]
Ψ = paper also covers interactions as per broad check for complexity concepts; = paper also covers uncertainty as per in-depth assessment; bold = covers both interactions and uncertainty; italics = present in more than one column of the timeline.

References

  1. Griggs, G.B.; Paris, L. Flood control failure: San Lorenzo River, California. Environ. Manag. 1982, 6, 407–419. [Google Scholar] [CrossRef]
  2. BBC. Thirty-Year Flooding Saga in Dumfries Flows Onwards. Available online: https://www.bbc.co.uk/news/uk-scotland-south-scotland-40431565 (accessed on 25 May 2018).
  3. Collet, L.; Harrigan, S.; Prudhomme, C.; Formetta, G.; Beevers, L. Future hot-spots for hydro-hazards in Great Britain: A probabilistic assessment. Hydrol. Earth Syst. Sci. 2018, 22, 5387–5401. [Google Scholar] [CrossRef]
  4. BBC. Flooding Boss Urges Debate on Abandoning at-Risk Homes. Available online: http://www.bbc.co.uk/news/uk-politics-43476335 (accessed on 25 May 2018).
  5. Righi, A.W.; Saurin, T.A.; Wachs, P. A systematic literature review of resilience engineering: Research areas and a research agenda proposal. Reliab. Eng. Syst. Saf. 2015, 141, 142–152. [Google Scholar] [CrossRef]
  6. Cutter, S.L. Compound, Cascading, or Complex Disasters: What’s in a Name? Environ. Sci. Policy Sustain. Dev. 2018, 60, 16–25. [Google Scholar] [CrossRef]
  7. Palsson, G.; Szerszynski, B.; Sorlin, S.; Marks, J.; Avril, B.; Crumley, C.; Hackmann, H.; Holm, P.; Ingram, J.; Kirman, A.; et al. Reconceptualizing the ‘Anthropos’ in the Anthropocene: Integrating the social sciences and humanities in global environmental change research. Environ. Sci. Policy 2013, 28, 3–13. [Google Scholar] [CrossRef]
  8. Liu, J.; Dietz, T.; Carpenter, S.R.; Alberti, M.; Folke, C.; Moran, E.; Pell, A.N.; Deadman, P.; Kratz, T.; Lubchenco, J.; et al. Complexity of Coupled Human and Natural Systems. Science 2007, 317, 1513–1516. [Google Scholar] [CrossRef] [PubMed] [Green Version]
  9. Brondizio, E.S.; O’Brien, K.; Bai, X.; Biermann, F.; Steffen, W.; Berkhout, F.; Cudennec, C.; Lemos, M.C.; Wolfe, A.; Palma-Oliveira, J.; et al. Re-conceptualizing the Anthropocene: A call for collaboration. Glob. Environ. Chang. 2016, 39, 318–327. [Google Scholar] [CrossRef] [Green Version]
  10. Bai, X.; van der Leeuw, S.; O’Brien, K.; Berkhout, F.; Biermann, F.; Brondzio, E.S.; Cudennec, C.; Dearing, J.; Duraiappah, A.; Glaser, M.; et al. Plausible and desirable futures in the Anthropocene: A new research agenda. Glob. Environ. Chang. 2016, 39, 351–362. [Google Scholar] [CrossRef] [Green Version]
  11. Verburg, P.H.; Dearing, J.A.; Dyke, J.G.; van der Leeuw, S.; Seitzinger, S.; Steffen, W.; Syvitski, J. Methods and approaches to modelling the Anthropocene. Glob. Environ. Chang. 2016, 39, 328–340. [Google Scholar] [CrossRef] [Green Version]
  12. Kotzee, I.; Reyers, B. Piloting a social-ecological index for measuring flood resilience: A composite index approach. Ecol. Indic. 2016, 60, 45–53. [Google Scholar] [CrossRef]
  13. Qasim, S.; Qasim, M.; Shrestha, R.P.; Khan, A.N.; Tun, K.; Ashraf, M. Community resilience to flood hazards in the Khyber Pukthunkhwa province of Pakistan. Int. J. Disaster Risk Reduct. 2016, 18, 100–106. [Google Scholar] [CrossRef]
  14. Singh-Peterson, L.; Salmon, P.; Goode, N.; Gallina, J. Translation and evaluation of the Baseline Resilience Indicators for Communities on the Sunshine Coast, Queensland Australia. Int. J. Disaster Risk Reduct. 2014, 10, 116–126. [Google Scholar] [CrossRef]
  15. Cutter, S.; Burton, C.; Emrich, C. Disaster resilience indicators for benchmarking baseline conditions. J. Homel. Secur. Emerg. Manag. 2010, 60, 16–25. [Google Scholar] [CrossRef]
  16. R Core Team. R: A Language and Environment for Statistical Computing; R Foundation for Statistical Computing: Vienna, Austria, 2018. [Google Scholar]
  17. Lex, A.; Gehlenborg, N.; Strobelt, H.; Vuillemot, R.; Pfister, H. UpSet: Visualization of Intersecting Sets. IEEE Trans. Vis. Comput. Gr. 2014, 20, 1983–1992. [Google Scholar] [CrossRef] [PubMed] [Green Version]
  18. Koziol, N.; Bilder, C. MRCV: A package for analysing categorical variables with multiple response options. R J. 2014, 6, 144–150. [Google Scholar] [CrossRef]
  19. Cramer, H. Chapter 21: The two-dimensional case. In Mathematical Methods of Statistics; Princeton University Press: Princeton, NJ, USA, 1946. [Google Scholar]
  20. Escarameia, M. Improving Urban Resilience to Flooding: A Vital Role for Civil Engineers. Proc. Inst. Civ. Eng. Civ. Eng. 2016, 169, 101. [Google Scholar] [CrossRef]
  21. Morrison, A.; Westbrook, C.J.; Nob, C.F. A review of the flood risk management governance and resilience literature. J. Flood Risk Manag. 2017, 11, 291–304. [Google Scholar] [CrossRef]
  22. McClymont, K.; Morrison, D.; Beevers, L.; Carmen, E. Flood Resilience: A systematic review. J. Environ. Plan. Manag. 2019. in review. [Google Scholar]
  23. Burt, T.P.; Howden, N.J.K.; Worral, F. The changing water cycle: Hydroclimatic extremes in the British Isles. Wires Water 2016, 3, 854–870. [Google Scholar] [CrossRef]
  24. Quesada-Montano, B.; Baldassarre, G.D.; Rangecroft, S.; Van Loon, A.F. Hydrological change: Towards consistent approach to assess changes on both floods and droughts. Adv. Water Resour. 2018, 111, 31–35. [Google Scholar] [CrossRef]
  25. Visser, A.; Beevers, L.; Collet, L.; Formetta, G.; Smith, K.; Wanders, N.; Thober, S.; Pan, M.; Kumar, R. Spatio-temporal analysis of compound hydro-hazard extremes across the UK. Adv. Water Resour. in review.
  26. Liu, D.; Guo, S.; Shao, Q.; Liu, P.; Xiong, L.; Wang, L.; Hong, X.; Xu, Y.; Wang, Z. Assessing the effects of adaptation measures on optimal water resources allocation under varied water availability conditions. J. Hydrol. 2018, 556, 759–774. [Google Scholar] [CrossRef]
  27. Aslam, R.A.; Shrestha, S.; Pandey, V.P. Groundwater vulnerability to climate change: A review of the assessment methodology. Sci. Total Environ. 2018, 612, 853–875. [Google Scholar] [CrossRef] [PubMed]
  28. Shah, A.A.; Ye, J.; Abid, M.; Khan, J.; Amir, S.M. Flood hazards—Household vulnerability and resilience in disaster-prone districts of Khyber Pakhtunkhwa province, Pakistan. Nat. Hazards 2018, 93, 147–165. [Google Scholar] [CrossRef]
  29. Cabal, A.; Erlich, M. Flood risk management approaches and tools for mitigation strategies of coastal submersions and preparedness of crisis management in France. Int. J. River Basin Manag. 2018, 16, 353–369. [Google Scholar] [CrossRef]
  30. Ling, T.Y.; Chiang, Y.C. Strengthening the resilience of urban retailers towards flood risks—A case study in the riverbank region of Kaohsiung City. Int. J. Disaster Risk Reduct. 2018, 27, 541–555. [Google Scholar] [CrossRef]
  31. Jayanimita, M.E.; Puspasari, D.A.; Widyahantari, R.; Kristina, D.; Ratnaningtyas, T.; Setionurjaya, A.; Anindita, Y.A. Beyond vulnerability assessment: Impacts of developments toward local adaptive capacity in the Kemijen City Village, Semarang City. IOP Conf. Ser. Earth Environ. Sci. 2018, 123, 1–13. [Google Scholar] [CrossRef]
  32. Honti, M.; Schuwirth, N.; Rieckermann, J.; Stamm, C. Can integrative catchment management mitigate future water quality issues caused by climate change and socio-economic development? Hydrol. Earth Syst. Sci. 2017, 21, 1593–1609. [Google Scholar] [CrossRef]
  33. Stigter, T.Y.; Varanda, M.; Bento, S.; Nunes, J.P.; Hugman, R. Combined assessment of climate change and socio-economic development as drivers of freshwater availability in the south of Portugal. Water Resour. Manag. 2017, 31, 609–628. [Google Scholar] [CrossRef]
  34. Toimil, A.; Losada, I.J.; Diaz-Simal, P.; Izaguirre, C.; Camus, P. Multi-sectoral, high-resolution assessment of climate change consequences of coastal flooding. Clim. Chang. 2017, 145, 431–444. [Google Scholar] [CrossRef]
  35. Gahi, N.Z.; Dongo, K.; Koudou, A.; Badolo, M. Innovative approach to build a “no regret” framework for reinforcing agricultural water resilience under climate risks and change in Burkina Faso. Int. J. Clim. Chang. Strateg. Manag. 2017, 9, 68–86. [Google Scholar] [CrossRef]
  36. Kumasi, T.C.; Antwi-Agyei, P.; Obiri-Danso, K. Small-holder farmers’ climate change adaptation practices in the Upper East Region of Ghana. Environ. Dev. Sustain. 2017, 1–18. [Google Scholar] [CrossRef]
  37. Parry, L.; Davies, G.; Almeida, O.; Frausin, G.; de Moraes, A.; Rivero, S.; Filizola, N.; Torres, P. Social vulnerability to climatic shocks is shaped by urban accessibility. Ann. Am. Assoc. Geogr. 2017, 108, 125–143. [Google Scholar] [CrossRef]
  38. Rizzi, J.; Torresan, S.; Zabeo, A.; Critto, A.; Tosono, A.; Tomasin, A.; Marcomini, A. Assessing storm surge risk under future sea-level rise scenarios: A case study in the North Adriatic coast. J. Coast. Conserv. 2017, 21, 453–471. [Google Scholar] [CrossRef]
  39. Kaspersen, P.S.; Halsnaes, K. Integrated climate change risk assessment: A practical application for urban flooding during extreme precipitation. Clim. Serv. 2017, 6, 55–64. [Google Scholar] [CrossRef] [Green Version]
  40. Espada, R.J.; Apan, A.; McDougall, K. Vulnerability assessment of urban community and critical infrastructures for integrated flood risk management and climate adaptation strategies. Int. J. Disaster Resil. Built Environ. 2017, 8, 375–411. [Google Scholar] [CrossRef]
  41. Schaphoff, S.; Reyer, C.P.O.; Schepaschenko, D.; Gerten, D.; Shvidenko, A. Tamm Review: Observed and projected climate change impacts on Russia’s forests and its carbon balance. For. Ecol. Manag. 2016, 361, 432–444. [Google Scholar] [CrossRef] [Green Version]
  42. Sample, J.E.; Baber, I.; Badger, R. A spatially distributed risk screening tool to assess climate and land use change impacts on water-related ecosystem services. Environ. Model. Softw. 2016, 83, 12–26. [Google Scholar] [CrossRef]
  43. Herslund, L.B.; Jalayer, F.; Jean-Baptiste, N.; Jorgensen, G.; Kabisch, S.; Kombe, W.; Lindley, S.; Nyed, P.K.; Pauleit, S.; Printz, A.; et al. A multi-dimensional assessment of urban vulnerability to climate change in Sub-Saharan Africa. Nat. Hazards 2016, 82, 149–172. [Google Scholar] [CrossRef]
  44. Bailey, I.; Buck, L.E. Managing for resilience: A landscape framework for food and livelihood security and ecosystem services. Food Secur. 2016, 8, 477–490. [Google Scholar] [CrossRef]
  45. Hasse, J.U.; Weingaertner, D.E. From vision to action: Roadmapping as a strategic method and tool to implement climate change adaptation—The example of the roadmap ‘water sensitive urban design 2020’. Water Sci. Technol. 2016, 73, 2251–2259. [Google Scholar] [CrossRef] [PubMed]
  46. Kim, H.G.; Lee, D.K.; Jung, H.; Kil, S.H.; Park, J.H.; Park, C.; Tanaka, R.; Seo, C.; Kim, H.; Kong, W.; et al. Finding key vulnerable areas by a climate change vulnerability assessment. Nat. Hazards 2016, 81, 1683–1732. [Google Scholar] [CrossRef] [Green Version]
  47. Kingsborough, A.; Borgomeo, E.; Hall, J.W. Adaptation pathways in practice: Mapping options and trade-offs for London’s water resources. Sustain. Cities Soc. 2016, 27, 386–397. [Google Scholar] [CrossRef]
  48. van Ruiten, K.; Bles, T.; Kiel, J. EU-INTACT case studies: Impact of extreme weather on critical infrastructure. In Proceedings of the FLOODrisk 2016—3rd European Conference on Flood Risk Management, Lyon, France, 17–21 October 2016. [Google Scholar]
  49. Weis, S.W.M.; Agostini, V.N.; Roth, L.M.; Schill, S.R.; Knowles, J.E.; Blyther, R. Assessing vulnerability: An integrated approach for mapping adaptive capacity, sensitivity, and exposure. Clim. Chang. 2016, 136, 615–629. [Google Scholar] [CrossRef]
  50. Dunford, R.; Harrison, P.A.; Rounsevell, M.D.A. Exploring scenario and model uncertainty ni cross-sectoral integrated assessment approaches to climate change impacts. Clim. Chang. 2015, 132, 417–432. [Google Scholar] [CrossRef]
  51. Espada, R.J.; Apan, A.; McDougall, K. Vulnerability assessment and interdependency analysis of critical infrastructures for climate adaptation and flood mitigation. Int. J. Disaster Resil. Built Environ. 2015, 6, 313–346. [Google Scholar] [CrossRef]
  52. Syed, M.A.; Al Amin, M.; Rahman, A.; Mallick, D. Synergies of remote sensing with social science tools for participatory management of natural resources. In Proceedings of the Imaging and Geospatial Technology Forum, IGTF 2015—ASPRS Annual Conference and co-located JACIE Workshop, Tampa, FL, USA, 4–8 May 2015. [Google Scholar]
  53. Yazdanfar, Z.; Sharma, A. Urban drainage system planning and design—Challenges with climate change and urbanization: A review. Water Sci. Technol. 2015, 72, 165–179. [Google Scholar] [CrossRef]
  54. van der Knaap, Y.A.M.; de Graaf, M.; van Ek, R.; Witte, J.-P.M.; Aerts, R.; Bierkens, M.F.P.; van Bodegom, P.M. Potential impacts of groundwater conservation measures on catchment-wide vegetation patterns in a future climate. Landsc. Ecol. 2015, 30, 855–869. [Google Scholar] [CrossRef]
  55. Gombault, C.; Sottile, M.-F.; Ngwa, F.F.; Madramootoo, C.A.; Michaud, A.R.; Beaudin, I.; Chikhaoui, M. Modelling climate change impacts on the hydrology of an agricultural watershed in southern Québec. Can. Water Resour. J. 2015, 40, 71–86. [Google Scholar] [CrossRef]
  56. Antwi, E.K.; Boakye-Danquah, J.; Owusu, A.B.; Loh, S.K.; Mensah, R.; Boafo, Y.A.; Apronti, P.T. Community vulnerability assessment index for flood prone savannah agro-ecological zone: A case study of Wa West District, Ghana. Weather Clim. Extrem. 2015, 10, 56–69. [Google Scholar] [CrossRef] [Green Version]
  57. Lee, C.C.; Tung, C.P.; Liu, T.M.; Tsao, J.H.; Liu, G.R.; Chiang, Y.C.; Huang, K.C. Toward an innovative interdisciplinary method for vulnerability assessments: The case of Taiwan. J. Water Clim. Chang. 2015, 6, 501–517. [Google Scholar] [CrossRef]
  58. Spyridi, D.; Vlachokostas, C.; Michailidou, A.V.; Sioutas, C.; Moussiopoulous, N. Strategic planning for climate change mitigation and adaptation: The case of Greece. Int. J. Clim. Chang. Strateg. Manag. 2015, 7, 272–289. [Google Scholar] [CrossRef]
  59. Kane, H.H.; Fletcher, C.H.; Frazer, N.; Anderson, T.R.; Barbee, M.M. Modeling sea-level rise vulnerability of coastal environments using ranked management concerns. Clim. Chang. 2015, 131, 349–361. [Google Scholar] [CrossRef]
  60. Pulido-Velazquez, M.; Pena-Haro, S.; Garcia-Prats, A.; Mocholi-Almudever, A.F.; Henriquez-Dole, L.; Macian-Sorribes, H.; Lopez-Nicholas, A. Integrated assessment of the impact of climate and land use changes on groundwater quantity and quality in the Mancha Oriental system (Spain). Hydrol. Earth Syst. Sci. 2014, 19, 1677–1693. [Google Scholar] [CrossRef]
  61. Ulrich, C.; Rauch, W. Exploring critical pathways for urban water management to identify robust strategies under deep uncertainties. Water Res. 2014, 145, 431–444. [Google Scholar]
  62. Ronchail, J.; Cohen, M.; Alonso-Roldán, M.; Garcin, H.; Sultan, B.; Angles, S. Adaptability of mediterranean agricultural systems to climate change: The example of the Sierra Mágina olive-growing region (Andalusia, Spain). Weather. Soc. 2014, 6, 451–467. [Google Scholar] [CrossRef]
  63. Ronco, P.; Gallina, V.; Torresan, S.; Zabeo, A.; Semenzin, E.; Critto, A.; Marcomini, A. The KULTURisk Regional Risk Assessment methodology for water-related natural hazards—Part 1: Physical-environmental assessment. Hydrol. Earth Syst. Sci. 2014, 18, 5399–5414. [Google Scholar] [CrossRef]
  64. Giuopponi, C. Decision support for mainstreaming climate change adaptation in water resources management. Water Resour. Manag. 2014, 28, 4795–4808. [Google Scholar] [CrossRef]
  65. van Bodegom, P.M.; Verboom, J.; Witte, J.P.M.; Vos, C.C.; Bartholomeus, R.P.; Geertsema, W.; Cormont, A.; van der Veen, M.; Aerts, R. Synthesis of ecosystem vulnerability to climate change in the Netherlands shows the need to consider environmental fluctuations in adaptation measures. Reg. Environ. Chang. 2014, 14, 933–942. [Google Scholar] [CrossRef]
  66. Krellenberg, K.; Link, F.; Welz, J.; Harris, J.; Barth, K.; Irarrazaval, F. Supporting local adaptation: The contribution of socio-environmental fragmentation to urban vulnerability. Supporting local adaptation: The contribution of socio-environmental fragmentation to urban vulnerability. Appl. Geogr. 2014, 55, 61–70. [Google Scholar] [CrossRef]
  67. Haasnoot, M.; van Deursen, W.P.A.; Guillaume, J.H.A.; Kwakkel, J.H.; van Beek, E.; Middelkoop, H. Fit for purpose? Building and evaluating a fast, integrated model for exploring water policy pathways. Environ. Model. Softw. 2014, 60, 99–120. [Google Scholar] [CrossRef] [Green Version]
  68. Zischg, A.; Schober, S.; Sereinig, N.; Rauter, M.; Seymann, C.; Goldschmidt, F.; Bäk, R.; Schleicher, E. Monitoring the temporal development of natural hazard risks as a basis indicator for climate change adaptation. Nat. Hazards 2013, 67, 1045–1058. [Google Scholar] [CrossRef]
  69. Lung, T.; Lavalle, C.; Hiederer, R.; Dosio, A.; Bouwer, L.M. A multi-hazard regional level impact assessment for Europe combining indicators of climatic and non-climatic change. Glob. Environ. Chang. 2013, 23, 522–536. [Google Scholar] [CrossRef]
  70. Parker, J.M.; Wilby, R.L. Quantifying Household Water Demand: A Review of Theory and Practice in the UK. Water Resour. Manag. 2013, 27, 981–1011. [Google Scholar] [CrossRef]
  71. Liu, G.; Liu, H.; Yin, Y. Global patterns of NDVI-indicated vegetation extremes and their sensitivity to climate extremes. Environ. Res. Lett. 2013, 8, 025009. [Google Scholar] [CrossRef] [Green Version]
  72. Chang, N.B.; Qi, C.; Yang, Y.J. Optimal expansion of a drinking water infrastructure system with respect to carbon footprint, cost-effectiveness and water demand. J. Environ. Manag. 2012, 110, 194–206. [Google Scholar] [CrossRef]
  73. Georgakakos, K.P.; Graham, N.E.; Cheng, F.Y.; Spencer, C.; Shamir, E.; Georgakakos, A.P.; Yao, H.; Kistenmacher, M. Value of adaptive water resources management in northern California under climatic variability and change: Dynamic hydroclimatology. J. Hydrol. 2012, 412, 47–65. [Google Scholar] [CrossRef]
  74. Verburg, P.H.; Koomen, E.; Hilferink, M.; Pérez-Soba, M.; Lesschen, J.P. An assessment of the impact of climate adaptation measures to reduce flood risk on ecosystem services. Landsc. Ecol. 2012, 27, 473–486. [Google Scholar] [CrossRef] [Green Version]
  75. Malik, S.M.; Awan, H.; Khan, N. Mapping vulnerability to climate change and its repercussions on human health in Pakistan. Glob. Health 2012, 8, 1–10. [Google Scholar] [CrossRef]
  76. Chaliha, S.; Sengupta, A.; Sharma, N.; Ravindranath, N.H. Climate variability and farmer’s vulnerability in a flood-prone district of Assam. Int. J. Clim. Chang. Strateg. Manag. 2012, 4, 179–200. [Google Scholar] [CrossRef]
  77. Rijcken, T.; Stijnen, J.; Slootjes, N. “SimDelta”—Inquiry into an internet-based interactive model for water infrastructure development in the Netherlands. Water 2012, 4, 295–320. [Google Scholar] [CrossRef]
  78. Haasnoot, M.; Middelkoop, H.; Van Beek, E.; Van Deursen, W.P.A. A method to develop sustainable water management strategies for an uncertain future. Sustain. Dev. 2011, 19, 369–381. [Google Scholar] [CrossRef]
  79. Ceccato, L.; Giannini, V.; Giuopponi, C. Participatory assessment of adaptation strategies to flood risk in the Upper Brahmaputra and Danube river basins. Environ. Sci. Policy 2011, 14, 1163–1174. [Google Scholar] [CrossRef]
  80. Verma, M.; Negandhi, D. Valuing ecosystem services of wetlands—A tool for effective policy formulation and poverty alleviation. Hydrol. Sci. J. 2011, 56, 1622–1639. [Google Scholar] [CrossRef]
  81. Sokolewicz, M.; Louters, T.; Otten, A. Modern integrated river flood management for climate change in the Netherlands: The Ijssel Delta project. Int. J. River Basin Manag. 2011, 9, 141–149. [Google Scholar] [CrossRef]
  82. Williams, C.J.R.; Kniveton, D.R.; Layberry, R. Assessment of a climate model to reproduce rainfall variability and extremes over Southern Africa. Theor. Appl. Climatol. 2010, 99, 9–27. [Google Scholar] [CrossRef]
  83. Stakhiv, E.; Stewart, B. Needs for climate information in support of decision-making in the water sector. Procedia Environ. Sci. 2010, 1, 102–119. [Google Scholar]
  84. Lempert, R.J.; Groves, D.G. Identifying and evaluating robust adaptive policy responses to climate change for water management agencies in the American west. Technol. Forecast. Soc. Chang. 2010, 77, 960–974. [Google Scholar] [CrossRef]
  85. Angus, S.D.; Parris, B.; Hassani, M.B. Climate change impacts and adaptation in Bangladesh: An agent-based approach. In Proceedings of the 18th World IMACS/MODSIM Congress, Cairns, Australia, 13–17 July 2009. [Google Scholar]
  86. Dewals, B.J.; Giron, E.; Ernst, J.; Hecq, W.; Pirotton, M. Integrated assessment of flood protection measures in the context of climate change: Hydraulic modelling and economic approach. Wit Trans. Ecol. Environ. 2008, 108, 149–159. [Google Scholar]
  87. Kazama, S.; Izumi, H.; Sarukkalige, P.R.; Nasu, T.; Sawamoto, M. Estimating snow distribution over a large area and its application for water resources. Hydrol. Process 2008, 22, 2315–2324. [Google Scholar] [CrossRef]
  88. Hooijer, A.; Klijn, F.; Pedroli, G.B.M.; Van Os, A.G. Towards sustainable flood risk management in the Rhine and Meuse river basins: Synopsis of the findings of IRMA-SPONGE. River Res. Appl. 2004, 20, 343–357. [Google Scholar] [CrossRef]
Figure 1. Search strategy and exclusion criteria.
Sustainability 11 01163 g001
Figure 2. Search strategy for broad check for complexity concepts.
Sustainability 11 01163 g002
Figure 3. Example Euler diagram.
Sustainability 11 01163 g003
Figure 4. Coverage by combinations of concepts addressed, ordered by number of concepts covered (1 concept covered, then 2 concepts covered, etc.), then ordered by frequency.
Sustainability 11 01163 g004
Figure 5. Knowledge base on climate change adaptation to hydrohazards, 1989–2018.
Sustainability 11 01163 g005
Figure 6. Coverage of hydrohazard types.
Sustainability 11 01163 g006
Figure 7. Emphasis of focus on hazard or impact.
Sustainability 11 01163 g007
Figure 8. Coverage by combined hydrohazard type and focus on hazard or impact.
Sustainability 11 01163 g008
Figure 9. Top 20 most covered combinations of spatial scales, ordered by frequency.
Sustainability 11 01163 g009
Figure 10. Coverage of time scales, ordered by overall frequency.
Sustainability 11 01163 g010
Figure 11. Top 20 most covered combinations of spatial and time scales, ordered by frequency.
Sustainability 11 01163 g011
Figure 12. Top 20 combinations with broadest coverage of spatial and time scales, ordered by degree.
Sustainability 11 01163 g012
Figure 13. Top 20 most covered combinations of human–nature dimensions.
Sustainability 11 01163 g013
Figure 14. Top 20 combinations with broadest coverage of human–nature dimensions, ordered by degree.
Sustainability 11 01163 g014
Figure 15. Top 10 most frequently covered combinations of method categories, ordered by number of method categories covered, then by frequency.
Sustainability 11 01163 g015
Figure 16. Top 20 most used combinations of specific methods.
Sustainability 11 01163 g016
Figure 17. Statistically associated variables, with broad concepts in upper case and more specific variables in lower case.
Sustainability 11 01163 g017
Table 1. Challenges for interdisciplinary sustainability research in the Anthropocene.
Category#Challenge
Advancing interdisciplinarity1Fuller integration and “intensive cooperation” between social and natural sciences [7]
2True inter-/transdisciplinary work, by avoiding reductionism [10]
3To be flexible in our construction of shared reflections on a possible future [10]
4To move beyond siloed sectorial analysis, to find new ways of modelling the social and environmental trade-offs of policy choices, institutional arrangements, and economic incentives—and their local and distant outcomes [9]
Integrating ethical concerns5To ensure solutions do not perpetuate existing inequalities—or create new ones (i.e., we need to consider populations vulnerable populations, and consider the impacts of local/regional interventions globally) [7]
6To ensure humans are not “in conflict with themselves through the structures and systems that they themselves have created in order to improve their lifestyles and well-being” [7]
Coping with complexity7To acknowledge and account for multiple interactions across natural and social systems [10];
To eschew the Western dualism of nature and society, by being more flexible in our approaches, e.g., by applying the same theoretical frameworks across many scales [7]
8To acknowledge and account for unclear system boundaries [10]
9To acknowledge and account for different temporal scales [10];
To model and understand both fast ‘shocks’ and slow ‘stressors’ [7]
10To understand how multiple hazards or types of hazards co-occurring at the same time could impact the system [9]
11To identify how directionality could be articulated, democratically anchored, and implemented (i.e., how to effectively model impacts not just hazards, but perhaps more importantly, potential interventions) [7]
12To develop ‘early warning systems’ for cascading effects through the system [9]
13To acknowledge and account for different spatial scales [10];
To connect global scale dynamics to local realities and vice versa [11];
To combine abstract, theoretical, and systemic knowledge with contextual and place-based understandings (i.e., we need to link top–down and bottom–up systems approaches) [10]
14To identify when local-level actions dampen out to have no appreciable effects at larger levels, and when they amplify to drive significant impacts at larger levels (e.g., with new approaches to network, spatial, and multilevel analyses) [9]
15To acknowledge and account for deep influences by human values, behaviour, culture, and institutions [10];
To pay attention to the role of different lifestyles and worldviews in decision-making models, by bringing together current advances in modelling human behaviour and agency and Earth System dynamics, as well as how visions and narratives of urban and rural sustainability consider trade-offs of various choices and their potentially contrasting outcomes [9]
16Because of our limited, human capacity of understanding the fullness of complexity), to “create multiple narratives (scenarios), each invoking different dimensions, none of which will entirely ‘predict’ what will happen. Probabilities, contingencies, conditionalities and thresholds need to be assigned to them as a measure of the extent to which scenarios seem ‘realistic’” [10]
17To find ways to cope with the abundance of data now available to us, by developing sound methodologies which link multiple forms of evidence [9]
18To diversify our modelling approaches, and avoid the “convergence towards single models that are able to answer a wide range of questions, but without sufficient specificity” (i.e., we need to stop expecting one model to tell us everything) [11]
Table 2. Six core complexity concepts relevant to complex human–nature systems.
#ConceptDescriptionRelated Challenges from Table 1
1UncertaintyUncertainty in projections of future scenarios; consideration of multiple possible futures8; 16
2Spatial ScaleCoverage of multiple spatial scales; connecting contextual, place-based understandings (bottom–up) with theoretical and systemic knowledge (top–down)13
3Time ScaleCoverage of multiple temporal scales; any intention to address fast ‘shocks’ or slow ‘stressors’)9
4Multimodel ApproachesUsage of multiple models; understanding impossibility of a single ‘silver bullet’ model; linkage of multiple forms of evidence; diversifying modelling approaches; coping with an abundance of data13; 17; 18
5Human–nature DimensionsAcknowledging and accounting for deep influences by human values, behaviour, culture, and institutions; eschewing human–nature dualism7; 15
6InteractionsAccounting for multiple interactions across natural and human systems; connecting global scale dynamics to local realities and vice versa; identifying salient leverage points and pathways to transformation; developing ‘early warning systems’ for cascading effects through the system; modelling not just impacts but also feeding back and testing interventions7; 11; 12; 13; 14
Table 3. Variables for describing the context of the knowledge base.
TypeHazard/Focus VariableDescription
Hazard TypeDroughtReferencing droughts, lack of rainfall, low flows
FloodReferencing floods, heavy rainfall, high flows
General Climate ChangeReferencing a flood and/or drought in the context of a wider set of climate change hazards, e.g., hurricanes, heat waves, sea level rise
FocusHazardReferencing the detection or quantification of a specific hazard (e.g., a flood extent)
ImpactReferencing the identification or quantification or impacts (e.g., economic damages of a flood)
Table 4. Detailed variables relating to the six complexity concepts.
#Complexity ConceptDetailed VariableDescriptionAdditional Sub-Variables
1UncertaintyEnsemble ScenariosUse of a method or approach which involves the consideration of multiple possible futures, probabilistic assessments, scenario analysis, climate ensembles, etc.
2Spatial ScaleCellularTarget of study (plants etc.) on a cellular level; measured in ≤mm
IndividualDiscretisation at an individual (one person; tree) level; measured in cm up to 2 m
HouseholdHousehold, family, gauging station; measured in m
CommunityCommunity; neighbourhood; street; species; small local habitat; small organisation; set of technologies for comparison; set of different stakeholder types for comparison; typically measured in less than 2–10 km2, or higher with low population density
Town or City WardTown; city ward; small area/district; roughly 1000 people per 2.5 km2; roughly 2–3 km2 for urban district, roughly 10–30 km2 for standalone town settlements
CityCity; large municipality; small county; sub-catchment; bay; peninsula; wetland; roughly a large area anywhere between 50–20,000 km2, ~1000 people/2.5 km2
RegionalRegion; catchment; large county; roughly 5000-800,000 km2 depending on nation size, climate, settlement, and land features
NationalNational; some overlap with regional, usually pertaining to national datasets or how a model has been applied than a specific spatial scale; roughly 5000-800,000 km2
GlobalGlobal; continental; international (i.e., a nation each representative of different continents, not nations groups in the same region)
3Time ScaleNoneMethod is time-independent, i.e., it does not require a time-series or event causality for its use; is not normally intended to provide specific solutions, instead clarifying conceptual underpinnings or ‘mental models’ around adaptation
Short-termStudied phenomena in intervals of minutes; hours; days; weeks
Medium-termStudied phenomena in intervals of months; years
Long-termStudied phenomena in intervals of decades; centuries
4Multimodel ApproachesCensusCensus data; Municipal datasets (including social factors; water use)
Classic Qualitative MethodsQualitative ‘building blocks’ of researchContent Analysis
Interview
Literature Review
Observation
Personal History Items (e.g., diaries)
Questionnaire
Survey
Classic Quantitative MethodsQuantitative ‘building blocks’ of researchBiological or Physical Measurement (e.g., primary data; meteorological datasets)
Statistical or Numerical Analysis
Decision-Making AnalysesDecision-making analysis; integrated decision support tools; any form of formalised decision-making process or rule-construction surrounding decision-making; usually weighing a broad range of possibilitiesCollaborative Risk-Informed Decision Analysis (CRIDA)
Decision, Event, or Problem Tree
Decision Making Under Deep Uncertainty (DMDU)
Decision Scaling
Decision Support System (DSS); Integrated Assessment Method (IAM)
Delphi Method; Expert Ranking or Weighting
Dynamic Adaptation Policy Pathways (DAPP); Adaptation Tipping Points (ATP) framework; Adaptation Mainstreaming Moments (AMM)
Integrated Value Model for Sustainable Assessment (IVMSA)
Multicriteria Decision Analysis (MCDA); Multicriteria Decision-Making (MCDM)
Robust Decision-Making (RDM)
Strategy Robustness Visualisation Method (SRVM)
Economic AppraisalAppraisals of economic benefits, costs, damages, pricingCost–Benefit Analysis (CBA)
Other Economic Assessment (e.g., calculation of damages; water pricing; willingness-to-pay)
Portfolio Analysis
Real-In Options (RIO) Analysis
IndicatorsIndicators derived from more complex datasets to be easily and relatively quickly applied with a sufficiently representative result
Participatory MethodsMethods which involve the end users affected by research outcomes in their data collection and feedback processesFocus Group
Other Participatory Method
Photo-Elicitation
Seasonal Calendar
Serious Games
Timeline Exercise
Transect Walk
Usability Experiment
Workshop
SimulationsComputer-based simulations which typically run in a time-seriesAgent-Based Model
Climate Model
Crop or Vegetation Model
Hazard Model
Hydrological Model
Other Model (e.g., based on decision analysis; water demand)
Static ModelsStatic models which do not independently (via computer) run in a time-series; conceptual models; ‘mental models’; maps for spatially explicit representations
5 and 6Human–nature Dimensions/InteractionsAgriculturalInvolving or impacting agricultural yields and practices, crop choices, crop or livestock improvement
Behavioural/General Adaptation PlanningGenerally understanding climate change phenomena, dynamics in human–nature systems, and impacts; mobilising behaviour change; detailing comprehension and decision-making; general adaptation planning effectiveness; power dynamics (e.g., between researchers and practitioners, between outsiders and indigenous groups)
CommunityReferencing community advocacy, civic involvement, innovation potential, cultural aspects, participation in voluntary work, place attachment, collective community values, religious belief, social capital, or social connectivity
EcologicalInvolving or impacting wild/natural species of plants or animals not explicitly for food production, referencing or influencing water quality, water salinity or saltwater intrusion around coastal areas
EconomicGenerally referencing costs (e.g., cost–benefit analysis), benefits, damages, pricing (e.g., willingness to pay), business size, education equity, employment, employment sector diversity, single sector employment, multiple livelihood sources, housing capital, income, income equality
Infrastructure
(General)
Acknowledging a wide range of critical infrastructure (e.g., electricity; nuclear power; telecommunications)
Infrastructure
(Pre-Hazard)
Referencing infrastructure often cited as important pre-hazard (e.g., flood defences), building material, ecological buffer, water-related infrastructure, land use diversity, location, soil retention, wetland diversity, green infrastructure, urban extent
Infrastructure
(Post-Hazard)
Referencing infrastructure often cited as important post-hazard (e.g., transport networks), access/evacuation potential, care for housing and infrastructure, housing age, housing type, medical capacity, shelter capacity, sheltering needs
InstitutionalAcknowledging the role of governance or other institutional contexts, awareness and preparedness (e.g., education), insurance coverage, mitigation and recovery previous disaster experience, political fragmentation, state services and resources, warning systems and weather forecasting, multisectoral partnerships, trade agreements
SocialReferencing age, communication capacity, disability and special needs, educational status, health insurance coverage or health access, language competency, population size or growth, health impacts, demographic trends
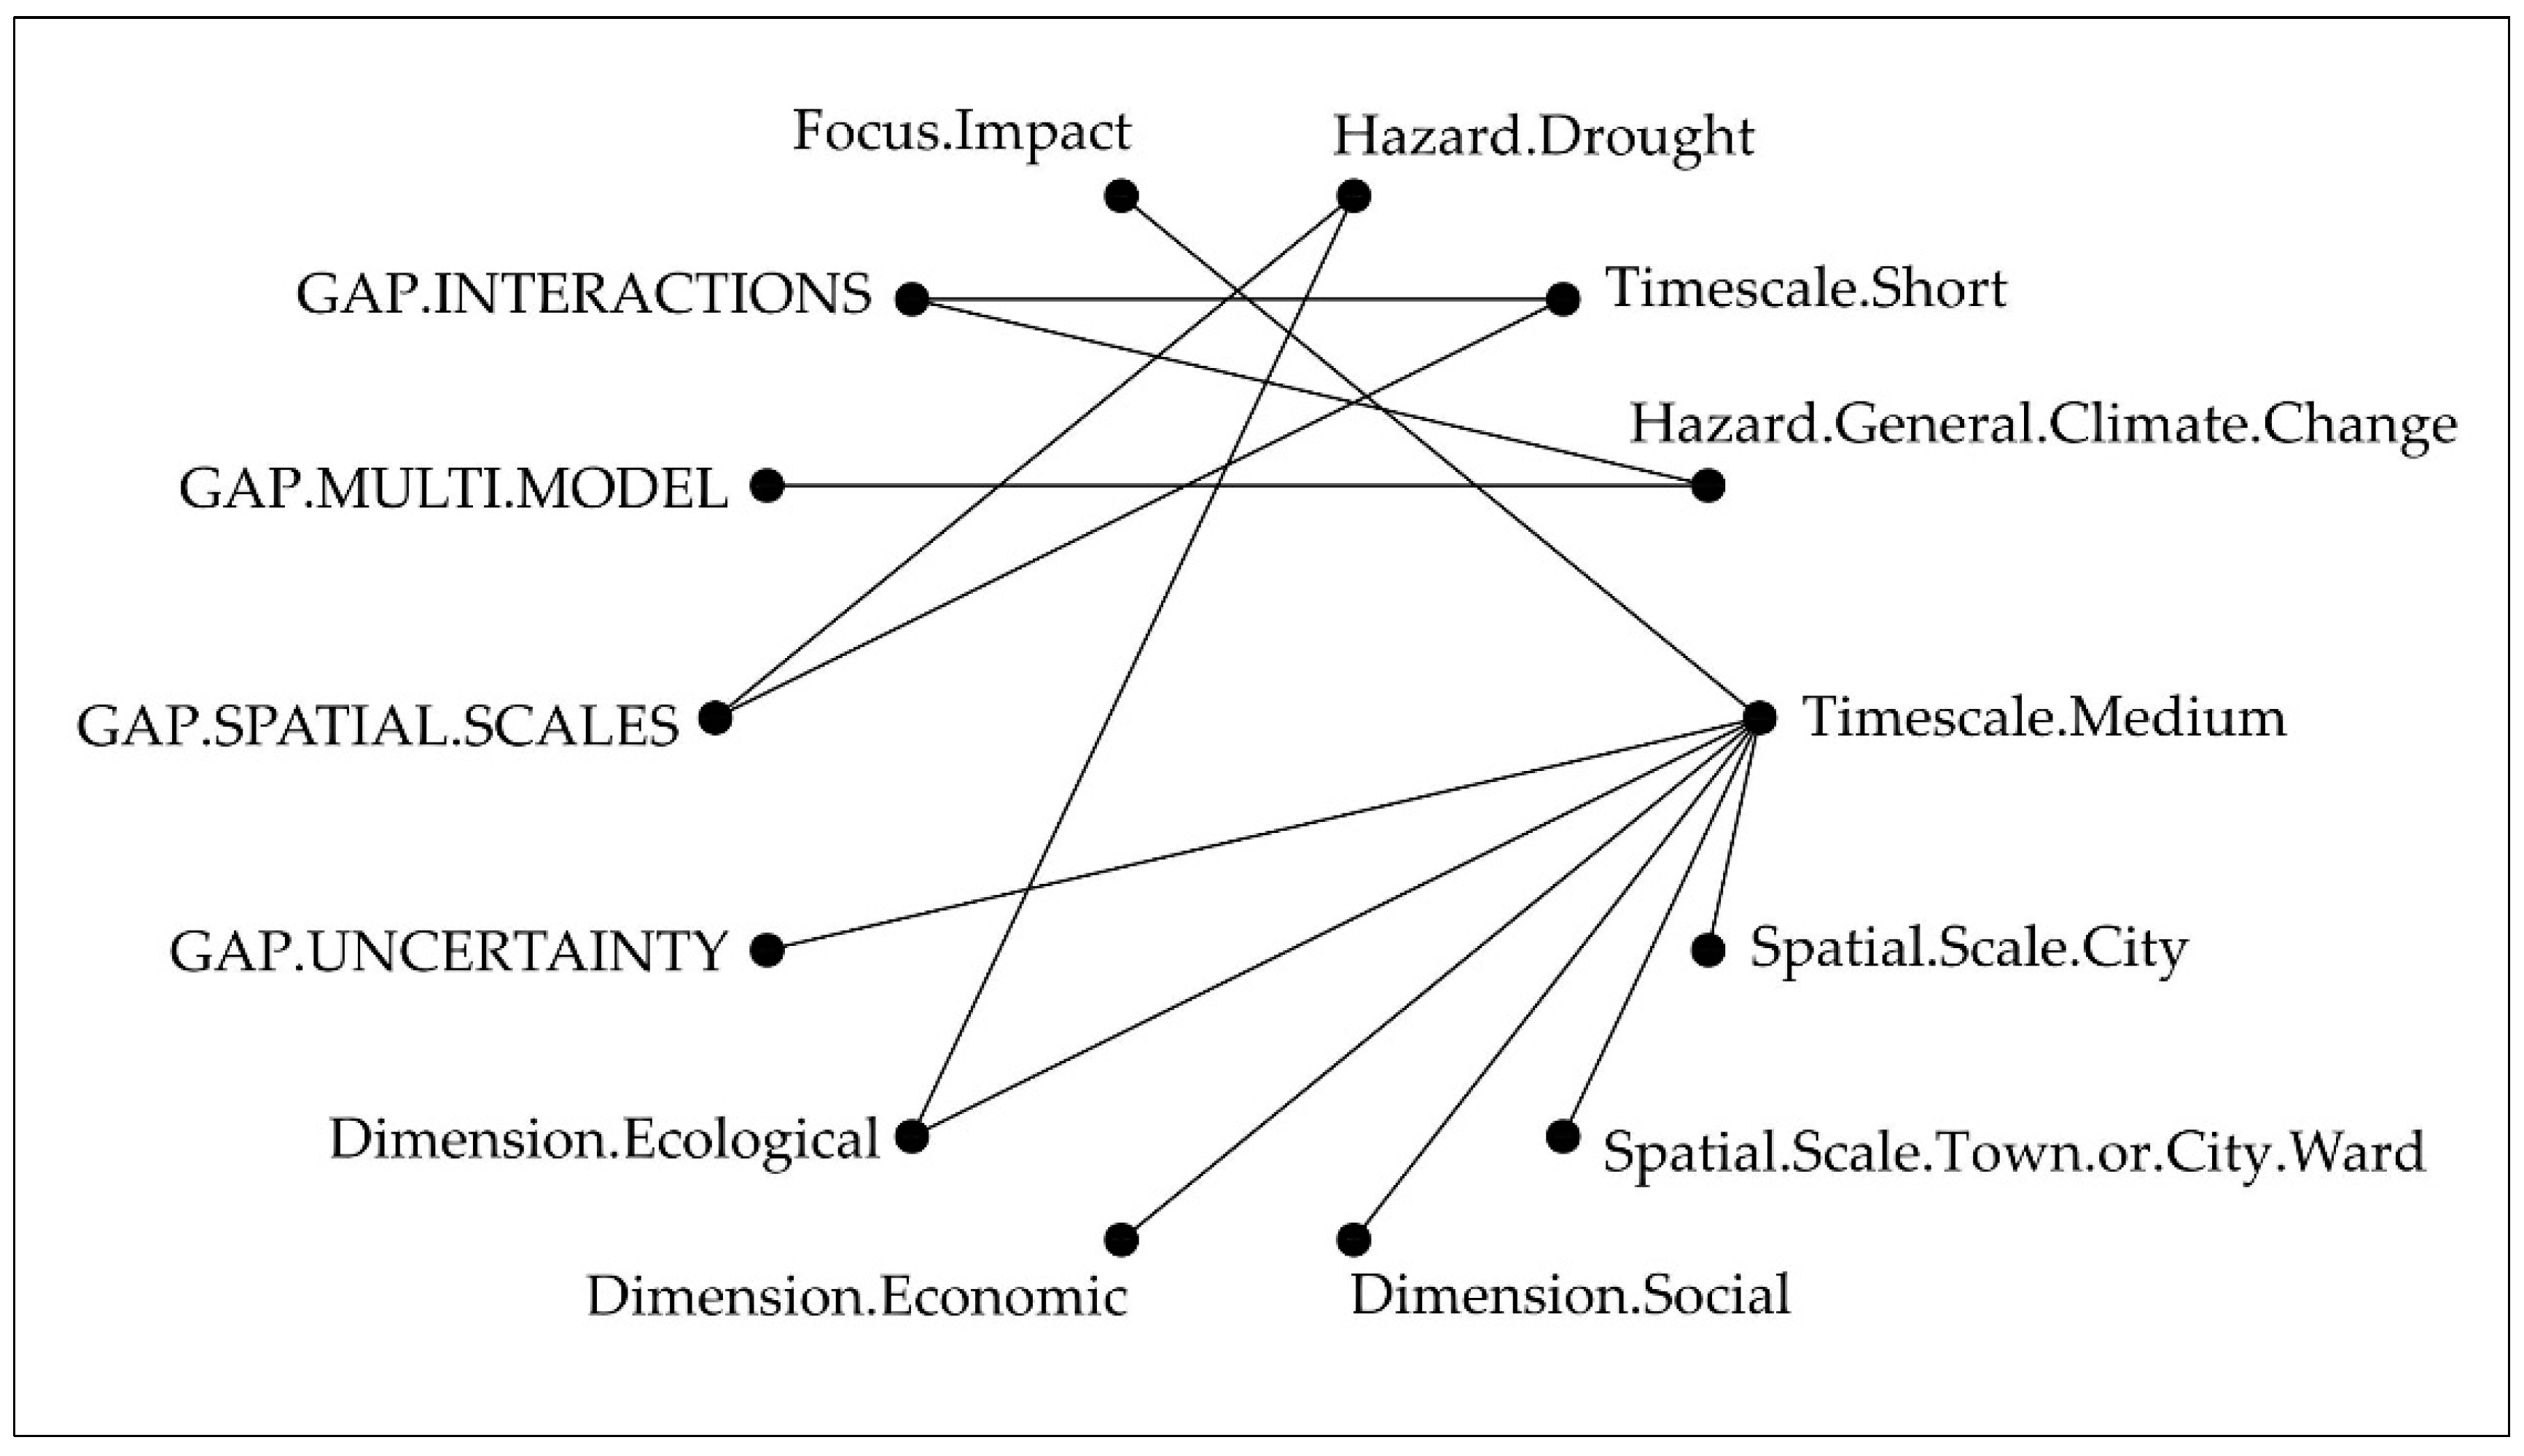
Table 5. Cramer’s V strength of association for the linked pairs (all pairs significant to p < 0.05).
Variable 1Variable 2Cramer’s V
Time.Scale.ShortGap.Interactions0.0081
Hazard.General.Climate.ChangeGap.Interactions0.0076
Time.Scale.ShortGap.Spatial.Scales0.0073
Time.Scale.MediumSpatial.Scale.Town.or.City.Ward0.0067
Hazard.DroughtGap.Spatial.Scales0.0049
Hazard.General.Climate.ChangeGap.Multi.Model0.0045
Time.Scale.MediumGap.Uncertainty0.0035
Hazard.DroughtDimension.Ecological0.0034
Time.Scale.MediumFocus.Impact0.0030
Time.Scale.MediumDimension.Social0.0029
Time.Scale.MediumDimension.Economic0.0019
Time.Scale.MediumSpatial.Scale.City0.0010
Time.Scale.MediumDimension.Ecological0.0002
Table 6. Summary of findings regarding methods for climate change adaptation to hydrohazards.
#Complexity ConceptState of Play/Existing Patterns)Next Steps/Future Needs
1UncertaintyOnly 22% of research accounts for uncertainty;
Significantly associated to medium-term study (months or years)
Greater consideration of multiple possible futures;
Deeper consideration of how uncertainty cascades through different time scales (not just medium-term)
2Spatial ScaleHeavy emphasis on regional and community scale analysis;
Highest-frequency spatial scales had physical emphasis, i.e., social dynamics and considerations less covered
Need for investigation of finer level of scale, e.g., household-level to determine if critical complexity dynamics are being lost in current approaches;
Community (and most other) scale needs greater focus on social, behavioural, cognitive, and/or cultural aspects
3Time ScaleAdequate coverage with a heavy emphasis (90% occurrence) on the medium-term; medium-term significantly linked to study of impacts;
medium-term is specifically linked to the intention to study ecological, economic, and social dimensions
More focus needed on short-term (hours or days or weeks) and linking this to medium-term (months or years), particularly in study of all types of impacts and interactions
4Multimodel Approaches30% of approaches use more than 4 types of method;
however, most approaches relied on classic quantitative methods and simulations
Better integration of participatory methods (bottom–up) and decision-making Analyses
5Human–Nature DimensionsThis was most frequently mentioned complexity concept;
Infrastructure (pre-hazard), economic and ecological were most covered
Other dimensions should be explored more frequently and systematically;
specifically, the community and infrastructure (post-hazard) dimensions
6InteractionsOnly 19% of research claims to address interactions of any kind;
interactions significantly associated with short-term (hours or days or weeks)
Need to push the study of interactions to link short-term shocks and long-term stressors; development of methods to optimally use minimal data
OVERALLNo ‘tried and tested’ methodological patterns have yet emerged in the study of climate change adaptation to hydrohazards;
Just 3% of reviewed papers performed any form of method comparison or review before applying their chosen methods;
19% of initial knowledge base did not cover any of the six complexity concepts, even at a broad level;
75% of reviewed papers addressed only 1 or 2 complexity concepts;
None of the 910 papers could address all six complexity concepts
More systematic consideration of the six complexity concepts in research design;
need to be bolder in venturing to unfamiliar disciplines and adapting complexity-smart methods

