Research on Coupling Coordination Development for Photovoltaic Agriculture System in China


Abstract
:1. Introduction
2. Materials and Methods
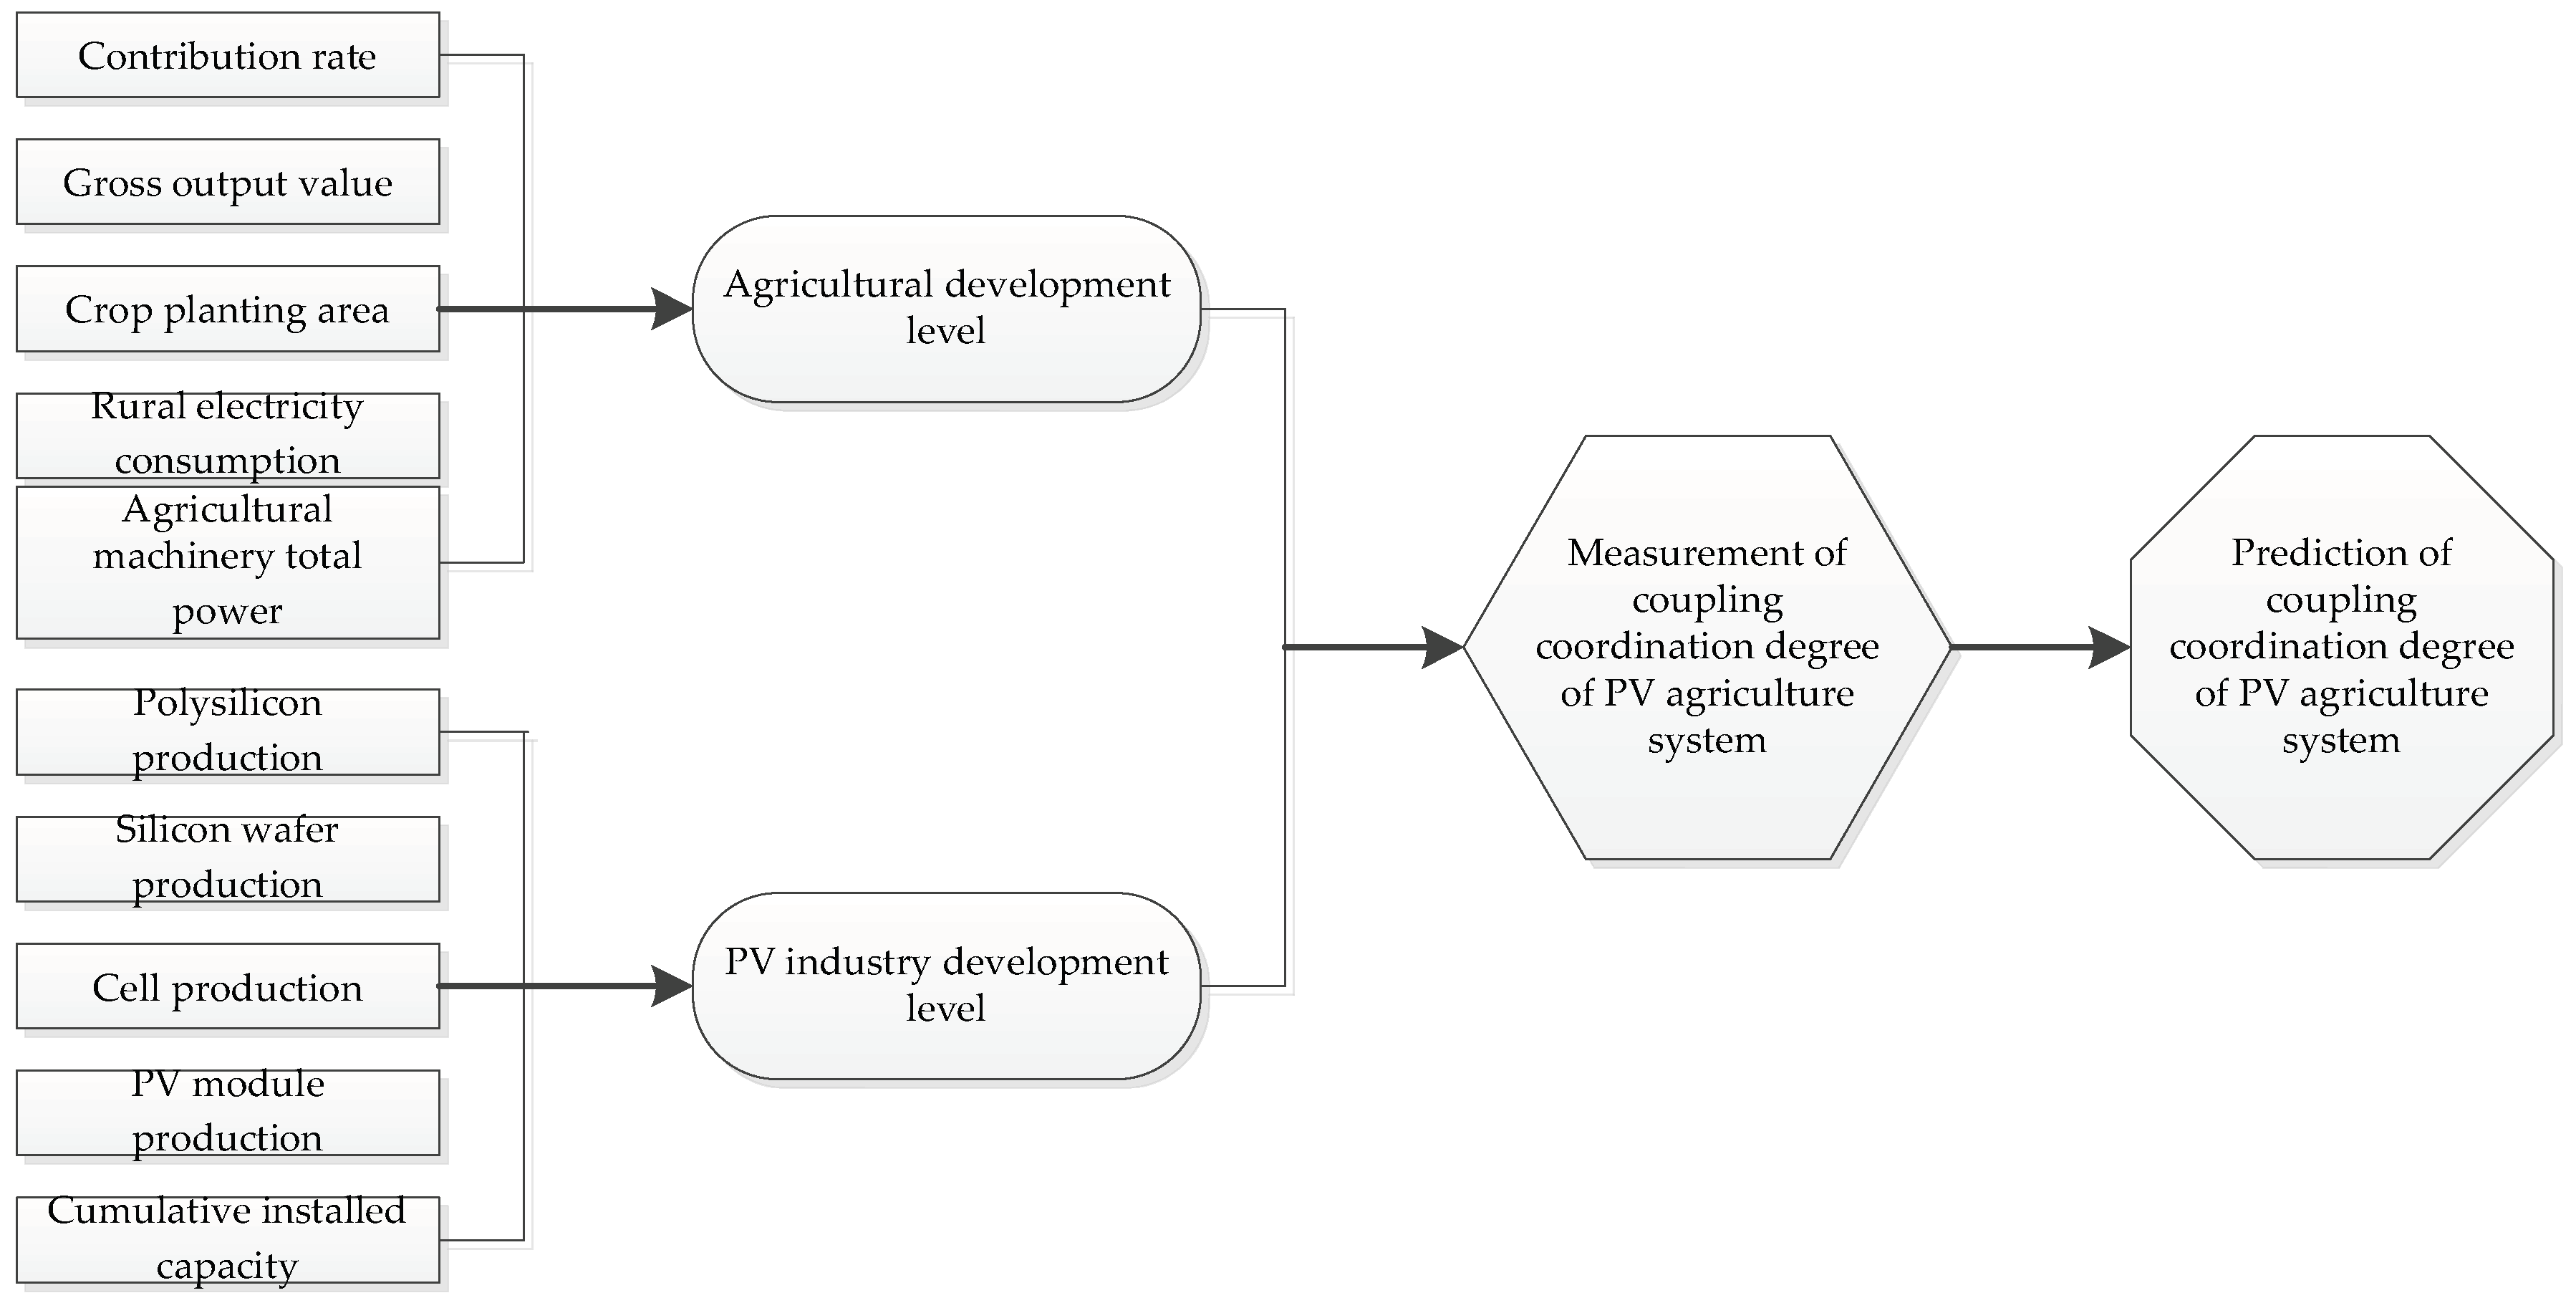
2.1. Analytical Framework
2.2. Index System and Data Sources
2.3. Methods
2.3.1. System Development Level Measurement and Decomposition Model
2.3.2. Coupling Coordination Degree Evaluation Model
2.3.3. GM (1,1) Grey Prediction Model
3. Empirical Analysis of the Development Level of the Agriculture and PV Industries
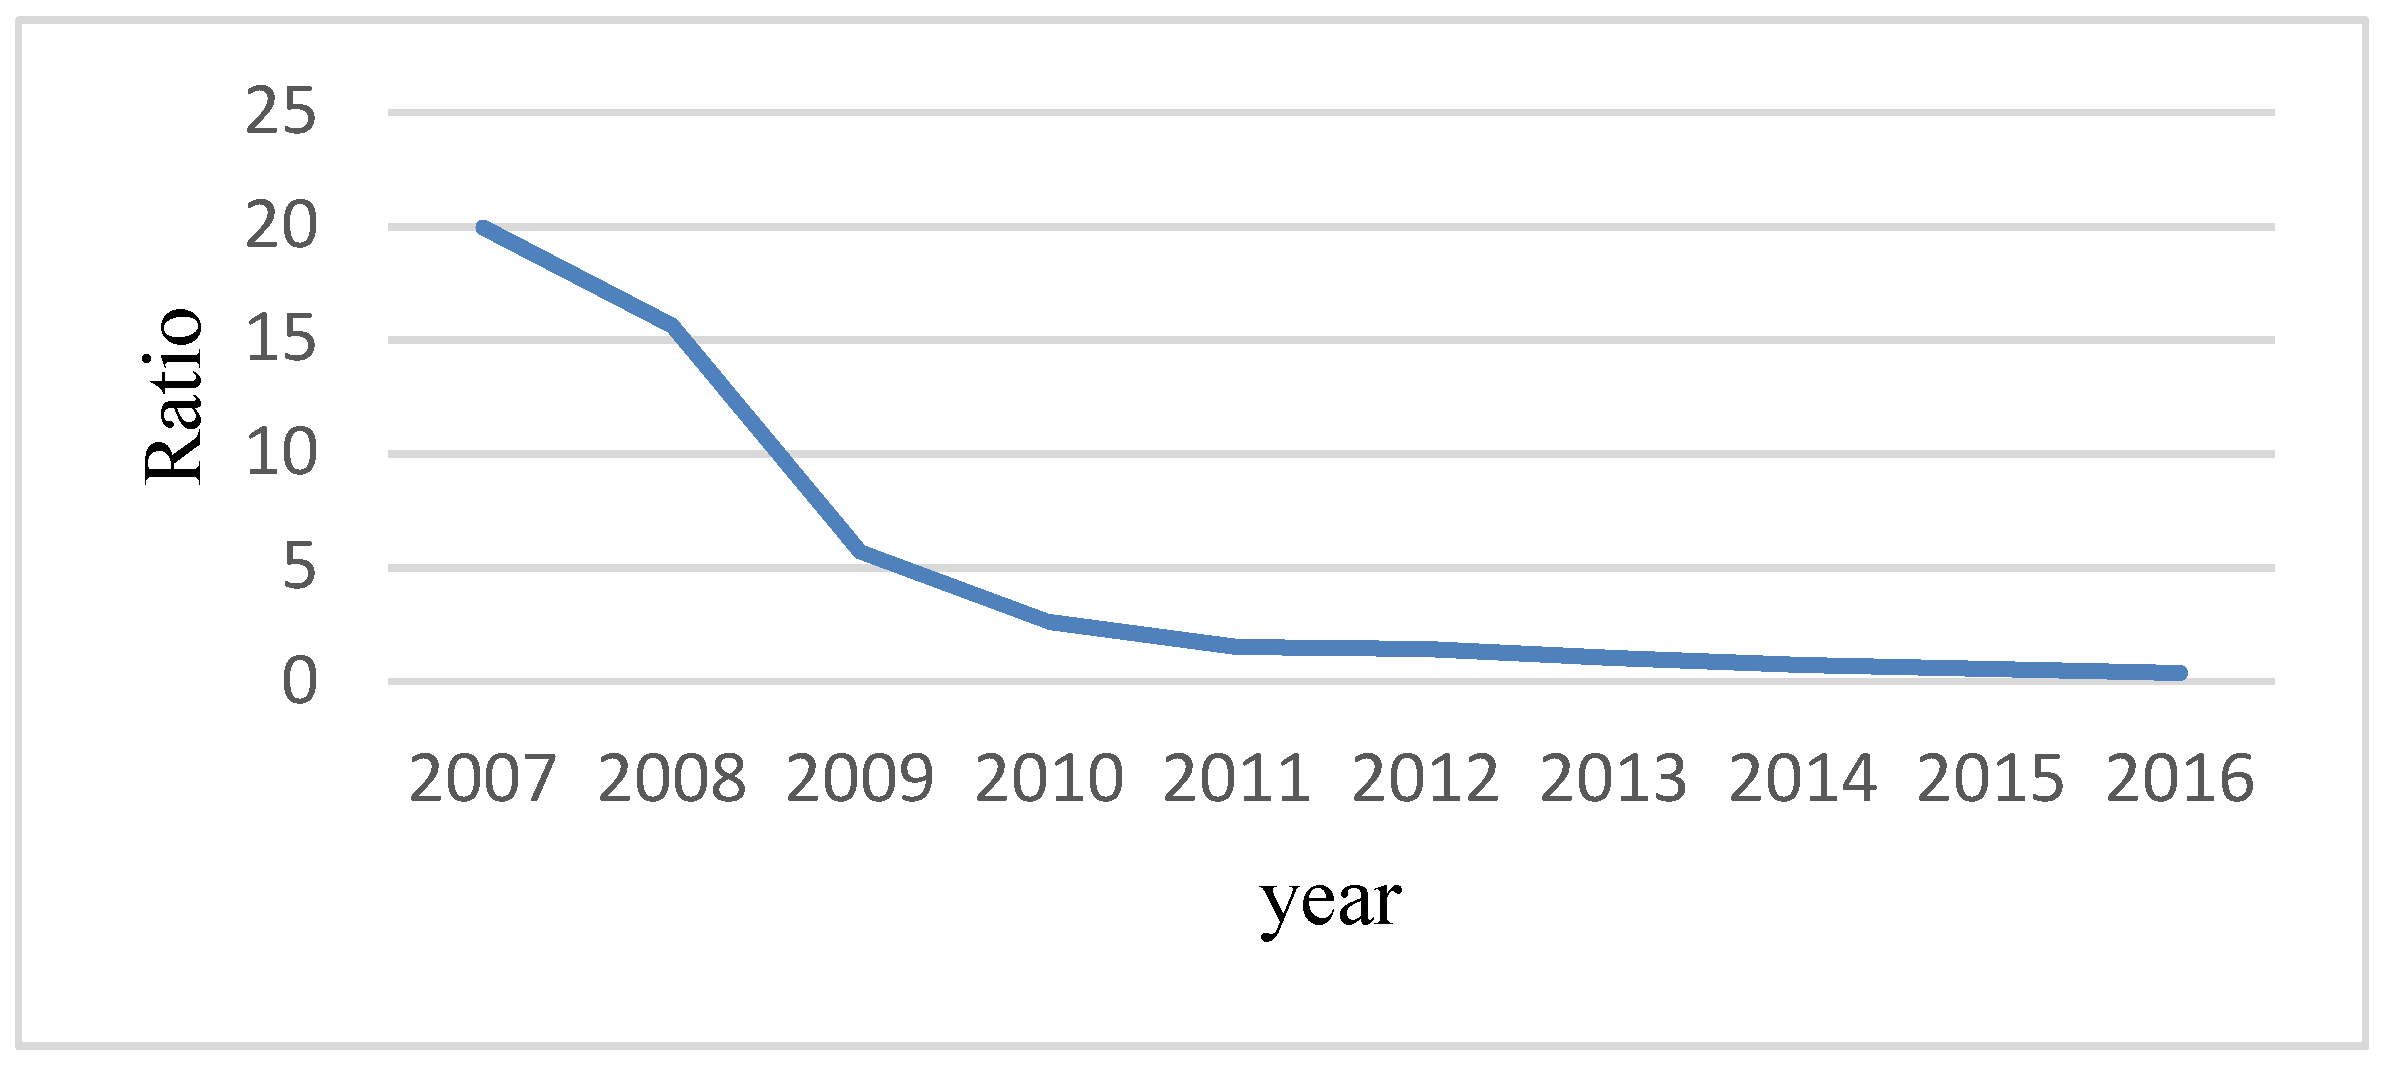
3.1. Analysis of the Comprehensive Development Level of the Agriculture and PV Industries
3.2. Decomposition of the Comprehensive Development Level of the Agriculture and PV Industries
4. Empirical Analysis of Coupling Coordination Development of the PV Agriculture System
4.1. Analysis of Coupling Coordination Development under Traditional Weighting Method
4.2. Analysis of Coupling Coordination Development under Optimized Weighting Method
4.3. Prediction of the Degree of Coupling Coordination of the PV Agricultural System
5. Conclusions and Recommendations
Author Contributions
Funding
Conflicts of Interest
Appendix A

| Subsystem | Indicator | Unit | 2007 | 2008 | 2009 | 2010 | 2011 | 2012 | 2013 | 2014 | 2015 | 2016 |
|---|---|---|---|---|---|---|---|---|---|---|---|---|
| Agriculture A | Contribution rate A1 | % | 2.7 | 5.2 | 4 | 3.6 | 4.2 | 5.2 | 4.3 | 4.7 | 4.6 | 4.4 |
| Gross output value A2 | 109 USD | 3656.80 | 4158.95 | 4564.30 | 5478.37 | 6226.91 | 6961.28 | 7637.06 | 8122.61 | 8547.39 | 8792.38 | |
| Crop planting area A3 | 103 hectare | 153464 | 156266 | 158614 | 160675 | 162283 | 163416 | 164627 | 165446 | 166374 | 166650 | |
| Rural electricity consumption A4 | 109 kW·h | 5509.9 | 5713.2 | 6104.4 | 6632.3 | 7139.6 | 7508.5 | 8549.5 | 8884.4 | 9026.9 | 9238.3 | |
| Agricultural machinery total power A5 | 104 KW | 76589.6 | 82190.4 | 87496.1 | 92780.5 | 97734.7 | 102559.0 | 103906.8 | 108056.6 | 111728.1 | 97245.6 | |
| PV industry P | Polysilicon production P1 | 104 tons | 0.11 | 0.45 | 2 | 4.5 | 8.4 | 7.1 | 8.5 | 13.6 | 16.5 | 19.4 |
| Silicon wafer production P2 | GW | 1.18 | 1.3 | 4.4 | 10.8 | 19.7 | 25.6 | 29.51 | 38.03 | 48.01 | 64.79 | |
| Cell production P3 | GW | 1.088 | 2 | 4.92 | 10.8 | 19.8 | 21 | 25.1 | 33.5 | 41 | 49 | |
| PV module production P4 | GW | 1.753 | 2.525 | 4.382 | 10.8 | 21 | 23 | 27.4 | 35.6 | 45.8 | 57.7 | |
| Cumulative installed capacity P5 | GW | 10 | 14 | 28.4 | 86.4 | 293.4 | 650 | 1744.8 | 2805.1 | 4318 | 7742 |
Appendix B
| 2007 | 2008 | 2009 | 2010 | 2011 | 2012 | 2013 | 2014 | 2015 | 2016 | |
|---|---|---|---|---|---|---|---|---|---|---|
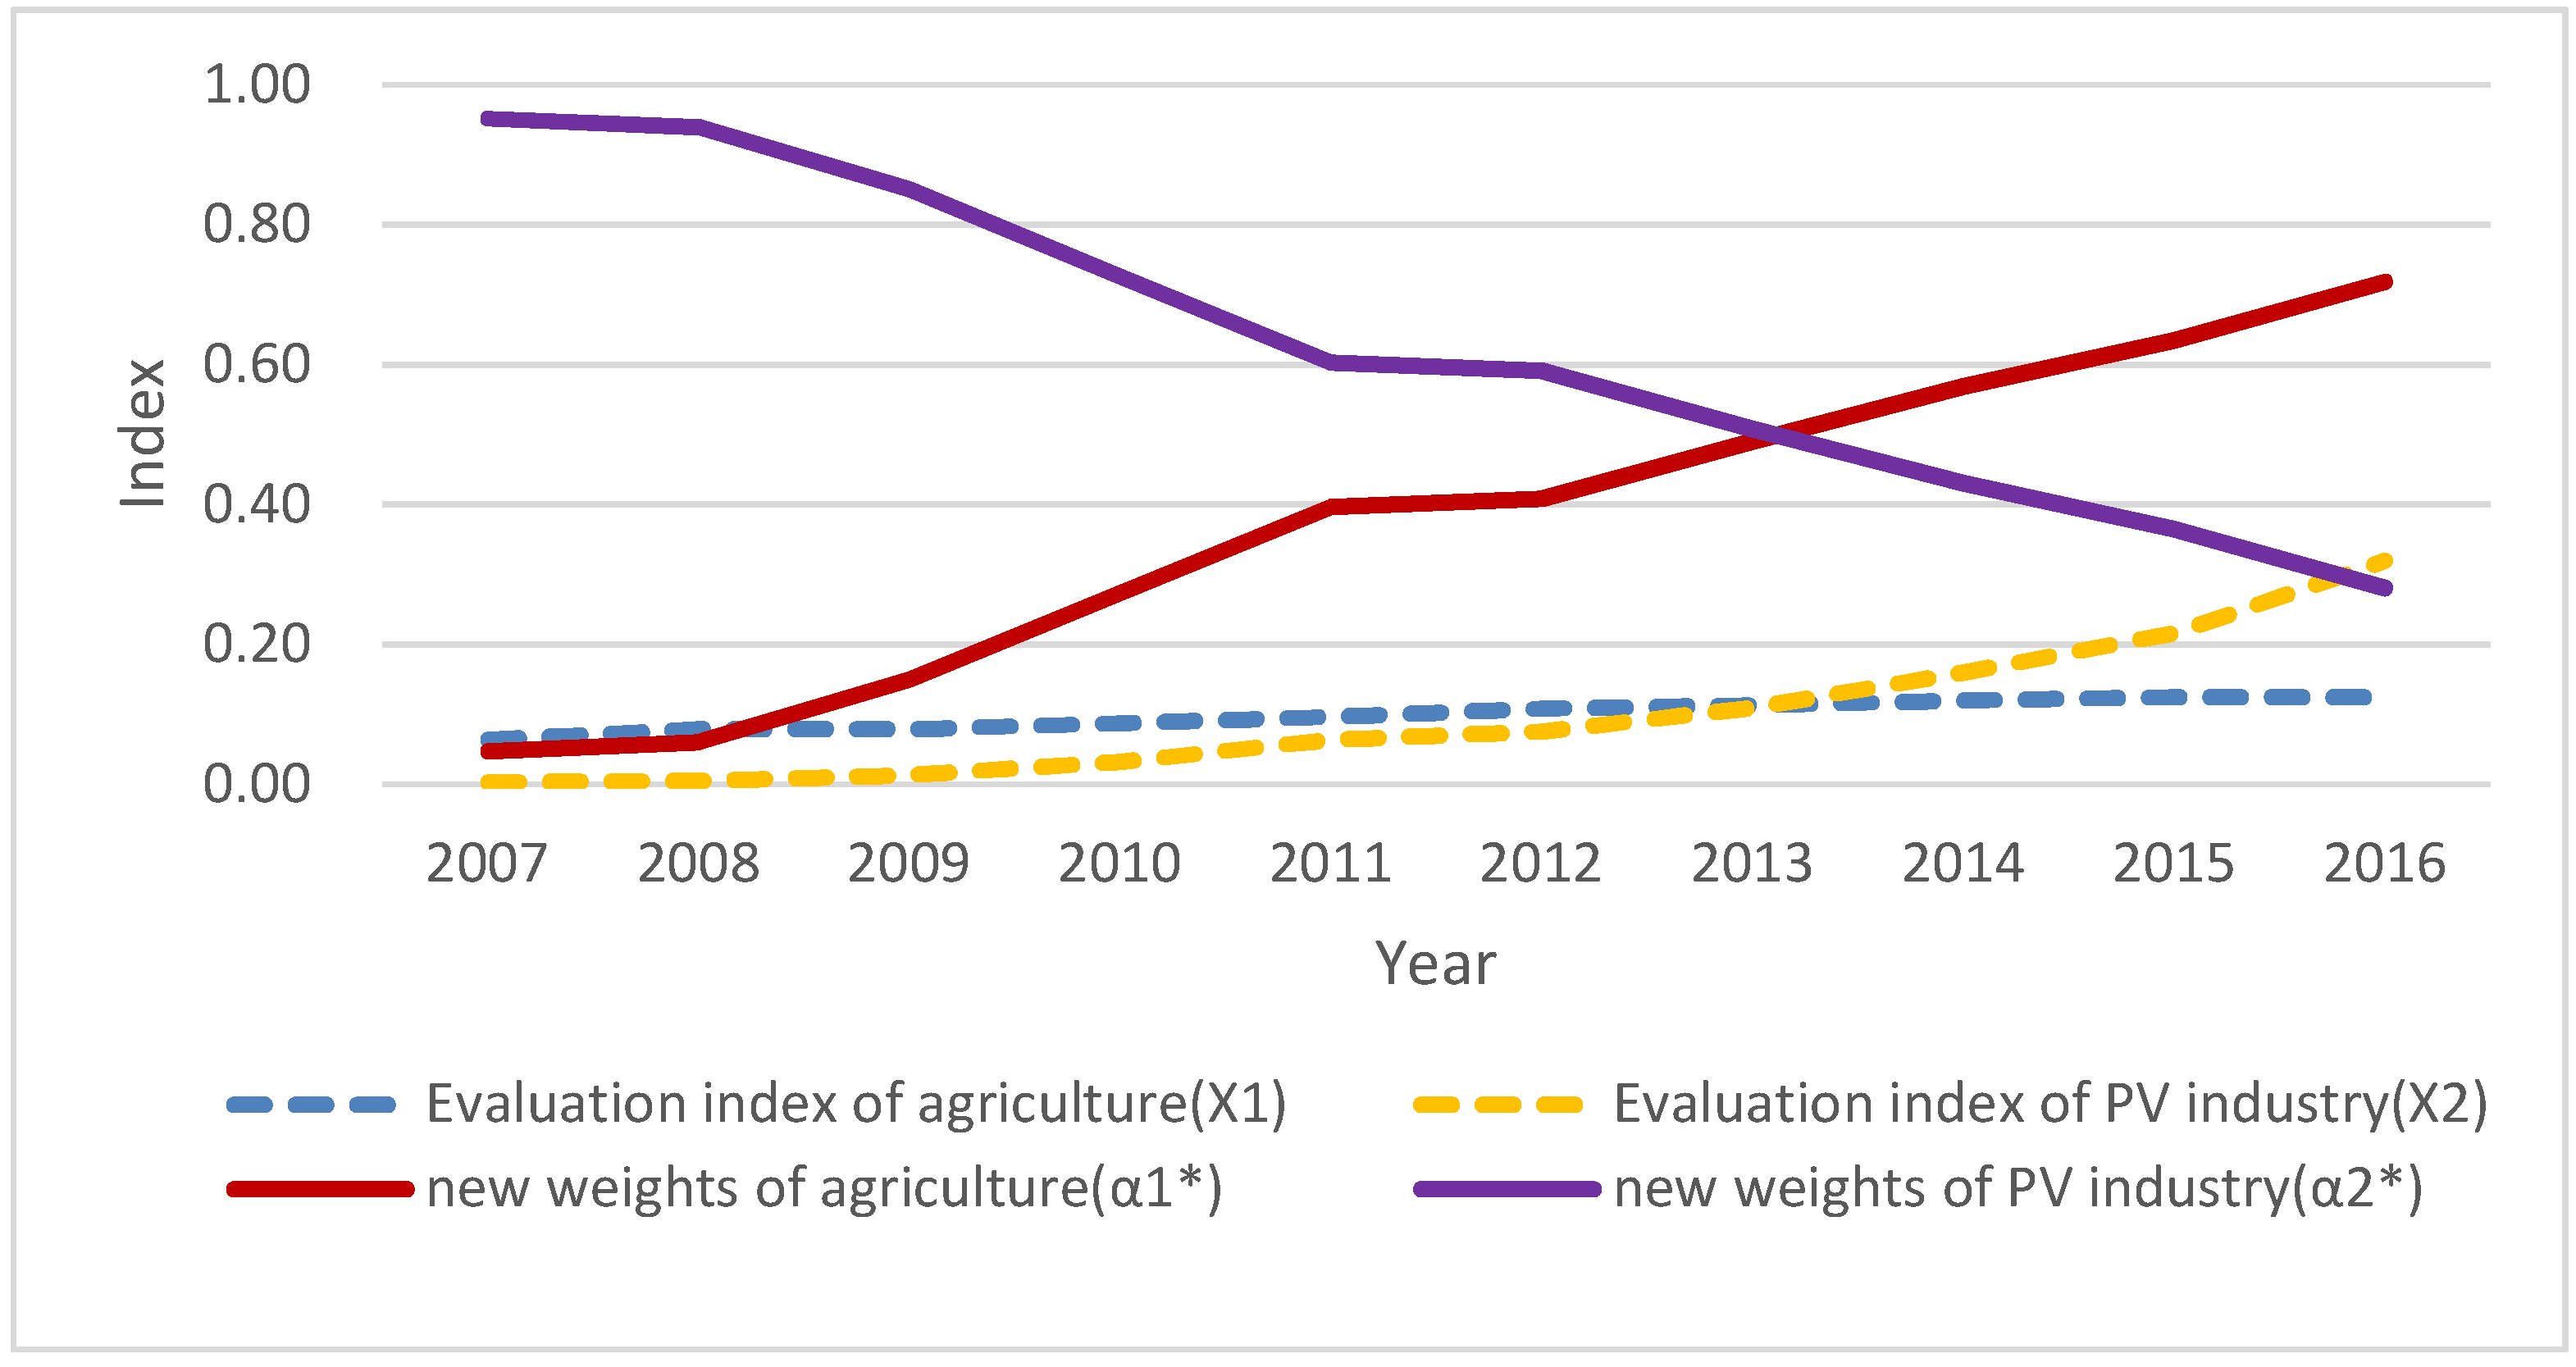
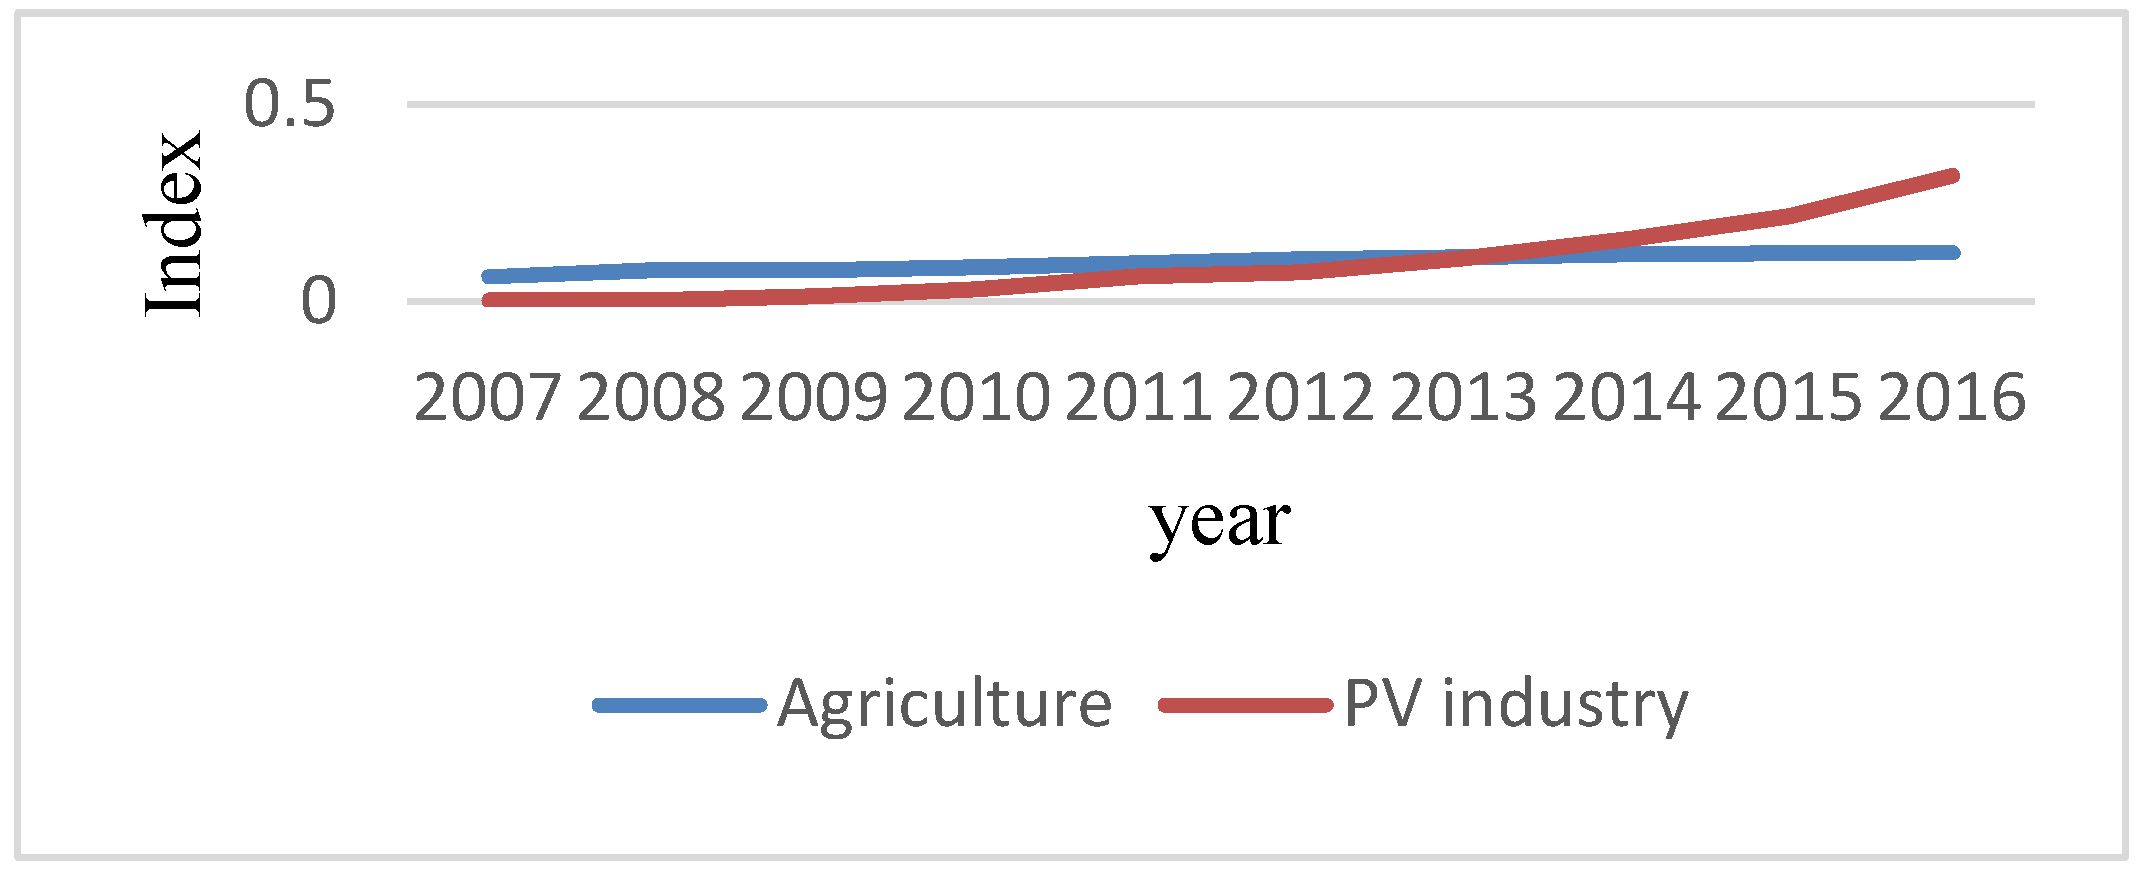
| Evaluation index of agriculture () | 0.0638 | 0.0797 | 0.0793 | 0.0869 | 0.0974 | 0.1091 | 0.1138 | 0.1207 | 0.1244 | 0.1249 |
| Evaluation index of the PV industry () | 0.0032 | 0.0051 | 0.0139 | 0.0328 | 0.0641 | 0.0754 | 0.1098 | 0.1596 | 0.2163 | 0.3198 |
| 19.9375 | 15.6275 | 5.7050 | 2.6494 | 1.5195 | 1.4470 | 1.0364 | 0.7563 | 0.5751 | 0.3906 |
| 2007 | 2008 | 2009 | 2010 | 2011 | 2012 | 2013 | 2014 | 2015 | 2016 | |
|---|---|---|---|---|---|---|---|---|---|---|
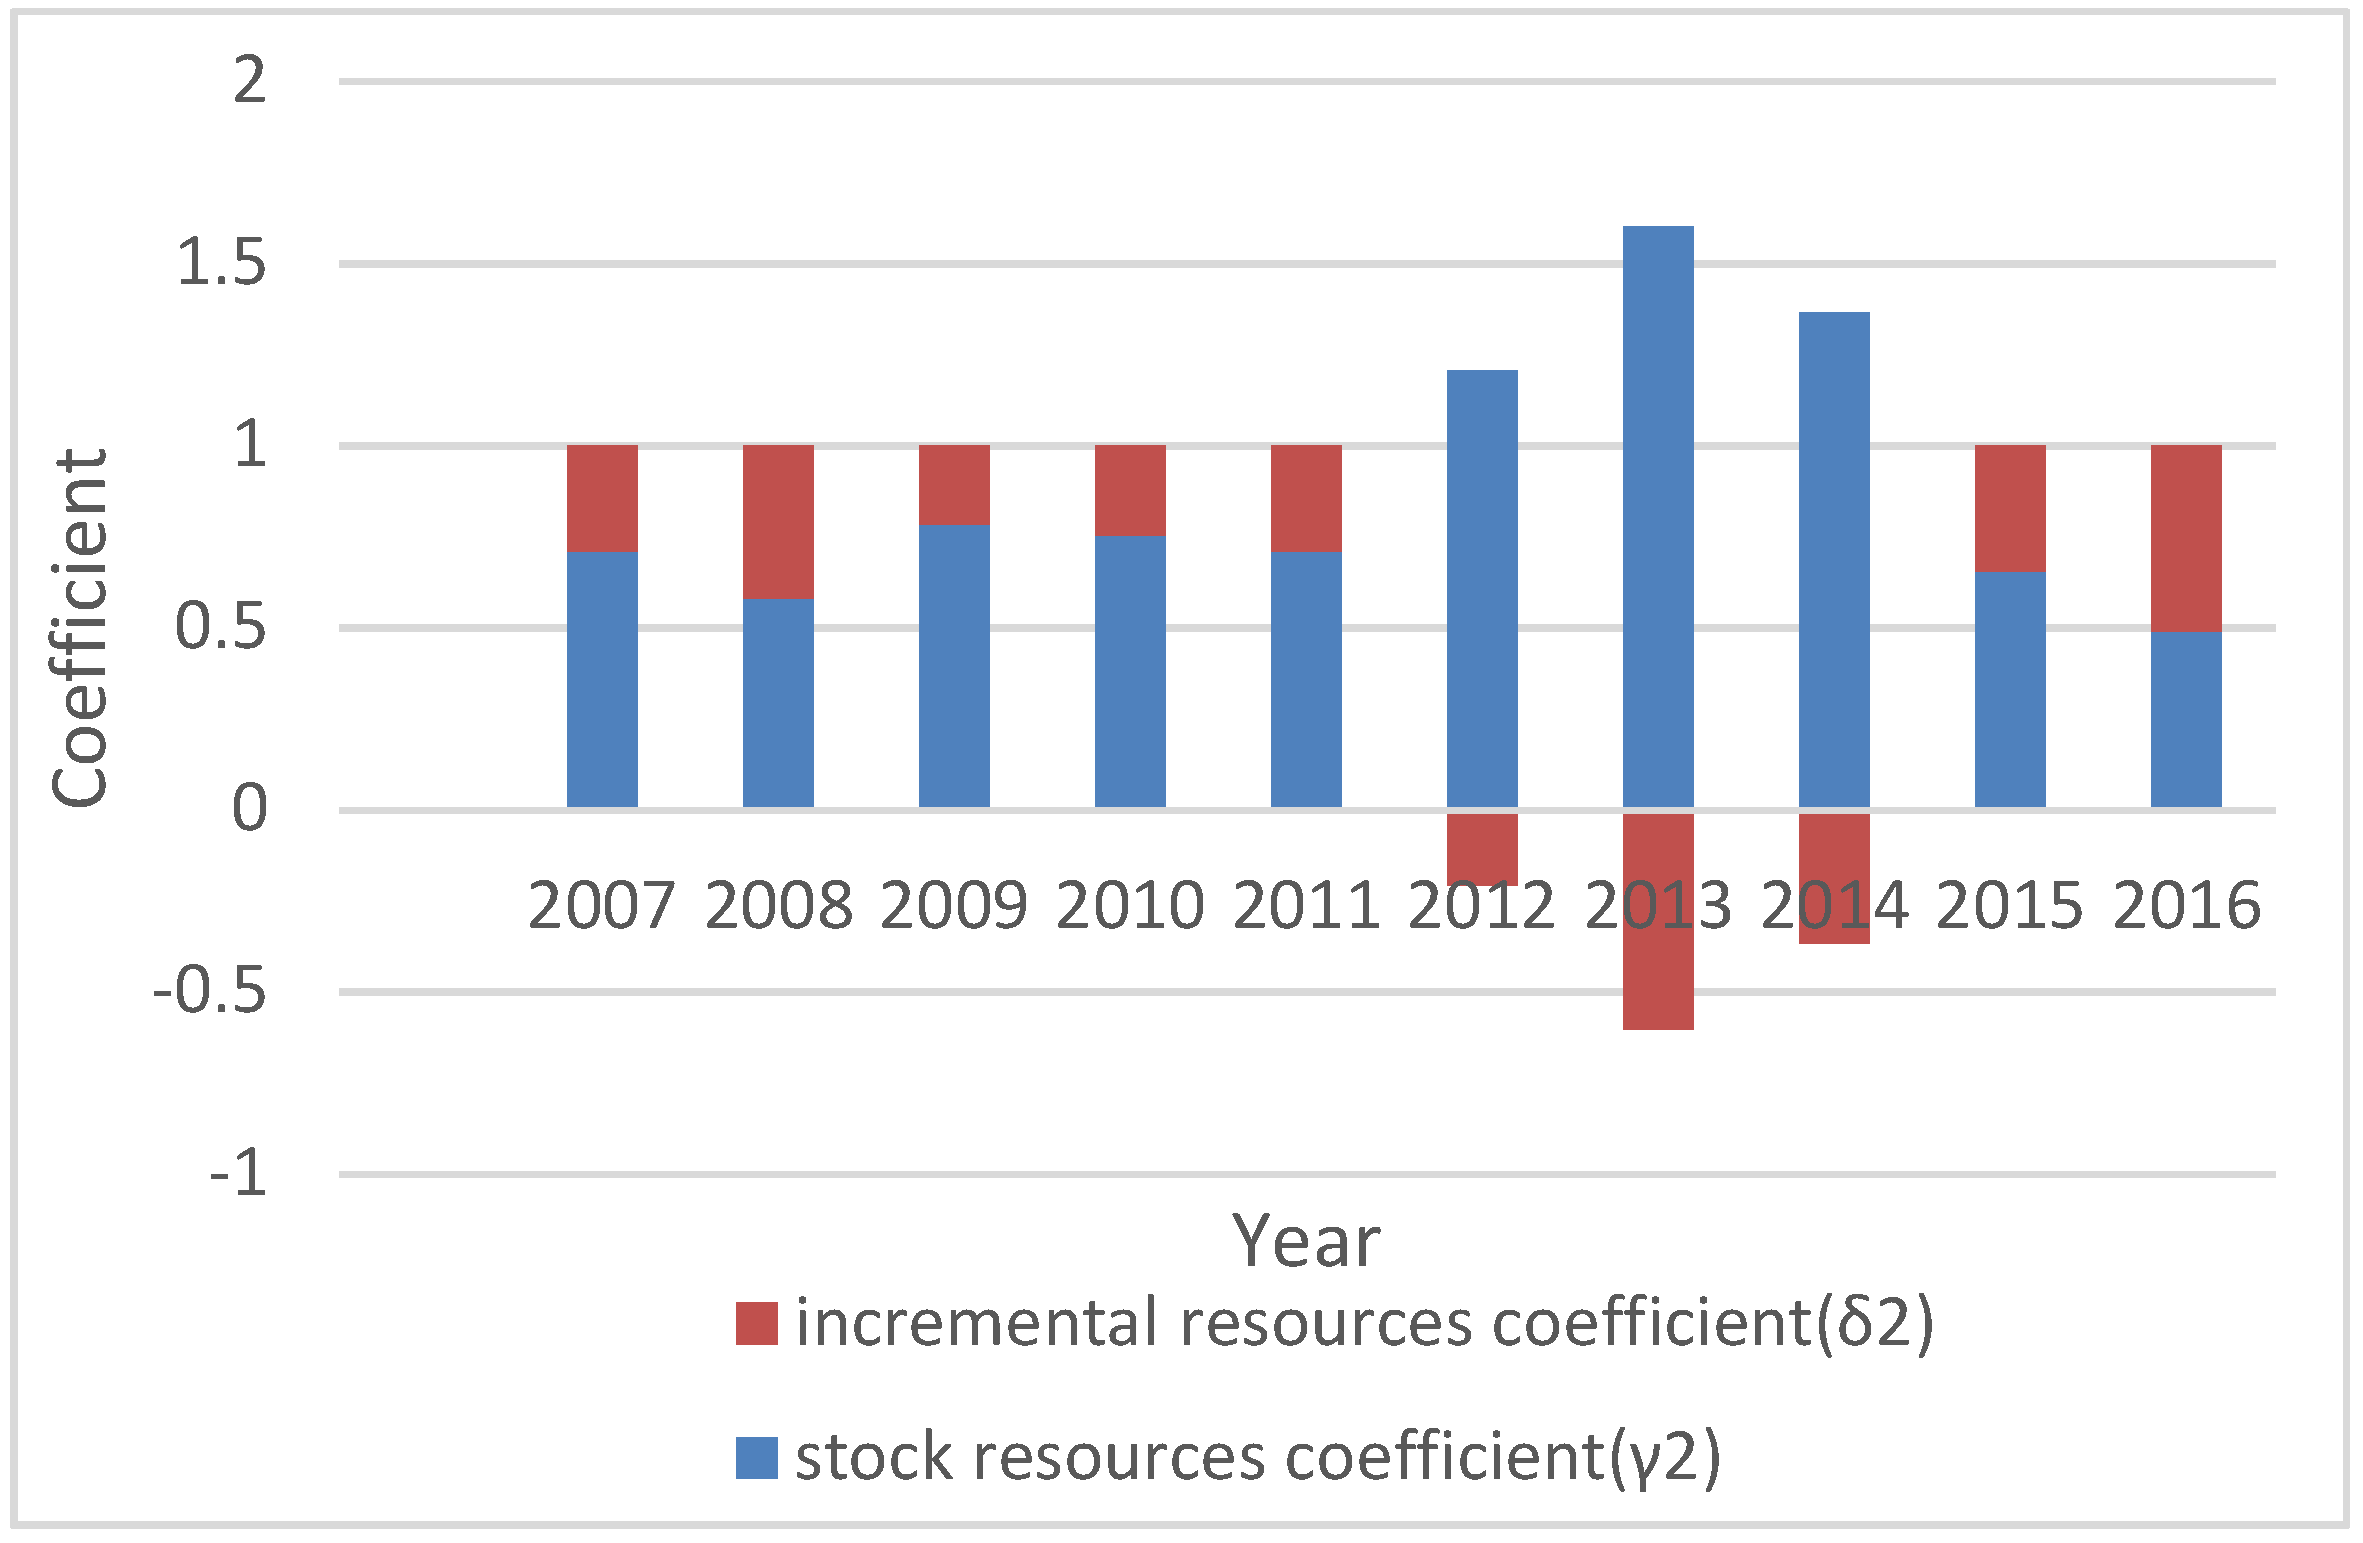
| Agricultural stock resources coefficient | 0.8859 | 0.8839 | 1.1996 | 1.3907 | 0.8285 | 0.9740 | 0.9405 | 0.1643 | 0.6482 | 0.8227 |
| Agricultural incremental resources coefficient | 0.1141 | 0.1161 | -0.1996 | -0.3907 | 0.1715 | 0.0260 | 0.0595 | 0.8357 | 0.3518 | 0.1773 |
| PV industry stock resources coefficient | 0.7083 | 0.5818 | 0.7845 | 0.7539 | 0.7090 | 1.2066 | 1.6027 | 1.3662 | 0.6558 | 0.4908 |
| PV industry incremental resources coefficient ( | 0.2917 | 0.4182 | 0.2155 | 0.2461 | 0.2910 | -0.2066 | -0.6027 | -0.3662 | 0.3442 | 0.5092 |
Appendix C
| α1 = 0.1 α2 = 0.9 | α1 = 0.2 α2 = 0.8 | α1 = 0.3 α2 = 0.7 | α1 = 0.4 α2 = 0.6 | α1 = 0.5 α2 = 0.5 | α1 = 0.6 α2 = 0.4 | α1 = 0.7 α2 = 0.3 | α1 = 0.8 α2 = 0.2 | α1 = 0.9 α2 = 0.1 | |
|---|---|---|---|---|---|---|---|---|---|
| 2007 | 0.0628 | 0.0808 | 0.0955 | 0.1082 | 0.1195 | 0.1299 | 0.1395 | 0.1485 | 0.1569 |
| 2008 | 0.0773 | 0.0976 | 0.1143 | 0.1289 | 0.1420 | 0.1540 | 0.1651 | 0.1755 | 0.1853 |
| 2009 | 0.1207 | 0.1386 | 0.1545 | 0.1689 | 0.1822 | 0.1946 | 0.2062 | 0.2172 | 0.2277 |
| 2010 | 0.1846 | 0.1973 | 0.2091 | 0.2204 | 0.2311 | 0.2413 | 0.2511 | 0.2605 | 0.2696 |
| 2011 | 0.2569 | 0.2631 | 0.2693 | 0.2752 | 0.2811 | 0.2868 | 0.2925 | 0.2980 | 0.3034 |
| 2012 | 0.2783 | 0.2842 | 0.2900 | 0.2956 | 0.3012 | 0.3066 | 0.3120 | 0.3172 | 0.3224 |
| 2013 | 0.3319 | 0.3325 | 0.3331 | 0.3337 | 0.3343 | 0.3349 | 0.3355 | 0.3361 | 0.3367 |
| 2014 | 0.3927 | 0.3878 | 0.3828 | 0.3777 | 0.3726 | 0.3673 | 0.3621 | 0.3567 | 0.3513 |
| 2015 | 0.4466 | 0.4366 | 0.4263 | 0.4158 | 0.4050 | 0.3939 | 0.3825 | 0.3708 | 0.3587 |
| 2016 | 0.5195 | 0.5024 | 0.4847 | 0.4662 | 0.4471 | 0.4270 | 0.4060 | 0.3838 | 0.3603 |
| X1 | X2 | α1 * | α2 * | P * | C | D * | Coordination Type | |
|---|---|---|---|---|---|---|---|---|
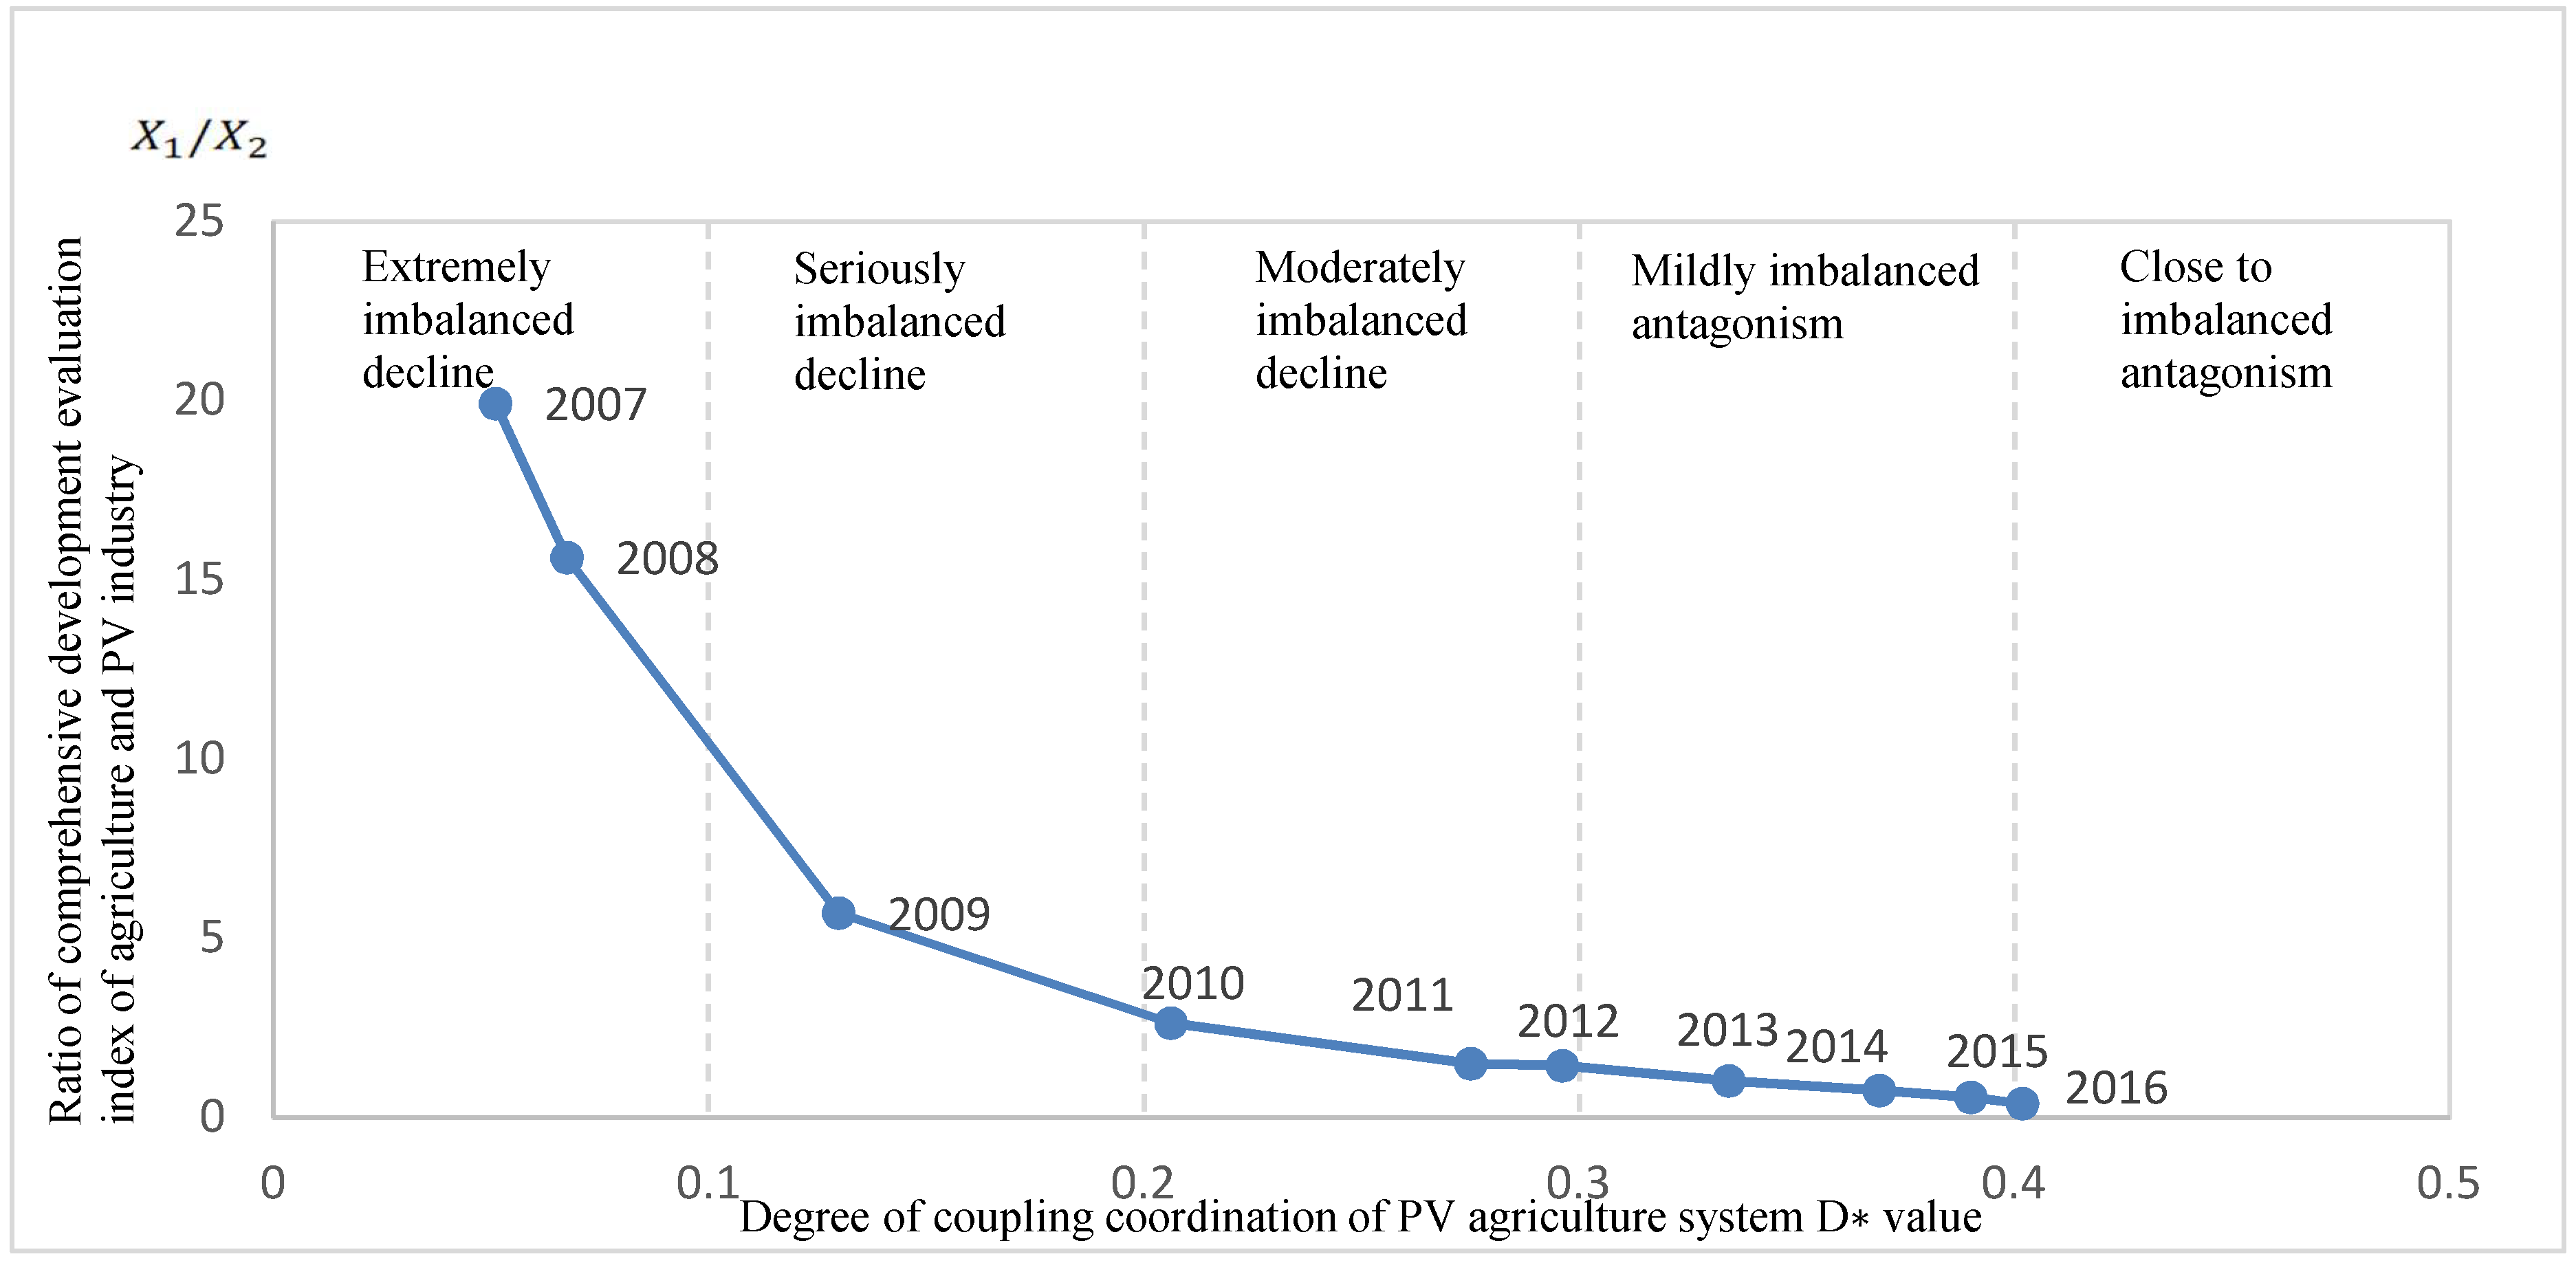
| 2007 | 0.0638 | 0.0032 | 0.0478 | 0.9522 | 0.0061 | 0.4265 | 0.0510 | Extremely imbalanced decline |
| 2008 | 0.0797 | 0.0051 | 0.0601 | 0.9399 | 0.0096 | 0.4755 | 0.0675 | Extremely imbalanced decline |
| 2009 | 0.0793 | 0.0139 | 0.1491 | 0.8509 | 0.0237 | 0.7125 | 0.1298 | Seriously imbalanced decline |
| 2010 | 0.0869 | 0.0328 | 0.2740 | 0.7260 | 0.0476 | 0.8920 | 0.2061 | Moderately imbalanced decline |
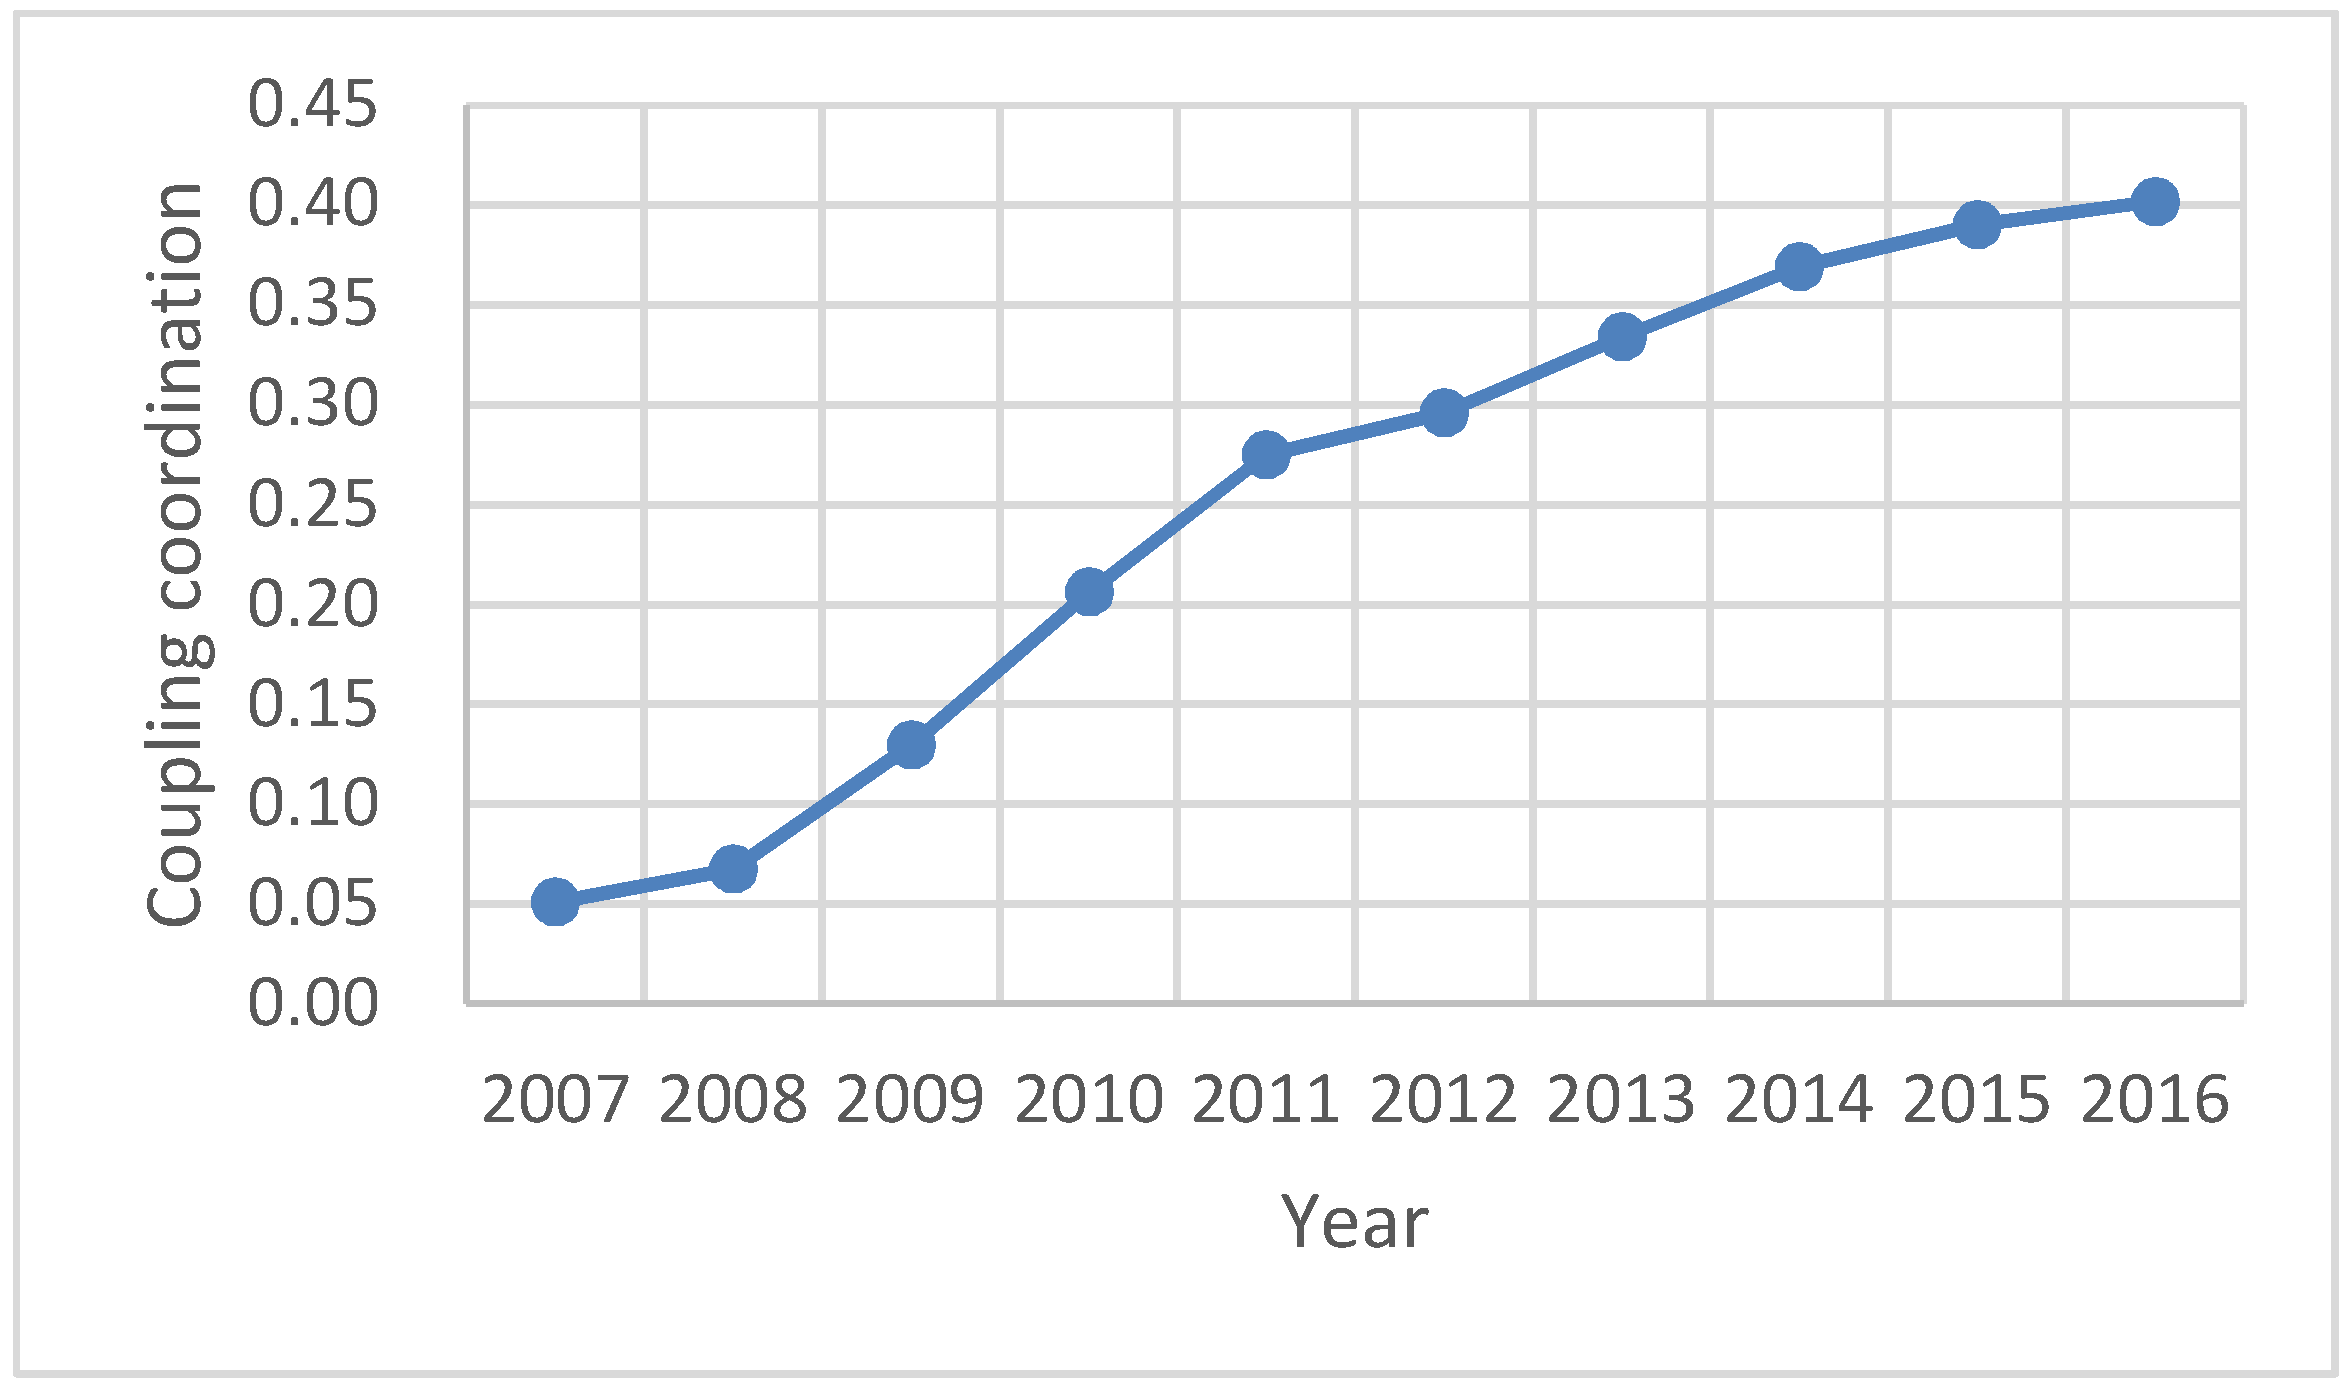
| 2011 | 0.0974 | 0.0641 | 0.3969 | 0.6031 | 0.0773 | 0.9785 | 0.2751 | Moderately imbalanced decline |
| 2012 | 0.1091 | 0.0754 | 0.4087 | 0.5913 | 0.0892 | 0.9832 | 0.2961 | Moderately imbalanced decline |
| 2013 | 0.1138 | 0.1098 | 0.4911 | 0.5089 | 0.1118 | 0.9998 | 0.3343 | Mildly imbalanced antagonism |
| 2014 | 0.1207 | 0.1596 | 0.5694 | 0.4306 | 0.1375 | 0.9903 | 0.3689 | Mildly imbalanced antagonism |
| 2015 | 0.1244 | 0.2163 | 0.6349 | 0.3651 | 0.1580 | 0.9629 | 0.3900 | Mildly imbalanced antagonism |
| 2016 | 0.1249 | 0.3198 | 0.7191 | 0.2809 | 0.1796 | 0.8988 | 0.4018 | Close to imbalanced antagonism |
References
- Brainard, W.A. The worldwide market for photovoltaics in the rural sector. In Proceedings of the IEEE Photovoltaic Specialists Conference, San Diego, CA, USA, 27–30 September 1982; pp. 1308–1313. [Google Scholar]
- Jarach, M. An overview of the literature on barriers to the diffusion of renewable energy sources in agriculture. Appl. Energy 1989, 32, 117–131. [Google Scholar] [CrossRef]
- Brudermann, T.; Reinsberger, K.; Orthofer, A.; Kislinger, M.; Posch, A. Photovoltaics in agriculture: A case study on decision making of farmers. Energy Policy 2013, 61, 96–103. [Google Scholar] [CrossRef]
- Dinesh, H.; Pearce, J.M. The potential of agrivoltaic systems. Renew. Sustain. Energy Rev. 2016, 54, 299–308. [Google Scholar] [CrossRef]
- Xue, J. Photovoltaic agriculture - New opportunity for photovoltaic applications in China. Renew. Sustain. Energy Rev. 2017, 73, 1–9. [Google Scholar] [CrossRef]
- Katzman, M.T.; Matlin, R.W. The Economics of Adopting Solar Energy Systems for Crop Irrigation. Am. J. Agric. Econ. 1978, 60, 648–654. [Google Scholar] [CrossRef]
- Radulovic, V. Are new institutional economics enough? Promoting photovoltaics in India’s agricultural sector. Energy Policy 2005, 33, 1883–1899. [Google Scholar] [CrossRef]
- Mousazadeh, H.; Keyhani, A.; Mobli, H.; Bardi, U.; Lombardi, G.; el Asmar, T. Technical and economical assessment of a multipurpose electric vehicle for farmers. J. Clean. Prod. 2009, 17, 1556–1562. [Google Scholar] [CrossRef] [Green Version]
- Fang, Y.D.; Huang, S.H.; Qing, S.X.; Shen, W.J.; Wei, D.; Yang, M.X.; Zheng, B.; Li, Y.J. Analysis of Development Status and Prospect of Photovoltaic Agriculture. J. Chang. Veg. 2015, 18, 35–40. [Google Scholar] [CrossRef]
- Malu, P.R.; Sharma, U.S.; Pearce, J.M. Agrivoltaic potential on grape farms in India. Sustain. Energy Technol. Assess. 2017, 23, 104–110. [Google Scholar] [CrossRef]
- Campana, P.E.; Leduc, S.; Kim, M.; Olsson, A.; Zhang, J.; Liu, J.; Kraxner, F.; McCallum, I.; Li, H.; Yan, J. Suitable and optimal locations for implementing photovoltaic water pumping systems for grassland irrigation in China. Appl. Energy 2016, 185, 1879–1889. [Google Scholar] [CrossRef]
- García, A.M.; García, I.F.; Poyato, E.C.; Barrios, P.M.; Díaz, J.R. Coupling irrigation scheduling with solar energy production in a smart irrigation management system. J. Clean. Prod. 2018, 175, 670–682. [Google Scholar] [CrossRef]
- Elamria, Y.; Chevirona, B.; Lopezc, J.-M.; Dejean, C.; Belaud, G. Water budget and crop modelling for agrivoltaic systems: Application to irrigated lettuces. Agric. Water Manag. 2018, 30, 440–453. [Google Scholar] [CrossRef]
- Xue, J. Assessment of agricultural electric vehicles based on photovoltaics in China. J. Renew. Sustain. Energy 2013, 5, 6745–6759. [Google Scholar] [CrossRef]
- Bey, M.; Hamidat, A.; Benyoucef, B.; Nacer, T. Viability study of the use of grid connected photovoltaic system in agriculture: Case of Algerian dairy farms. Renew. Sustain. Energy Rev. 2016, 63, 333–345. [Google Scholar] [CrossRef]
- Hassanien, R.H.E.; Ming, L.; Wei, D.L. Advanced applications of solar energy in agricultural greenhouses. Renew. Sustain. Energy Rev. 2016, 54, 989–1001. [Google Scholar] [CrossRef]
- Wang, T.; Wu, G.; Chen, J.; Cui, P.; Chen, Z.; Yan, Y.; Zhang, Y.; Li, M.; Niu, D.; Li, B.; et al. Integration of solar technology to modern greenhouse in China: Current status, challenges and prospect. Renew. Sustain. Energy Rev. 2017, 70, 1178–1188. [Google Scholar] [CrossRef]
- Li, C.; Wang, H.; Miao, H.; Ye, B. The economic and social performance of integrated photovoltaic and agricultural greenhouses systems: Case study in China. Appl. Energy 2017, 190, 204–212. [Google Scholar] [CrossRef]
- Jones, M.A.; Odeh, I.; Haddad, M.; Mohammad, A.H.; Quinn, J.C. Economic analysis of photovoltaic (PV) powered water pumping and desalination without energy storage for agriculture. Desalination 2016, 387, 35–45. [Google Scholar] [CrossRef]
- Vadiee, A.; Yaghoubi, M. Enviro-economic assessment of energy conservation methods in commercial greenhouses in Iran. Outlook Agric. 2016, 45, 47–53. [Google Scholar] [CrossRef]
- Saini, V.; Tiwari, S.; Tiwari, G.N. Environ economic analysis of various types of photovoltaic technologies integrated with greenhouse solar drying system. J. Clean. Prod. 2017, 156, 30–40. [Google Scholar] [CrossRef]
- Wettstein, S.; Muir, K.; Scharfy, D.; Stucki, M. The Environmental Mitigation Potential of Photovoltaic-Powered Irrigation in the Production of South African Maize. Sustainability 2017, 9, 1772. [Google Scholar] [CrossRef]
- Yang, Y.Z. Methodology Review of Coupling and Coordinating Ecology, Environment and Economy System in China. Sci. Technol. Manag. Res. 2013, 33, 236–239. [Google Scholar] [CrossRef]
- Liang, W.; Liu, M.F. A Study on the Coupling and Coordinated Development and Tempo-Spatial Variation of China’s Strategic Emerging Industries and Traditional Industries. Econ. Geogr. 2017, 37, 117–126. [Google Scholar] [CrossRef]
- Zhang, G.H.; Liu, Z.Z.; Wang, X.Y. Analysis and forecast of coupling degree between tourism-oriented development and eco-environment in coastal region of China. Ecol. Environ. Sci. 2013, 22, 792–800. [Google Scholar] [CrossRef]
- Feng, X. Coupling Relationship between Urbanization and Ecological Environment of Xinjiang. Areal Res. Dev. 2016, 35, 123–127. [Google Scholar] [CrossRef]
- Tang, X.H.; Zhang, X.J.; Li, Y. Dynamic Coordination Development in China’s Manufacturing and Manufacturing-related Service Industries. Econ. Res. J. 2018, 53, 79–93. [Google Scholar]
- Zhou, C.; Feng, X.G.; Tang, R. Analysis and Forecast of Coupling Coordination Development among the Regional Economy-Ecological Environment-Tourism Industry—A Case Study of Provinces Along the Yangtze Economic Zone. Econ. Geogr. 2016, 36, 186–193. [Google Scholar] [CrossRef]
- Li, Y.; Li, Y.; Zhou, Y.; Shi, Y.; Zhu, X. Investigation of a coupling model of coordination between urbanization and the environment. J. Environ. Manag. 2012, 98, 127–133. [Google Scholar] [CrossRef]
- Li, J.; Fang, H.; Fang, S.R.; Siddika, S. Investigation of the Relationship among University–Research Institute–Industry Innovations Using a Coupling Coordination Degree Model. Sustainability 2018, 10, 1954. [Google Scholar] [CrossRef]
- Wang, Z.B.; Wang, H.; Guo, B.H. Coupling Improved Model and the Empirical Study of Regional Innovation System. Chin. J. Manag. Sci. 2014, 22, 566–573. [Google Scholar] [CrossRef]
- Zhang, D.N.; Cheng, Y. Study on Development Level and Mode of Equipment Manufacturing Industry in China. J. Quant. Tech. Econ. 2014, 31, 99–114. [Google Scholar] [CrossRef]
- Valerie. The Penguin Dictionary of Physics; Penguinuk: London, UK, 2009; ISBN 978-014-103-683-0. [Google Scholar]
- Shen, L.Y.; Huang, Y.L.; Huang, Z.H.; Lou, Y.; Ye, G.; Wong, S.W. Improved coupling analysis on the coordination between socio-economy and carbon emission. Ecol. Indic 2018, 94, 357–366. [Google Scholar] [CrossRef]
- Haken, H. Synergetics: An Introduction, Nonequilibrium Phase Transitions and Self-Organization in Physics, Chemistry and Biology; Springer: New York, NY, USA, 1977; ISBN 978-364-296-363-6. [Google Scholar]
- Braden, J.B.; Kolstad, C.D. Measuring the demand for environmental quality. Am. J. Agric. Econ. 1993, 75, 244–245. [Google Scholar] [CrossRef]
- Liao, C.B. Quantitative Judgement and Classification System for Coordinated Development of Enviroment and Economy—A Case Study of the City Group in the Pearl River Delta. Trop. Geographys. 1999, 2, 76–82. [Google Scholar] [CrossRef]
- Yang, Y.; Wei, Z.S. Spatial-temporal Characterstics and Coupling Effect of Double- innovation Ability in China. J. Quant. Techn. Econ. 2018, 35, 3–22. [Google Scholar] [CrossRef]
- Xiang, L.; Hu, L.Y. Study on the Coupling and Coordination of Tourism Industry and Urban Living Environment in the Yangtze River Economic Belt. Inq. Econ. Issues 2018, 4, 80–89. [Google Scholar]
- Deng, J.L. Grey System Theory Tutorial; Huanzhong University of Science and Technology Press: Wuhan, China, 1990; ISBN 978-756-090-447-4. [Google Scholar]
- Liu, S.F.; Deng, J.L. Scope of the GM(1,1) model. Syst. Eng.-Theory Pract. 2000, 5, 121–124. [Google Scholar]
- Tang, W.M.; Xiang, C.H. The Improvements of Forecasting Method in GM(1,1)Model Based on Quadratic Interpolation. Chin. J. Manag. Sci. 2006, 6, 109–112. [Google Scholar] [CrossRef]
- Shi, P.F.; Ling, X.M.; Xiong, Y.B. Coupling Measurement and Prospect Forecast of Regional “Beautiful China” Construction and Tourism Industry Development—A Case Study of 11 Provinces along the Yangtze River Economic Belt. China Soft Sci. 2018, 2, 86–102. [Google Scholar] [CrossRef]


| Subsystem | Evaluation Indication | Unit | Subsystem | Evaluation Indication | Unit |
|---|---|---|---|---|---|
| Agriculture A | Contribution rate A1 | % | PV industry P | Polysilicon production P1 | 104 tons |
| Gross output value A2 | 109 USD | Silicon wafer production P2 | GW | ||
| Crop planting area A3 | 103 hectare | Cell production P3 | GW | ||
| Rural electricity consumption A4 | 109 kW·h | PV module production P4 | GW | ||
| Agricultural machinery total power A5 | 104 KW | Cumulative installed capacity P5 | GW |
| No. | Coordination Range | Coordination Type | Coordination Subtype | No. | Coordination Range | Coordination Type | Coordination Subtype |
|---|---|---|---|---|---|---|---|
| 1 | 0.00–0.09 | Decline | Extreme imbalance | 6 | 0.50–0.59 | Running-in | Reluctant coordination |
| 2 | 0.10–0.19 | Serious imbalance | 7 | 0.60–0.69 | Primary coordination | ||
| 3 | 0.20–0.29 | Moderate imbalance | 8 | 0.70–0.79 | Development | Intermediate coordination | |
| 4 | 0.30–0.39 | Antagonism | Mild imbalance | 9 | 0.80–0.89 | Good coordination | |
| 5 | 0.40–0.49 | Close to imbalance | 10 | 0.90–1.00 | Quality coordination |
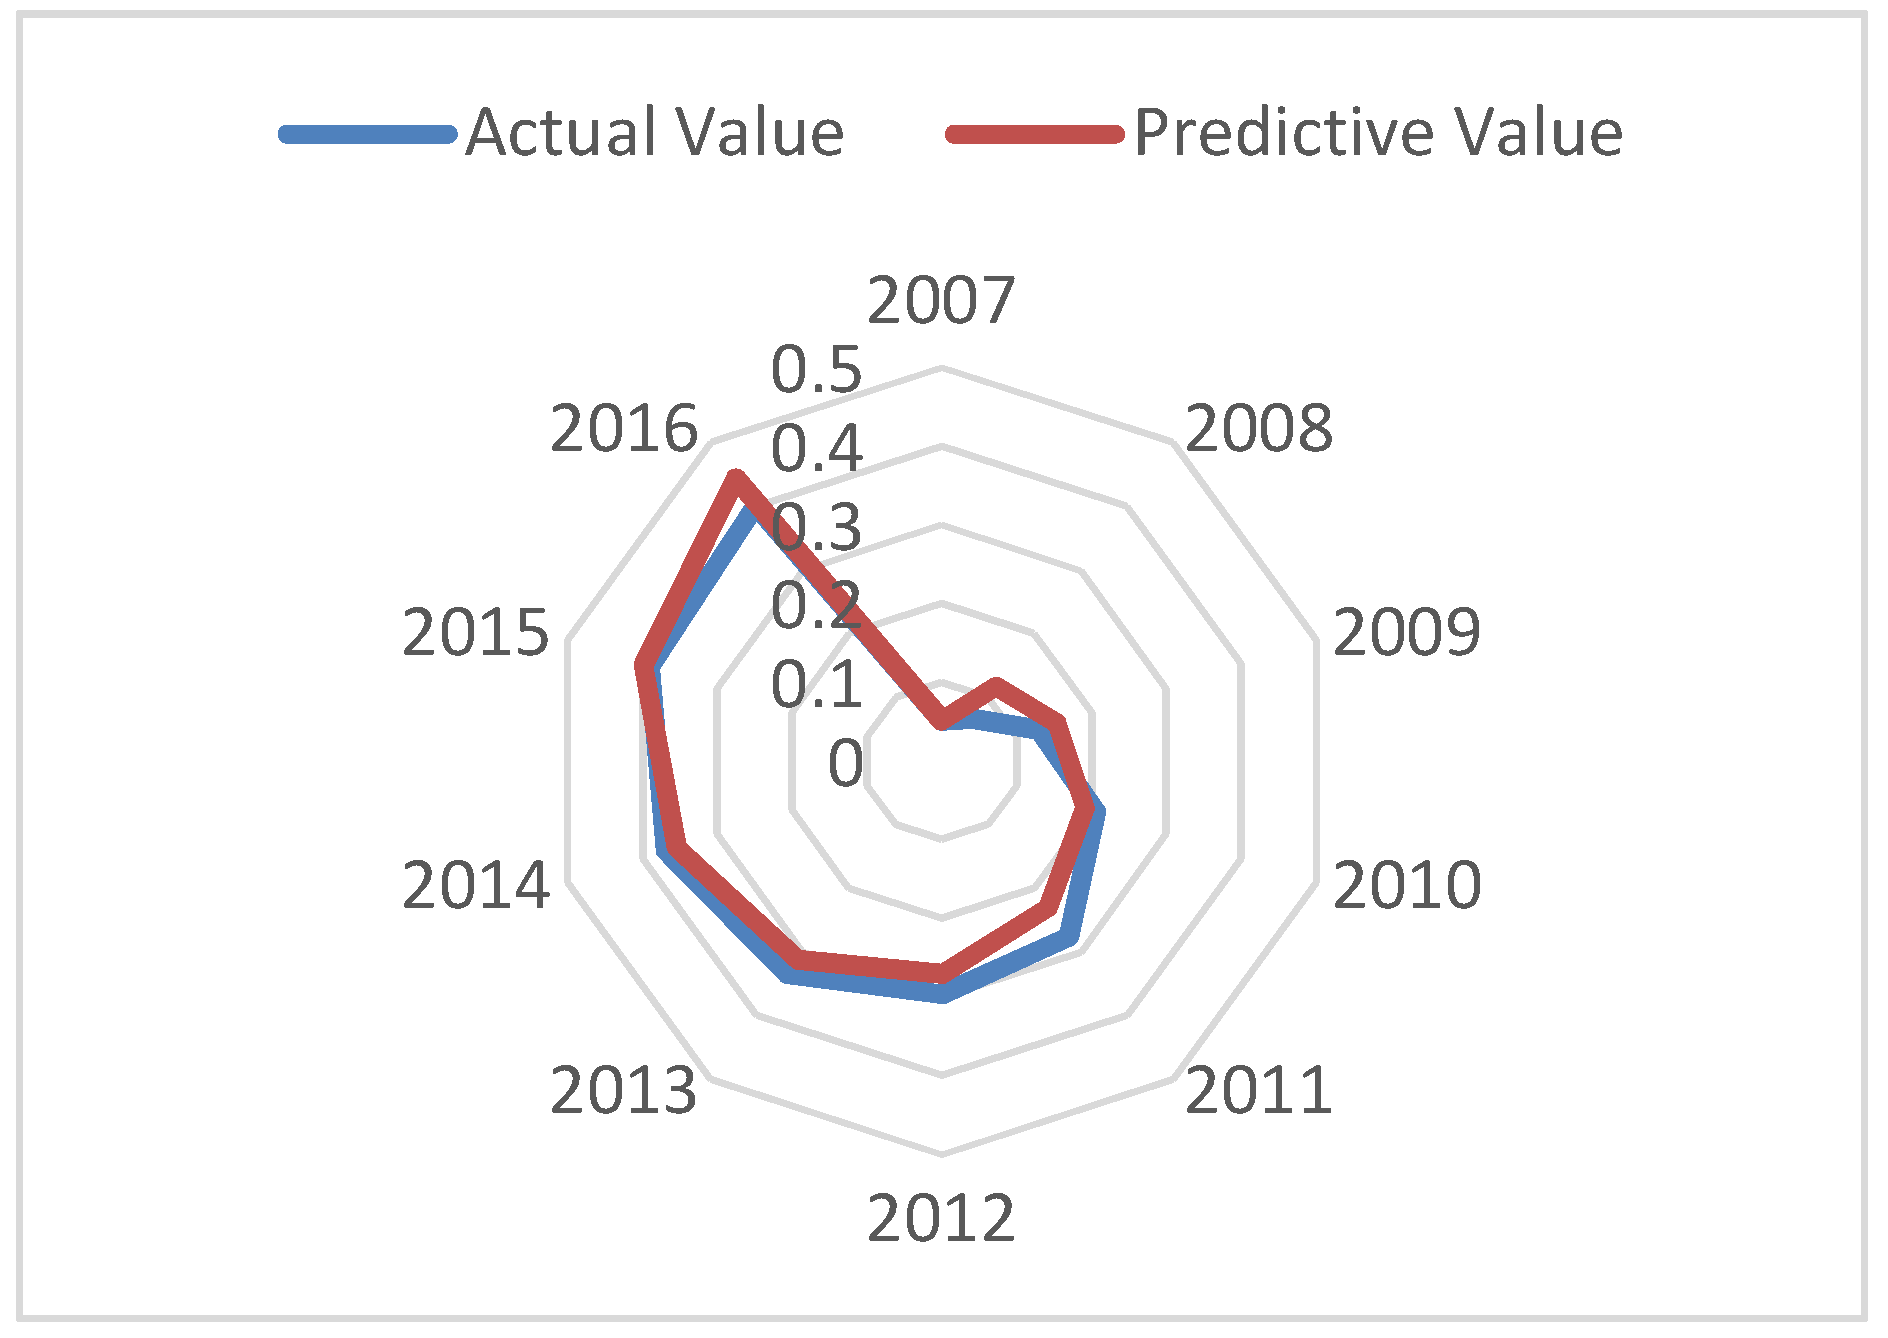
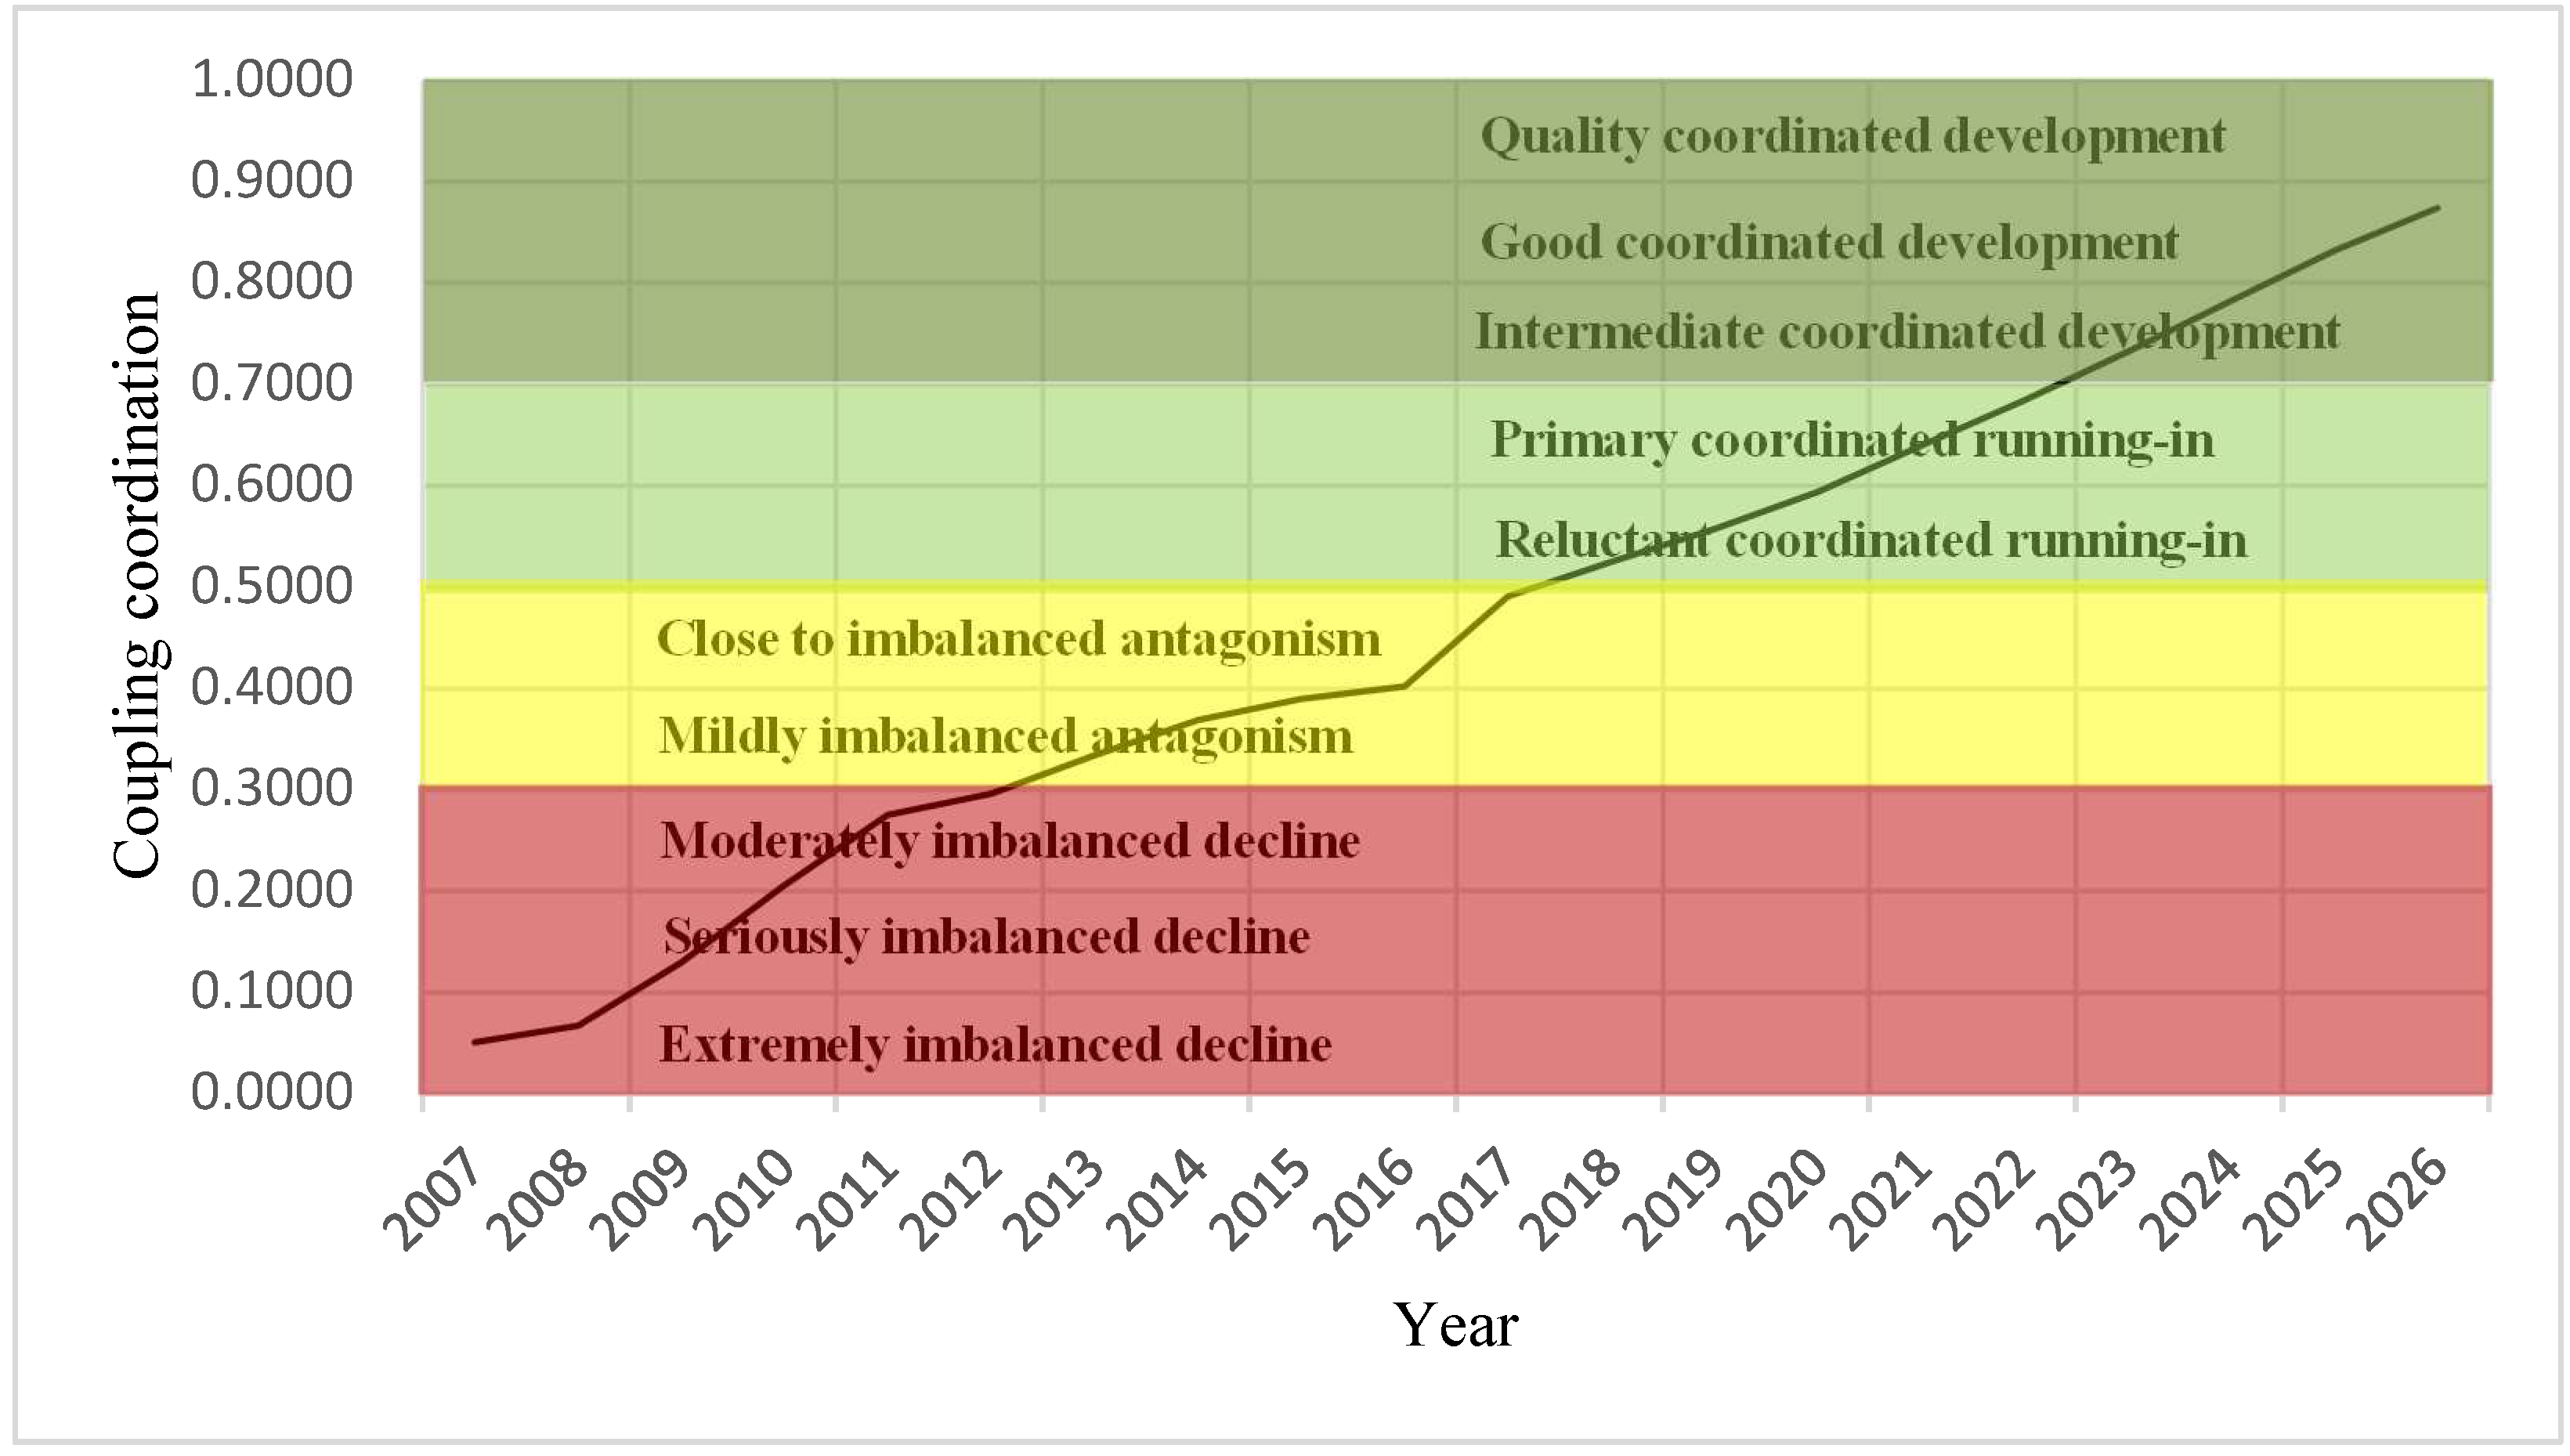
| Year | Actual Value | Predictive Value | Coordination Type | Year | Predictive Value | Coordination Type |
|---|---|---|---|---|---|---|
| 2007 | 0.0510 | 0.0510 | Extremely imbalanced decline | 2017 | 0.4913 | Close to imbalanced antagonism |
| 2008 | 0.0675 | 0.1170 | Extremely/Seriously imbalanced decline | 2018 | 0.5250 | Reluctant coordinated running-in |
| 2009 | 0.1298 | 0.1535 | Seriously imbalanced decline | 2019 | 0.5573 | Reluctant coordinated running-in |
| 2010 | 0.2061 | 0.1911 | Moderately/Seriously imbalanced decline | 2020 | 0.5941 | Reluctant coordinated running-in |
| 2011 | 0.2751 | 0.2300 | Moderately imbalanced decline | 2021 | 0.6391 | Primary coordinated running-in |
| 2012 | 0.2961 | 0.2701 | Moderately imbalanced decline | 2022 | 0.6840 | Primary coordinated running-in |
| 2013 | 0.3343 | 0.3116 | Mildly imbalanced antagonism | 2023 | 0.7319 | Intermediate coordinated development |
| 2014 | 0.3689 | 0.3544 | Mildly imbalanced antagonism | 2024 | 0.7826 | Intermediate coordinated development |
| 2015 | 0.3900 | 0.3985 | Mildly imbalanced antagonism | 2025 | 0.8320 | Good coordinated development |
| 2016 | 0.4018 | 0.4442 | Close to imbalanced antagonism | 2026 | 0.8742 | Good coordinated development |
© 2019 by the authors. Licensee MDPI, Basel, Switzerland. This article is an open access article distributed under the terms and conditions of the Creative Commons Attribution (CC BY) license (http://creativecommons.org/licenses/by/4.0/).
Share and Cite
Chen, J.; Liu, Y.; Wang, L. Research on Coupling Coordination Development for Photovoltaic Agriculture System in China. Sustainability 2019, 11, 1065. https://doi.org/10.3390/su11041065
Chen J, Liu Y, Wang L. Research on Coupling Coordination Development for Photovoltaic Agriculture System in China. Sustainability. 2019; 11(4):1065. https://doi.org/10.3390/su11041065
Chicago/Turabian StyleChen, Jian, Yiping Liu, and Lingjun Wang. 2019. "Research on Coupling Coordination Development for Photovoltaic Agriculture System in China" Sustainability 11, no. 4: 1065. https://doi.org/10.3390/su11041065
APA StyleChen, J., Liu, Y., & Wang, L. (2019). Research on Coupling Coordination Development for Photovoltaic Agriculture System in China. Sustainability, 11(4), 1065. https://doi.org/10.3390/su11041065