1. Introduction
The rapid growth of land and population urbanization, the increasingly serious problems in resources, environment, and the rapid development of human use of marine high-tech have contributed to the marine economy as an important driving force for economic developments in coastal countries and regions. The marine economy, a concept now accepted by the academic world, is defined as “the sum of various economic activities for the development of marine resources and in which the oceans are the place for activities.” [
1] In China, the phrase “marine economy” first appeared in 1978 at the National Conference of Philosophy and Social Sciences, the famous economist Yu Guangyuan proposed the establishment of a number of new disciplines, which included the study and examination of marine economies [
2]. The marine industry as the core area of marine economic research is the main measure of the marine economy. Among them, the marine industry structure changes with economic development [
3]. It has thus far evolved from low to high development. Their industrial structures (which include the evolution of horizontal rationalization) promote local economic development. This study focuses on the contribution of the marine economy to the national economy, the impact of marine economic activities on the marine environment, along with research on the economic effects of the marine industry. Studying these factors will require a closer look at several indicators, such as the marine industry’s GDP, employment, and household incomes. Inputs and outputs of the assessment method will be used to assess the effects of the marine industry’s economy on China’s regional economy and national economy. It can be seen that the regional economic impact of the overseas study of the marine industry mainly uses the input-output method [
4,
5,
6,
7,
8]. The other analytical methods are applied to analyze the industrial front, backward, and side effects of the marine industry or its important sectors. The empirical evidence shows that the backward effect, supply shortage cost effect, and the price effect of the marine industry are lower than the forward correlation effect [
9,
10,
11,
12,
13,
14,
15,
16,
17,
18,
19,
20].
In the study of the marine industry in China, the early economic geography focused on the layout of the marine industry, its formation conditions, and the development law. After 1990, with the publication of the China Ocean Statistical Yearbook, the academic community began to rely on the traditional marine industry statistics indicators to analyze the economic and social benefits of the marine industry. In the process of seeking quantitative methods to study the economic benefits of the sea, domestic scholars try to use the input-output method to analyze the inter-marine industry. Furthermore, economic geography scholars of universities in coastal provinces and cities (for example, Universities such as Zhejiang University, Liaoning Normal University, Ocean University of China, Ningbo University, etc.) have begun to study the variation of marine industry and its regional economic correlation in Chinese coastal zones, the delta, the tidal coefficient, and the coefficient by using the Gini coefficient and coefficient of variation, Taylor index, and weighted coefficient of variation, wavelet analysis, Exploratory Spatial Data Analysis (ESDA) along with the principal component analysis and factor analysis, from the regional level.
A comparison of domestic and foreign research has discovered the following. Firstly, the impact of the marine economy on the regional economy can be measured. The common idea is to directly analyze the share of the marine industry in the regional economic growth, its long-term effects, and the forward or backward effect. Meanwhile, this method can also be adopted to analyze the side effects of the marine industry, and the pulling effect of the marine industry or its important sector in the overall growth pattern of the regional economy. Secondly, by the lack of microeconomic standards of global marine economic statistics, Western scholars try to use the input-output method to fine characterize the economic and social effects of small-scale marine industry. Chinese scholars are only good at quantitative analysis with respect to the contribution of the marine industry and its regional differentiation patterns in the coastal areas of the economic growth process. Thirdly, the research method is becoming increasingly diversified and consistent. The main method of direct analysis is the input-output method and industrial association analysis method. The indirect analytical ideas mainly use the Gini coefficient and coefficient of variation, Taylor index, weighted variation coefficient, and wavelet analysis, principal component analysis, ESDA, and so on.
When it comes to research regional comprehensive effects of China’s marine economy, it is difficult to use input-output models due to without standard statistical data sources. The scholars, however, try to use the marine economic added value and its proportion of GDP. Employment, labor income, and other quantitative indicators of the marine economy in the local economy accounted for a small share of the economic development, though it ignored the development of coastal provinces and cities and their respective resources and environmental differences, regional diffusions, and occurring polarization effects. Therefore, we study the provincial units as the object. The spatial econometric model is used to analyze the influence of the marine economy on the regional economy from static and dynamic aspects. Additionally, we analyze the determining factors of the influence of the marine economy on provincial economic growth to promote the balanced development of the marine economy in China’s coastal provinces.
CiteSpace analyzed the information of authors and visualized it.
Table 1 demonstrates the authors who contributed the most to marine industry research. Among the top 10 contributive authors, see
Table 1, Hobday, AJ (10 publications) ranked first, followed by Feijoo, G (8 publications), Gonzalez-Garcia (8 publications), and Moreira, MT (8 publications). In the meantime, however,
Table 1 demonstrates the co-cited authors who contributed most to marine industry research, Food and Agriculture Organization (FAO) (58 publications) ranked first, followed by Long, ER (44 publications), United Nations Environment Programme (UNEP) (40 publications), and Halpern, BS (32 publications).
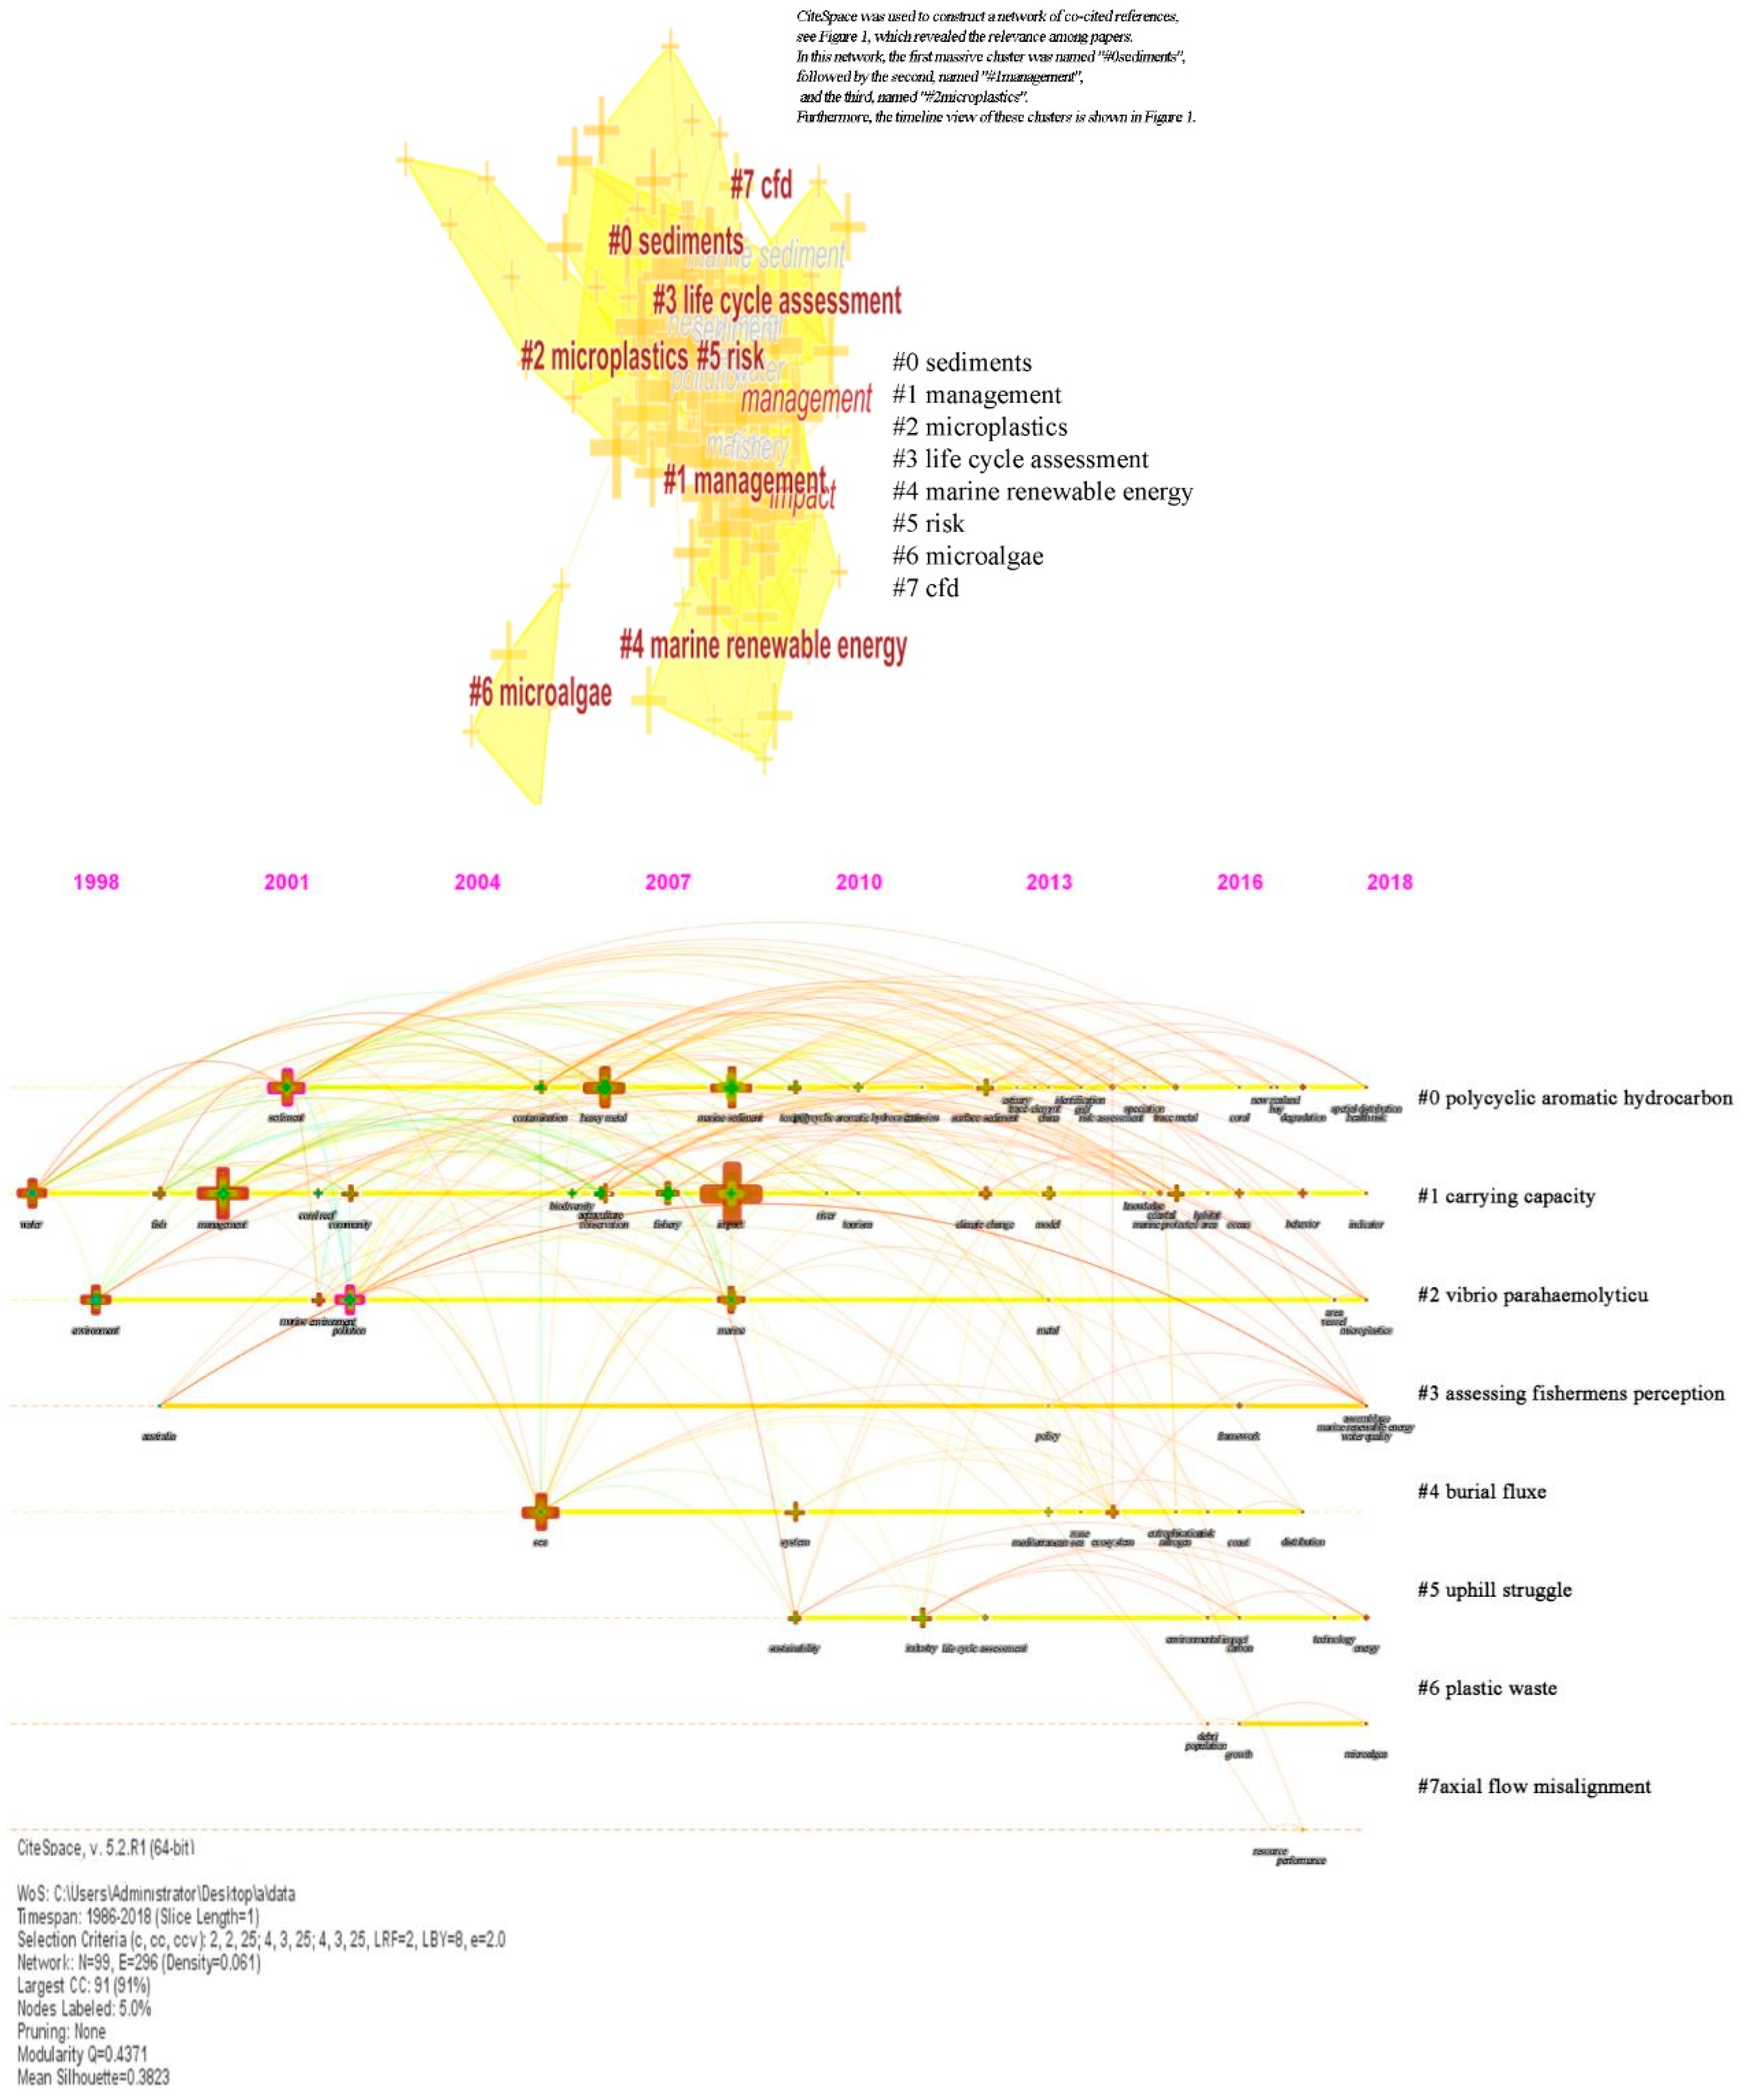
CiteSpace was used to construct a network of co-cited references, see
Figure 1, which revealed the relevance among papers. In this network, the first massive cluster was named “#0sediments”, followed by the second, named “#1management”, and the third, named “#2microplastics”. Furthermore, the timeline view of these clusters is shown in
Figure 1.
Table 1. A showcase of the top 10 authors, co-cited authors, and co-cited references in marine industry research. There is rich literature on the marine economy, the research focus has changed and evolved in the past decades. Previous research focus on the impact of the spatial concentrations of interlinked marine economist and the role played by marine-based industrial clusters in the regional economy [
9,
10,
12,
18,
19]. Less research effort was put into the differentiated role played by the marine economy in economic development.
2. Data Sources and Research Methods
2.1. Research Area
There are differences in the level of comprehensive economic development, the course and characteristics of marine economic development, and the intensity of the marine economy in coastal provinces and cities. To achieve the coordinated development of China’s marine economy, we must compare the regional marine economy in China. Therefore, the study area of this paper is China’s coastal provinces and cities, from the North to South which are Liaoning Province, Hebei Province, Tianjin, Shandong Province, Jiangsu Province, Zhejiang Province, Shanghai, Fujian Province, Guangdong Province, Guangxi Zhuang Autonomous Region, and the Hainan Province.
2.2. Data Sources
The primary, secondary, and tertiary marine industries consist of the output value, marine transport of goods in the coastal area, the number of people involved in maritime employment, financial income, along with the number of graduate students in the coastal area. The above data are all from the “China Ocean Marine Yearbook from 2006 to 2015. Economic data and marine industry data are from the coastal provinces (cities) national economic and social development statistics bulletin and China’s marine economic statistics bulletin. We use per capita GDP as background data. In order to facilitate the analysis, all cities (districts) under the jurisdiction of the provinces (cities) are treated as a whole to carry out the research.
2.3. Research Methods
After the development of space econometrics, the spatial econometric model favored by many scholars has been gradually improved. This paper mainly uses the basic panel data model (spatial econometric model), spatial lag model (SLM), and the spatial error model (SEM). In addition, the researchers use the expanded form of the two models, spatial Durbin model (SDM), and the spatial Durbin error model (SDEM).
In view of the marine statistics and related research, this paper chooses the primary, secondary, and tertiary industries of the marine economy, the coastal areas of marine cargo traffic, the coastal areas of employment, coastal areas of fiscal revenue, coastal areas of undergraduate and specialist graduate students as the provincial economic growth differences in the explanatory variables, analyzes the influencing factors of the marine economy on the provincial economy in coastal provinces, see
Table 2, and constructs the traditional econometric model of the provincial economic differences, see Formula 1.
Formula 1: I is the i-th province, which includes 11 provinces (cities); t represents time (years); Y is the explanatory variable, that is, the per capita GDP of each province (cities) in 1999–2015. O, T, S, H, C, J, and E are explanatory variables of regional economic differences, separately represented by the primary, secondary, and tertiary industries of the marine economy, the coastal areas of marine cargo traffic, coastal areas of fiscal revenue, the coastal areas of employment, coastal areas of undergraduate and specialist graduate students; β0 is a constant term; ε is a random error term; β1~7 is the parameter to be estimated.
2.3.1. Spatial Lag Model (SLM)
The spatial lag model mainly discusses whether the variables have a diffusion phenomenon in one region, which consists of spillover effects, see Formula 2:
In Formula2: β0 is the constant term; ρ is the spatial autoregressive coefficient; Wij is the element of the spatial weight matrix W; WlnY is the spatial hysteresis of the interpreted variable; β1~7 is the parameter to be evaluated for the variable; ε is the random error term.
2.3.2. Spatial Error Model (SEM)
The spatial error model contains a dependent spatial lag variable, and its model adds a spatial structure to the error term to explain the degree of influence of the error impact over the explanatory variables in the adjacent region on the observed values in the region, see Formula 3:
In Formula 3: φ is the random error vector; λ is the spatial error autoregressive coefficient; Wln ε is the spatial lag term of the random error term; μ is the random error term of the normal distribution.
2.3.3. Space Durbin Model (SDM)
The Space Durbin model (SDM) is extended by the SLM model, that is, on the basis of SLM adding the explanatory variables of the hysteresis. Indicating that the explanatory variables of a region are affected not only by the explanatory variables of the surrounding area but also by the explanatory variables of the surrounding area, see Formula 4:
In Formula 4: WlnH, WlnC, WlnJ, WlnE, WlnO, WlnT, and WlnS are the spatial hysteresis terms for the explanatory variables respectively; θ1~7 is the parameter to be evaluated for the variable space lag term.
2.3.4. Space Durbin Error Model (SDEM)
The Space Durbin Error Model (SDEM) is extended by the SEM model, that is, on the basis of the SEM model to add the explanatory variable hysteresis. It is shown that the explanatory variables of a region are affected by some of the important variables (error terms) associated with a set of local features and neglected geospatial considerations. The explanatory variables of a region are also affected by the explanatory variables in the surrounding area, see Formula 5:
3. Analysis on the Impact of the Marine Economy on Regional Economy in Coastal Provinces
3.1. Differentiation of Marine Economic Growth and Industrial Structure in Coastal Areas
From 2006–2015, the total output value of the major marine industries in 11 provinces (cities) in the coastal areas of China maintained a rapid growth trend regarding the absolute amount. The total quantity increased from 2122.03 billion yuan in 2006 to 6.4669 billion yuan in 2015. In other words, this totaled a 2.05-times increase, with an average annual growth of 13.18%. The growth rate of the marine economy in each coastal province is relatively fast, and the average annual growth rate is 14.37%––equivalent to the average annual growth rate of the coastal economy, as shown in
Table 3. The total value of the marine economy showed steady growth, and the growth rate was stable. Comparing the proportion of the marine economy to GDP, it is found that the total value of the marine industry in coastal provinces (cities) accounts for the proportion of GDP in the region, but the proportion began to increase steadily after 2010. By 2015 the proportion was as high as 16.36%. This shows that after 2010, the marine economy in China’s coastal areas of the provinces (cities) contributed to the steady growth of economic development.
According to the State Oceanic Administration “Classification of Marine and Related Industries” (GB/T20794-2006), the marine industry is divided into three industries. The first includes marine fishery; the second, the marine salt industry, marine oil, and gas industry, coastal sand mining and coastal shipbuilding, deep sea mining, and marine pharmaceutical industry; while the third includes marine transportation, coastal tourism, marine public services, and so on.
It has been found that China’s marine industry structure tends to be at an advanced stage, and the proportion of the primary, secondary, and tertiary marine industries are adjusted from 5.4:46.2:48.4 in 2006 to 5.1:42.5:52.4 in 2015. Industrial structure has gradually optimized. Secondly, in the secondary marine industry, the marine industry has developed rapidly, see
Table 4. High-tech industries such as marine bio-medicine, marine power, and seawater utilization have formed rapidly and steadily, but the regional differences are very significant, especially in the Bohai Rim region. Its development level of the emerging marine industry is lagging behind the Yangtze River Delta and Pearl River Delta urban agglomerations. Thirdly, the marine ship industry has developed rapidly. [
16] High-tech industries such as marine bio-medicine, marine power, and seawater utilization have formed rapidly and steadily, but the regional differences are very significant, especially in the Bohai Rim region. The development level of the emerging marine industry is lagging behind the Yangtze River Delta and Pearl River Delta urban agglomerations. Fourthly, in the marine tertiary industry, marine transportation is becoming the most important component, marine science, technology research and development, and intermediary industry’s rapid development are mainly concentrated in Dalian, Qingdao, Shanghai, and Guangzhou.
3.2. Contribution of the Marine Economy to the Regional Economy of the Coastal Provinces
To construct Formula 6 to measure the contribution of the marine economy to the regional economic development, where H is the total output value of the marine economy in the year, G is the total provincial economy, and B is the contribution rate of the marine economy to the provincial economy. The greater the B value, the more developed the marine economy, the greater the contribution of the marine economy to the regional economy. The contribution of the marine economy to the regional economy in the coastal provinces and cities was calculated according to Equation 6, see
Table 5. The researchers have seen that the contribution rate of the marine economy to the regional economic development in Hebei, Jiangsu, and Guangxi has little contribution to the province’s economy, which is lower than the national level (16.36%), whereby the gap is also large; the contribution rate in Liaoning, Shanghai, Fujian, and Hainan is close to the national level; the contribution rate in Tianjin, Shanghai, Fujian, and Hainan is far greater than the national level.
Furthermore, from the development trend, the contribution rate of the marine economy to the regional economy in Tianjin, Fujian, Shandong, and Guangxi is relatively stable compared with other provinces, and the change rate of contribution in the study year is always less than 1%. The contribution rate in Hebei, Liaoning, Shanghai, and Hainan has always been declining in the study year. In Liaoning and Hainan, however, there is an upward trend. The decline in Shanghai is the most obvious from 38.47% in 2006 to 26.57% in 2015, a decrease of more than 10%; the contribution rate in Jiangsu, Zhejiang, and Guangdong in the study year has always shown an upward trend.
3.3. Estimation of Static Coefficient of the Role of the Marine Economy in Promoting Regional Economic Growth
It is not difficult to prove that there is a high positive correlation between the marine economy of the coastal provinces (cities) and the economic development of the district. The development of the marine economy on the promotion of local economic growth is still unknown. The researchers have inserted the scatter plot of the marine industrial output (X) and local economic (GDP) data from coastal provinces (cities) between 2006 and 2015, showing that there is a clear linear relationship between the two. We intend to use three linear regression function models, shown in formula 7 to 9, for this analysis. The regression model is as follows:
where a and b are the parameters to be estimated, the meaning of the regression coefficient b:
That is, each province (city, district) marine economic output (X) for each additional 1%, the local economy (GDP) will grow 0.01b, (a) regression coefficient (b) reference to economic theory is positive. By using Eviews 7.0 software to perform Ordinary Least Squares (OLS) regression on formula 7 to 9 one can calculate the regression model of the provinces marine industry output value (X) and the province’s economy (GDP), see
Table 6.
The regression coefficients in
Table 6 show that: (1) The regression coefficient b is a positive value, indicating that there is a positive correlation between the marine economy and the province’s economy; (2) from the regression effect, in addition to the Hebei Province R2 = 0.608, other provinces R
2 are greater than 0.9, which means that the model is of a high fit, while the margin for error is small. This, in turn, is true to the actual curve, i.e., LnX and X-factor t-test values corresponding to the probability of less than 1% of the significance level. This means that the provinces (cities) marine economy and their economy has a strong correlation.
The number of observations n = 11, the number of explanatory variables k = 1 take the significance level = 0.01, through the look-up
Table 6, which is a critical point as DW is dl = 0.497, du = 1.003.
Table 6 shows that, in addition, to Hebei and Guangdong, the Durbin-Watson (DW) values of other provinces (cities) are between du = 1.003 and 4-du = 2.997. This is because it is not possible to judge the autocorrelation of the regression equation when the value of the DW autocorrelation test falls within (dl~du) (4-du~4-dl). The Matlab LM test is needed for Hebei and Guangdong. Because the model values in
Table 5 are less than 0.05, it should accept the original hypothesis that there is no first-order autocorrelation. By the partial autocorrelation coefficient test, it can be seen that there is no high order autocorrelation in the regression equation between the marine economy and the local economy, that is, the regression models in
Table 5 pass the econometric test and statistical test. Therefore, we can see that the function parameters of coastal provincial (cities) along with the marine industry output and local economic growth have statistical significance. At the same time, the regression coefficient can clear the provincial (cities) marine industry output value of 1% per GDP corresponding to the growth of GDP, that is, the development of the marine economy on local economic growth to promote the specific value of the degree.
3.4. Dynamic Measurement of the Effect of Marine Industry on Regional Economic Growth
The static effect portrays the GDP growth (in the year) which is growing by the marine industry’s own growth, but in fact, the marine industry involved in a very wide and strong system has driven great potential. In order to quantitatively describe the dynamic contribution of the marine economy output value to the regional economic growth, the researchers of this study have established models and introduced a marine economy driving force coefficient.
ZX is the growth rate of the output value of the provinces (cities), ZGDP is the dependent variable and shows the growth rate of GDP in each province (city), ZX’s driving force model for ZGDP is shown in Equations 10 and 11:
where the regression coefficient b is the economic driving force.
The relevant data of the China Ocean Statistical Yearbook (2006–2015) is substituted into Equation 10 and 11, and the correlation coefficient r of the variable is obtained. Indicating that in addition to Zhejiang, Guangdong, and Guangxi, and other provincial (cities), ZGDP and ZX have a significant linear relationship. The researchers analyzed it using Eviews 7.0 software, with results displayed in
Table 7. The regression results show that in most provinces, the F value corresponds to a probability greater than 0.05. In addition to Guangxi, the marine industry output value of the province’s GDP is significant. This is particularly true for Hebei, Liaoning, Shanghai, Tianjin, and Zhejiang.
Compositing the static and dynamic effects of the marine economy on the economic development of the coastal provinces yields a few results. Firstly, the average contribution rate of the marine economy to economic development in coastal provinces, from 2006 to 2015, is above 15%. Second, the empirical analysis of the measurement model shows that the marine industry in the coastal provinces (cities) has a significant effect on local economic growth. The specific performance is that each province’s and city’s marine industry output growth of 1% will promote its corresponding percentage of GDP growth, see
Table 7.
4. Criticism on the Factors Influencing the Difference of Provincial Economic Growth in the Marine Economy
4.1. Hausman Test and Spatial Regression Empirical Results
The spatial correlation of the marine economy between coastal provinces (cities) is forecasted by the ordinary least square’s method. The results may be biased or ineffective, and, therefore, need to establish a spatial measurement model for more accurate estimates. The Hausman test is used to test the random effect or the fixed effect of the spatial econometric model. Using the EVIEWS 7.0 software to achieve the original data test, the statistics of the Hausman test were 966.217356, with a probability of 0. Furthermore, every indicator passed a 1% significance level test, see
Table 8. Thus, the original test assumes that the fixed-effect model and the random effect model do not exist with systematic differences not having been established. It is possible to estimate the influencing factors of economic differences in coastal provinces (municipalities and autonomous regions) by establishing a fixed-effect model.
Using GeoDa, Matlab 2014b, and other software, based on the spatial panel regression measurement model, we make a regression analysis of the influencing factors of regional economic differences in 11 coastal provinces (cities) from 2006–2015, see
Table 9.
4.2. Analysis of Results
It is known that: (1) the four models have passed the 1% significance test, and the spatial autocorrelation coefficient ρ (λ) of the SEM and SDEM models in the four models is positive, which shows that the regional economic levels and related errors in a region affect of the economic development. The regional economic development is a process of the element gathering constantly. The higher the level of economic development in a region, the higher the ability is to attract investments and labor. As time goes on, the accumulation of various factors along with the economic spillover effects of infrastructure and technical knowledge in the region will positively affect the surrounding areas (trickle effect). (2) From the fitting degree (R2), the logarithmic likelihood (logL) of the SEM is larger than that of the other three models, which is the best fit in the four models. This shows that the lagged variables of the explanatory variables play a role in the model estimation. This is not particularly evident under the selected sample capacity limit. (3) Seeing from the industrial structure, primary marine and tertiary industries have negative effects on the regional economic growth, and the secondary industry has a positive effect on the regional economic growth. It shows that the development of the regional marine salt industry, marine oil and gas industry, coastal sand mining, coastal shipbuilding industry, deep sea mining industry, marine pharmaceutical industry, seawater utilization industry, marine power, and marine engineering construction industry will expand the provincial economic growth differences.
The tertiary marine industry and primary marine industry, such as marine fishery and marine science research, education, social service industry, marine transportation industry, and coastal tourism industry, will narrow provincial economic growth differences. In the SDM and DEM models, the coefficient of hysteresis in the primary and secondary marine industries is positive, and the effect of the marine secondary industry is significant, which through the 5% significance test demonstrates that the primary and secondary marine industries have a certain spillover effect, and the development of these industries in the surrounding areas has promoted the economic development of the region to a certain extent. The effect of the primary marine industry in the surrounding area is not as significant as the secondary marine industry. In the SDEM estimation results, the lagging parameters of the tertiary marine industry are negative, but not statistically significant. Namely, the development of the tertiary industry in the neighboring provinces has a negative effect on the overall economic growth of the province; however, this needs further confirmation. (4) From the marine import and export trade, the volume of marine cargo traffic on regional economic growth also has a positive effect. The faster the import and export trade in a coastal area, the faster its economic development. Contrarily, the region with less import and export trade has a slower pace of economic development. Therefore, the positive effect of the volume of marine cargo traffic on regional economic growth is evident and, also, holds true for coastal areas. In the SDEM estimation results, the lagged items of marine cargo traffic are positive, but not significant; indicating that the level of import and export trade in the surrounding areas of a province may promote economic growth in the region, though the degree is not obvious. (5) The number of employed persons, financial income, and the number of graduates in the coastal areas were not all tested by the 10% significance level of the four models. It said that the impact of these three indicators on coastal provinces (cities) economic growth difference is not significant. However, in the SDEM, the lagging degrees of the employees in the coastal areas is positive and passes the 10% significance test, indicating that the coastal areas have a certain spillover effect on employees. The employment of the coastal areas has a certain effect on the region. Peripheral coastal areas of employment in the region have a certain role in promoting economic development. In SDM, the lagged income of fiscal revenue is positive and passes the 5% significance test, indicating that the fiscal revenue has a certain spillover effect. The negative results show that the financial income of the surrounding area has a certain hindrance to the region. The basic situation of education is positive, through the 1% significance test, indicating that education has a certain spillover effect.
In conclusion, the results of the four spatial econometric models show that most of the explanatory variables pass the significance test and are in line with the actual situation. However, the SDM and SDEM models not only reflect the parameters of the regional variables but also reflect the variables of the lag parameters. We can see that both the SDM and SDEM models are better. Thus, we can conclude that the factors that affect the differences in economic growth in coastal provinces (cities) should include the effects of some variables in the neighboring provinces (cities), in addition to the local explanatory variables.
5. Discussion and Conclusion
This study aimed to analyze the marine economy in the coastal provinces and the regional economic impact. It has also aimed to examine the structural differentiation of marine economic growth in coastal areas, along with the topic’s economic contribution measurement, static and dynamic metrological study, and its promoting effects. This paper analyzes the spatial correlation of per capita GDP and establishes the spatial econometric model, and proceeds to examine the coastal province (cities) as a research unit. This paper has further analyzed the temporal and spatial differentiation of the influence of the marine economy on provincial economic growth and its causes.
The results show that based on the portrayal of the contribution of the marine economy to the provincial economy, the static and dynamic measurement results of the marine economy promote the growth of the provincial economy. The marine economy and the provincial economic growth of the coastal provinces (cities) have a significant effect on economic development, but the role of promotion in Zhejiang and Jiangsu and Fujian is higher than that of other provinces and cities. This paper has further discovered that the marine import and export trade and the secondary marine industry plays a positive role in the economic growth of the provinces by constructing the spatial econometric model to estimate the factors affecting the economic growth differences amongst coastal provinces. While the marine’s primary and tertiary industries will weaken the difference in provincial economic growth, the second marine industry has obvious positive spillover effects on the surrounding area. When it comes to comparing with the previous research, our research demonstrated that the marine economy played a differentiated role to that of the regional economy and shows the degree of decreasing uneven development in the eastern coastal area in China rather than general impact of marine economy on regional development by other scholars [
12,
13,
14,
15,
18].
As for the estimated parameters of employment, the fiscal revenue and the basic education situation in coastal areas are not significant in the spatial measurement model. Thirdly, the results of the four spatial econometric models show that most of the explanatory variables pass the significance test and are in line with the actual situation. SDM and SDEM can reflect the lag parameters of the variable, so the result is better than the other two models. Economic factors affect the marine differences in provincial economic growth in addition to local explanatory variables along with the effect of some variables in the neighboring provinces.
Based on economic growth differences and the contribution analysis of the marine economy in coastal provinces in China, it is necessary to take reasonable and effective measures to narrow the gap between the coastal provinces and the development of the marine industry to promote a balanced and coordinated development of the economy in China’s coastal areas and cultivate the marine industries’ potential for provincial economic growth.
Coastal provinces need to play the regional advantages of marine industry and promote the rational flow of marine economic factors. Coastal areas should make full use of the market mechanism to promote the rational flow of marine economic factors, such as the coordinated development of the three major coastal ports in the coastal areas. The urgent problems are the port group function positioning along with the hinterland structure imbalance and the integration process within the port group, which is slow. Therefore, it is necessary to improve the soft environment of the port logistics industry development as soon as possible, such as infrastructure, human capital, and institutional optimization. Additionally, it is also important to promote the mutual development of the Port Group, Industrial Group, and Urban Agglomeration in the coastal area, to achieve the development of the marine economy in the form of substantive unity, competition, and cooperation to the depth of integration.
A reasonable marine industry structure is one of the important driving forces for the rapid economic development of coastal provinces. Coastal areas ought to take advantage of the development of the marine industry as the core and expand the marine industry chain, such as around the tertiary ocean industry, to cultivate and construct the integrated supporting facilities and public services, to establish the cooperation zone of the marine new technology industry in the administrative region, and to speed up the technological spillover effects of the tertiary industry. This, in turn, may promote the value chain link of the secondary marine industry in coastal areas and the right to speak in global production networks through cooperation and incubation of marine science and technology cooperation in coastal provinces.
Finally, the primary and tertiary marine industries have promoted economic development, particularly in the land industry, and have realized the benign and interactive development of the marine economy and provincial economy. For instance, in the city of Guangxi, as the economy is relatively less developed, the promotion of the marine economy is particularly important for the local GDP. Researchers can attempt to develop the primary marine industry through high- and multi-level diversification in order to promote economic development within the marine industry. This, in turn, can also help promote the marine economic zone.
The government should clarify the key points of the marine industry in promoting the coordinated development of the provincial economy. The provinces should, in time, begin the integration of the financial, tax, and other series of preferential policies to establish and improve the marine science and technology hatching along with the industrialization of the benefit-sharing mechanism. The standardization and supervision of various marine technology market behaviors enhance the legitimate rights and interests of participants in the marine intellectual property market. This is true for a variety of cities, such as Beijing, Dalian, Qingdao, Nanjing, Shanghai, Hangzhou, and Guangzhou. Therefore, government at various levels should issue the proper policy to support the development of the marine economy, particularly, local city government should have special policies of funding, employment, and planning to strengthen local advantage.
It is equally as important to encourage the scientific research, education, and production of marine scientific and technological personnel training programs and those who work in marine industries. The government must strengthen coastal job training when they are transferring industries and when they are helping to enhance the quality of practitioners and the proportion of public utilities, marine science, and technology services, private marine cultures, and other industries in coastal areas, to meet upgrades in the marine industry, technological innovation, and the demand for the labor force.


