1. Introduction
Economic theories at the end of the last century showed that in absence of tax and regulatory constraints, a debt-financed company is as solid as an equity financed one as per Modigliani and Miller [
1], that debt can also help to align the objectives of managers and shareholders and to reduce agency problems (Jensen and Meckling [
2]) and that the returns for shareholders of a leveraged company can be higher. Company shareholders tend to prefer leverage to equity injections to maximize their returns [
3]. However, the recent global financial crisis has somewhat changed this perception. Financial leverage magnifies business risk and increases the default risk and the associated costs. The subprime crisis and the subsequent banking crisis in the US and Europe showed that excessive leverage in the balance sheet taken by individuals and companies [
4] increased default rates. The level of corporate debt measured by the financial obligations ratio—interest payments and repayments of debt divided by income—reached unsustainable levels before the beginning of the crisis.
A sustainable financial system that helps economic growth must be balanced and not biased towards the excessive use of debt. However, for a company, the cost of debt is in general much lower than the cost of equity. Corporate tax and financial regulation also lead companies to take high levels of debt. The cost of equity can be defined as the risk-free rate (Rf) plus the equity risk premium (ERP)—the premium that investors demand to invest in equities, as an asset class, relative to what they expect to earn on a risk-free investment. The equity risk premium is paid by the company via dividends, shares buybacks and via discounted equity issuances. In 2017, according to the annual survey by Pablo Fernandez et al. [
5], the cost of equity defined as Ke = ERP+Rf was 8.20% in the US and 8.25% in Western Europe. The average yield of long-term senior debt (yield of aggregated bond indices) for investment-grade corporates at the end of 2017 was, according to Bloomberg, 2.7% in the US and 0.72% in Europe.
Several hybrid instruments have been designed as a mixture of debt and equity, to make the capital structure of the companies and financial institutions more sustainable, more flexible [
6] and less dependent on debt, since debt payments—both interests and principals—are a fixed charge and always have priority in the payments waterfall of a company and can lead to defaults. However, hybrid instruments are generally much more expensive than debt, hence less efficient for financing a company balance sheet. One of those hybrids instruments and probably the one that is closer to equity is the mandatory convertible.
Very few theoretical or empirical analyses have addressed the study of mandatory convertibles notes (MCNs) and even less the study of the implicit cost of the instrument. This study wants to add to the academic literature by studying for the first time the factors that influence its implicit cost. Besides this study includes for the first time hedge and convertible arbitrage funds as marginal price setting investors. One fundamental question that this research try to explore is the following, is the cost of MCNs different and lower than the cost of equity?
MCNs are hybrid securities that share characteristics of both debt and equity. They are designed and documented as a bond, pay coupons regularly but upon redemption or at maturity are mandatorily converted into a fixed or limited number of common shares and no cash or other security is delivered. This unique feature enables this security to behave like common shares but the coupons paid and its contractual format enables them also to behave in some aspects like debt security issued by the company. MCNs provide for the deferred, but mandatory, issuance of common stock, while raising proceeds immediately. MCNs on its US denomination, Mandatory convertible preferred shares are a popular instrument for US corporates where they have been part of the equity-linked market since the beginning of the 90s and mandatory convertible bonds are used in a selective way in Europe and other regions. Companies issue MCNs when they want to raise cash without being downgraded by excessive leverage. Additionally, MCNs are considered as a better alternative to rights issues which can be perceived as indicative of a troubled or distressed situation [
2]. Furthermore, MCNs tend to have greater notional amounts than convertible bonds and corporate benchmark bonds—the average notional of MCNs reached USD1.4 billion in 2017. Due to its better rating agencies treatment and accounting equity credit, in the last years, MCNs are being primarily used as a way to fund large acquisitions or to divest former investments in listed companies.
MCNs are related, but fundamentally different, to standard convertible bonds. Traditionally the main reason for the issuance of standard convertible bonds is that they represent a deferred capital increase. If a company intends to increase capital to fund the development of new projects, convertible bonds allow issuing shares in the future at a price higher than the current share price [
7]. The second major motivation for issuers of standard convertible bonds is that convertibles represent a cheaper source of debt. The coupon paid is generally lower than the one paid on an ordinary senior loan or bond [
8]. Issuing an MCN can be considered a deferred capital increase. Notwithstanding, mandatory convertibles do not pay dividends and do not have voting rights until conversion into common stock. Mandatory convertibles are junior to other debt or hybrid securities and senior only to common equity. Issuers of MCNs need to pay a regular stream of cash to service coupons and are contractually subordinated to other forms of debt. The issuer can choose to defer the coupons at its sole discretion.
MCNs tend to have shorter maturities than standard convertibles, typically three years—compared with 5–7 years for standard convertibles—and rating agencies consider them as a high equity credit instrument [
9]. Issuers favor MCNs for their high equity content vis-à-vis rating agencies [
6]. Higher equity content implies a better company rating which is obtained if the issuer replaces debt for an MCN or uses MCNs for raising cash for a new project. For instance, Standard and Poor’s assigns 100% equity content to MCNs.
A corporate director can find difficult to estimate which should be the coupon to pay for a new MCN. Traditionally the coupon paid by mandatory convertibles has been compared with the dividend yield of the issuer, being very close to equity and therefore managers and investors seemed to use dividends as a means to assess the potential cost of a new MCN issue. However, one of the hypotheses of this research is that the MCN nominal coupon should be linked to other parameters different from the dividend yield, like the cost of senior debt, the value of the implicit options and the cost of borrow of the underlying stock. An additional complication of mandatory convertibles lies in the embedded options—a ratio call spread on the underlying shares. The objective of including the call-spread in MCNs is to make the security more appealing to investors by increasing the coupon paid and to potentially reduce the dilution for the issuer at maturity. Different MCNs have different upper call-spread strikes, and this feature makes particularly difficult for issuers to assess the real cost of MCNs. At issuance, the call-spread is synthetically bought by the MCN issuer, and the options premium is paid from the issuer to investors via higher annual or quarterly coupons.
An MCN can be decomposed in the underlying stock, a stream of fixed income cash flows representing the coupons paid by the note, and the call-spread equity options embedded in the note. The strikes of the embedded options are such that the conversion floor is not lower than the common share price at the time of issuance. Conversely, the initial conversion price—upper strike—can be set by the company high enough to retain some upside—higher equity upside implies lower dilution for existing shareholders—in the case of stock appreciation.
This article aims to contribute to the sustainable development literature by studying the cost of an innovative and not very well known hybrid capital instrument—the MCN—that can support to reduce the excessive use of debt. A less leveraged economy is more sustainable and less prone to suffer a repeated financial crisis. The access to efficient and not very expensive capital to finance the balance sheet of companies can promote sustainable growth, industrialization, and innovation.
The main objective of this research is to investigate whether there are other hybrid capital instruments that can finance the balance sheet of companies more efficiently. The cost of those instruments must be comparable to the cost of debt to avoid excessive payouts. This study strips out the value of the equity options as if the call-spread were monetized and calculates two new measures, the mandatory implicit spread and the total implicit yield of the MCN. These two variables help to compare the intrinsic cost for the issuer of different MCNs with different call-spread strikes.
The principal hypothesis is that the implicit cost of issuing MCN must be closer to debt than to equity. This paper investigates MCNs from the point of view of the issuer company and studies its intrinsic cost of these securities stripping out interferences as the nominal coupon, the value of the embedded options and the underlying risk-free rate.
The paper also studies which are the aspects that contribute to the price formation of a new MCN. A secondary hypothesis is that in modern MCNs, where dividend protection clauses are extensive, the dividend yield of the underlying stock is a less important factor and that, conversely, the credit component of MCNs has a substantial weight.
Finally, it studies the importance of arbitrage investors in the mandatory convertible market. A third hypothesis of the study is that convertible arbitrage investors are fundamental for MCNs price formation. This research analyses how the intrinsic cost for the issuer of MCNs decreases when the stock lending market is more liquid and more investors can hedge it—the securities lending markets are over the counter markets where investors can borrow securities with the objective of creating a synthetic short position on the borrowed stock or bond.
This paper is structured as follows: in the first place the existing academic literature about mandatory convertibles is reviewed; secondly, the size and importance of the mandatory convertible market worldwide is assessed; thirdly a pricing model for mandatory convertible securities is formulated and, finally, an empirical analysis is performed based on the public existing data of 81 mandatory convertible securities issued from 2010 to 2018.
2. Review of the Academic Literature about Mandatory Convertibles
One of the seminal studies was published by Enrique Arzac [
10] in a paper describing the then-nascent Mandatory Convertible market and analyzing the rationale for this type of security from the point of view of issuers and investors. Arzac detected that, in general, convertible securities reduce the costs of information asymmetry, as in the case of companies where the management is convinced that shares are undervalued and think that its stock growth prospects are not fully reflected in their current stock prices. In such a case issuing equity will depress further the stock price and will increase dilution. Also, that risky and highly leveraged companies that are seeking equity capital, but want to avoid unnecessary dilution tend to issue MCNs. His paper also presents a simple valuation method that decomposes the securities into (1) the current value of the underlying common stock; (2) the fixed-income cash flow; and (3) the equity options embedded in the security. Arzac concludes that mandatory convertibles allow leveraged or temporarily troubled companies to restructure their balance sheets by helping to control the “asymmetric information” problem that can make conventional equity issues very expensive, and that the options embedded in these securities can be designed to tailor the investor preferences for capital appreciation or for higher nominal coupons.
Nancy Huckins [
11] investigated the motivations of the issuers of MCNs and the market reaction to the announcement of a new issue. Huckins suggested that mandatory convertible issuers had high debt ratios, low-interest coverage, and high bankruptcy risk. The paper shows that the market response to MCNs was neutral and the stock does not depreciate after the announcement as it happens with common stock. The stock price market response was more positive for less leveraged and low-risk issuers of MCNs.
In 1999 a paper published in the International Review of Economics and Finance, Chen et al [
12] described the evolution of the Preferred Convertible products in the decade of 1990. The authors suggested that the embedded options in the MCN are warrants in nature and adjusted the valuation model proposed by Arzac to the potential dilution at redemption. The paper applied the pricing model to a single MCN issued in 1993 and detected that the market quotes were slightly higher than the theoretical prices calculated.
Research published by Amman and Seiz [
13] studied the adjustment to the theoretical pricing model of the observed secondary market prices of 40 listed MCNs between 2002 and 2004. The authors modeled MCNs following Arzac [
10] and Chen et al. [
12] as a fixed income strip of coupons, a prepaid equity forward and an equity options call-spread, or as a fixed income strip of coupons and an equity options collar. Their hypothesis was confirmed in their empirical analysis and the results proved that the theoretical model for MCNs adjusted better to the observed secondary market prices than the models that studied standard convertible bonds. As an extension, the authors studied how the model predicted the MCN market prices changes from the variations in the underlying stock and the robustness of the modeled delta hedge strategies. Despite the limited data sample, their seminal study served as a theoretical base for the convertible arbitrage funds that today represent more than 50% of the investors in MCNs. Those funds buy MCNs at issuance and hedge synthetically the security using the theoretical decomposition into call-spread, prepaid forward and the strip of coupons. The research from Amman and Seiz [
13] uses MCNs that mainly didn’t include dividend protection clauses since they have been generalized in the convertible market since 2007 as per Grundy and Verwijmeren [
14]. Dividend protection clauses adjust the strikes and ratios of the upper call convertibles when the dividends diverge from the contractually agreed path of future dividends at issuance, therefore, any future variation of dividends will be incorporated in the market price of MCNs and the securities are shielded against a change in the dividend policy of the underlying shares. This market change represents a major advance and allows investors to better hedge standard and mandatory convertibles. The model used by Amman in 2006 showed a high correlation between the dividend yield and the coupon paid in the mandatory, our research shows a lower relationship between those two variables.
In a book from 2011 Ramirez [
15] described the standard accounting of MCNs. Under the International Financial Reporting Standard (IFRS) accounting rules, if the MCN represents an obligation to deliver a fixed amount of shares, the instrument can be bifurcated as an equity component and a debt component. The initial carrying amount of the debt component is the present value of the coupons that the issuer is obliged to pay, discounted at the credit risk curve of the issuer [
13,
15]. The equity component is calculated as the difference of the issuer proceeds and the debt component. Most mandatory convertibles deliver two fixed amounts of shares, the lower ratio, and the upper ratio and a gap where the number of shares is variable, therefore issuers tend to bifurcate the instrument into a fixed parity mandatory convertible and a sold call-spread that is accounted at mark to market. In 2011 Chakraborty and Yilmaz [
16] studied from a theoretical perspective the adverse selection and information asymmetries problem and how convertible bonds and in particular mandatory convertible bonds can solve it. The adverse selection appears when the managers have more information about the good future prospects of a company than the investors in its securities. The managers, acting in the interest of the existing equity holders, may prefer to forego a good project instead of selling undervalued securities (debt or equity) to finance the investment and as a consequence, in general, most securities issued from low-quality firms that are overvalued. The authors argue that conditioned callable convertible bonds can reduce the adverse selection problem and that MCNs can mitigate it further thanks to its lower distress costs. MCNs reduce the potential costs of financial distress since the bonds are mandatorily converted into equity. The authors suggest that companies that are in better financial health should prefer standard callable convertibles to mandatory since such firms face lower expected costs of financial distress. Firms with higher expected costs of financial distress should prefer mandatory convertibles, especially when the underlying stock is highly liquid.
The agency problem is a classical subject of academic study and appears when company directors can take decisions that cannot be in the best interest of the company shareholders. One example is the preference, of company managers, for issuing equity and therefore reducing cash outflows, the cost of debt, and the potential costs of distressed situations, and conversely the preference for debt or leverage and other non-dilutive measures from the company owners (shareholders). The asymmetry of information theories show that companies with a higher perceived intrinsic (assets) value tend to issue straight debt and companies with lower intrinsic value issue equity. The agency problem, the asymmetry of information and the optimal capital structure of a company were studied by Chemmanur and Nandy [
17]. The authors developed a theoretical model to predict when a firm should issue mandatory convertibles to raise capital, instead of issuing debt, equity or conventional convertibles. Their model predicts that firms facing a larger extent of asymmetric information, but a smaller probability of financial distress will choose to issue debt, ordinary convertibles or equity, while those facing a smaller extent of asymmetric information, but a larger financial distress probability will issue mandatory convertibles. In the search for empirical evidence, the authors studied a dataset of Mandatory Convertibles issued from 1991 to 2001. However, many of those notes do not share all the characteristics of the modern MCNs, like dividend protection clauses of lower and upper call, or short maturities. The independent variables used as a measure of the asymmetry of information are the company size, the number of analysts following the stock, the deviation of the analyst estimates etc. and the variables signaling financial distress are the Z-score and the leverage of the company. The authors found empirical evidence consistent with their hypothesis.
In 2000 Irvin and Rosenfield [
18] studied the USD stock market reaction to the announcement of a specific preferred convertible security. The objective was to test the agency theories and the implication of the tax deductibility of this preferred securities coupons in the market reaction. They found that when the newly issued preferred retired bank debt, the reaction was significantly negative, whereas when it retired other non-tax deductible hybrids or equity the response was positive. Modern MCNs coupons are partially tax deductible.
A study in 2013 from Kallberg et al. [
19] focused on the stock market reaction to preferred and MCNs. Kallberg studied two hypotheses: bondholders must react favorably to the announcement of preferred securities since they decrease the firm’s leverage and financial risk, and it should be neutral from the point of view of shareholders. This paper studied for the first time the announcement effects on the credit default swaps on a large number of issuers—427 notes issued from 1999 to 2005, out of which 48 were MCN. The results showed that equity holders do not perceive preferred securities, and, in particular, mandatories as a sign of financial distress nor as a dilutive instrument. The credit default swaps decreased by 50 basis points after the issue implying a net positive impact on the company value.
Some years later Suseng Wang [
20], as a continuation of a previous paper detailing the use of standard convertibles in sequential financing, published a paper studying the role of MCNs for companies that have projects that can be valued using real options. Companies need to raise capital when new investment opportunities arrive and convertibles are optimal since they allow new access to capital markets with no increase of default probability if the conversion is triggered. For Wang MCNs represent a major innovation in corporate financing and securities. Wang highlights the features of MCNs, mandatory conversion, high coupons, and a capped or limited capital appreciation. MCNs solve part of the information asymmetry problems since the note is converted into equity at higher and lower stock prices. Wang demonstrates that not only companies that have a higher probability of financial distress issue MCNs, but on the contrary that large, mature and less distressed companies that can pay high dividends are more likely to issue MCNs. Our present research about the notes issued from 2010 to 2018, shows that the proportion of investment grade issuers is slightly larger than the proportion of high yield MCNs issuers partially confirming Wang’s theory.
3. Market Size
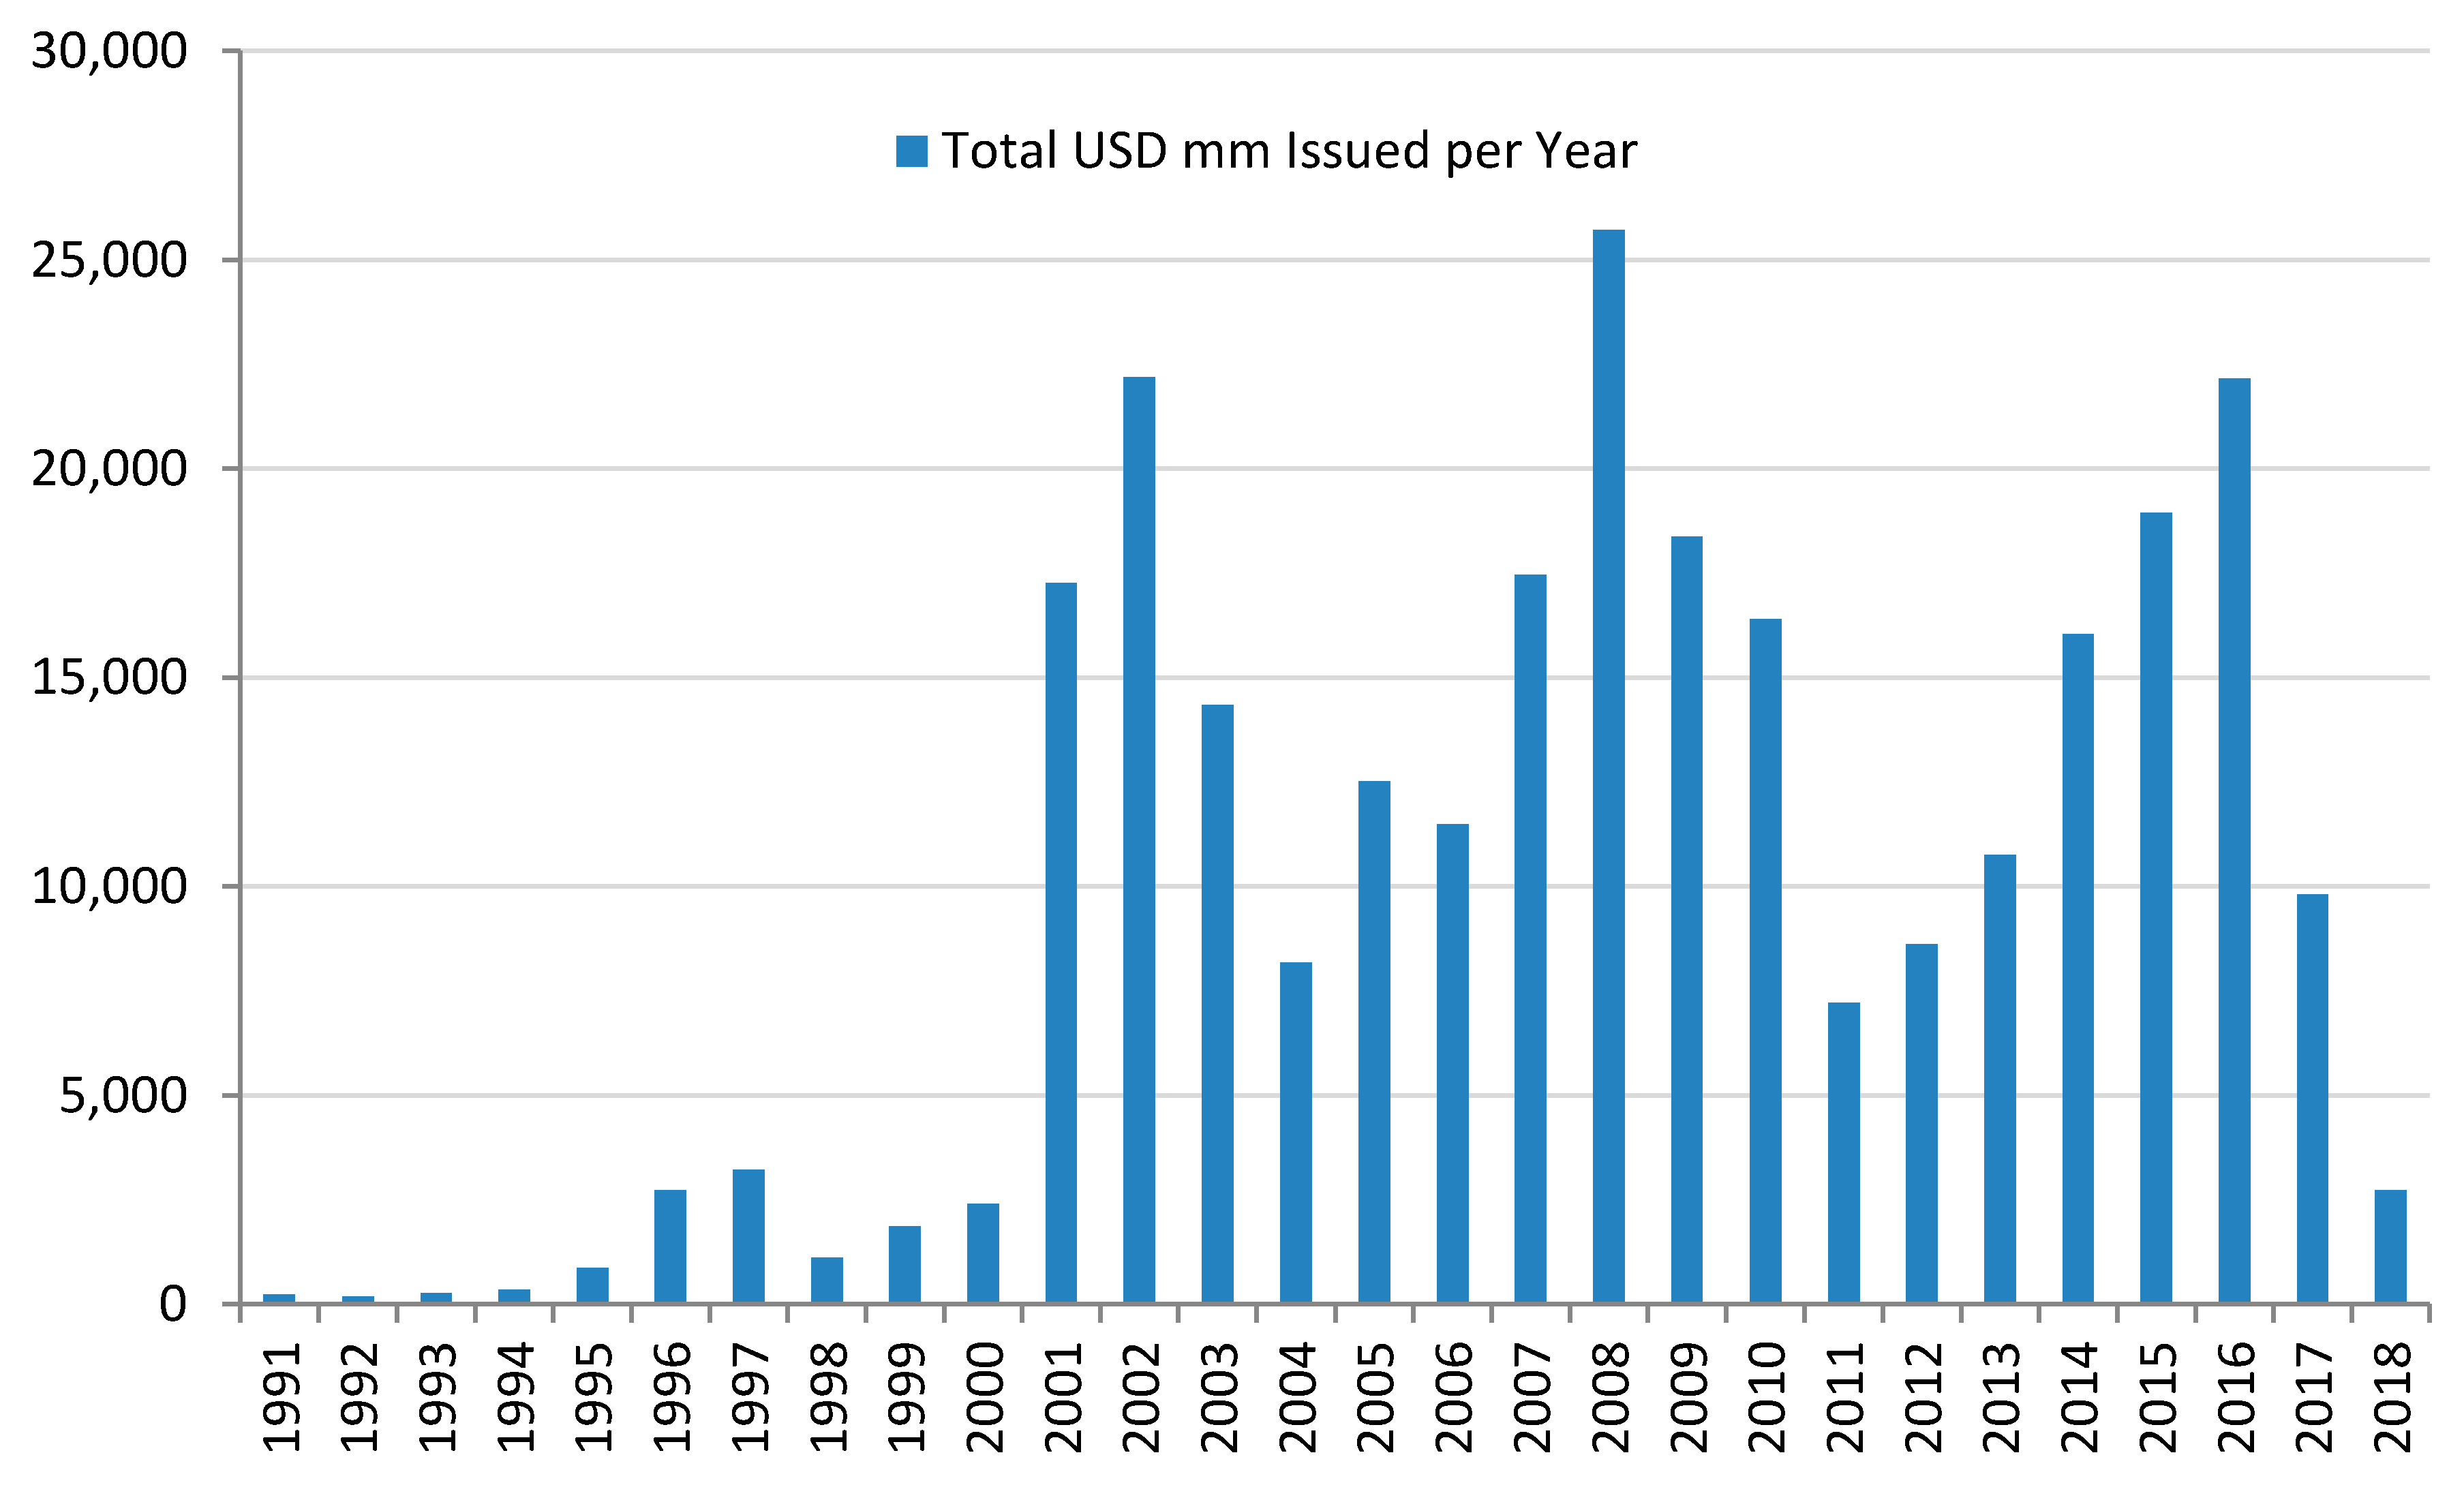
According to several data sources (Bloomberg, Datastream), the issuance of MCNs represented globally USD2.7 billion in 1996 and the market grew steadily until 2008 when it reached a peak of USD26 billion issued on that year as can be seen in
Figure 1. The crisis reduced the level of issuance but in 2016 the USD volume reached again USD22.1 billion
Banks and financial institutions profusely used mandatory convertibles in the middle of the 2008–2012 financial crisis and examples are the 2007 Citi USD7.5 billion to Abu Dhabi Investments; in 2007 UBS issued CHF13 billion of MCNs to the Government of Singapore; in 2008 Barclays Gbp1.5 billion offered to Qatar Holdings; in 2008 Merrill Lynch USD6.6 billion offered to KIA and Korean Investment Corporation and Mizuho; and in 2008 and 2012 Credit Suisse CHF3.8 billion offered to Olayan, Qatar Holdings, and other investors.
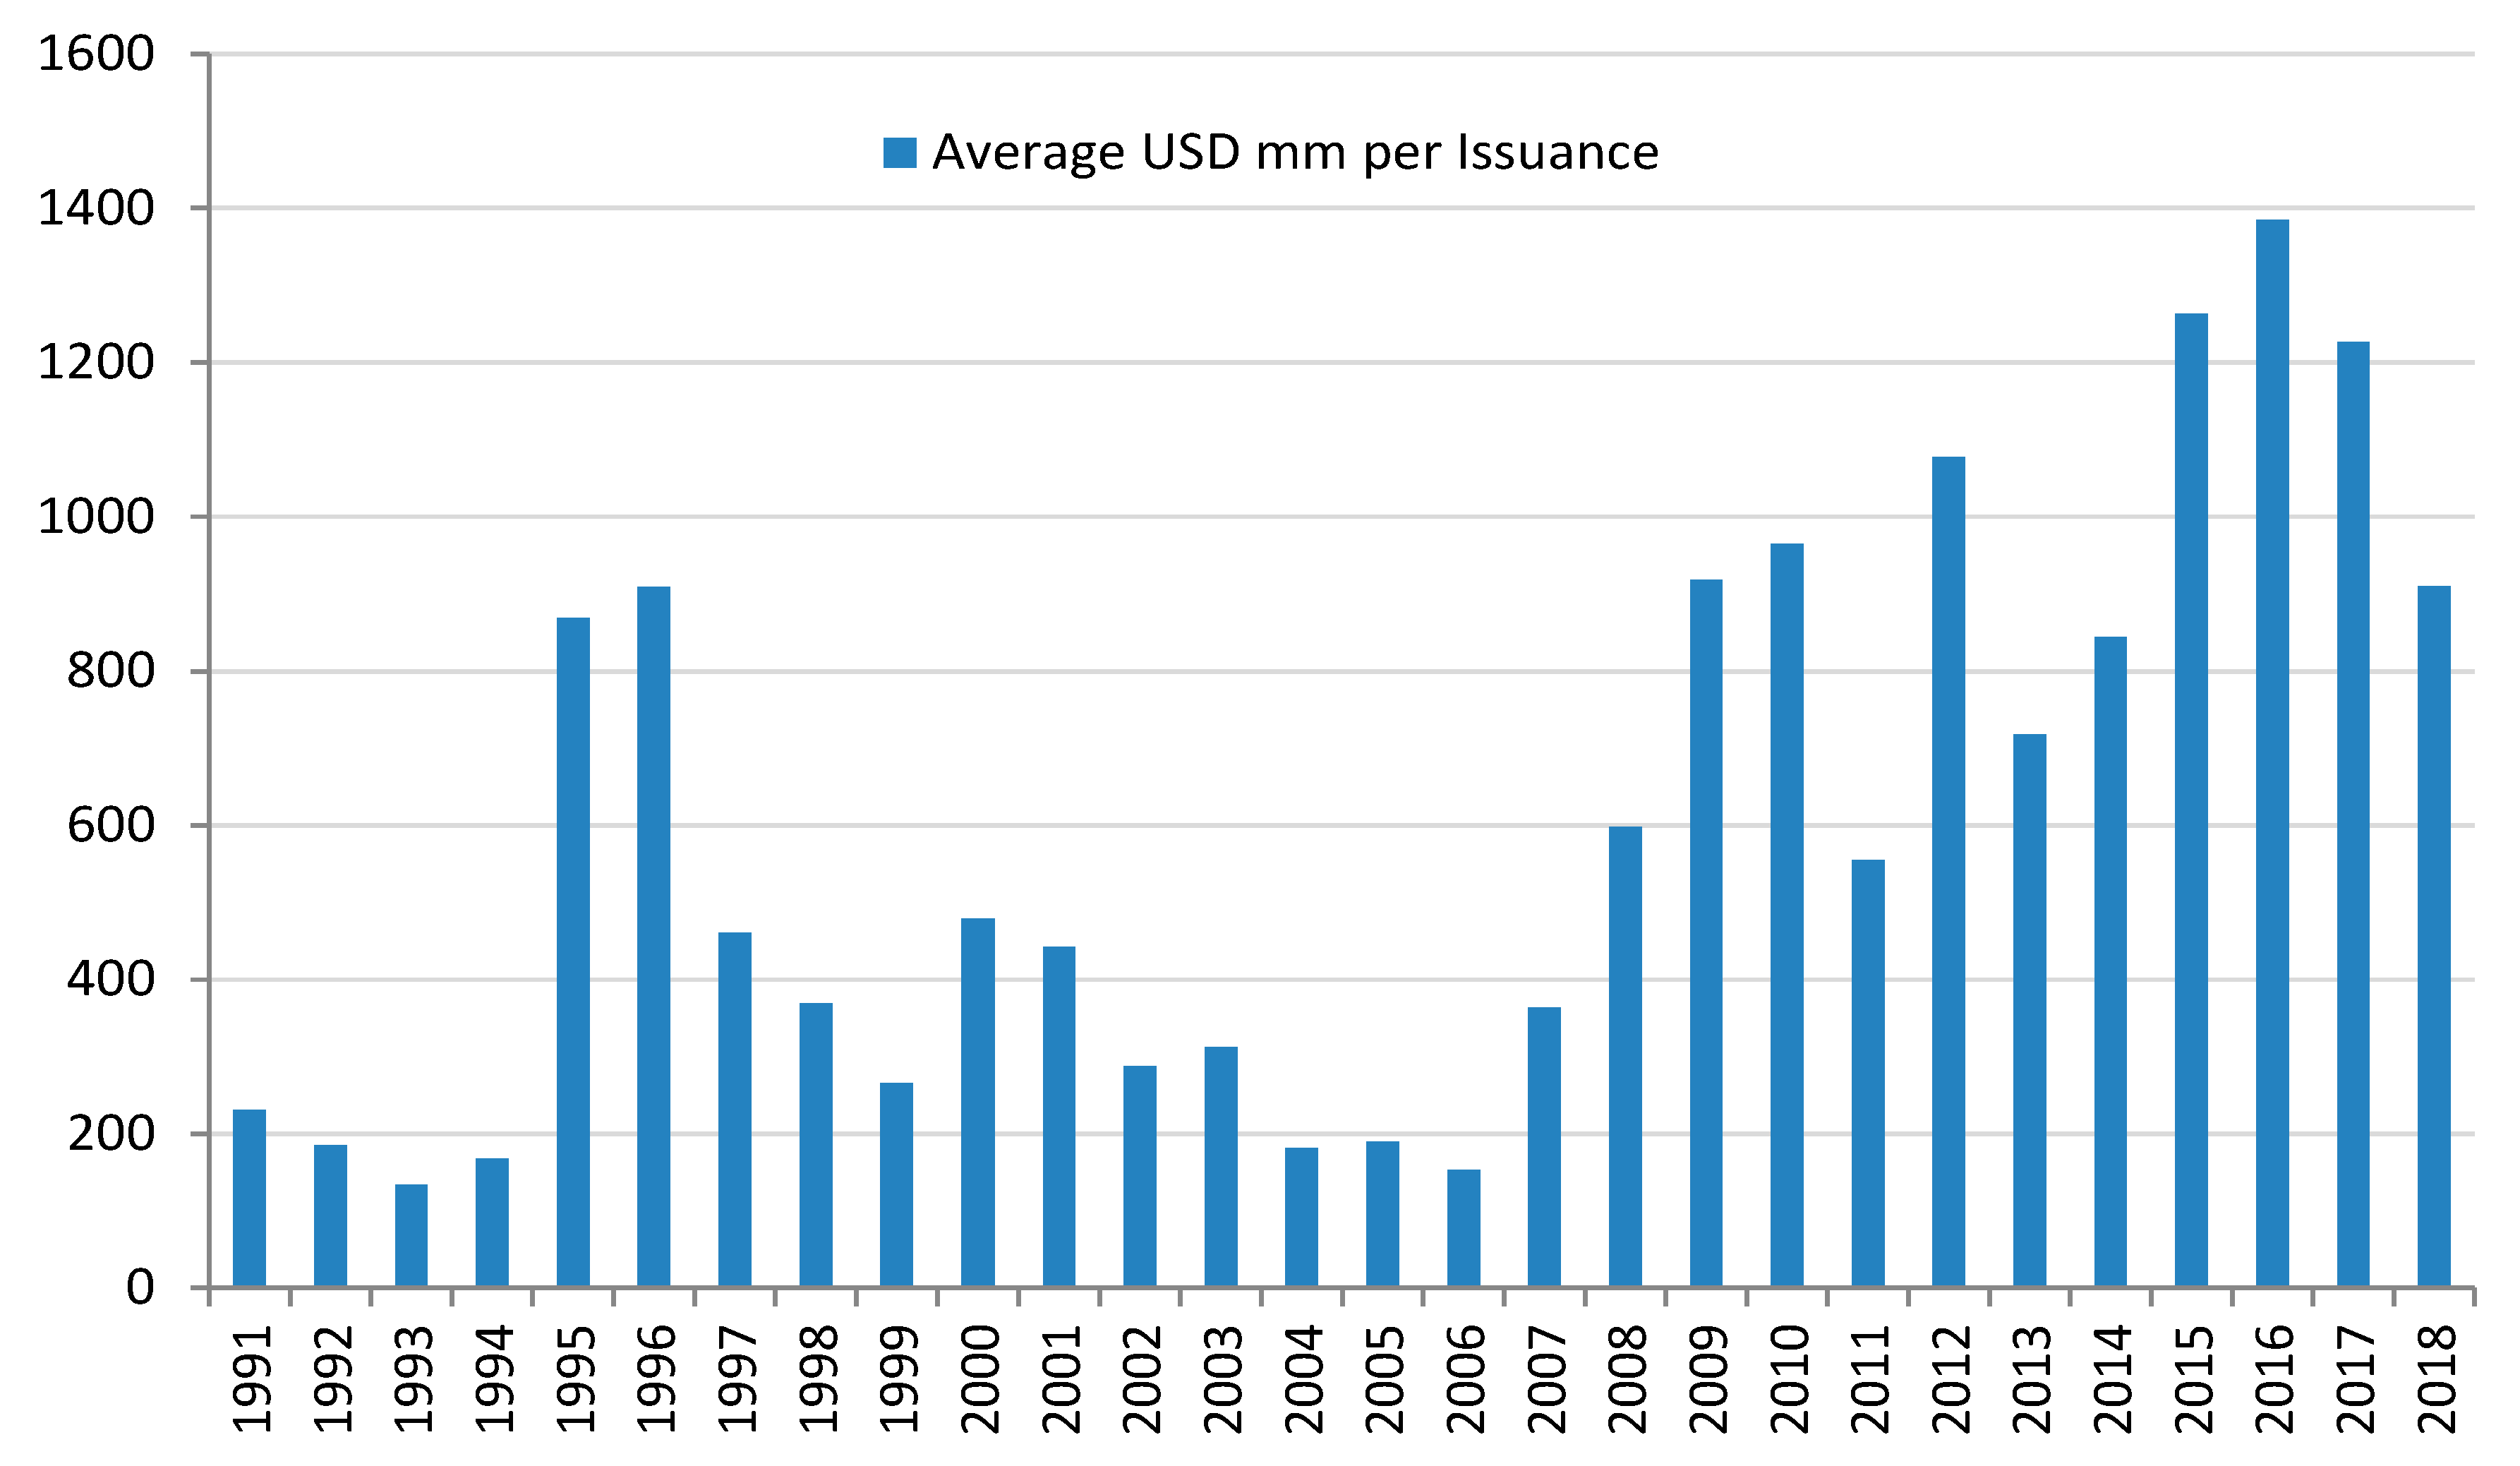
On average, in the period ranging from 2013 to 2016, the total size of the convertible securities outstanding, mandatory and non-mandatory, was USD392 billion according to the Bank for International Settlements 2016 [
21], and the total size of outstanding MCNs on that period was USD67 billion—MCNs represent 17.1% of the convertible market. Nevertheless, the academic literature related to standard convertible bonds is disproportionally larger than the one studying mandatory convertibles [
22]. See
Figure 2.
As can be seen in
Figure 2, the average notional of the MCN issued has grown over time. The number of MCN issues from 2010 to 2018 has been 116, and the number of outstanding MCNs as of June 2018 is 49. The MCNs outstanding notional as of June 2018 is USD41 billion.
4. Mandatory Convertibles Price Model
There are several types of MCNs, but in their modern and more accepted version [
13] can be decomposed into three components that can be valued independently: a predetermined coupon regularly paid as a strip of cash flows, the underlying stock that will be delivered at redemption, and an embedded physically settled ratio call-spread consisting on an at the money call option purchased by the issuer and an out of the money call option sold by the issuer [
10]. The options are warrants in nature since they represent new shares, but the call-spread is bought by the issuing company and the ratio of the upper call is lower, therefore a simplified options valuations model can be used. An alternative decomposition consists on the valuation of a prepaid forward, a predetermined nominal coupon regularly paid as a strip of cash flows, and an options ratio collar, consisting of a physically-settled put option purchased by the issuer and a physically settled call option sold by the issuer and the obligation to deliver shares at maturity if the stock trades between both strikes [
2,
13].
It is worth to note that on an MCN, the only part that possesses a credit component and, therefore, that can produce a loss to investors in the case of a credit event is the strip of coupons, since one issuer can always deliver its own shares in a distressed situation. However, the coupons must be discounted using the issuer’s subordinated or senior credit curve [
13]—most mandatory convertibles and preferred shares rank junior in terms of principal and interests. With regards to the day count, in the US coupons are paid quarterly and on a 30/360 basis, and in Europe coupons are paid annually or semiannually and on an act/act basis. The MCN notional must be discounted at the risk-free rate plus the liquidity cost of the investors since the issuer can always deliver shares even in a distressed situation or at maturity. However, reading deeper into the documentation of most European MCNs and on some preferred shares, the notes are structured as junior to all other liabilities of the issuer, but in general the notes will deliver cash or shares in an event of default, at the election of the investors, therefore the investors can opt to keep a claim on the residual estate in case of a default. Since the credit component is limited to the present value of the strip of coupons, standard options valuation as Black-Scholes and Merton or numerical models well tested in options valuations can be applied to calculate the value of MCNs [
23,
24].
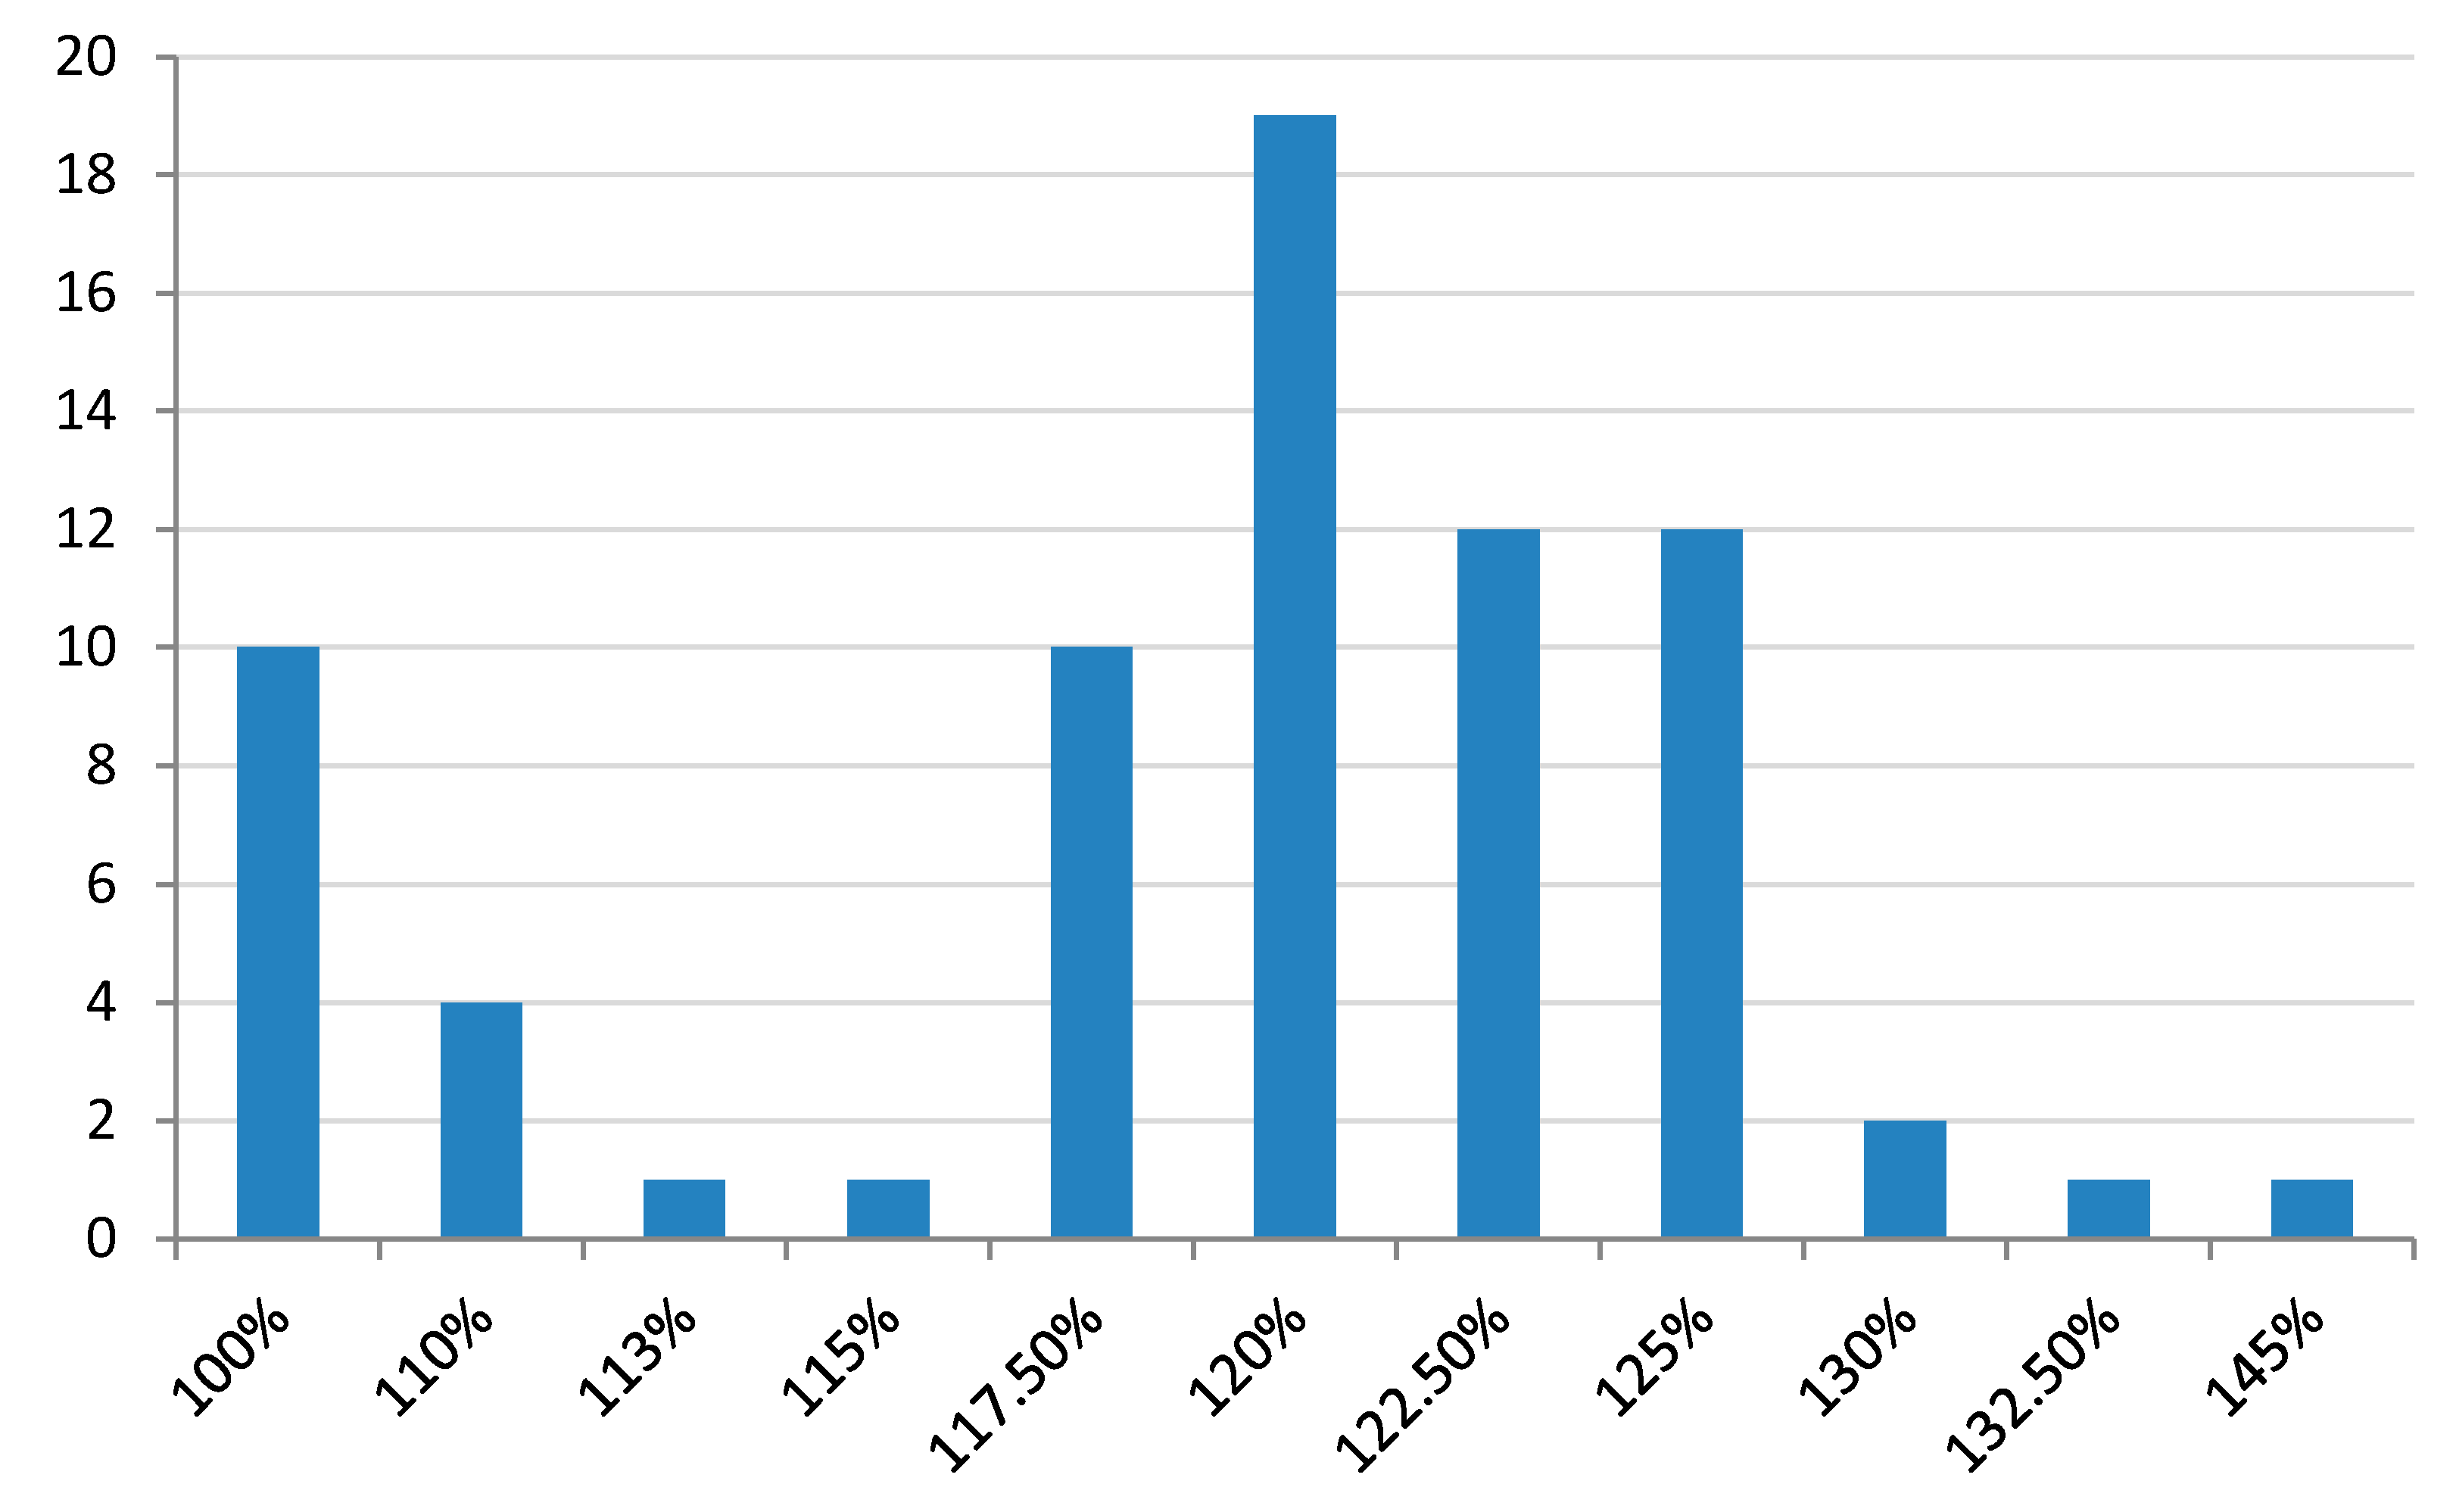
Due to the market appetite for higher coupons, historical and tax reasons the typical MCN has two conversion triggers, hence two conversion ratios, the lower conversion ratio and the upper conversion ratio. The typical strikes of the upper call sold—upper conversion ratio—can be seen in
Figure 3.
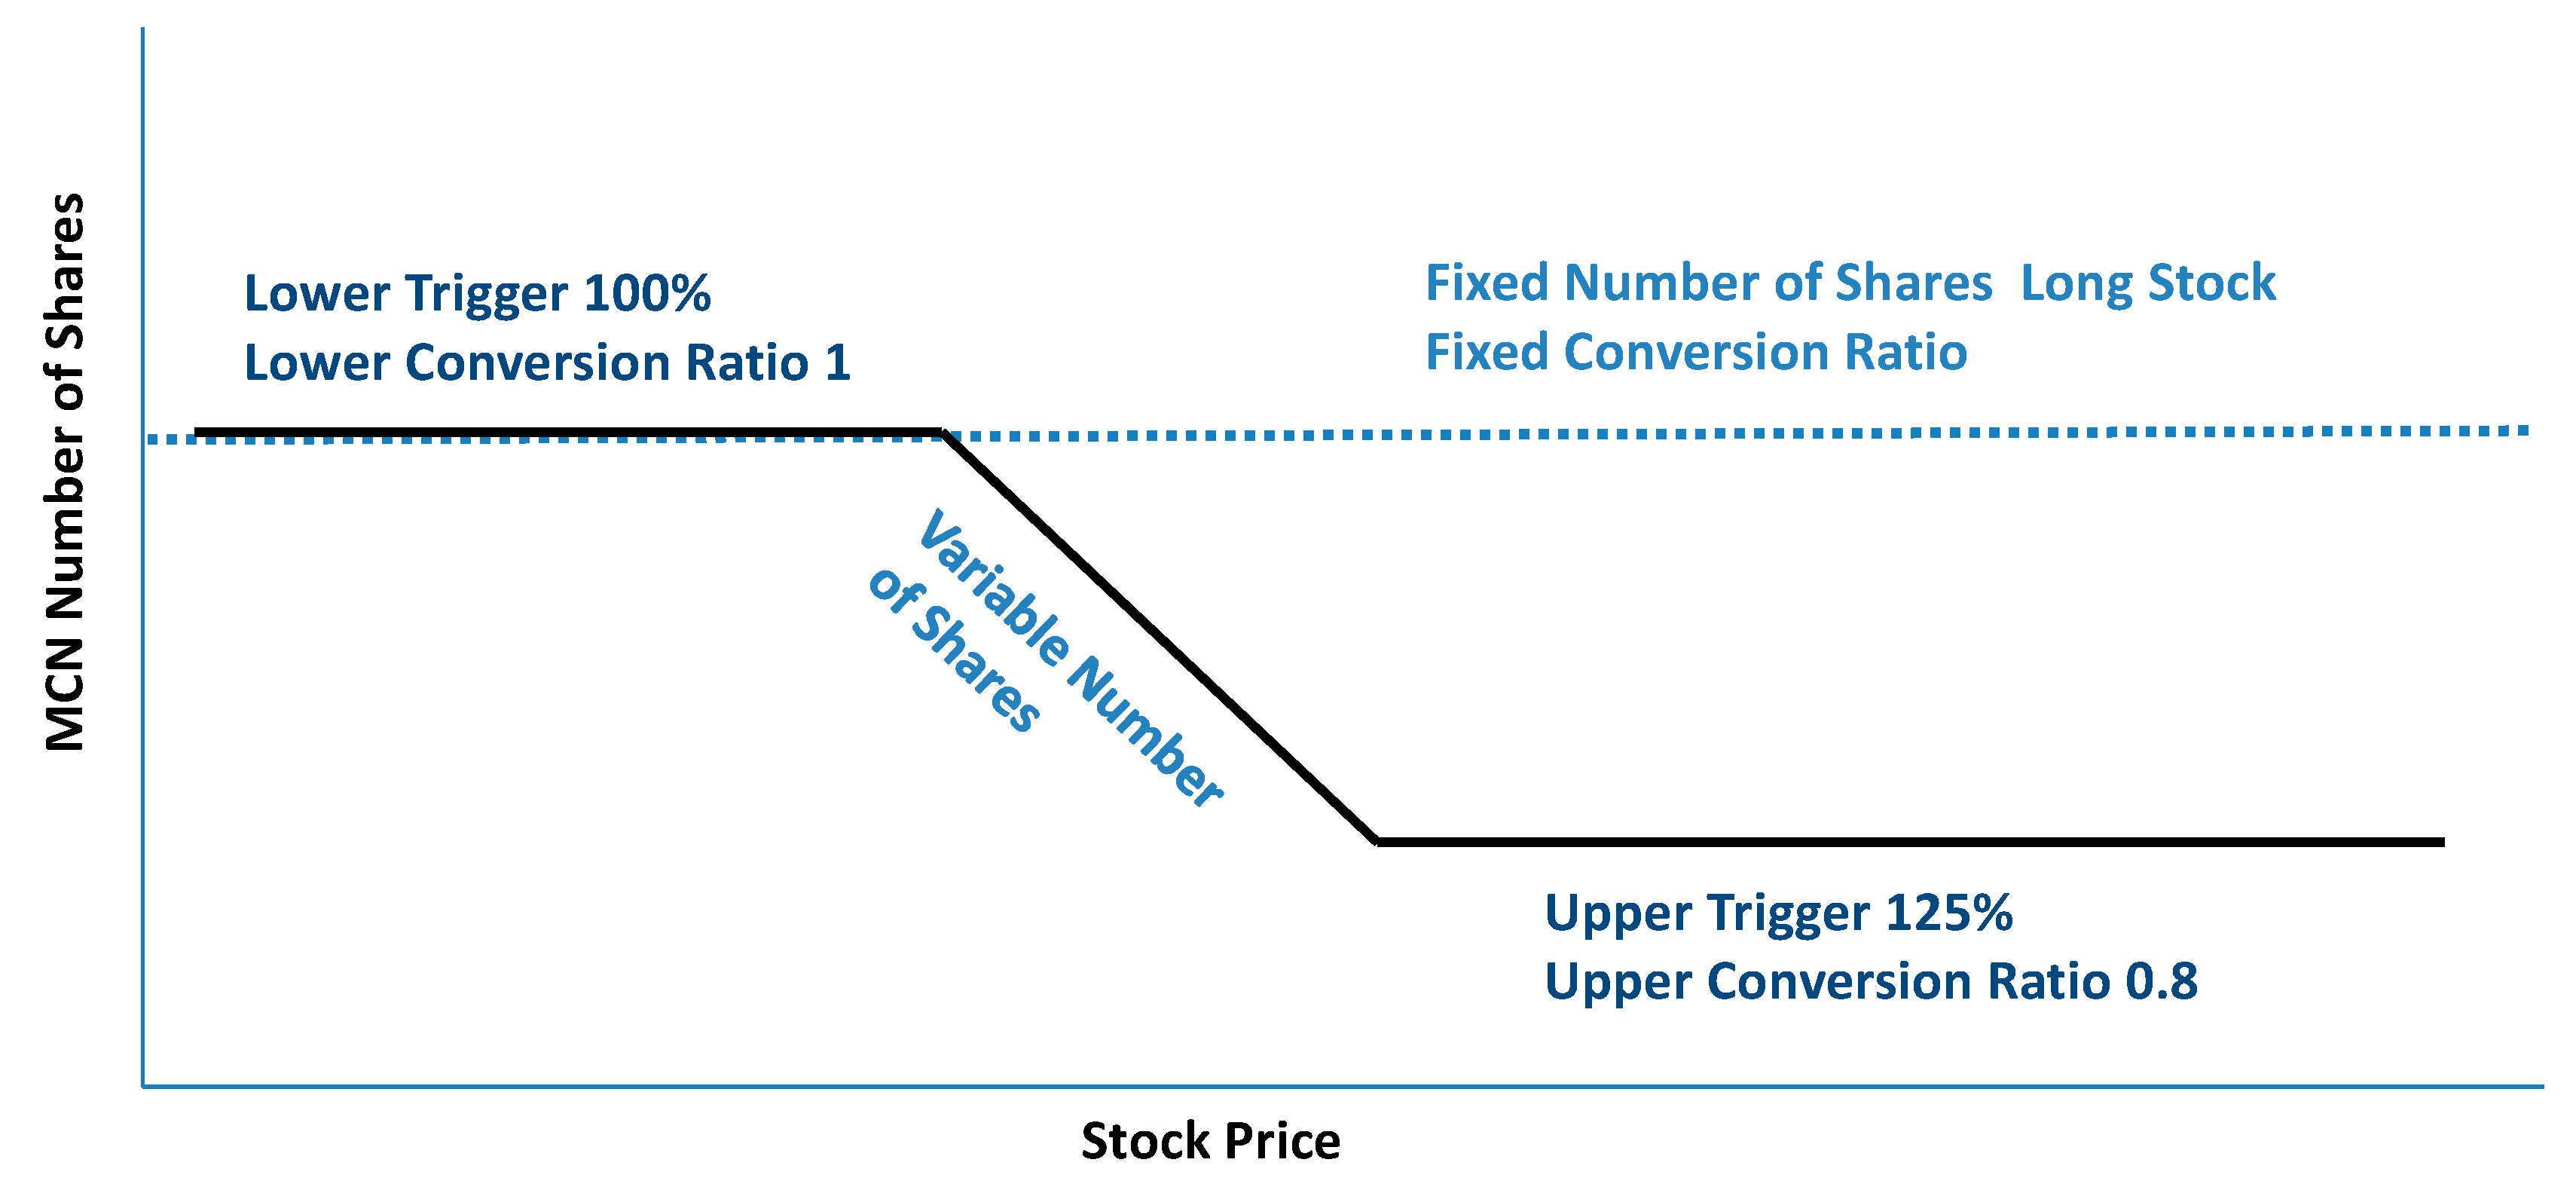
The number of shares delivered at redemption is given by the upper and lower conversion ratios as it can be seen in
Figure 4. The formulas that govern the number of shares to be delivered at redemption are as follows:
where:
The final S is generally calculated as the average closing market price of the underlying stock on the last 20 to 60 days prior to contractual maturity. This feature tries to adapt to the practice of broker-dealers to market long-term single stock options with a final asianing period that helps to reduce the gamma risk at expiry (Arzac) [
25]. This is another recent change of the MCN market aimed to attract arbitrage investors.
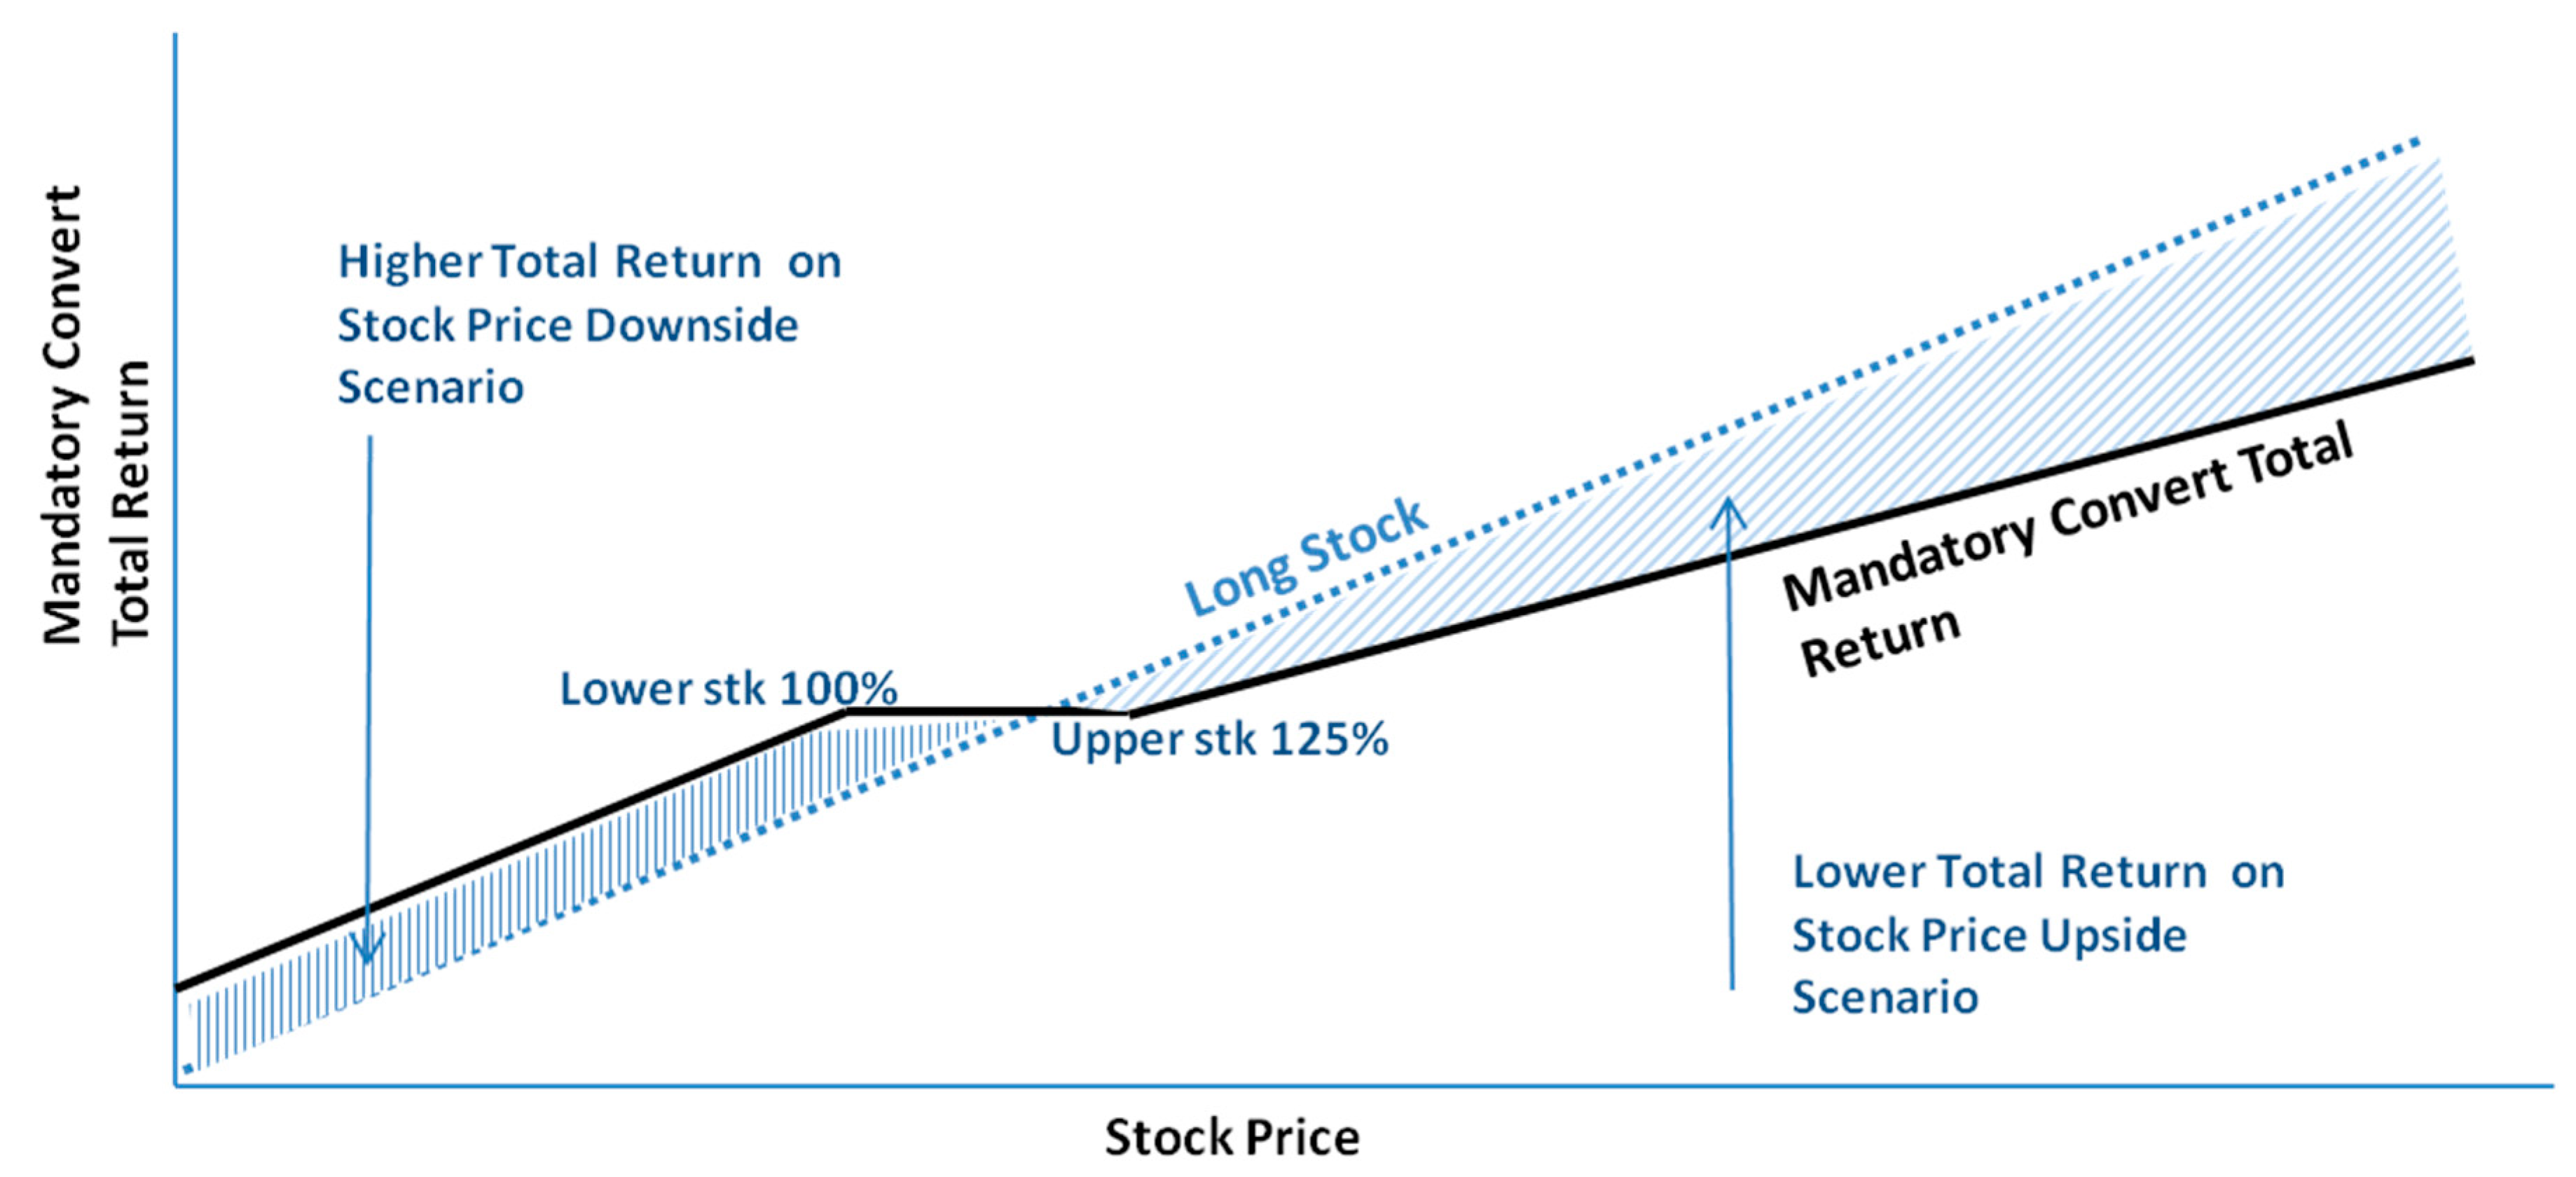
The payoff of MCNs is substantially different to the payoff of standard convertibles (
Figure 5) since there is no downside protection for investors, and it is also different to the total return of the common stock. As opposed to a traditional convertible bond, issuing an MCN implies a sure dilution at maturity, and at the announcement, the underlying stock price should react differently from a standard convertible bond, whereas per Gillet and La Bruslerie the stock price reacts often negatively [
26]. In 2013 Kallberg et al. [
19] described a negative announcement effect in the value of the shares, and a positive effect in the credit default swaps of the issuer. The return of an MCN is close to a prepaid forward share sale agreement. One particular feature of modern MCNs is that at higher stock prices the mandatory convertible delivers fewer shares and therefore less dilution for existing shareholders than a straightforward equity issue. The upper conversion ratio is lower than the lower conversion ratio. At lower stock prices the dividend enhancement provides a higher return for investors than common shares as can be seen in
Figure 6.
MCNs can be synthetically replicated as a prepaid forward share sale agreement plus a strip of fixed coupons, plus a sold equity call option and a purchased equity call option at a higher strike on a lower notional, a ratio call-spread. We consider as non-relevant the effect of the dilution and we price the warrants as an option call-spread (bull call-spread) [
10,
12]:
Stripping out the credit component and dividend changes, the variation on price on MCN vs. the share price follows the value of the underlying options as it can be seen in
Figure 6. Dividends may affect the pricing of MCNs and forecasting future dividends is never an easy task, to avoid this issue, all recent MCNs—and many standard convertibles now—include full dividend protection clauses, as explained by Zimmermann [
27], to make them more appealing for new investors, namely, convertible arbitrage funds, making it easier to hedge for them. Each dividend payment from the company is a cash flow out for shareholders and option holders, and to maintain the conditions agreed at inception, the conversion prices upper and lower must be adjusted. Clauses adjust levels for both Upper and Lower conversion prices:
where
is the price of the underlying stock the day before the actual dividend payment. Reducing the conversion price is equivalent to increasing the conversion ratio as it adjusts the mandatory convertible by the value reduction on the underlying stock that represents the dividend payment. Standard dividend protection clauses for the upper and lower conversion ratio, read as follows:
5. Dataset and Methods
The analysis is based on a dataset of 81 MCNs issued between 2010 and 2018 with initial notional higher than USD100 million equivalent. The data is public and has been obtained from Bloomberg and DataStream. Non-listed issues, emerging markets notes and some issues linked to IPOs have been excluded, since stock market liquidity pre and post MCN issuance is a prerequisite. According to Bloomberg, the total number of MCNs issued from January 2010 to March 2018 is 116 with a total issued notional of USD110 billion. This study covers 81 out of the 116 MCNs issued and a notional of USD78 billion, that are mainly notes issued in the US or Europe.
The Bloomberg valuation tool-set has been used for the options and credit calculations. The same tool was used as the source of the implicit volatility surfaces, implicit interest rate, and credit calculations. The options calculations imply the adjustment of the dividends in the model, and the dividend stream has been obtained from the prospectus of the notes, besides some MCNs included dividend protection clauses.
6. Data Analyses
6.1. MCN Implicit Spread and MCN Implicit Yield
The value of the embedded options produces an important effect in the nominal coupon paid by the MCNs issuer. In the 81 MCN studied the average value of the call-spread is 9.92%. Then as a consequence, we have designed what in our view is a more accurate way to weight the cost for the issuer of an MCN; a new dependent variable, designated as MCN implicit spread, eliminates the distortion caused by the embedded options. The implicit spread is the spread over the risk-free rate of the note at issue date, minus the annualized discounted value of the embedded call-spread as in the model proposed by Arzac [
10,
12]. We have made a simplification assuming the day count and frequency of the coupons are equivalent in the three measures:
Additionally, with the aim of helping in the comparison with the coupon paid by the mandatory note, we have defined another parameter, the
implicit yield of the MCN, as the implicit spread plus the equivalent risk-free rate:
Under the above assumptions, comparing the cost an MCN with the cost of issuing senior or subordinated debt can be performed with simple subtraction.
The value of the ratio call-spread is calculated as the cost of an at-the-money call minus the cost of a call strike the initial upper premium, using the volatility smile of the stock. The value of the call-spreads has been calculated using the parameters existing at the issue date for each one of the 81 MCNs using the then prevailing market values of Volatility, smiles, volatility bid-asks, dividend yields, and risk-free rates from the Bloomberg database. We have used the Black-Scholes discrete model for options valuation (Black Scholes) [
23]. The value of the call-spread has been adjusted for dividend protection clauses, using the same dividend thresholds as in each of the MCNs’ documentations.
6.2. Variables Study
The analyzed variables are Mandatory coupon, mandatory implicit yield, and mandatory implicit spread at only one point in time, the moment of the MCN issuance. The independent variables are senior credit spread, senior credit yield, dividend yield, proportion of shorts and value call spread. A synopsis of all the variables is presented in
Table 1.
The independent variables fulfill the conditions for the regression analysis. The descriptive statistics of the dependent and independent variables can be seen in
Table 2.
Correlation analysis between the dependent and independent variables can be read in
Table 3. As suspected the correlation between the divided yield and the MCN is low, nonetheless the correlations between the newly introduced variables, MCN implicit yield and MCN implicit spread and the MCN coupon are significant.
6.3. Univariate Regressions
Firstly, we performed univariate regression analyses to detect the relationship between the different couples of dependent and independent variables. The results can be read in
Table 4. The widespread investors approach is that MCNs and preferred shares are dividend yield enhancing instruments, therefore that the MCN coupon is directly related with the dividend yield of the underlying shares. However, regressions and correlations between MCN coupon and dividend yield offer poor results. The results suggest that issuers do not use the dividend yield as primary guidance for setting the facial coupon of MCN.
Secondly, we studied the regression of the MCN coupon versus the cost of the equivalent senior debt. The Senior Credit Yield is calculated taking the average of the outstanding senior debt securities at the time of the MCN issuance and with similar maturities. Again the regression does not produce a conclusive relationship although the correlation is 29.13%, higher in this case.
However, absolute cash flows are important for security issuers. We regressed the MCN implicit yield against the senior credit yield of the issuer at the time of issuance and the correlation factor, in this case, is relevant, reaching 53.6%. This correlation implies the MCN implicit yield can be a good guide to set the coupons of the new MCNs issuances.
Following the research of Chemmanur [
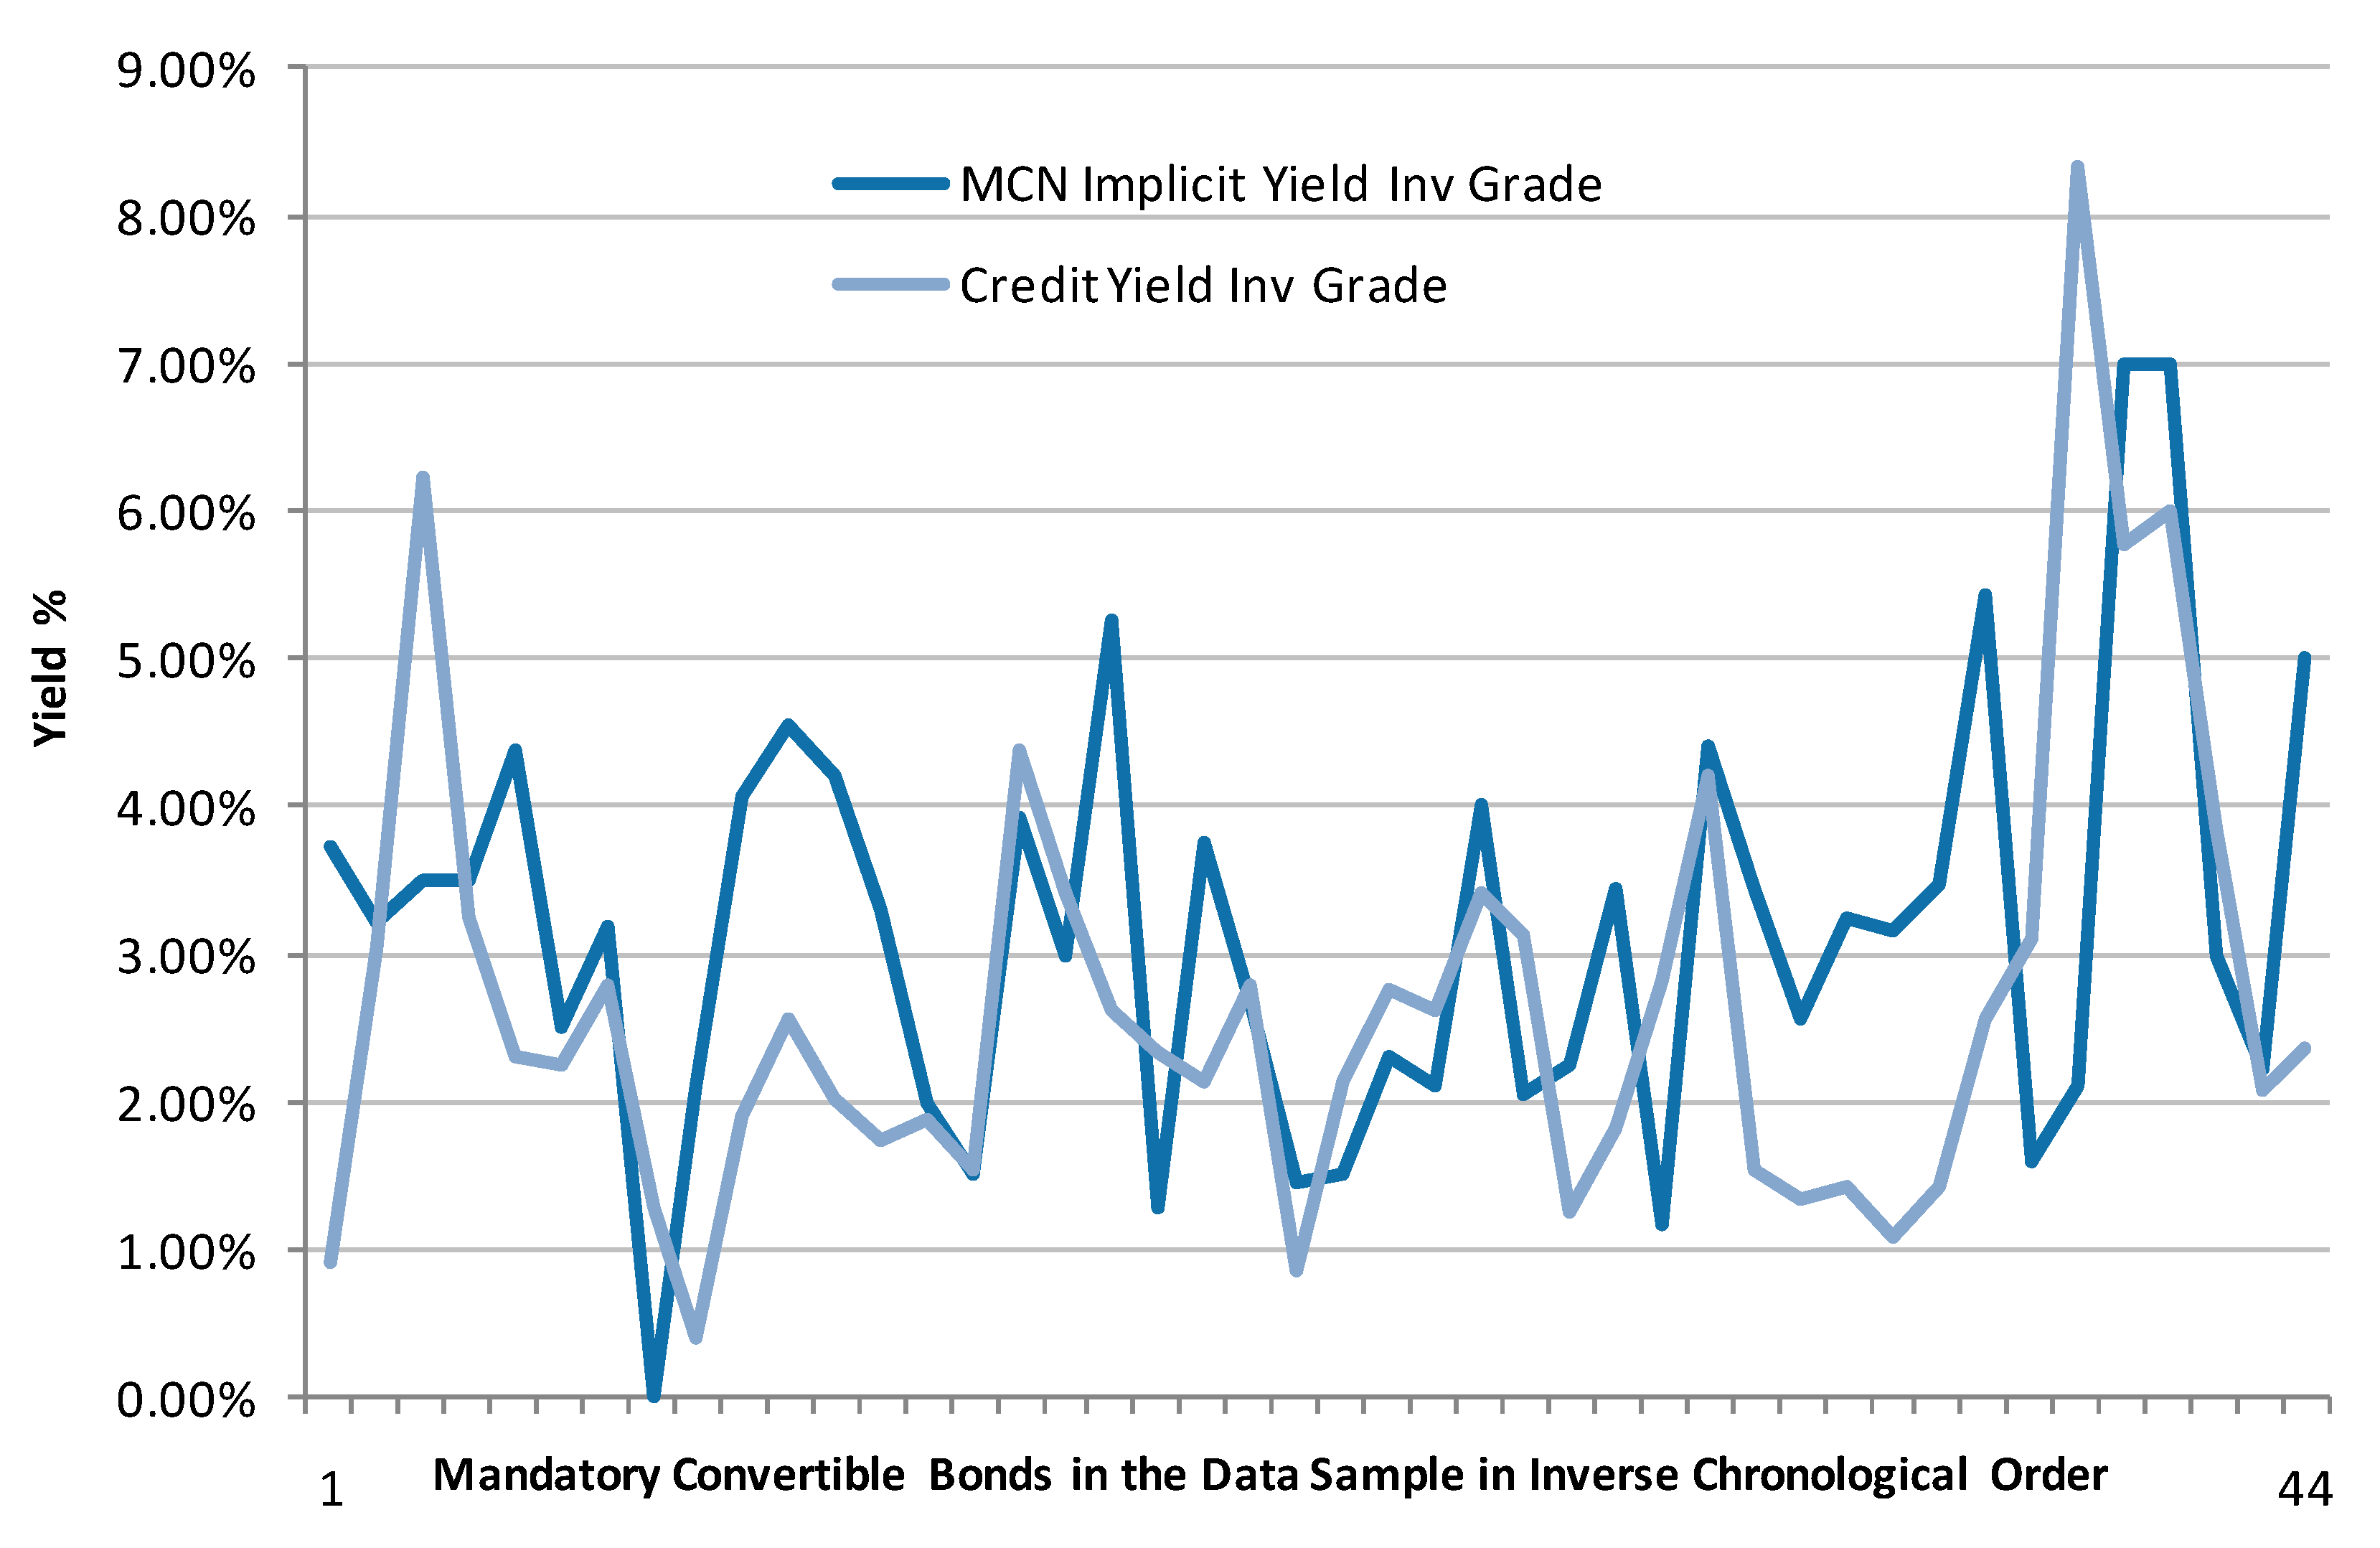
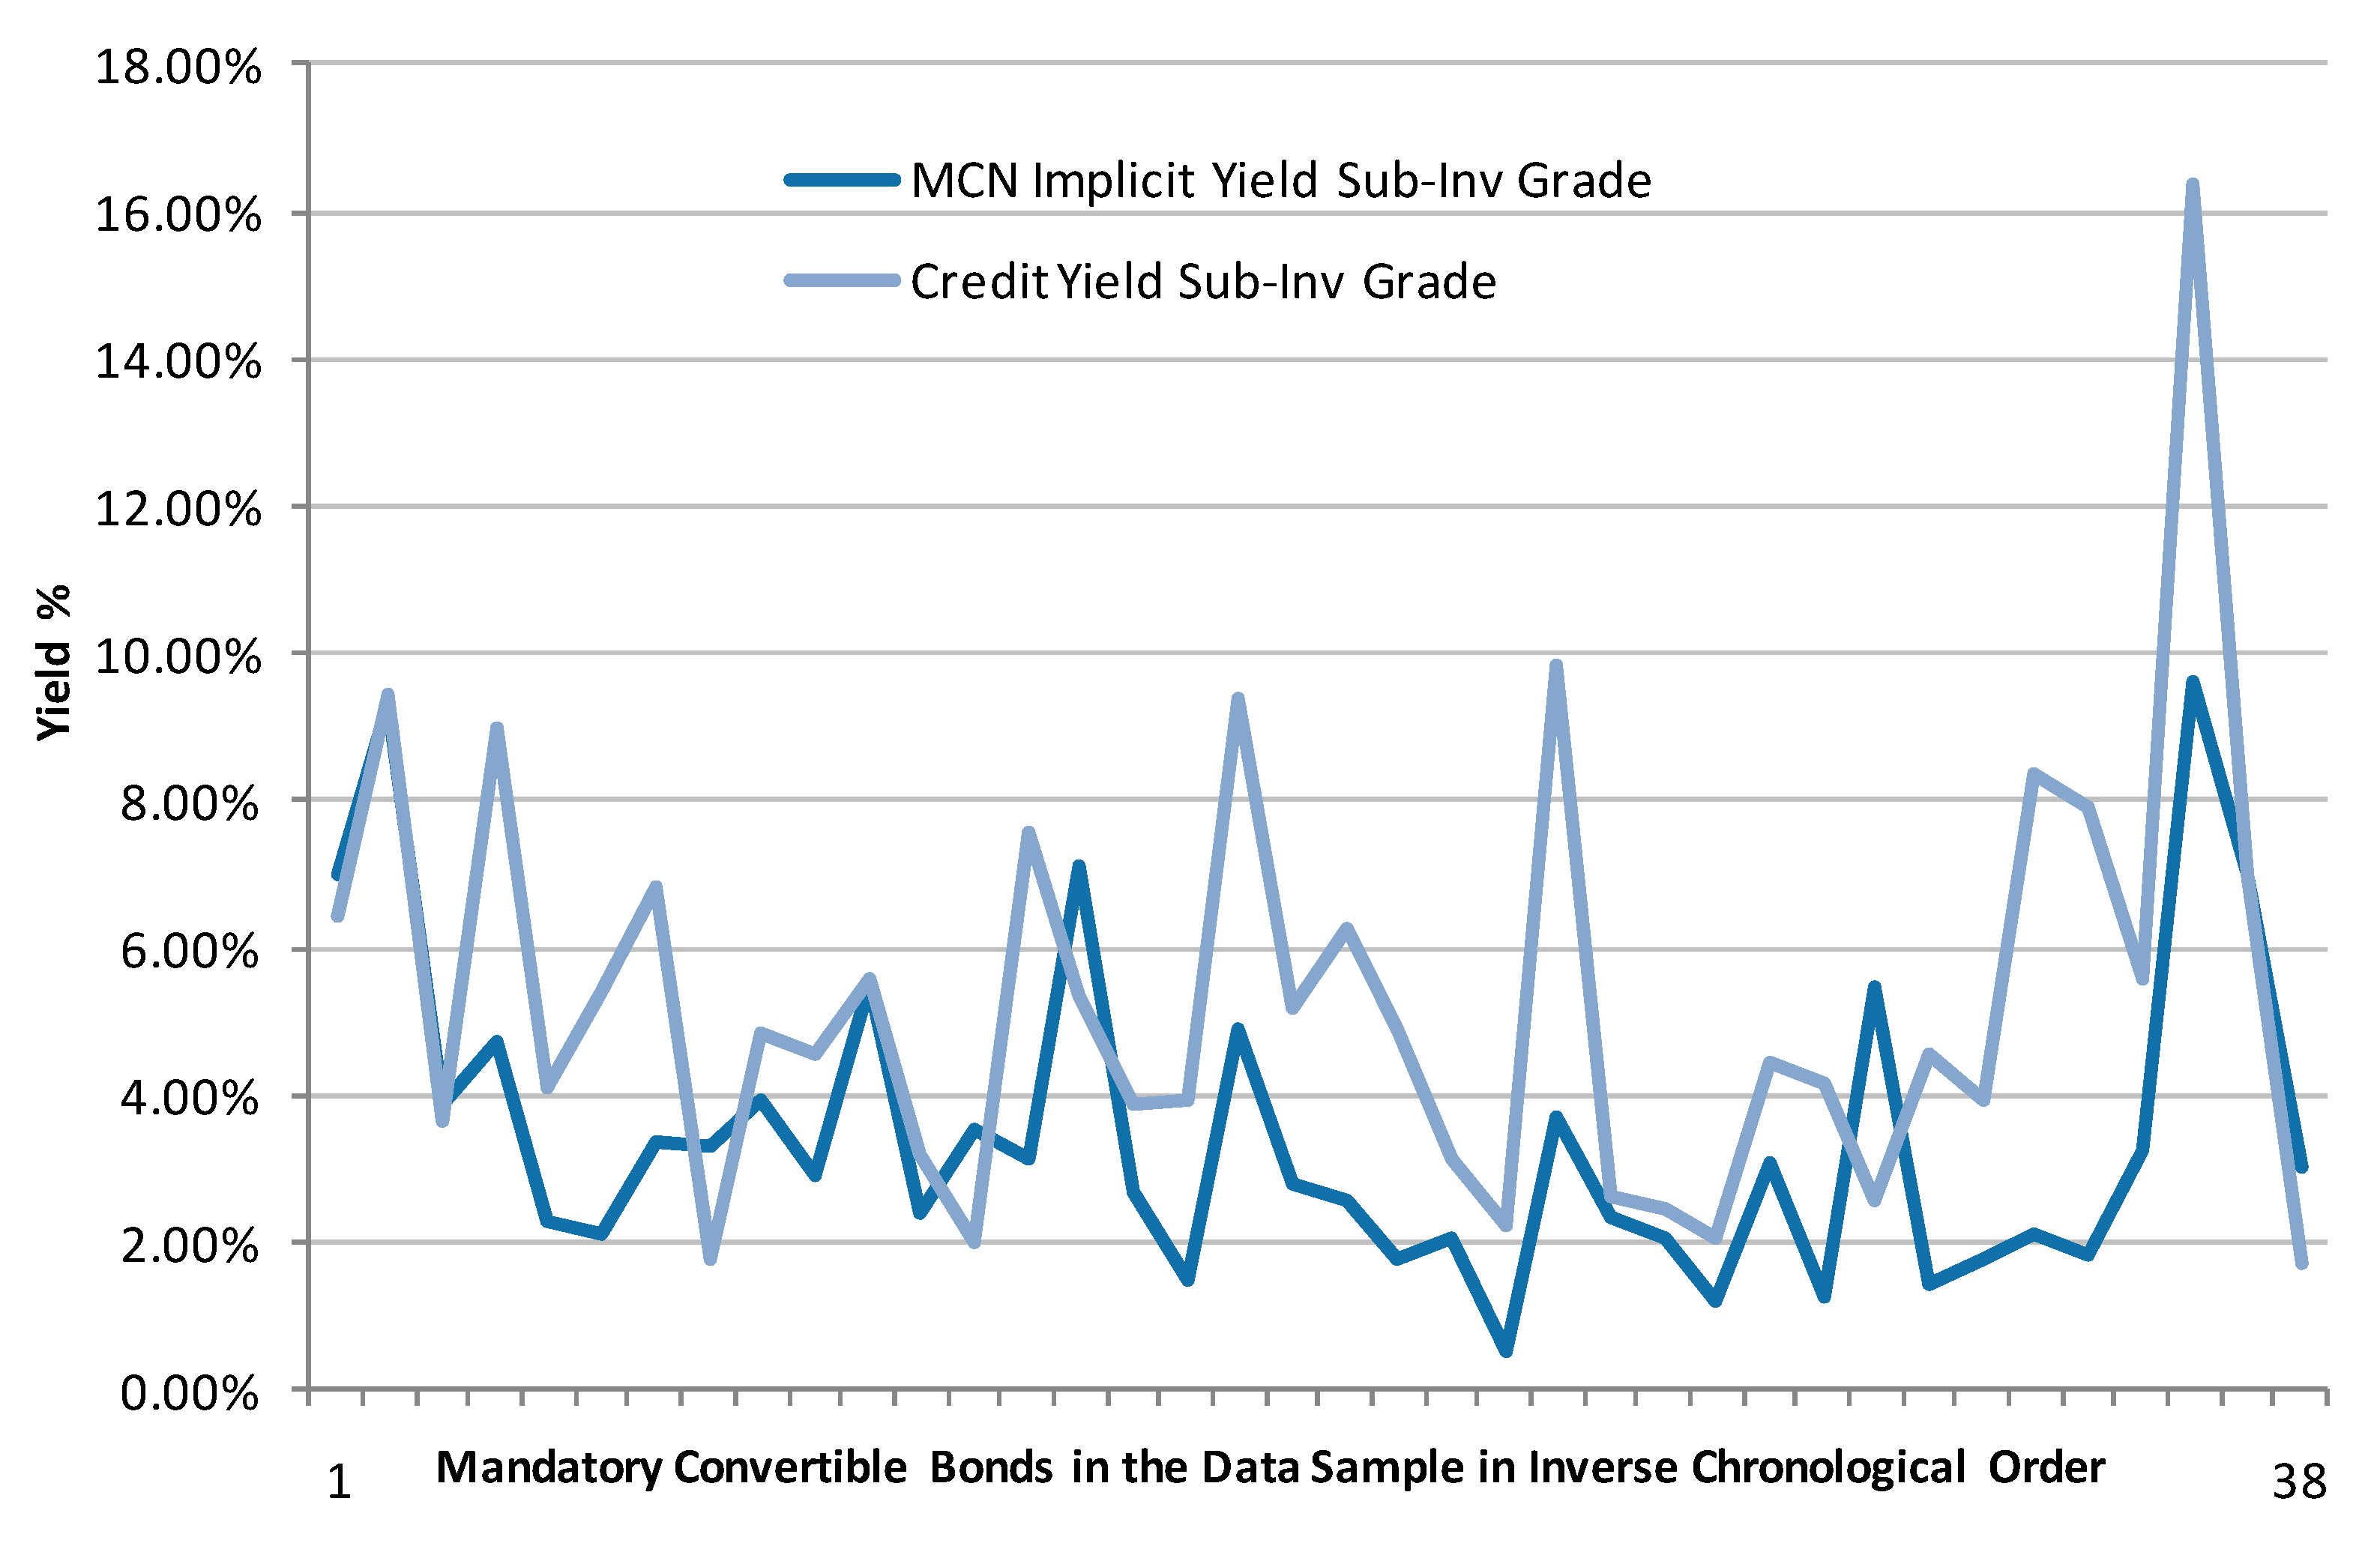
17], we split MCNs issuers between those that need to avoid the asymmetry of information—investment grade—and do not want unnecessary dilution and those that are in a distressed situation and that cannot use another form of capital—sub-investment grade companies. To perform the univariate regressions, we divide the MCNs into
investment grade issuers and
sub-investment grade issuers. The univariate regressions show that the relationship between the MCN Implicit Yield and the issuer senior credit yield is higher for sub-investment grade companies than for better credit quality issuers, due to the higher coupons and therefore higher credit component in the MCN—and also due to the higher concern of the investors about the situation of the issuer. Additionally, the regression of the MCN implicit yield against the dividend yield of the underlying stock, splitting investment and sub-investment grade issuers, shows a higher correlation for investment grade issuers than for companies closer to a distressed situation, signaling that the price to pay by sub-investment grade issuers is less linked to its dividend yield and closer to its credit spread. Sub-investment grade issuers are more prompt to suspend dividends.
Another outcome of this research is the great importance of the embedded options in the value of MCNs. The average call-spread option value is 9.92%, as can be seen in Table 7, and the average annualized value is 3.35%. This means that more than half of the coupon paid by MCNs is composed of options value. However, the regression analyses do not show a high direct relationship between the facial coupon and the value of the implicit options or the volatility of the underlying. Company managers could reduce the MCN coupon by increasing the call spread value, however, most MCN set their upper conversion ratio between 117.5% to 130% of the spot price, reflecting the appetite of investors for those levels and also due to the fact that wider call-spreads are difficult to hedge and monetize by options dealers.
The robustness of the models has been tested using quadratic regressions that show a slightly better fit of the parabolic curves—slightly higher R
2—and that can be read on
Appendix B.
6.4. Arbitrage Investors in Mandatory Convertible Notes
In the study dataset, from 2010 to 2018 on average 53% of the purchasers of MCNs were convertible arbitrage investors and only 48% retail, long equity or long credit investors. These investors try to obtain a quasi “market risk-free” investment. To achieve it they buy MCNs, borrow the underlying shares and sell them, all at the same time, to maintain a delta-hedged instrument. Using this strategy, the price movements of the shares and the MCN are immunized. Investors can sell the options or can develop a delta-hedge strategy to synthetically sell the options. The strategy has a cost, but investors get the Implicit Yield of the MCNs minus the borrow cost and minus the bid-ask cost of the hedge strategy.
The convertible market has evolved since the year 2000 and particularly from 2010 onwards since an important proportion of MCNs investors are hedge funds and arbitrage investors. The format of the security has evolved to cater for the appetite of such investors, following Grundy [
12,
14]. Dividend adjustment clauses have been designed to facilitate convertible arbitrage techniques and most issues now include such clauses. However, the strategy is not totally free of risk for investors: firstly, established borrow markets only allow short stock borrow periods (daily, weekly, or monthly borrow), but MCNs commonly have maturities of three years. Investors run the risk of a borrow market disruption and the breakage of the strategy. Secondly, the hedge investors run the risk of an increased cost of borrow during the life of the transaction. Finally, the MCN coupons are paid by the issuer quarterly or annually. Therefore, as described in
Section 7, investors run the risk of an issuer credit event that prevents them to cash in the coupons.
Short-term borrow cost varies between 2 bp to 50 bp (basis points), depending on the scarcity, and consequently on the credit quality of the underlying shares, since distressed companies are highly demanded by short sellers, and a sudden increase in the short-term borrowing cost can be considered as an advanced indicator of a potential credit distress situation for a company.
One of the hypotheses of our study says that convertible arbitrage investors are fundamental for MCNs price formation. As explained above, the fundamental parameters for arbitrageurs are the stock borrow cost, the MCN nominal coupon, the liquidity cost, and the risk-free rate—the risk-free rate is the yield of alternative investment in German Bunds or in US Treasury Bills.
We have done a univariate analysis to analyze the impact of arbitrage investors in the Implicit Spread of the MCN and the results are in line with our hypothesis. When the proportion of convertible arbitrage investors increases, the MCN price for the issuing company improves, due to two effects, the increase in demand for the notes and the adjustment of the implicit spread to a level close to the sum of the long-term stock borrow cost plus the liquidity cost. As mentioned above the stock borrow in an MCN must be maintained for the life of the note, namely three years, but the stock borrow market only offers periods from one day to one month. In consequence, hedge investors manufacture the expected “three years borrow cost” in the implicit yield, asking a price that advances potential future company credit distressed periods and potential borrow market disrupted periods.
A separate analysis of investment grade and sub-investment grade issuers shows different results. The simple regression indicates that the higher the proportion of hedge investors the lower the cost (implicit spread) for investment-grade issuers, meaning that these investors are the ones that set the price of MCNs in this case. However, in the case of sub-investment-grade issuers, the regression analysis shows a lower relationship between the proportion of short sellers and price improvement. The average MCN implicit spread of sub-investment-grade and investment grade issuers are close issuers in our sample, but it must the effect of the credit component from credit investors and potential equity appreciation from long equity investors what seems to be dragging short hedge investors to similar pricing. Results can be found in
Table 5.
6.5. Multivariate Statistical Models
Since there are several independent variables can concurrently predict the cost of MCNs we have generated five regression models. We created five models to test the variables that can predict the cost of MCN, namely the dividend yield of the issuer, the cost of the issuer’s senior credit and the appetite of hedge funds for the asset.
Model 1 predicts the MCN coupon, therefore, the value of the implicit options is one of the independent variables. The rest of the models exclude the value of the implicit options that is a parameter that can be influenced under certain limits by company managers in the process of designing the MCN to be issued.
Model 2 predicts the implicit total cost that the issuer will pay using the dividend yield, credit yield, and proportion of arbitrage investors as independent variables. Model 2a and Model 2b perform a separate analysis for investment grade and sub-investment grade issuer to analyze whether MCN issued by distressed companies are closer to debt than MCN issued by healthy credits.
Model 3 uses the spread over mid swap or treasuries to remove the risk free cost of liquidity from the analysis. The results of the model are shown in
Table 6.
The R2 results show that the five multivariable models are better predictors of the MCN cost than any of the univariate models.
The five models confirm our hypothesis that the dividend yield of the underlying stock is a less important factor than the credit component, as a predictor of the MCN cost. Additionally, the lower predictive power of Model 1 compared with the rest of the models confirms the hypothesis that the MCN Coupon is not a good indicator of the real cost and that it is necessary to strip out the value of the implicit options.
Additionally, Models 2a and 2b signal that the cost paid by sub-investment grade issuers is even less linked to its dividend yield and closer to its credit spread. This confirms that, as in the univariate regressions, since sub-investment grade issuers are more prompt to suspend dividends, investors prefer the credit yield as guidance for returns. Nevertheless, the multivariate models for investment and sub-investment grade companies show a similar impact of the underlying senior credit yield in the final MCN yield.
Finally, the five models show a similar predictive influence of the proportion of arbitrage funds in the investors’ pool.
7. Results Summary
Firstly, as in the hypothesis, the results show that there is a lower relationship between the dividend yield of the underlying shares and the MCN nominal coupon. The latter is not the main factor that affects more the price formation of MCN. Secondly, the average implicit spread and implicit yield of the MCNs issued from 2010 to 2018 are below the average credit spread and yield paid by the senior notes of the respective issuers. The average implicit yield is 3.27% and the average yield of the comparable senior credit securities of the issuer is 3.86%. See
Table 7.
The results also show that MCNs are particularly benevolent with sub-investment grade issuers that can achieve relatively lower implicit yields issuing MCNs, obtaining an implicit yield of 3.36% vs. 5.55% on its senior debt, compared to investment grade issuers (3.18% vs. 2.42%). Despite the fact that MCNs are not equivalent and cannot be compared directly to senior debt, in terms of cash flows, on average it is cheaper to issue MCNs vs. debt for non-investment grade companies.
Figure 7 and
Figure 8 graphically present how MCN implicit yields are lower than credit yield for sub-investment grade issuers.
Additionally, the study shows that European issuers benefit less in terms cost than American issuers. The implicit yield of the European issuers is 53 bp more expensive than its senior credit yield versus a 36bp improvement for their American counterparts, reflecting both the higher proportion of solid European investment grade issuers and the lower participation of hedge funds in the European investor base in the sample. The participation of hedge funds is similar for Investment-grade and Sub-investment grade issuers. The multivariate regression analyses confirm the hypothesis that the dividend yield is not the main predictive variable for the cost of MCNs and that MCNs are more related to the credit cost of the issuer than to the cost of equity and the credit component of MCNs has a substantial weight.
This study confirms the hypothesis of the importance of convertible arbitrage investors and liquid stock lending markets for mandatory convertibles. The implicit spread and the proportion of convertible arbitrage investors in MCNs are inversely correlated and the presence of short sellers reduces the price for the issuing company.
Finally, the study compares the cost of equity, the cost of senior debt and the cost of MCNs. The individual cost of equity defined as the risk-free rate (Rf) plus the equity risk premium (ERP). The Rf is obtained from Bloomberg as the yield of the 10-year government bond on the issue date bond on each geography calculated on the date of issuance of each MCN. The ERP is calculated using the Capital Asset Pricing Model (CAPM), obtaining the specific country of issuance market risk premium and the individual company beta on the date of issuance. All data can be obtained from Bloomberg. As presented in
Table 8 the cost of equity is on average 768 bp more expensive than the cost of MCNs. The MCNs yield is on average just 69 bp more expensive than the cost of senior debt.
MCNs can be used as a sustainable source of capital for companies:
The price obtained by MCNs issuers is competitive and in line with its senior credit yield.
The cost of MCN is substantially lower than the cost of equity capital.
The existing debt investor base is not tapped and a new investor base offers liquidity to MCNs issuers.
Credit ratios of the company improve when issuing an MCN. Rating agencies assign a high equity credit to MCNs and the credit quality of the issuers is not affected by multiple notes issuance.
The dilution for existing shareholders at maturity can be avoided by share repurchase programs funded by new debt, or issuing a subsequent MCN at expiry, which, in turn, avoids the deterioration of the company credit ratios.
8. Conclusions
A less leveraged economy is more sustainable and less prone to suffer a repeated financial crisis. The main objective of this research is to investigate whether there are hybrid capital instruments that can efficiently finance the balance sheet of companies, at a cost comparable to the cost of debt.
This research represents the largest empiric study about the implicit cost of MCNs using the largest dataset of MCNs issued during a time span of eight years. The empirical literature about MCNs is scarce and previous publications studied a very limited number of notes or just specific bonds. This paper is the first to determine the implicit cost of MCNs and analyses it for the public mandatory convertibles issued from 2010 to 2018. It also studies its relationship with the senior credit yield of the issuer and the impact of the arbitrage investors in the pricing.
The study introduces two new indicators: the MCN implicit spread and the MCN implicit yield with the objective of simplifying the cost analysis of newly issued MCNs. Both parameters strip out the value of the equity options embedded in the securities. The embedded call-spreads are designed by issuers to increase the nominal coupon of the MCNs and to reduce the potential dilution at conversion. Surprisingly, the results of the study show that the implicit cost of issuing this hybrid instrument is on average close or below the cost of issuing senior debt and that is particularly beneficial for sub-investment grade issuers.
This study has several limitations derived from its nature; firstly, the sample database is not very large since MCN are not a very common capital instrument. Secondly, MCNs are fundamentally tailor-made securities and each MCN has specific clauses that can modify the risk profile, the cost of the security and the response to changes in the independent variables. Thirdly, MCNs are continuously evolving, the format of modern MCNs differs from the format of MCNs of the years 1995–2005, adapting to tax and accounting changes and to the appetite of the new investors.
Future research about the implicit cost of MCNs should entail the analysis of a more complex model involving more independent variables that affect the marginal cost for MCN investors, like the average cost of borrow of the underlying securities, the cost of borrow in stressed situations, the average cost of funding of the financial institutions, the credit default swap of the issuers and applying non-linear regressions where necessary.
Despite the limitations of the study, the regression models show that the MCN implicit yield is predicted by the yield of the senior debt, particularly in the case of sub-investment grade names, where the credit component is important. Conversely, the MCN implicit yield is, as expected, negatively correlated with the participation of convertible arbitrage investors in the investor base. In summary, the credit component is an important price-setting tool for sub-investment grade issuers, and convertible arbitrage investors seem to help in setting the price for investment grade issuers.
As initially suspected the MCN coupon is not highly correlated with the dividend yield of the underlying shares and empirical models show that the cost of MCN is better predicted by the senior credit yield of the issuing company. On the one hand, the preference for a constant and high-dividend stream is the driving aspect in the long-only investors’ decision-making process, but the ratio call-spread embedded in the note has an important weight in the nominal coupon. On the other hand, investors can hedge MCNs with a short equity position and a purchased call-spread. Stripping out the cost of the call-spread, the minimum required coupon for the investor would be close to the cost of a long term stock borrow agreement plus the cost of liquidity. Finally, dividend protection clauses help to eliminate the impact of uncertain and changing dividends.
The results of the study have an implication for the capital structure of companies. Both investment grade and sub-investment grade issuers can raise equity capital at a sustainable cost, well below the cost of their equity capital, in line with their senior bonds and tapping an alternative investor base. In particular, sub-investment grade issuers and distressed companies can obtain a lower price issuing MCNs than issuing high yield bonds. The requisites are to maintain enough liquidity in their listed shares and a fluid stock lending market that allows short sellers. Issuers can avoid voting shares dilution repurchasing the converted shares at maturity. The funding of such share repurchases can be performed issuing new debt or issuing another MCN with similar characteristics.
In conclusion, companies and financial institutions can finance part of their balance sheet using hybrid instruments like MCN instead of debt, reducing leverage and paying a cost in line with senior debt. A less leveraged economy is more sustainable and less cyclical and companies can finance investments that promote sustainable growth, industrialization, and innovation.


