Article

Vegetable Farming and Farmers’ Livelihood: Insights from Kathmandu Valley, Nepal

1
Central Department of Geography, Tribhuvan University, Kathmandu 44613, Nepal
2
Key Laboratory of Land Surface Pattern and Simulation, Institute of Geographic Sciences and Natural Resources Research, Chinese Academy of Sciences, Beijing 100101, China
3
CAS Center for Excellence in Tibetan Plateau Earth Sciences, Beijing 100101, China
4
Kathmandu Center for Research and Education, Chinese Academy of Sciences – Tribhuvan University, Kathmandu 44613, Nepal
5
University of Chinese Academy of Sciences, Beijing 100049, China
*
Authors to whom correspondence should be addressed.
Sustainability 2019, 11(3), 889; https://doi.org/10.3390/su11030889
Submission received: 12 January 2019 / Revised: 30 January 2019 / Accepted: 4 February 2019 / Published: 9 February 2019

Abstract

:
Agriculture is the main economic activity in Nepal, and vegetable farming is one of the major agricultural practices of peri-urban farmers in Kathmandu Valley (KV). In this study, it was hypothesized that vegetable farming contributes significantly to the livelihood of farmers by generating cash and providing employment opportunities. The relationship between livelihood and vegetable farming based on the practices, views, and perceptions of vegetable farmers at four different sites in the outskirts of KV was studied. A purposive sample of 140 farm households was surveyed, and key informant interviews were conducted to collect comprehensive data. Binary logistic regression was used to identify the relationships between farmer livelihood and numerous variables related to vegetable farming. It was found that the most of the surveyed farmers are migrants who have spread to different corners of KV at different times. The surveyed farmers cultivate an average area of 2551.5 m2 for vegetable farming. The major vegetable products in the study area are tomato (Solanum lycopersicum), carrot (Daucus carota), and green leafy vegetables. The model results indicate a significant positive relationship between vegetable farming and livelihood. The survey results also reveal many constraints (e.g., poor market management and lack of irrigation facilities) and challenges (e.g., haphazard urban growth, price fluctuation, and vegetable diseases). Since vegetable farming has become a major source of livelihood for farmers in the peripheral areas of KV, further interventions should be implemented to strengthen the vegetable sector and sustain this source of livelihood for peri-urban farmers.

1. Introduction

Vegetable farming within cities or on the fringes of cities is a part of urban agriculture [1]. Urban agriculture ranging from household subsistence farming to commercial-level farming plays a crucial role in improving the livelihood of people [2]. In developing countries, urban agriculture is an important contributor to the livelihood strategies of urban households [3]. According to the 2016 statistics of the Food and Agriculture Organization of the United Nations, tomato (Solanum lycopersicum) is the main vegetable produced worldwide, and Asia is the leading producer of fresh vegetables, with a production of 251 million metric tons [4]. Likewise, China is the major producer of fresh vegetable, sharing more than 50% of total production [4]. Worldwide, the majority of vegetable production takes place in Asian countries, with Nepal being the sixth leading producer of fresh vegetables following China, India, Vietnam, Philippines, and Myanmar in 2016 [4]. The vegetable farming increasingly gaining its importance in Nepal [5].
Nepal is a developing country with an agricultural economy [6,7]. Farming is the main economic activity, where two third of the total population are engaged in agriculture [6,8]. Agriculture sector accounts 31% of gross domestic product (GDP) in Nepal [9]. A high proportion of households in Nepal depend on agriculture for the generation of livelihood [10]. As an important sector of the economy, vegetable production plays a significant role in determining the economic conditions for farmers [5]. Vegetable crops are efficient to generate cash even from a small plot of land in a short period of time and helps farmers to improve their livelihood [11,12]. The value of vegetable production equals or even surpasses the value of cereal production [11,13]. Vegetables have higher commercialization rates and high cost–benefit ratio compared with cereal crops [14]. Vegetable cultivation presumably supports livelihood primarily through food provision, income generation, and employment because vegetables are preferred cash crops [15,16].
Even in the highly urbanized Kathmandu Valley (KV), large tracts of land outside the central city areas are devoted to farming. The number of vegetable farmers is increasing day by day as a result of the high demand for vegetables in urban areas like KV [17]. Because of the great demand for perishable commodities such as vegetables, most farmers around urban and peri-urban areas are moving towards the commercial production of vegetables [16]. In the urban fringes, vegetable farming has emerged as a productive enterprise for cash generation and self-employment [18,19]. The vegetables produced by farmers in urban and peri-urban areas also include organic vegetables, which are consumed in Kathmandu. The vegetable products from peri-urban areas has supplemented to fulfill the growing demand of urban population in KV [20]. On the other hand, peri-urban agriculture in KV is facing a crucial challenge as a result of rapid and haphazard urbanization. Cultivated land is the land use type that is most affected by the dramatic growth of urban areas [21]. However, there is a need to improve farming practices through the development of agricultural infrastructure in peri-urban areas [20]. Research related to vegetable farming and its relationship to farmer livelihood remains limited in KV and its peri-urban areas. Therefore, this study aims to examine the relationship between vegetable farming and the livelihood of farmers engaged in vegetable farming and production in the peripheral areas of KV.

2. Materials and Methods

2.1. Study Area

Kathmandu is the capital of Nepal and is located in the central part of the country [22]. KV is of strategic importance as it is centrally located between China and India, and its urban settlements of Kathmandu, Lalitpur, and Bhaktapur became early trade centers [23]. These settlements continued as economically and politically important towns for hundreds of years [24]. Because of its livelihood options, KV is one of the most popular destinations for migrants from different parts of Nepal [25]. KV covers an area of 569.80 km2 and includes three districts: Kathmandu, Bhaktapur, and Lalitpur [26]. Bagmati is the major river flowing through KV [27]. Kalimati Fruits and Vegetables Market was the first organized wholesale market in Nepal; retailers, institutional consumers, and other bulk consumers procure their supplies at this market [28]. In recent years, Balkhu vegetable market has become another asset for vegetable farmers for marketing. Vegetable production is an age-old traditional farming practice near the water resources in KV, and KV has the highest vegetable productivity per unit area in Nepal [10]. The study focuses on four different municipalities in KV, Kirtipur (western side), Tarkeshwor (northern side), Madhyapur Thimi (eastern side), and Harisiddhi (southern side) in the valley where vegetable farming is practiced for commercial purpose (Figure 1).

2.2. Questionnaire Design and Sample Size

Semi-structured questionnaires were administered to collect the socio-economic characteristics of farmers in the four different study locations in KV. The questionnaire was pretested at one selected site with a few vegetable farmers and amended before administering the final survey. Each package of questionnaires consisted of 35 questions grouped into the following five sections: section one collected information on the farmer’s family composition and migration situation; section two captured information on the farmland and its ownership and accessibility along with the major vegetables cultivated; section three focused on vegetable productivity, proportion sold, and earnings from vegetable farming in a year ; section four focused on the major inputs of vegetable farming and their sources along with the major expenditures and saving behaviors of the farmer; section five collected the views and suggestions of the farmers regarding vegetable farming. In total, 140 (35 from each site) farmers were selected for surveys.

2.3. Sampling Procedure and Household Surveys

An inventory of the study area was initially used to identify the vegetable farming areas in KV. As study sites, we selected vegetable farming areas in four municipalities located in different parts of KV: Tarkeshwor, Madhyapur Thimi, Harisiddhi and Kirtipur. Farm households within these sites were then selected via purposive sampling [29]. The researcher interviewed with head of the farm households. Most of the respondents were meet on their farm as it was the peak time for vegetable production particularly for tomato farming. Besides the sampled household survey, five highly experienced farmers from each site were selected for key informant interviews (KIIs) to obtain empirical evidence as a compliment to the rest of the study. The empirical evidence was complimentary to this research and worthwhile. Personal interviews were conducted to ensure that the respondents answered all questions. The farmland household surveys were conducted from 7 July to 8 August 2018.

2.4. Selection of Potential Factors Related to the Livelihood of Vegetable Farmers

Altogether, 22 variables were selected to evaluate their relationships with the livelihood of vegetable farmers in KV. Each variable was selected with respect to the socio-demographic and economic conditions of farmers to understand the knowledge, attitude, and practices of commercial vegetable farmers. Each variable was selected based on assumptions developed from a pretest of the questionnaire with a few farmers at one of the selected sites. All data were collected through farm household surveys and KIIs. A description of each selected variable can be found below in Table 1.

2.5. Explanation of Selected Variables

The dependent variable in this study was whether or not vegetable farming supports the farmer’s livelihood (this variable takes a value of 1 if vegetable farming improves the farmer’s livelihood and 0 if it does not (see Table 2). The descriptions of the independent variables used in this study and their relationships with the dependent variable are also provided in Table 2. Except for four variables, the independent variables evaluated in this study were treated as categorical variables. Gender was measured as a categorical variable coded as 1 for male and 0 for female as Nepal has a male-dominated agricultural system [30,31]. The assumption is a positive relation with the dependent variable as men have advantage on labor potentiality and decision making [19]. The independent variable of age and year of starting vegetable farming were measured as continuous variables and can be used as proxy for vegetable farming experience, and both were expected to positively influence the livelihood of farmers [32]. Education was measured as a categorical variable with the assumption that literate farmers have advantages across the whole farming process over illiterate farmers [32]. Family size and livestock numbers were also measured as continuous variables. Independent variables such as irrigation system and local market were measured as categorical data coded with 1 if yes and 0 if no. The study postulated that access to irrigation enhances production and access to local markets reduces transportation costs [33]. Physical factors such as type and size/area of farmland were expected to have a positive relationship with the dependent variable. All other socio-economic information was collected from a farm household survey; ownership of land [34], written agreement, annual earnings, loans, use of manure, fertilizer and pesticides, saving habits, and affiliation with vegetable production groups were measured as categorical variables assuming that all variables had a positive relationship with the improvement of the farmers’ livelihoods.

2.6. Data Analysis

The data from the completed questionnaires were entered and coded in Microsoft Excel and then exported to SPSS statistics 20 for further analysis (IBM, Armonk, NY, USA). Descriptive statistics with number and percentage were used to summarize the quantitative data. A binary logistic regression model was applied to analyze the relationships between the dependent variable and the independent variables listed in Table 2. When the outcome variable is dichotomous, the logistic regression can be an influential analytical technique for use [35]. Binary logistic regression is a type of predictive analysis [36] that is widely used to study farmer livelihood and food security [37,38]. Hence, binary logistic regression is used herein to describe the data and explain the relationships between the one dependent binary variable and the different independent variables [39]. All the selected independent variables were standardized according to Menard [36] and tested for multicollinearity [40]. The relationship between dependent and independent variables based on logistic regression was described as follows:
Y = l o g ( P P 1 ) = a + b 1 X 1 + b 2 X 2 + b 3 X 3 + b 4 X 4 + b 5 X 5 . b n X n
where p is the dependent variable which is probable support in the livelihood of vegetable farmers and x1, x2, x3, x4, x5, … xn are the independent variables (see Section 2.5) and b1, b2, b3, b4, b5, … bn are regression coefficients. The use of a binary model was motivated by the dichotomous fact that vegetable farming either does or does not support the farmer’s livelihood [41]. Percentage correctly predicted (PCP) was adopted to determine the accuracy of the model [42]. Detailed descriptions of the dependent and independent variables are provided in Section 2.5.

3. Results

3.1. Farmers’ Household Characteristics

The detailed socio-demographic characteristics of the farm households surveyed in the four study sites are shown in Table 3. Most households were located near farmlands, with the exception of households in the eastern site, which were located at a distance of approximately 1 km from the farmland. Among all respondents (140), two-thirds (96) were male, while nearly one-third (44) was female. The educational level of farmers is known to affect their farming activities. The result shows that most of the respondent farmers (81%) are literate and rest of them are illiterate. Among the literate respondents, 50% have acquired secondary and above secondary education, 19% have primary education, whereas 12% have basic knowledge of reading and writing. Approximately one-third of respondents (31%) have received basic training related to vegetable farming. More surveyed households consisted of 1–5 household members (57%) than 6–10 members (43%). Vegetable farming is a good source of income for the surveyed farmers, with the majority of farmers earning over 100,000 NPR in a year. The minimum earning of a vegetable farmer per year is 50,000 NPR, while the highest earning is over 500,000 NPR. Over 50% of the surveyed farmers earn more than 200,000 NPR yearly through vegetable farming.

3.2. Migration Status

The migration statuses of the surveyed farmers are shown in Table 4. Most of the vegetable farmers migrated from different parts of the country. The number of migrated vegetable farmers is nearly double the number of local vegetable farmers. Migrant farmers outnumber local farmers at all sites except the eastern site, which has more local farmers than migrant farmers. The farmers migrated to the outskirts of KV during different time periods in search of better livelihoods. The percentages of farmers who migrated to KV 6–10 years ago and 11–20 years ago are nearly the same, while fewer farmers migrated between 21 and 30 years ago (Table 4). The massive earthquake in 2015 seems to be a major factor in recent migration from earthquake-affected districts such as Rasuwa, Gorkha, Ramechhap, Dhading, Sidhupalchok, and Dolakha.

3.3. Accessibility and Affiliations

Road networks have played a significant role in accelerating agricultural production in the study area. As shown in Table 5, almost all farmlands can be accessed by road. Most farmlands are connected to gravel roads, with fewer connected to blacktop and earthen roads. Electricity and drinking water are largely available to vegetable farmers, except those in the western site, where only 60% have access to drinking water (Table 5).
The farmland irrigation sources differ among farmers (Table 5). The most common irrigation source is pumped groundwater followed by streams. A small number of farmers use local reservoirs for irrigation purposes. In the eastern site, all surveyed farmers depend on underground pumped water for irritation due to the dredging of the Manohara River, which was the only source for irrigation water. In contrast, in the southern site, most farmers use a canal to supply water to their farmlands. A nominal percentage of farmers have developed other irrigation techniques, which are included in the “other” category in Table 5. The survey results also indicate that few farmers are affiliated with a vegetable production group (either registered or non-registered) in their locality. In such groups, farmers used to collect some money for saving purpose and conduct meeting on a monthly basis.

3.4. Farmland Occupancy and Ownership and Major Vegetables Cultivated

The average farmland area of the surveyed farmers is 2551.50 m2 (Table 6). The farmlands are largest in the western site followed by the southern and northern sites. The eastern site has the lowest average cultivated area. Over three-fourths of the farmers lease their farmland (Table 6). Given the lack of agricultural labor in the study area, especially for paddy cultivation, the local people began to lease their land for vegetable farming. On average, leasehold farmers pay 15,000 NPR per ropani (508.84 m2) of farmland to the landowner on a yearly basis. In addition, the rent increases by 10% every year. Written agreements between landowners and leaseholders are in place in 46% of cases. At three out of the four sites, tomato (Solanum lycopersicum) is the primary cultivated vegetable, whereas the main crops in the eastern site (Madhyapur Thimi) are carrot (Daucus carota) and green leafy vegetables. The study area has a long history (over four decades) of commercial vegetable farming, and farming remains the main occupation of residents. Furthermore, almost all surveyed farmers sell more than 80% of their vegetable products.

3.5. Loans, Expenditures, and Saving Behaviors

Among all respondents, 25% have obtained loans for farming activities (Table 7). Most farmers borrowed money from an individual rather than from a cooperative or bank. The low rate of loans and subsidies is attributed to the lack of written agreements between farmers and landowners. More than half of the surveyed farmers incur expenses for agricultural inputs and these exceeds those expenses for consumables and other sector as a whole. The investment on children’s education is the second most common expense, followed by consumables (20%). The vegetable farmers of all three sites have maximum expenses on agricultural inputs except in the Kirtipur area, where farmers invest more for children’s education. More than half of the farmers have savings out of vegetable farming, and Tarkeshwor’s farmers have the highest average annual savings while Harididdhi’s farmers have the lowest average annual savings.
In the Harisiddhi area, vegetable farmers invest twice in consumables than children’s education, whereas in the Kirtipur area the farmers have maximum expenses for children’s education rather than other sectors. Around half of the farmers have the habit of cash saving either in a group (agricultural, women) and local saving cooperatives or in a bank. The highest rates of savings are observed in the eastern and western sites. The average saving is more than 100,000 per year, and the Tarkeshwor area has the highest and the Harisiddhi area has the lowest average saving ratio of farmers among the four sites (Table 7).

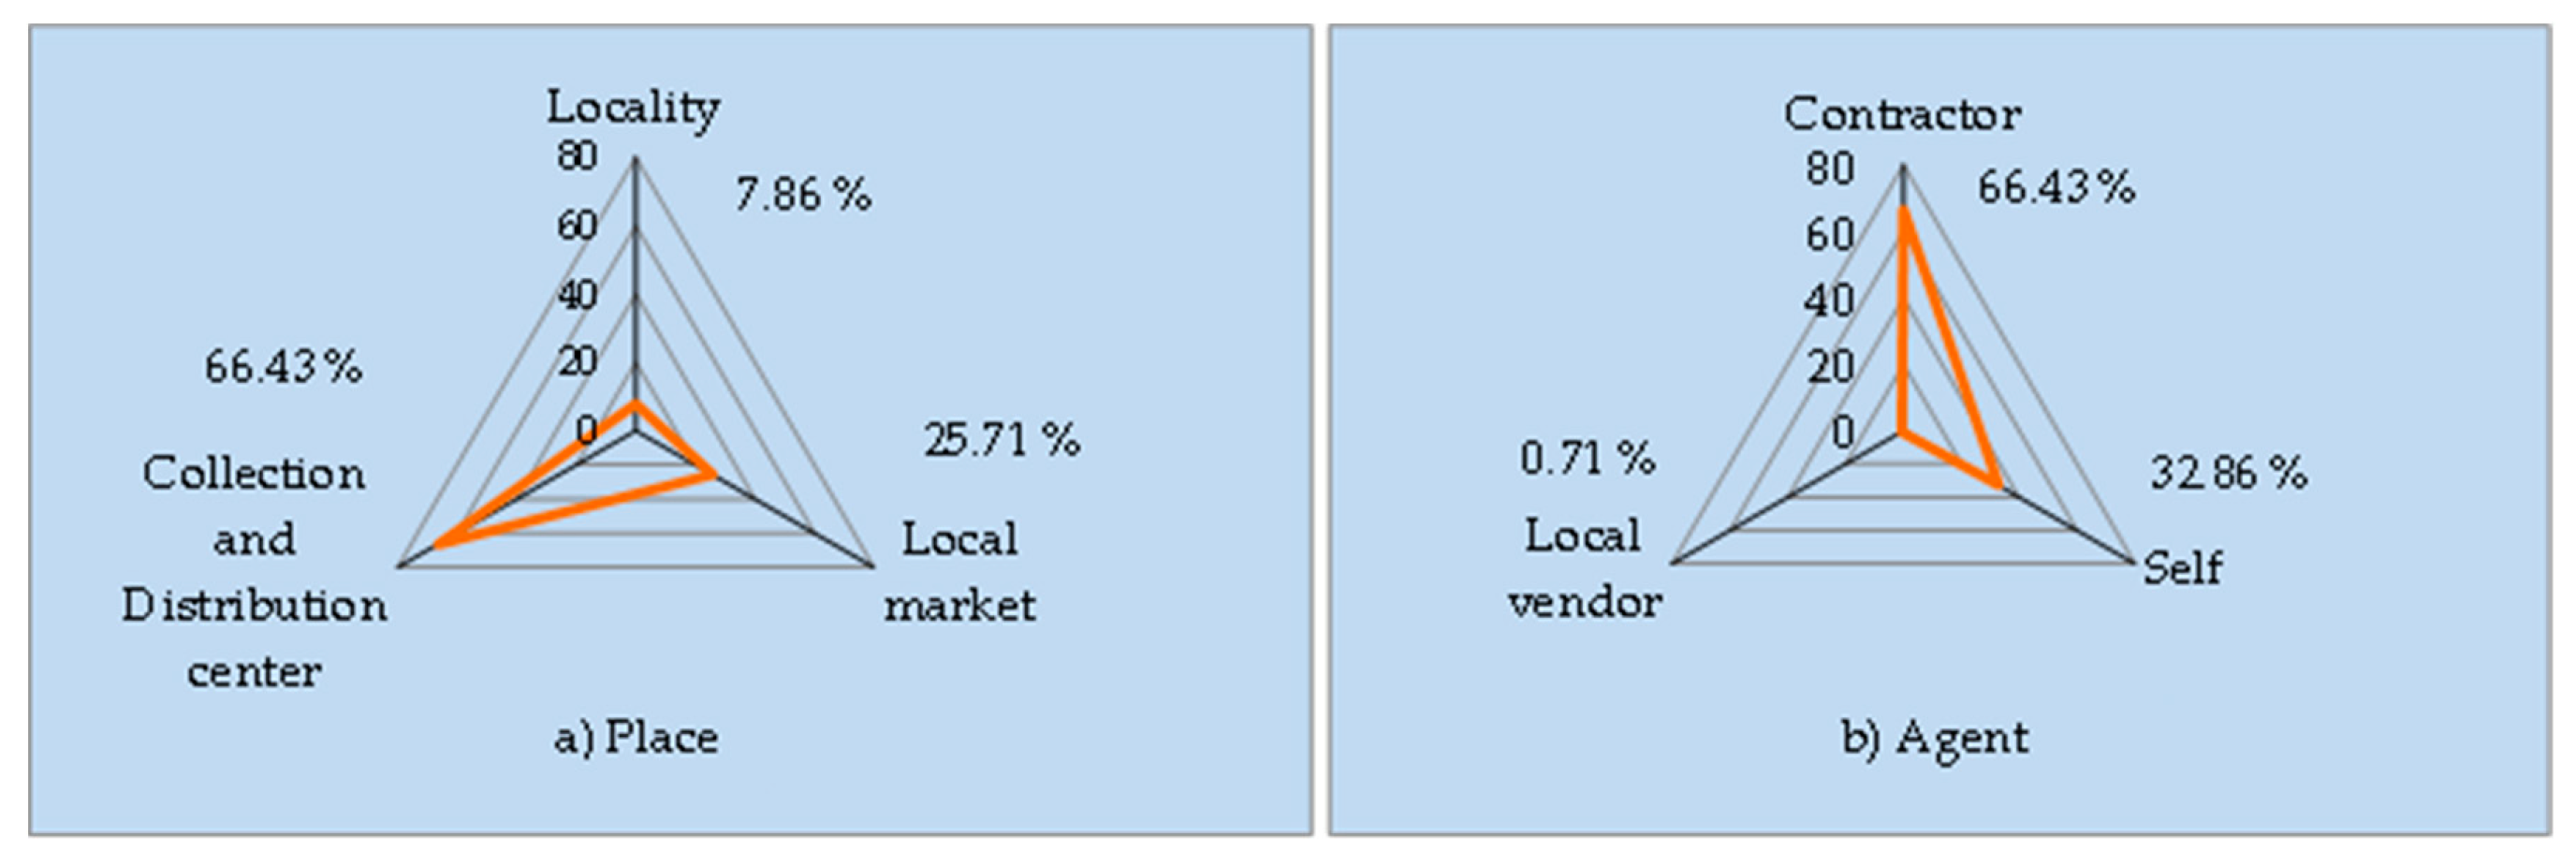
3.6. Marketing of Vegetable Products

According to the field survey, two-thirds of the vegetable farmers sell their product directly to a Collection and Distribution center, while more than one-fourth sell to a local market, and the remaining farmers sell their products within their locality (Figure 2). The farmers in all four surveyed sites have access to local markets within an average distance of 3 km, although it is not feasible for all farmers to travel to local markets (Figure 2). Most of the farmers (66%) sell their products to suppliers that are directly connected to the collection center at the Kalimati and Balkhu Fruit and Vegetable Wholesale Market. Approximately one-third of the farmers sell their products by themselves, either within their locality or at a nearby market. The farmers rarely sell their products through local vendors.

3.7. Farmer Experience and Perceptions Related to Vegetable Farming

The farming techniques adopted by farmers depend on the experience of the farmers. Among the surveyed farmers, 42% have 6–10 years of farming experience, 31% have less than five years of experience, 16% have 11–20 years of experience, and the remaining 10% have over 20 years of vegetable farming experience (Table 8). Among the survey sites, the eastern site has the largest percentage of farmers who have been involved in vegetable farming for more than two decades, while the other three sites have higher percentages of farmers with less than 10 years of experience. In recent years, the number of farmers has increased due to migration from different parts of the country. Among the respondents, over three-fourths reported an increase in the number of farmers in recent years. Growth in the number of farmers indicates a growth in the amount of farmland. However, most farmers (64%) reported that production is decreasing (Table 8).
The farmers’ survey responses indicate that various factors are affecting vegetable production in the study area. The emergence of new diseases is a key factor in decreased vegetable production in general and particularly tomato production in KV. Likewise, the lack of proper irrigation systems is another vital factor affecting vegetable production. The loss of soil fertility due to the extensive use of chemical fertilizers and shrinking land holdings due to urbanization (e.g., plotting and infrastructural development) were also reported as factors affecting production. Climatic variation and shortages of quality seeds also have negative effects on vegetable production in the study area (Table 8).
According to the surveyed famers in KV, numerous factors are affecting vegetable marketing. Almost all surveyed farmers think that recurrent price fluctuations are the main factor affecting vegetable marketing. One-third of farmers reported that the lack of proper management (e.g., the establishment of more collection centers and cool storage) by the government/public sector is a problem in vegetable marketing. Similarly, over one-fourth of respondents indicated that imports of similar vegetables, particularly tomatoes, from neighboring states at harvest time hinders marketing channels, and some farmers expressed the need for farmer-based organizations. Transportation was not seen as a major factor affecting marketing in the study area (Table 8).

3.8. Livestock Farming

Humans rely on livestock for food and other products that affect socio-economic factors. In addition to cultivating vegetables, farmers rear and keep livestock in three sites except Madhyapur Thimi, where none of the surveyed farm household has livestock (Table 9). This area has the lowest average farmland (Table 6) compared to the other three sites and mostly produces carrots and green leafy vegetables (Table 6), relying on manure from poultry farms and chemical fertilizers. Overall, the northern site of the study area seems to have a higher percentage of livestock followed by the eastern and southern sites, respectively (Table 9).
There were five major types of livestock domesticated by the farmers (Table 9). The farmers rear livestock for supplementary income and for a source of manure for vegetable farming. Among the major types of livestock, chicken makes up the largest proportion, followed by pigs and cattle. Farmers in the study area have low numbers of goats and buffalo. Furthermore, the highest quantities of chickens are found in Tarkeshwor and cattle in Kirtipur. The percentage of cattle and chicken are equal in Harisiddhi, whereas the percentage of cattle and buffalo are similar in Tarkeshwor (Table 9).

3.9. Relationship between Vegetable Farming and Farmer Livelihood

The results of the binary logistic model are presented in Table 10. The PCP of this model was 89.17 and regression coefficient (R2) value was 0.86. Most assigned and hypothesized variables show significant positive relationships with farmer livelihood in KV. The result shows that the variables use of manure in vegetable farming, affiliation of farmer to the vegetable production group in the locality, and the condition of farmer receiving training have significant positive relation with p values of 0.0016, 0.0024, and 0.0130, respectively (Table 10). The model results suggest that farmers are likely to continue vegetable farming as most of the variables indicate a positive relationship between vegetable farming and farmer livelihood. Thus, the result suggested that the farmers engaged in vegetable farming in the peri-urban areas of the KV are continuously improving their livelihood. The use of manure has a major role in vegetable farming, being ranked first for farmer’s livelihood improvement as the manure-treated vegetables can be counted as organic vegetables and have higher prices. Likewise, the farmer’s affiliation to a vegetable production group and farmers trained on vegetable farming were ranked second and third, respectively, as both attribute for the increment in the quality production and the farmer’s well-being. The ownership of farmland with p value 0.0211 shows positive significance, as one advantage of owning land is lower expenditures. Owning farmland has greatly benefited the livelihood of farmers, especially with raises in yielding capacity. Simultaneously, rearing livestock appears as an inseparable part of agriculture farming, as the additional income contributes to improving the livelihood of the farmers. The annual income through vegetable farming has greatly supported in the livelihood of farmers in KV.

4. Discussion

4.1. The Role of Vegetable Farming in Improving Farmer Livelihood

The cultivation of vegetables, which are preferred cash crops, presumably supports livelihood by providing food, income, and employment [43]. Increased vegetable production has the potential to generate more income and employment than other segments of the agricultural economy, making vegetables an important element of any agricultural growth strategy. During the last 10 years (2007–2017) in Nepal, the cultivated area, production, and yield of vegetables increased by 33%, 48%, and 11%, respectively [44]. Urban vegetable farming contributes substantially to the economy as well as to livelihood and food security [15]. In this study, we found that the households of most farmers earn more than 100,000 NPR annually through vegetable farming. The farmers cultivate tomato once in a year and green leafy vegetables in rotational order throughout the year (Table 6). Apart from expenditures on agriculture inputs, children’s education, and consumables, most of the farmers are able to save some of their earnings either on a monthly or yearly basis (Table 7). In urban peripheral areas, vegetable farming is a productive enterprise for cash generation and self-employment [18]. The increment in the number of vegetable farmers day by day (Table 8) indicates that they have seen the opportunity to improve their livelihood through vegetable farming in KV. Tomatoes have become the preferred crop for vegetable farmers because tomatoes are more profitable than other vegetables and hence are valuable for low-income farmers [5]. Tomato production is one of the major vegetable farming practices in the study area (Table 6). In addition to vegetable farming, many farmers raise livestock to supplement their income and provide manure for vegetable farming (Table 9). The results of this study indicate that the number of vegetable farmers is increasing as vegetable farming becomes recognized as a potential source of income.
Vegetables are a rich and inexpensive source of carbohydrates, protein, vitamins, and minerals, and can complement the main cereal crops [45]. In addition to income generation, vegetable products are a part of the daily diet. To a large extent, the livelihood of vegetable farmers depends on the two-way relationship between vegetable farming and urban growth. Based on the logistic regression analysis in this study, vegetable farming in KV contributes significantly to the livelihood of farmers. Therefore, vegetable farming is expected to continue to be an important part of urban agriculture in KV.

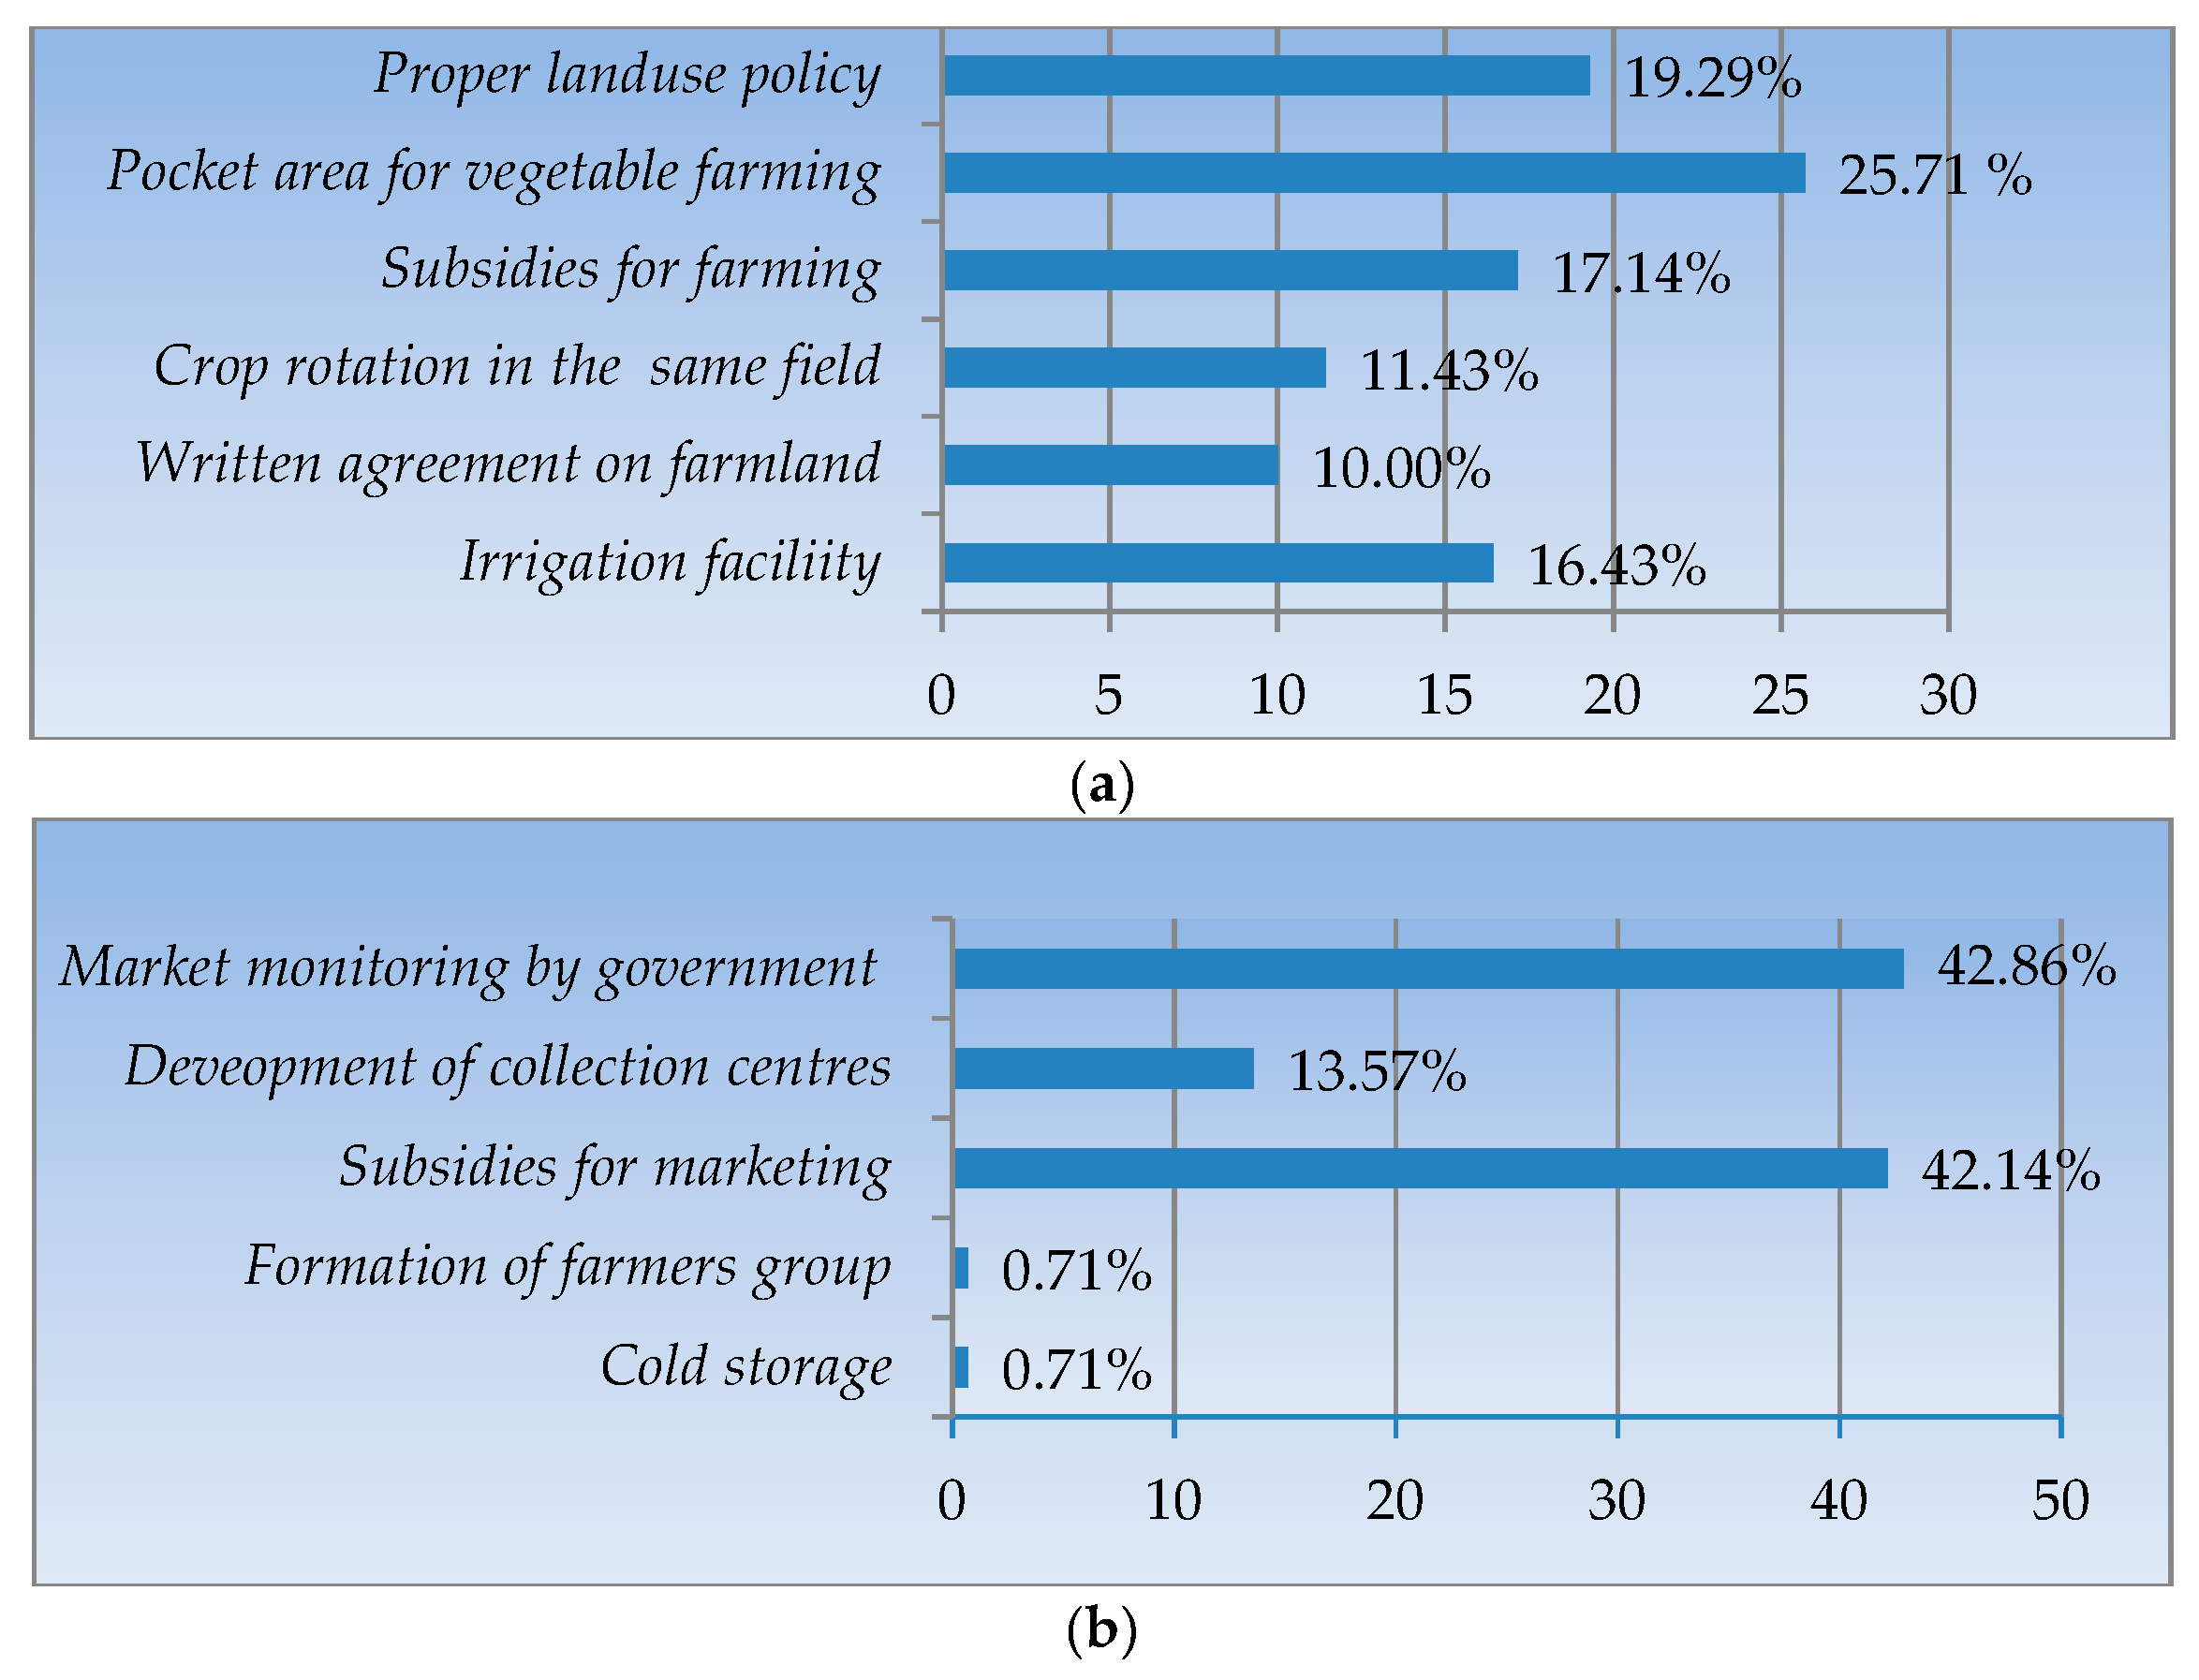
4.2. Land and Market Management and Farmer’s Expectations

KV has been experiencing rapid population growth, particularly since the 1980s. As home to 22.3% of Nepal’s urban population, KV is a fast-growing urban area in South Asia [25,46]. The most aggressive period of urban growth in KV occurred between 1999 and 2009. This time period coincides with a boom in the real-estate market, which is largely fueled by the entry of migrants from the countryside displaced by political and searching for a better life [25,47]. Due to internal conflict, large numbers of people have been displaced and migrated to urban areas, including KV [47]. The critical urban growth in KV will lead unparalleled stress on land resources by the next decade [22]. The soil in KV was once considered to be the most fertile and productive in Nepal [48]. In the outskirts of KV, the agriculture is facing a crucial challenge because of the rapid and haphazard urbanization [49]. In this study, one-third of surveyed farmers migrated to KV in search of a better livelihood (Table 4). These farmers have leasehold their farmland under different circumstances [50].
The National Land Use Project of Nepal is developing an integrated land-use plan with a focus on cropland management [51]. This plan will cover zoning for agricultural, residential, forest, commercial, industrial, public, and other lands to help manage all land uses together with cropland [52]. Such initiation can prevent chaotic destruction of fertile soil to sustain imperative urban agriculture like vegetable farming in the outskirts of the valley. Moreover, farmers are expecting possible subsidies and a proper land-use policy for their well-being (Figure 3). As urban areas grow, the demand for vegetables increases, which leads to more vegetable farming and thus supports the livelihood of farmers in the urban peripheries. However, haphazard urban growth has a negative effect on vegetable farming as it sacrifices fertile agricultural land in favor of urban development. To protect the abundant land, there should be clear demarcation of vegetable pocket areas (Figure 3).
Marketing management systems have been a major problem for vegetable farmers [33,53]. However, the 2015 Agricultural Development Policy of the Nepalese government prioritized agriculture roads, collection centers, and market infrastructure to spur economic growth, improve livelihood, and enhance food security [33]. The government should also place more emphasis on monitoring and evaluating the vegetable market to protect farmers from prospective parasitic middlemen in the vegetable markets (Figure 3). Furthermore, government subsidies on marketing should be provided to encourage farmers to continue their agricultural practices [48]. Based on the survey responses, additional collection centers would be an asset for vegetable farmers and would help ensure a constant vegetable supply in KV (Figure 3).

4.3. Major Challenges of Vegetable Farming in Kathmandu Valley

Vegetable farming in KV has many challenges. As a result of rapid and haphazard urbanization, some available agricultural land has been converted to built-up areas. The land market has become a potential factor contributing to dynamic urban growth [25]. The conversion of available agricultural land into building plots and town planning has squeezed farmlands [49]. The loss of fertile farmland near the urban area is one of the major constraints to the vegetable farmers [41]. Although urban agriculture is important for poor urban households in developing countries like Nepal, land-use policies are not effectively enacted [22]. The enforcement of urban growth policies to alter the current growth rate would effectively improve the urban environment [22]. Land brokers and housing development companies hold large parcels of land in peri-urban areas for speculative purposes, fragmenting or permanently removing potential fertile agricultural land [54]. The lack of written agreements between lease-holding farmers and landowners has deprived farmers from receiving government subsidies in the study area. Thus, a proper monitoring system should be implemented to improve the system of land tenure [50] and ownership. Currently, most national land use policies focus on land management and increasing production rather than the control of land fragmentation [52].
Marketing is an important part of vegetable farming. Price fluctuations are a major challenge in vegetable farming [33,55,56]. There have been huge ups and downs in vegetable prices during production and for an extended period [28]. The middlemen tend to be parasites who take a large share of the benefits during vegetable marketing [57]. Vegetable production has shorter market channels [18], although a market monitoring system would help farmers avoid losing profit to middlemen [58]. Irrigation is the backbone of agriculture in general and vegetable farming in particular. Thus, the lack of irrigation systems is a major obstruction to agricultural productivity [59]. In the study area, the lack of irrigation facilities is one of the major challenges that prevent farmers from achieving the expected returns. The farmers in KV are managing water through different means (e.g., pumped water and pipelines) on their own. There is a need for local-level agricultural institutions and farmer groups [60]. The formation of farmer-based organizations would also enhance farmers’ access to information, build mutual trust among farmers, and lower the cost of working together [61]. This would further improve the management of common resources to increase farmers’ productivity and income [60]. The emergence of vegetable diseases at the time of production is a major factor in vegetable yield loss [62]. As a result, farmers use more pesticides to protect their products.

5. Conclusions

Overall, the results show a significant positive relationship between vegetable farming and farmer livelihood improvement in KV. The number of vegetable farmers in the study area is increasing as vegetable farming has been recognized as a valuable source of income, and as the demand for vegetables has increased with urban growth. Haphazard urban growth has a negative effect on urban farming. To help farmers overcome the challenges in vegetable farming, the government should support farmers with quality extension services aimed at increasing production and preserve urban farming. Systematic marketing management and frequent monitoring through formation of informal/formal local groups of vegetable farmers/government agencies would help protect farmers from middlemen. The study findings revealed the advantages of vegetable farming on livelihood along with the challenges to a certain extent. For the sustainability of urban agriculture and continued contribution of vegetable farming to economic development, further research on these matters would be significant.

Author Contributions

M.K.R. and B.P. designed this study and formulated the household questionnaire. M.K.R. conducted the household surveys and tabulated the data. M.K.R. and B.P. analyzed the data and performed statistical tests. M.K.R. wrote the manuscript. Y.Z., N.R.K., H.L.K., P.N., and B.P. reviewed and finalized the manuscript. All authors have read and approve the final manuscript.

Funding

We are thankful to all the farmers who provided valuable time to share their livelihood status and experience in vegetable farming. We extend our sincere thanks to the three anonymous reviewers for their valuable time and suggestions. This study was supported by the Strategic Priority Research Program of the Chinese Academy of Sciences (Grant XDA20000000), the National Natural Science Foundation of China (Grant 41761144081), and the Chinese Academy of Sciences President’s International Fellowship Initiative (Grant 2018PC0030 and 2018VCA0011) for postdoctoral research and visiting professor.

Conflicts of Interest

The authors declare no conflict of interest.

References

  1. De Zeeuw, H.; Van Veenhuizen, R.; Dubbeling, M. The role of urban agriculture in building resilient cities in developing countries. J. Agric. Sci. 2011, 149, 153–163. [Google Scholar] [CrossRef]
  2. Van Veenhuizen, R.; Danso, G. Profitability and Sustainability of Urban and Periurban Agriculture; Food & Agriculture Organization: Rome, Italy, 2007; Volume 19. [Google Scholar]
  3. Bryld, E. Potentials, problems, and policy implications for urban agriculture in developing countries. Agric. Hum. Values 2003, 20, 79–86. [Google Scholar] [CrossRef]
  4. FAO. FAO Statistics; Food and Agriculture Organization of the United Nations: Rome, Italy, 2016. [Google Scholar]
  5. Ghimire, D.; Lamsal, G.; Paudel, B.; Khatri, S.; Bhusal, B. Analysis of trend in area, production and yield of major vegetables of Nepal. Trends Hortic. 2018, 1, 1–11. [Google Scholar] [CrossRef]
  6. GC, A.; Ghimire, K. A SWOT Analysis of Nepalese Agricultural Policy. Int. J. Agric. Environ. Food Sci. 2018, 2, 119–123. [Google Scholar] [CrossRef]
  7. Adhikari, S. Contribution of agriculture sector to national economy in Nepal. J. Agric. Environ. 2015, 16, 180–187. [Google Scholar] [CrossRef]
  8. MoAD. Statistical Information on Nepalese Agriculture, Time Series Information; Government of Nepal, Ministry of Agriculture Development: Kathmandu, Nepal, 2015.
  9. CBS. National Household Survey 2012/2013; National Planning Commission Secretariat, Government of Nepal: Kathmandu, Nepal, 2014.
  10. MoAD. Statistical Information on Nepalese Agriculture 2011/12; Government of Nepal, Ministry of Agricultural Development, Agri-Business and Statistics Division: Lalitpur, Nepal, 2012.
  11. Gurung, B.; Regmi, P.P.; Thapa, R.B.; Gautam, D.M.; Gurung, G.M.; Karki, K.B. Impact of PRISM Approach on Input Supply, Production and Produce Marketing of Commercial Vegetable Farming in Kaski and Kapilvastu District of Western Nepal. Res. Rev. J. Botan. Sci. 2016, 5, 34–43. [Google Scholar]
  12. Gurung, B.; Thapa, R.; Gautam, D.; Karki, K.; Regmi, P. Commercial Vegetable Farming: An Approach for Poverty Reduction in Nepal. Agron. J. Nepal 2016, 4, 92–106. [Google Scholar] [CrossRef] [Green Version]
  13. Joosten, F.; Dijkxhoorn, Y.; Sertse, Y.; Ruben, R. How Does the Fruit and Vegetable Sector Contribute to Food and Nutrition Security? LEI Wageningen UR: The Hague, The Netherlands, 2015. [Google Scholar]
  14. Bhandari, N.B.; Bhattarai, D.; Aryal, M. Cost, Production and Price Spread of Cereal Crops in Nepal: A Time Series Analysis; Government of Nepal, Ministry of Agriculture Development, Department of Agriculture Hariharbhawan: Lalitpur, Nepal, 2015.
  15. Asongwe, G.A.; Yerima, B.P.K.; Tening, A.S. Vegetable Production and the Livelihood of Farmers in Bamenda Municipality, Cameroon. Int. J. Curr. Microbiol. App. Sci. 2014, 3, 682–700. [Google Scholar]
  16. Bhatta, G.D.; Doppler, W. Socio-economic and environmental aspects of farming practices in the peri-urban hinterlands of Nepal. J. Agric. Environ. 2010, 11, 26–39. [Google Scholar] [CrossRef]
  17. Shrestha, K.; Shrestha, G.; Pandey, P.R. Economic analysis of commercial organic and conventional vegetable farming in Kathmandu valley. J. Agric. Environ. 2014, 15, 58–71. [Google Scholar] [CrossRef]
  18. Rai, D.B. Vegetable Gardening and Marketing in Kirtipur Area of Kathmandu. Nepalese J. Dev. Rural Stud. 2017, 14, 28–35. [Google Scholar] [CrossRef]
  19. Tiwari, K.R.; Nyborg, I.L.; Sitaula, B.K.; Paudel, G.S. Analysis of the sustainability of upland farming systems in the Middle Mountains region of Nepal. Int. J. Agric. Sustain. 2008, 6, 289–306. [Google Scholar] [CrossRef]
  20. Pradhan, P.; Perera, R. Urban growth and its impact on the livelihoods of Kathmandu Valley, Nepal. UMP-Asia Occas. Pap. 2005, 63, 7–29. [Google Scholar]
  21. Rimal, B.; Zhang, L.; Keshtkar, H.; Haack, B.N.; Rijal, S.; Zhang, P. Land use/Land cover dynamics and modeling of urban land expansion by the integration of cellular automata and markov chain. ISPRS Int. J. G-Inf. 2018, 7, 154. [Google Scholar] [CrossRef]
  22. Thapa, R.B.; Murayama, Y. Scenario based urban growth allocation in Kathmandu Valley, Nepal. Landsc. Urban Plan. 2012, 105, 140–148. [Google Scholar] [CrossRef]
  23. Rana, G.; Murray, A.; Maharjan, D.; Thaku, A. Kathmandu Valley Environment Outlook; International Centre for Integrated Mountain Development (ICIMOD): Kathmandu, Nepal, 2007. [Google Scholar]
  24. Chand, K.K. Farmers’ Perceptions and Knowledge of Using Waste and Wastewater in Two Peri-Urban Areas of Kathmandu Valley of Nepal; The University of Bergen: Bergen, Norway, 2018. [Google Scholar]
  25. Thapa, R.B.; Murayama, Y. Drivers of urban growth in the Kathmandu valley, Nepal: Examining the efficacy of the analytic hierarchy process. Appl. Geogr. 2010, 30, 70–83. [Google Scholar] [CrossRef]
  26. Rana, S.; Rijanta, R.; Rachmawati, R. Multifunctional Peri-Urban Agriculture and Local Food Access in the Kathmandu Valley, Nepal: A Review. J. Nat. Resour. Dev. 2015, 5, 88–96. [Google Scholar]
  27. Thakur, J.K.; Neupane, M.; Mohanan, A.A. Water poverty in upper Bagmati River basin in Nepal. Water Sci. 2017, 31, 93–108. [Google Scholar] [CrossRef]
  28. Bhattarai, D.R.; Subedi, G.D.; Gautam, I.P.; Chauhan, S. Posthavest Supply Chain Study of Carrot in Nepal. Int. J. Hortic. 2017, 7, 239–245. [Google Scholar] [CrossRef]
  29. Tongco, M.D.C. Purposive sampling as a tool for informant selection. Ethnobot. Res. Appl. 2007, 5, 147–158. [Google Scholar] [CrossRef]
  30. Aly, H.Y.; Shields, M.P. Gender and agricultural productivity in a surplus labor, traditional economy: Empirical evidence from Nepal. J. Dev. Areas 2010, 43, 111–124. [Google Scholar] [CrossRef]
  31. Tamang, S.; Paudel, K.P.; Shrestha, K.K. Feminization of agriculture and its implications for food security in rural Nepal. J. For. Livel. 2014, 12, 20–32. [Google Scholar]
  32. Ntshangase, N.L.; Muroyiwa, B.; Sibanda, M. Farmers’ Perceptions and Factors Influencing the Adoption of No-Till Conservation Agriculture by Small-Scale Farmers in Zashuke, KwaZulu-Natal Province. Sustainability 2018, 10, 555. [Google Scholar] [CrossRef]
  33. Thapa, M.B.; Dhimal, S. Horticulture development in Nepal: Prospects, challenges and strategies. Univ. J. Agric. Res. 2017, 5, 177–189. [Google Scholar] [CrossRef]
  34. Maurya, V.N.; Vashist, S.; Arora, D.K.; Shukla, K.K. Institutional Factor Analysis Influencing Production in Six Small-Scale Vegetable Projects Using Purposive Sampling Design and Binary Logistic Regression. Am. J. Agric. Biol. Environ. Stat. 2015, 1, 27–37. [Google Scholar]
  35. Peng, C.-Y.J.; Lee, K.L.; Ingersoll, G.M. An introduction to logistic regression analysis and reporting. J. Educ. Res. 2002, 96, 3–14. [Google Scholar] [CrossRef]
  36. Menard, S. Six approaches to calculating standardized logistic regression coefficients. Am. Stat. 2004, 58, 218–223. [Google Scholar] [CrossRef]
  37. Maharjan, K.L.; Joshi, N.P. Determinants of household food security in Nepal: A binary logistic regression analysis. J. Mt. Sci. 2011, 8, 403–413. [Google Scholar] [CrossRef] [Green Version]
  38. Nyanga, P.H. Factors influencing adoption and area under conservation agriculture: A mixed methods approach. Sustain. Agric. Res. 2012, 1, 27. [Google Scholar] [CrossRef]
  39. Hosmer, D.W., Jr.; Lemeshow, S.; Sturdivant, R.X. Applied Logistic Regression; John Wiley & Sons: Hoboken, NJ, USA, 2013; Volume 398. [Google Scholar]
  40. Rawlings, J.O.; Pantula, S.G.; Dickey, D.A. Applied Regression Analysis: A Research Tool; Springer Science & Business Media: New York, NY, USA, 2001. [Google Scholar]
  41. Duressa, T.; Lemma, T. Livelihood Diversification and Food Security among periurban Household: The case of Horo Woreda Oromia National Regional States, Ethopia. Am. J. Agric. 2016, 1, 1–18. [Google Scholar]
  42. Menard, S. Applied Logistic Regression Analysis; SAGE Publication: Thousand Oaks, CA, USA, 2002; Volume 106. [Google Scholar]
  43. Bhattarai, M.; Fitriana, N.; Ferizal, M.; Luther, G.; Mariyono, J.; Wu, M. Vegetables for Improving Livelihoods in Disaster-Affected Areas: A Socioeconomic Analysis of Aceh, Indonesia; AVRDC-The World Vegetable Center: Shanhua, Tainan, Taiwan, 2011. [Google Scholar]
  44. MoAD. Statistical Information on Nepalese Agriculture 2016–17. In Ministry of Agriculture Land Management and Cooperatives; Singhdurbar: Kathmandu, Nepal, 2017; p. 163. [Google Scholar]
  45. Kumar, R.; Bhatia, A.K.; Singh, D. Present Status of Vegetable Production and Their Impact in Human Nutrition. Int. J. Agric. Sci. 2017, 9, 4945–4949. [Google Scholar]
  46. Muzzini, E.; Aparicio, G. Urban Growth and Spatial Transition in Nepal: An Initial Assessment; The World Bank: Washington, DC, USA, 2013. [Google Scholar]
  47. Dahal, K. Livelihood and coping strategies among urban poor people in post-conflict period: Case of the Kathmandu, Nepal. Geogr. J. Nepal 2017, 10, 73–88. [Google Scholar] [CrossRef] [Green Version]
  48. Bhatta, G.D.; Doppler, W. Farming differentiation in the rural-urban interface of the middle mountains, Nepal: Application of analytic hierarchy process (AHP) modeling. J. Agric. Sci. 2010, 2, 37. [Google Scholar] [CrossRef]
  49. Sapkota, K. Farmer’s Choice and Farmer’s Voice on the Use of Local versus Modern Inputs in Peri-Urban Agriculture in Kathmandu Valley, Nepal. Geogr. J. Nepal 2009, 7, 15–22. [Google Scholar] [CrossRef] [Green Version]
  50. Dhakal, S. Land Tenure and Agrarian Reforms in Nepal; Community Self-Reliance Center: Kathmandu, Nepal, 2011. [Google Scholar]
  51. Paudel, B.; Zhang, Y.; Yan, J.; Rai, R.; Li, L. Farmers’ perceptions of agricultural land use changes in Nepal and their major drivers. J. Environ. Manag. 2019, 235, 432–441. [Google Scholar] [CrossRef]
  52. Paudel, B.; Gao, J.; Zhang, Y.; Wu, X.; Li, S.; Yan, J. Changes in cropland status and their driving factors in the Koshi River basin of the Central Himalayas, Nepal. Sustainability 2016, 8, 933. [Google Scholar] [CrossRef]
  53. Phukan, P.; Avasthe, R.; Lepcha, B.; Singh, R. Marketing Behaviour of Vegetable Growers in East Sikkim. Progressive 2018, 22, 18. [Google Scholar] [CrossRef]
  54. Pant, P.R.; Dangol, D. Kathmandu valley profile. Briefing Paper. In Proceedings of the Governance and Infrastructure Development Challenges in Kathmandu Valley, Working Paper, Kathmandu Metropolitan City, Nepal, 11–13 February 2009. [Google Scholar]
  55. Pokhrel, D.M. Comparison of farm production and marketing cost and benefit among selected vegetable pockets in Nepal. J. Agric. Environ. 2010, 11, 10–25. [Google Scholar] [CrossRef]
  56. Kumar, S.; Roy, M.; Mukherjee, A. Marketing Behaviour of Vegetable Growers in Uttarakhand hills. J. Commun. Mobil. Sustain. Dev. 2018, 13, 68–74. [Google Scholar]
  57. Mariyono, J.; Dewi, H.A.; Daroini, P.B.; Latifah, E.; Zakariya, A.Z.; Afari-Sefa, V. Marketing Aspects of Vegetables: Comparative Study of Four Regions in East Java and Bali. Agriekonomika 2018, 7, 46–56. [Google Scholar]
  58. Raut, N.; Sitaula, B.K.; Bajracharya, R.M. A Discourse on Agricultural Intensification in the Mid-Hills of Nepal. Asian J. Agric. Dev. 2011, 8, 79. [Google Scholar]
  59. Jha, A.K.; Malla, R.; Sharma, M.; Panthi, J.; Lakhankar, T.; Krakauer, N.Y.; Pradhanang, S.M.; Dahal, P.; Shrestha, M.L. Impact of irrigation method on water use efficiency and productivity of fodder crops in Nepal. Climate 2016, 4, 4. [Google Scholar] [CrossRef]
  60. Darkey, S.K.; Dzoemku, B.; Okorley, E.; Gyimah, N.; Bluwey, F. Contribution of Urban Vegetable production to Farmers’s Livelihood: A case of the Kumasi Metropolis of Ashanti Region of Ghana. Manag. Econ. Eng. Agric. Rural Dev. 2014, 14, 77–81. [Google Scholar]
  61. Suvedi, M.; Ghimire, R.; Kaplowitz, M. Revitalizing agricultural extension services in developing countries: Lessons from off-season vegetable production in rural Nepal. J. Int. Soc. Southeast Asian Agric. Sci. 2017, 23, 1–11. [Google Scholar]
  62. Shrestha, G.; Prajapati, S.; Mahato, B. Plant diseases and their management practices in commercial organic and conventional vegetable farms in Kathmandu valley. Nepalese J. Agric. Sci. 2014, 12, 129–240. [Google Scholar]
Figure 1. Study location: (a) Tarkeshwor, (b) Kirtipur, (c) Madhyapur Thimi, (d) Harisiddhi.
Sustainability 11 00889 g001
Figure 2. Vegetable marketing channels in Kathmandu Valley.
Sustainability 11 00889 g002
Figure 3. Farmer suggestions related to (a) land management and (b) vegetable market management in Kathmandu Valley (KV).
Sustainability 11 00889 g003
Table 1. Variables selected for analysis using the binary logistic regression model and their descriptions.
VariablesDescription
GenderLabor potential and the farming knowledge & networking advantage on male
AgeProxy for experience in farming
EducationLiterate farmers have a better understanding of production and marketing
Family sizeSmaller family size indicates lower expenditures and more savings potential; greater family size represents a greater labor pool to work in the farm
Training related to vegetable farmingTrained farmers have advantages in vegetable farming
IrrigationIrrigation is an asset for vegetable cultivation
Local marketAccess to local markets increases the probability of selling vegetable products
Type of farmlandIrrigated flatlands are more productive than sloped lands
OwnershipThe amount paid by leaseholders for land increases by 10% each year
Farmland size/areaGreater farmland size can lead to greater production and income
Written agreementWritten agreements provide provisions for subsidies and loans
Year that the farmer began vegetable farmingEarlier staring dates indicate more experience and more effective production
Annual incomeMore earnings correspond to more savings
Loans and subsidiesLoans and subsidies lessen the financial burdens of farmers
Use of manureOrganic vegetables have more value, and manure replaces chemical fertilizers
Use of chemical fertilizerUse of chemical fertilizers increases production
Use of pesticidesPesticides protect vegetable from damages by different pest/insects and diseases
SavingsMore savings correspond to better financial conditions
Affiliated with a vegetable production groupNetworking/sharing related to farming skills, marketing, and savings practices
Farming trendAn increasing number of farmers corresponds to more market competition
Production trendIncreasing production generates more income
LivestockRaising livestock provides additional income and a source of manure
Table 2. Variables and their hypothesized relationship.
VariableVariable DescriptionVariable TypeRelationship (+/−)
Dependent
Improved farmers livelihood by vegetable farmingValue is 1 if vegetable farming improved the farmer’s livelihood, otherwise the value is 0Categorical
Independent
GenderGender of farmer (1 = male, 0 = female)Categorical±
AgeAge of farmer in yearsContinuous±
EducationWhether the farmer had a formal education (1 = literate, 0 = illiterate)Categorical+
Family sizeNumber of household membersContinuous±
Training related to vegetable farmingWhether the farmer received basic training (1 = received training, 0 = did not receive training)Categorical+
IrrigationWhether the farmland is irrigated (1 = irrigated, 0 = not irrigated)Categorical+
Local marketWhether the farmer has access to local markets (1 = yes, 0 = no)Categorical+
Type of farmlandStructure of farmland (1 = flatland, 0 = sloped land)Categorical+
OwnershipLand tenure (1 = own land, 0 = lease land)Categorical+
Farmland size/areaLandholding size (1 = > 2 ropani, 0 = ≤ 2 ropani) *Categorical+
Written agreementWhether the farmer has an agreement with the landowner (1 = yes, 0 = no)Categorical+
Year that the farmer began vegetable farmingIndicates farmer experience in vegetable farmingContinuous+
Annual incomeFarmer earnings in NPR (1 = > 200,000 NPR, 0 = < 200,000 NPR)Categorical+
Loans and subsidiesWhether the farmer has received loans or subsidies (1 = yes, 0 = no); indicates support for vegetable farmingCategorical+
Use of manureWhether the farmer used livestock manure (1 = yes, 0 = no)Categorical+
Use of chemical fertilizerWhether the farmer used urea, diammonium phosphate, and potash to increase production (1 = yes, 0 = no)Categorical+
Use of pesticidesWhether the farmer used pesticides to prevent damage to vegetables (1 = yes, 0 = no)Categorical±
SavingsWhether the farmer saves money (1 = yes, 0 = no)Categorical+
Affiliated with a vegetable production groupWhether the farmer is affiliated with a local vegetable group (1 = yes, 0 = no)Categorical+
Farming trendChange in the number of farmers (1 = increased, 0 = decreased)Categorical
Production trendChange in vegetable production (1 = increased, 0 = decreased)Categorical+
LivestockNumber of livestockContinuous+
Notes: ± indicates a positive and negative relationship with the independent variable; NPR = Nepalese rupee (1 USD = 110.50 NPR); * 1 ropani = 508.84 m2.
Table 3. Socio-demographic characteristics of farmer households.
VariablesTarkeshworMadhyapur ThimiHarisiddhiKirtipurTotal
Gender (%)
 Male68.5765.7165.7174.2968.57
 Female31.4334.2934.2925.7131.43
Education (%) *
 Illiterate20.0034.292.8617.1418.57
 Literate5.715.7117.1420.0012.14
 Primary14.2922.8622.8617.1419.29
 Secondary54.2934.2857.1440.0046.43
 Above secondary5.712.860.005.723.57
Training in vegetable farming (%) **
 Yes37.1414.2948.5725.7131.43
Family size (%)
 1–5 members65.7177.1465.7120.0057.14
 6–10 members34.2922.8634.2980.0042.86
Annual income (%) (NPR) ***
 50,000–100,00022.8614.2914.2920.0017.86
 100,000–200,00020.0045.7134.2925.7131.43
 200,000–500,00028.5737.1425.7114.2926.43
 More than 500,00028.572.8625.7140.0024.28
Notes: * Literate = basic reading and writing, primary = up to grade 5, secondary = up to grade 10; ** Basic training conducted by a government agency, nongovernmental organization, or a local farmer’s group; *** NPR = Nepalese rupee (1 USD = 110.50 NPR) Source: Field Survey, 2018.
Table 4. Migration trend of vegetable farmers.
VariablesTarkeshworMadhyapur ThimiHarisiddhiKirtipurTotal
Local households *7318248
 Percentage20.0088.5722.865.7134.29
Migrated households284273392
 Percentage80.0011.4377.1494.2965.71
Migration period (%)
 <5 years25.710.0017.1422.8616.43
 6–10 years28.570.0028.5731.4322.86
 11–20 years17.142.8628.5734.2920.71
 21–30 years8.585.712.865.715.00
 30–40 years0.002.860.000.000.71
Note: * Local households indicate farming households that been living in the same place for generations. Source: Field Survey, 2018.
Table 5. Accessibility and affiliations among farmers group in Kathmandu Valley.
VariablesTarkeshworMadhyapur ThimiHarisiddhiKirtipurTotal
Accessibility (%)
Black top road71.4322.8611.4325.7132.86
Graveled road28.5777.1457.1462.8656.43
Earthen road0.000.0031.4311.4310.71
Electricity100100100100100
Drinking water1001001006090
Local market100100100100100
Source of irrigation (%)
Pumped water45.71100.0020.0042.8654.28
Streams54.290.0028.5740.0028.57
Canal0.000.0051.435.7114.29
Others0.000.000.0011.432.86
Affiliations *262818
Percentage5.7117.145.7122.8612.86
Note: * Indicates affiliation with a local farmers group (either registered or non-registered) where the farmer has savings (200–500 NPR per month) in their locality. Source: Field Survey, 2018.
Table 6. Farmland occupancy and ownership and major cultivated vegetables.
VariableTarkeshworMadhyapur ThimiHarisiddhiKirtipurTotal
Average farmland (m2)2784.821068.562929.463423.762551.50
Ownership (%)
 Own farmland17.1474.298.570.0025.00
 Leasehold farmland82.8625.7191.43100.0075.00
Agreement (%)60.006.0040.0077.0046.00
Major vegetables (%)
 Tomato (Solanum lycopersicum)100.002.86100.0082.8671.43
 Carrot (Daucus carota)0.0057.140.000.0014.29
 Green leafy vegetables0.0040.000.002.8510.71
 Mushrooms0.000.000.0014.293.57
Vegetable products sold (%)
 >60% sold0.000.000.008.572.14
 >80% sold100.00100.00100.0091.4397.86
Source: Field Survey, 2018.
Table 7. Loans, expenditures, and saving behaviors of vegetable farmers.
VariablesTarkeshworMadhyapur ThimiHarisiddhiKirtipurTotal
Loans (%) *22.8614.2937.1425.7125.00
Major expenditure (%)
 Agricultural inputs54.2960.0057.1434.2951.43
 Consumables20.0011.4328.5720.0020.00
 Children education25.7125.7114.2945.7127.86
 Health cure0.002.860.000.000.71
Savings practice (%) **31.4371.4340.0062.8651.43
Average saving (NPR) ***189,090.9167,008.0066,171.43186,681.82122,063.89
Notes: * Indicates the borrowing of money for all farming activities, including infrastructure, labor, seed supply, transportation, fertilizers and pesticides; ** indicates savings in the form of cash through a group, local savings cooperative or bank. *** NPR = Nepalese rupee (1 USD = 110.50 NPR) Source: Field Survey, 2018.
Table 8. Farmers’ experience and perception on vegetable farming.
VariablesTarkeshworMadhyapur ThimiHarisiddhiKirtipurTotal
Farming experience (%)
 Up to 5 years42.860.0048.5734.2931.43
 6–10 years54.2914.2942.8657.1442.14
 11–20 years2.8545.715.718.5715.71
 More than 20 years0.0040.002.860.0010.72
Farming trend (%) C
 Increasing100.0014.2997.14100.0077.86
Production trend (%)
 Decreasing80.0085.7140.0048.5763.57
Factors hindering production (%) *
 Diseases91.4368.5785.71100.0086.43
 Soil fertility45.7122.8642.8640.0037.86
 Lack of irrigation51.4348.5797.14114.2977.86
 Land holdings22.8654.2928.5717.1430.71
 Climate20.0011.4322.8631.4321.43
 Seeds quality17.1411.4331.4311.4317.86
Factors affecting marketing (%) *
 Pricing100.00100.0097.1497.1498.57
 Market management22.8611.4328.5771.4333.57
 Others65.710.0028.5714.2927.14
 Transportation2.862.865.715.714.29
Note: * Indicates that individual farmers chose multiple answers from the given options. Source: Field Survey, 2018.
Table 9. Status of livestock ownership by vegetables farmers.
LivestockTarkeshworHarisiddhiMadhyapur ThimiKirtipurTotal
Number%Number%Number%Number%Number%
Cattle164.571238.71n/an/a4325.297113.12
Buffalo164.5726.45n/an/a10.59193.51
Goat185.1400n/an/a1810.59366.65
Pig00.00516.13n/an/a7141.767614.05
Chicken30085.711238.71n/an/a3721.7634964.51
Total350100.31100n/an/a170100.541100
Note: n/a indicates that the livestock is not domesticated by the farmers of the survey site.
Table 10. Summary of results from the binary logistic regression analysis.
VariablesSig. (p)
Gender0.0631
Age0.0410
Education0.0798
Family size0.0505
Training related to vegetable farming0.0130
Irrigation0.0403
Local market0.0397
Type of farmland0.0221
Ownership0.0211
Farmland size/area0.0487
Written agreement0.0370
Year that the farmer began vegetable farming0.0587
Annual income0.0366
Loans and subsidies0.0271
Use of manure0.0016
Use of chemical fertilizer0.0419
Use of pesticides0.0581
Savings0.0535
Affiliated with a vegetable production group0.0024
Farming trend0.0662
Production trend0.0659
Livestock0.0344
Constant0.0363
Number of points140
Percentage correctly predicted (PCP)89.17
Nagelkerke R20.862
Note: Significance was tested at the 5% level.

