Article

Can Trade Credit Maintain Sustainable R&D Investment of SMEs?—Evidence from China

1
School of Management, Nanjing Forest Police College, No. 28, Wenlan Road, Qixia District, Nanjing 210046, China
2
Institute for International Students, Nanjing University, No. 22, Hankou Road, Nanjing 210093, China
3
School of Business, Nan Jing Normal University, No. 1, Wenyuan Road, Qixia District, Nanjing 210023, China
*
Author to whom correspondence should be addressed.
Sustainability 2019, 11(3), 843; https://doi.org/10.3390/su11030843
Submission received: 25 December 2018 / Revised: 30 January 2019 / Accepted: 31 January 2019 / Published: 6 February 2019
(This article belongs to the Section Economic and Business Aspects of Sustainability)

Abstract

:
Due to the long-term nature and information asymmetry, SMEs (Small and Medium Enterprises) experience serious financial constraints that affect their R&D investments. This article examines the effect of trade credit maintaining sustainable R&D investment of SMEs under financial constraints. Using the panel data of Chinese SMEs from 2002–2014, it was found that although the R&D investments of SMEs are restricted by financial constraints, trade credit can maintain the sustainability of enterprises’ R&D investment. Private enterprises are more reliant on trade credit, which can be intensified during periods of monetary tightening. Considering the counterfactual framework and the endogenous problems, the empirical results were also robust when using propensity score matching. To summarize, this article develops a new explanation for maintaining sustainable R&D investment of SMEs under financial constraints in developing countries.

1. Introduction

Innovation is one of the fundamental driving forces for the sustainable development of the world. Researchers have reached a consensus that uninterrupted long-term R&D investment can create better innovation results than short-term [1,2]. Therefore, maintaining sustainable R&D investment is critical for the sustainable development of the world [2]. However, because of the long-term nature and the asymmetric information, R&D investment is readily subject to financial constraints [3,4].
Much research has been done to explore factors that can maintain sustainable R&D investment under financial constraints, such as cash flow [5], leverage reduction [6], equity financing [5,7,8], corporate tax reform [9], fixed asset sales [10], working capital management [11], credit lines [12], managerial risk-taking incentives [13], public subsidies [14], foreign acquisitions [2], environmental regulations [15], and political connections [2]. The EBSCO and Web of Science databases were searched with “R&D” and “financial constraints” keywords with the purpose of a mapping state of the art, yielding the following relevant studies presented in Table 1.
From the review of existing literature, the following research gaps still exist. First of all, the research perspective of existing researches is within the enterprise, or from the institution environment. Research from the perspective of enterprise between enterprises is still lacking.
Secondly, existing researches are mainly based on the full sample of enterprises or large enterprises, and there are few studies on SMEs. Due to the limitations of size and low-transparency financial statements, factors (like stock issues, fixed asset sales, foreign acquisitions etc.) are difficult to apply to SMEs to maintain the sustainability of R&D investment. In this field of research, research on SMEs is still lacking.
Relatedly, the effect of trade credit between enterprises played in the allocation of financial resources has been widely discussed [17,18]. Financial resources are allocated to enterprises through formal financial intermediaries. This is the initial allocation of financial resources. Financial resources may also be reassigned subsequently. Trade credit has an important effect on the secondary distribution of financial resources. Enterprises that have easy access to initial allocation of financial resources can use trade credit to provide financial support to enterprises which have difficulty in obtaining external financing [19].
Drawing from the above discussion, this paper attempts to study the effect of trade credit in R&D investment of SMEs under financial constraints. As far as we know, no previous researches have been done to study the relationship between trade credit and the sustainable R&D investment of SMEs under financial constraints. This paper collected listed Chinese SMEs’ data from 2007 to 2014 and studied the relationship between trade credit and R&D investment based on the Euler equation developed by Laeven [20], which had been widely used in the relevant researches [21,22,23,24]. The results show that SMEs experience financial constraints on their R&D investments; trade credit can maintain the sustainability of R&D investment in SMEs under financial constraints; the effect of trade credit is more significant for private SMEs than the non-private SMEs; the effect of trade credit is more significant during periods of tight monetary policy. Furthermore, several robust tests were conducted, including changing the data structure by only retaining samples with five-consecutive-years data, and using a propensity score matching model. The conclusions still held.
This paper makes the following contributions to the literature.
First, the article confirms a new factor that can maintain sustainable R&D investment for SMEs. Allen et al. [25] proposed that the Chinese economy may rely more on informal financing mechanisms. For example, Ding et al. [26] studied the effect of operating capital on the investments of Chinese enterprises in fixed assets. Based on that view, this paper examined the role of trade credit as an informal financing factor to maintain sustainable R&D investment from the perspective of enterprise between enterprises.
Second, ownership discrimination is the common factor involved in studying China. Given the process of economic transformation, ownership is one of the most important factors in the study of Chinese enterprises. Guariglia and Liu [27] found that R&D activities of private Chinese firms are constrained by the internal financing, whereas in state-owned and collective enterprises’ R&D activities are the least constrained. Meanwhile, monetary policy is closely connected to the dynamic scale of trade credit since monetary policy affects enterprises’ cash stock, as well as financing and investing decisions, directly determining the degree of trade credit demand.
The paper’s structure is as follows. Section 2 proposes the hypotheses related to R&D investment of SMEs under financial constraints. Research design is in Section 3. Section 4 reports the empirical results. Section 5 discusses the conclusions.

2. Hypotheses

2.1. R&D Investments of SMEs and Financial Constraints

Compared to physical investment, the information of R&D investment is typically incomplete: either such information is kept secret by the company for as long as possible, or it is difficult to depict with certainty [2]. Therefore, R&D typically cannot obtain financing or has to accept a risk premium from external investors [9].
This is especially serious for SMEs. For the indicator measuring the capital market’s resources allocation, which is represented by the proportion of bank credits in GDP, China obtained a score of 2.15 in 2016, which is much higher than the scores of other nations that have developed financial markets [25]. Therefore, banks are more important for corporate financing in China.
However, for SMEs, low-transparency financial statements and a lack of historical credit records intensify the information asymmetry between SMEs and banks. In an environment of information asymmetry, commercial banks take both interest and risk factors into account when making loans to enterprises [28]. The “Capital Adequacy Ratio” (In March 2004, the China Banking Regulatory Commission (CBRC) promulgated the “Commercial Bank Capital Adequacy Ratio Management Method”, which stipulates that Chinese commercial banks should meet the eight percent minimum capital requirement before 1 January 2007 or be punished.) requirement pushes commercial banks to reduce their risk preference by decreasing loans to SMEs that pose a relatively high credit risk, thus actively ensuring adequate capital. SMEs encounter discrimination more often than large enterprises when obtaining bank loans [29], which causes a segmented credit market, meaning simultaneous over-financing of large-scale enterprises and under-financing of SMEs [30]. The above arguments lead to our first hypothesis:
Hypothesis 1 (H1).
SMEs are more likely to encounter financial constraints in R&D investment.

2.2. Relaxing of Financial Constraints by Trade Credit

Trade credit from suppliers can supplement SMEs’ credit funds. On the one hand, according to the theory of financing competitive advantage [31], compared to the banking system, suppliers related to enterprises through trading commodities have an information and supervision advantage that enables them to satisfy the related enterprises’ need for short-term funds. The relevant information of finance, production, and R&D can be collected at a low cost, and the repayment behavior of the related enterprises can be supervised by flexibly controlling the supply of goods. Moreover, it is easy for suppliers with good knowledge of industries to manage deposits once related enterprises fall behind in repayment. On the other hand, trade credit is one method used by suppliers to maximize their profits through price discrimination. Building up a partnership with downstream enterprises by providing trade credits can help such enterprises ensure both stable outlets and long-term profits.
Because over-financing large-scale enterprises and under-financing SMEs occurs within the same segmented credit market in China, a supply-and-demand relationship can be formed through transactions to promote the transfer of bank funds from over-financed to under-financed enterprises, thus alleviating the “credit-rationing” problem. Based on the above analysis, this article hypothesizes as follows:
Hypothesis 2 (H2).
Trade credit can maintain sustainable R&D investment of SMEs under financial constraints.

2.3. Hypothesis on Ownership

State-owned enterprises in China have more political connections with the government. When they take on government responsibilities, they also receive policy dividends such as fiscal subsidies or tax preferences, eventually reducing the risk of debt default [32]. State-owned banks dominate the Chinese banking system. Based on governmental preferences, such banks are more likely to lend money at low interest rates to state-owned enterprises, profiting by imposing high interest rates on private enterprises [33,34]. Moreover, the information asymmetry between banks and enterprises is more severe for private enterprises. State-owned enterprises have generally operated for longer than private enterprises, they have obvious advantages in terms of assets and financial funds. Compared with private enterprises, they work with banks more often and have a complete credit record, giving them a high degree of transparency in the loan-evaluation process. In contrast, the level of transparency for private enterprises is relatively low considering their non-standard operational and financial management, requiring banks to pay higher information costs before they have completely evaluated such enterprises’ qualifications [33]. Based on the above analysis, this article hypothesizes as follows:
Hypothesis 3 (H3).
Trade credit maintaining sustainable R&D investment under financial constraints is more significant for private SMEs than the non-private SMEs.

2.4. Hypothesis on Monetary Policy

Given that the supply of trade credit is based on related party transactions, downstream enterprises need to repay their credit within the required time limits, thus ensuring long-term cooperation with the upstream parties. Therefore, trade credit in periods of loose monetary policy comes at a higher cost than bank credit. The degree of financial constraints for private SMEs is directly determined by the capital amount of the credit market, which will scale down and decrease credit resources when monetary policy shifts between a loose period and a tighter one. During periods of tight monetary policy, because of constraints of “Credit Rationing”, commercial banks lack the funds needed by private SMEs after satisfying the credit needs of large state-owned enterprises. Considering the trust relationship arising out of long-term cooperation and the specific assets at issue, suppliers have a stronger incentive to provide trade credit either proactively or passively, helping their partner enterprises avoid large adjustment costs caused by an interrupted R&D investment. Based on the analysis set above, this article hypothesizes as follows:
Hypothesis 4 (H4).
Trade credit maintaining sustainable R&D investment under financial constraints is more significant for private SMEs during periods of tight monetary policy.

3. Research Design

3.1. Regression Model and Variables

As for existing researches [20,35], we set the following equation to test financing constraints:
( Innov / K ) i , t = α + β 1 ( Innov / K ) i , t 1 + β 2 ( Innov / K ) 2 i , t 1 + β 3 ( Y / K ) i , t 1 + β 4 ( CF / K ) i , t 1 + d t + f i + ε i , t
Innov stands for R&D, which is measured by R&D expenditures of the firm. Y is the income of the enterprise, which is measured by the sales revenue of the firm. CF means internal funds, measured by the net cash flow generated through operating activities. K stands for total assets of enterprise, which is measured by the natural logarithm of total assets. All the variables mentioned above were divided by K to eliminate the impact of difference in the enterprises’ size. If a firm is financially constrained, β4 (the coefficient of CF) is significantly positive [20,21,22].
If trade credit relaxes the firms’ financial constraints, the coefficient of interaction term (CF/K*NCR) should be negative. As Laeven [20], Ratti et al. [21], and Chan et al. [22], following the principle of parsimony, we focus only on the CF/K and the terms interacted with CF/K, that are directly related to financial constraint. The results will not change, if NCR (net commercial credit) is included in to the equation but it will just create too many additional parameters to estimate, especially in Equation (3) and Equation (4).
( Innov / K ) i , t = α + β 1 ( Innov / K ) i , t 1 + β 2 ( Innov / K ) 2 i , t 1 + β 3 ( Y / K ) i , t 1 + β 4 ( CF / K ) i , t 1 + β 5 ( CF / K ) i , t N C R i , t + d t + f i + ε i , t
Innov, K, Y, CF, fi, dt, and εi,t have the same meaning in Equation (2) as in Equation (1). The index of trade credit (NCR) is calculated by subtracting accounts receivable from accounts payable and then obtaining the result divided by current operating revenues [36]. If the effect of NCR exists, β5 (the coefficient of CF/K*NCR) should be significantly negative.
Similarly, we focus on the interaction term of CF/K*NCR*State in Equation (3) to test the relaxing effect of trade credit under different ownership. We use a dummy variable measuring state, which stands for the ownership of enterprises, equal to 1 for private enterprises and 0 for non-private enterprises. If the effect of trade credit under different ownership exists, β7 (the coefficient of CF/K*NCR*State) should be significantly negative.
( Innov / K ) i , t = α + β 1 ( Innov / K ) i , t 1 + β 2 ( Innov / K ) 2 i , t 1 + β 3 ( Y / K ) i , t 1 + β 4 ( CF / K ) i , t 1 + β 5 ( CF / K ) i , t N C R i , t + β 6 ( CF / K ) i , t State i , t + β 7 ( CF / K ) i , t N C R i , t State i , t + d t + f i + ε i , t
Following Hypothesis 3, Hypothesis 4 proposes that monetary policy will influence the effect of trade credit. We set two equations to test this hypothesis:
First, like Equation (3), we established Equation (4) by adding the interaction term of CF/K*NCR*MP to examine whether monetary policy would influence the relaxing effect of trade credit. If the effect of trade credit under monetary policy exists, β7 (the coefficient of CF/K*NCR*MP) should be significantly negative.
( Innov / K ) i , t = α + β 1 ( Innov / K ) i , t 1 + β 2 ( Innov / K ) 2 i , t 1 + β 3 ( Y / K ) i , t 1 + β 4 ( CF / K ) i , t 1 + β 5 ( CF / K ) i , t N C R i , t + β 6 ( CF / K ) i , t M P i , t + β 7 ( CF / K ) i , t N C R i , t MP i , t + d t + f i + ε i , t
The changing rate of M2 is one criterion widely used by academics, given that it is the intermediate monetary policy target of the People’s Bank of China [37]. Accordingly, this article adopted the changing rate of M2 to divide monetary policy into tight and loose periods, for which a dummy variable MP was set. Specifically, we regarded the years that showed a negative changing rate of M2 as tight periods of monetary policy and assigned them an MP value of 1. We regarded the other years that showed a positive changing rate of M2 as loose periods of monetary policy and assigned them an MP value of 0.
Second, we regress Equation (4) into a different group of state to test if private SMEs rely more heavily on trade credit to relax financial constraints during the situation of tight monetary policy.
Finally, we explain the variables in this article in Table 2.

3.2. Data and Sample

Brown et al. [7] found that the stock market is the main financing channel of R&D investment for American high-technology enterprises. However, stock issues have become more volatile in past decades [38], which is certainly true of China’s less developed stock market. To verify this point of view, we choose the listed SMEs in China as the empirical research object. If the financial constraints of R&D investment still appear in these listed companies, we can prove that the equity market is not a valid source for R&D investment. The data for this article were all originally contained in annual reports released by listed SMEs in China [39]. Furthermore, the original samples were screened using the following standards: (1) Only keep A-share listed companies. (2) Eliminate the samples that have experienced ST and PT processes from 2007 to 2014; (3) Eliminate the samples that are seen as insolvent when their asset–liability ratio is higher than 100 percent. (4) Eliminate the samples that are seen as abnormally operated when their return on assets is either less than minus 50 percent or more than 50 percent. (5) Variables are winsorized at the upper and lower 1% levels. Finally, we obtain an unbalanced panel dataset comprising Chinese A-share listed SMEs from 2007 to 2014, which contains 3,432 observed values.
From Table 3, the minimum and maximum values of R&D investment (Innov/K) are 0 and 0.167. For internal funds (CF/K), these two values are −0.393 and 0.430. Therefore, R&D investment and cash flow vary by enterprise. Finally, there is a great difference in trade credit for SMEs since the minimum value of net trade credit, NCR, is −1.486, whereas the maximum is 1.580.
Table 4 reports the correlation matrix variables. The correlation coefficient of Innov/K and CF/K is positive, which is significant at 5%.

4. Empirical Results and Discussion

4.1. Test and Method

4.1.1. Unit Root Test

The Fish-PP test is equivalent to the robust ADF test in the situation of heteroscedasticity. We also report Moon and Perron’s (2004) second-generation panel unit root test, which takes account of cross-sectional dependence. As shown in Table 5, we can use these variables to regress without worrying about the problem of spurious regression.

4.1.2. Tests of Regression Estimation

Table 5 aggregates the result of the multicollinearity test (VIFs) and the heteroscedasticity test which are reported for each regression model in Table 6. All the VIFs are lower than 10, which means that multicollinearity does not influence the analysis. In addition, compared to long panel data, for which the regression results are more affected by serial correlation, the short panel data used in this article, which have a time period of only eight years, are more influenced by heteroscedasticity. The heteroscedasticity test shows that the chi-squared value is significant at the 1% level.

4.1.3. The Endogeneity and the Estimation Method

To solve the potential endogeneity problem, we used the lag terms of relevant variables as instrumental variables. To ensure the efficiency of the instrumental variables, only one higher-order lag was adopted and at most, the three-lag values of the dependent variable were chosen as instrumental variables. Meanwhile, to address the autocorrelation problem of error terms, we added the first-order lag of dependent variables in the model. Moreover, we choose the system GMM to overcome the problem of weak instrumental variables [24].

4.2. Empirical Results

The empirical results of this article are composed of two parts. One is the relaxing effect of trade credit on the R&D investment of SMEs, and the other is the contextual effect of ownership and monetary policy. The empirical results are shown in Table 7.
Laeven [20] argued that, β4, the coefficient of internal funds (CF), would be below 0 if the investment behavior of enterprises was free from financial constraints. However, the regression result in Model (1) shows that β4 is above 0 and significant. This finding indicates that Chinese SMEs experience financial constraints in the process of R&D investment. Accordingly, Hypothesis 1 is supported. Hadlock and Piercen [40] find that firm size is a good predictor of financial constraints. Because of the problems of adverse selection and moral hazard, SMEs use less external finance than large firms, and they rely more on internal cash flow and bank loans [41]. Andrieș et al. [42] also found that higher competition facilitates credit access for SMEs in European countries. Consistent with the above researches, the conclusion of Model (1) also indicates that the uncertainty and long-term characteristics of R&D investment make it easier for SMEs in China to encounter financial constraints.
The coefficient of CF/K*NCR in Model (2) is significantly negative at the significance level of 1%, which is the opposite of that for the coefficients of CF/K. This result indicates that increasing trade credit decreases the sensitivity of R&D investment to cash flows, which means the trade credit can maintain sustainable R&D investment of SMEs under financial constraints. Hypothesis 2 is supported. Campello et al. [43] found that trade credit can ameliorate the impact of the crisis on corporate profits and employment when the bank loans have been reduced. Levine et al. [44] found that trade credit can help profits and the employment of firms when banking crises occur. Our findings are consistent with the view that trade credit can be an alternative source of finance for firms under financial constraints.
Model (3) reports the result of regression Equation (3) to test whether the ownership of SMEs will influence the effect of trade credit. In Model (3), the coefficient of CF/K*NCR*State is significantly negative. This finding indicates that the effect of trade credit is more obvious for private SMEs than non-private SMEs. Hypothesis 3 is supported. Lack of financing channels is a major constraint on R&D in China, especially for private enterprises according to Howell [9]. Weng and Sderbom [4] showed that the internal capital for R&D expenditure is more extensively relied on by private enterprises than by non-private ones, which explains why private enterprises’ R&D expenditure decisions are subject to financial constraints. The results of our study are consistent with their findings and confirm the existence of a “political pecking order” in China’s credit market.
Model (4) reports the result of regression Equation (4) to test whether monetary policy will influence the effect of trade credit. The coefficient of CF/K* NCR* MP is significantly negative. This finding indicates that the effect of trade credit is more obvious during a tight monetary-policy period. Dajcman (2016) [45] found that monetary policy measures can affect bank loans through the credit channel, the bank capital channel, and the risk-taking channel. When the financial resources from formal financial intermediaries are reduced, enterprises will rely more on the distribution of secondary financial resources in the form of trade credit. Consistent with existing research [45], we confirm the effect of trade credit during a period of negative shock in monetary policy.
Furthermore, Model (5) reports the result of regression Equation (4) when the firms are private (State = 1). The coefficient of CF/K*NCR*MP *State is still significantly negative. However, in Model (6), which reports the result of regression Equation (4) when the firms are non-private (State = 0), the coefficient of CF/K*NCR*MP *State is not significantly even at a significance level of 10%. Compared with Model (5) and Model (6), this finding indicates that under a situation of tight monetary policy, the effect of trade credit is stronger for Chinese private SMEs. Hypothesis 4 is supported.
In addition to multivariate measures of trade credit, we conducted regression by changing the data structure to ensure the robustness of the results. Although the number of observations decreases by 1137 after reserving samples with five consecutive years, the time series can be more representative, and the relaxing effect of trade credit on R&D investment can be better reflected in continuous years. The empirical results are shown in Table 8.
From Table 8, the existence of financial constraints reflected by the coefficient of CF/K in Model (7), the effect of trade credit reflected by the coefficient of CF/K *NCR and CF/Kt*CR in Models (8), the effect of ownership reflected by the coefficient of CF/K*NCR*State in Model (9), the effect of monetary policy reflected by the coefficient of CF/K*NCR*MP in Model (10), and the joint effect of ownership and monetary policy reflected by the coefficient of CF/Kt*NCR *MP in Model (11) and Model (12) all show the same results as those reported in Table 4. Moreover, the coefficient and the significance level are all improved since the samples with consecutive years can better reveal the effect. Therefore, we conclude that the results of this study are robust and unaffected by changing the sample size and data structure.
We also add the fixed effect model and the random effect model in Table 9 as the robust test to compare with the results from GMM estimations. The results of this study are robust and unaffected by changing the estimation model.

4.3. Counterfactual Robust Test Based on Propensity Score Matching (PSM)

This article uses the system GMM to test the relaxing effect of trade credit on the R&D investments of SMEs. However, we cannot use this method to observe both the high conditions of trade credits and the low conditions of trade credits of a given enterprise simultaneously. It may cause a problem of missing data. The consequence is that we cannot be sure whether the high R&D investment of a given enterprise is entirely attributable to the higher trade credit of this enterprise compared to the trade credits of other enterprises. However, if we can confirm that the R&D investment for the same enterprise is higher in its high condition of trade credit than its low condition of trade credit, then the selection bias caused by different conditions of trade credit can be avoided.
Based on a counterfactual framework, we divided the sample enterprises into a group with high trade credit having an NCR equal to or above zero and a group with a low trade credit having an NCR below zero. If the difference between these two groups can be explained by the same variables set in advance, then we can use the variables to pair the samples level by level so that the two paired sample groups differ only in trade credit while remaining the same in other aspects. Finally, we can confirm the causal relationship between trade credit and R&D investment while avoiding the selection bias caused by missing data. Compared to the time-consuming stratified pairing by a single factor, PSM (Propensity Score Matching) is more efficient for multi-factor matching by concentrating several factors into one index: the propensity score (PS).
Under the given sample feature of X, the conditional probability of an enterprise’s high trade credit is as follows:
p ( X i ) = P r [ D i = 1 | X i ] = E [ D i | X i ]
Di is an index function, assigned the value of one to act as the treatment group if the trade credit is high (NCR ≥ 0); otherwise, it is assigned the value of zero to act as the control group if the trade credit is low (NCR < 0). X is the matching variable, which determines whether enterprises are in a situation with high or low trade credits. Referring to a current study on trade credit, this article chooses variables that may affect trade credit of enterprises, such as the proportion of available mortgage assets (F/A), secured bank loans (LOAN), the growth rate of the operating revenue (GROWTH), the operating cash flow (OCFL) etc. If the trade-credit situation is random, we can use a binary choice model to estimate the situation, letting Pr[Di = 1|Xi] represent the probability of high trade credit under X. Furthermore, we can match the treatment group and the control group according to their similarity of probability, whose efficiency depends on conditional independence and overlapping assumption. The Average Treatment Effect of trade credit on R&D investment is as follows:
A T T ^ = 1 N 1 i : D i = 1 [ y i j , D J = 0 w ( i , j ) y j ]
N1 is the number of enterprises in the treatment group. There are various weight indexes of w(i,j) for different matching methods. Since kernel matching does not have the problem of invalid standard deviation [46], this article adopts this approach to conduct PSM. The formula of weight shows as follows, with h representing bandwidth, and K representing the kernel function:
w ( i , j ) = K [ ( x j x i ) / h ] k : D K = 0 K [ ( x K x i ) / h ]
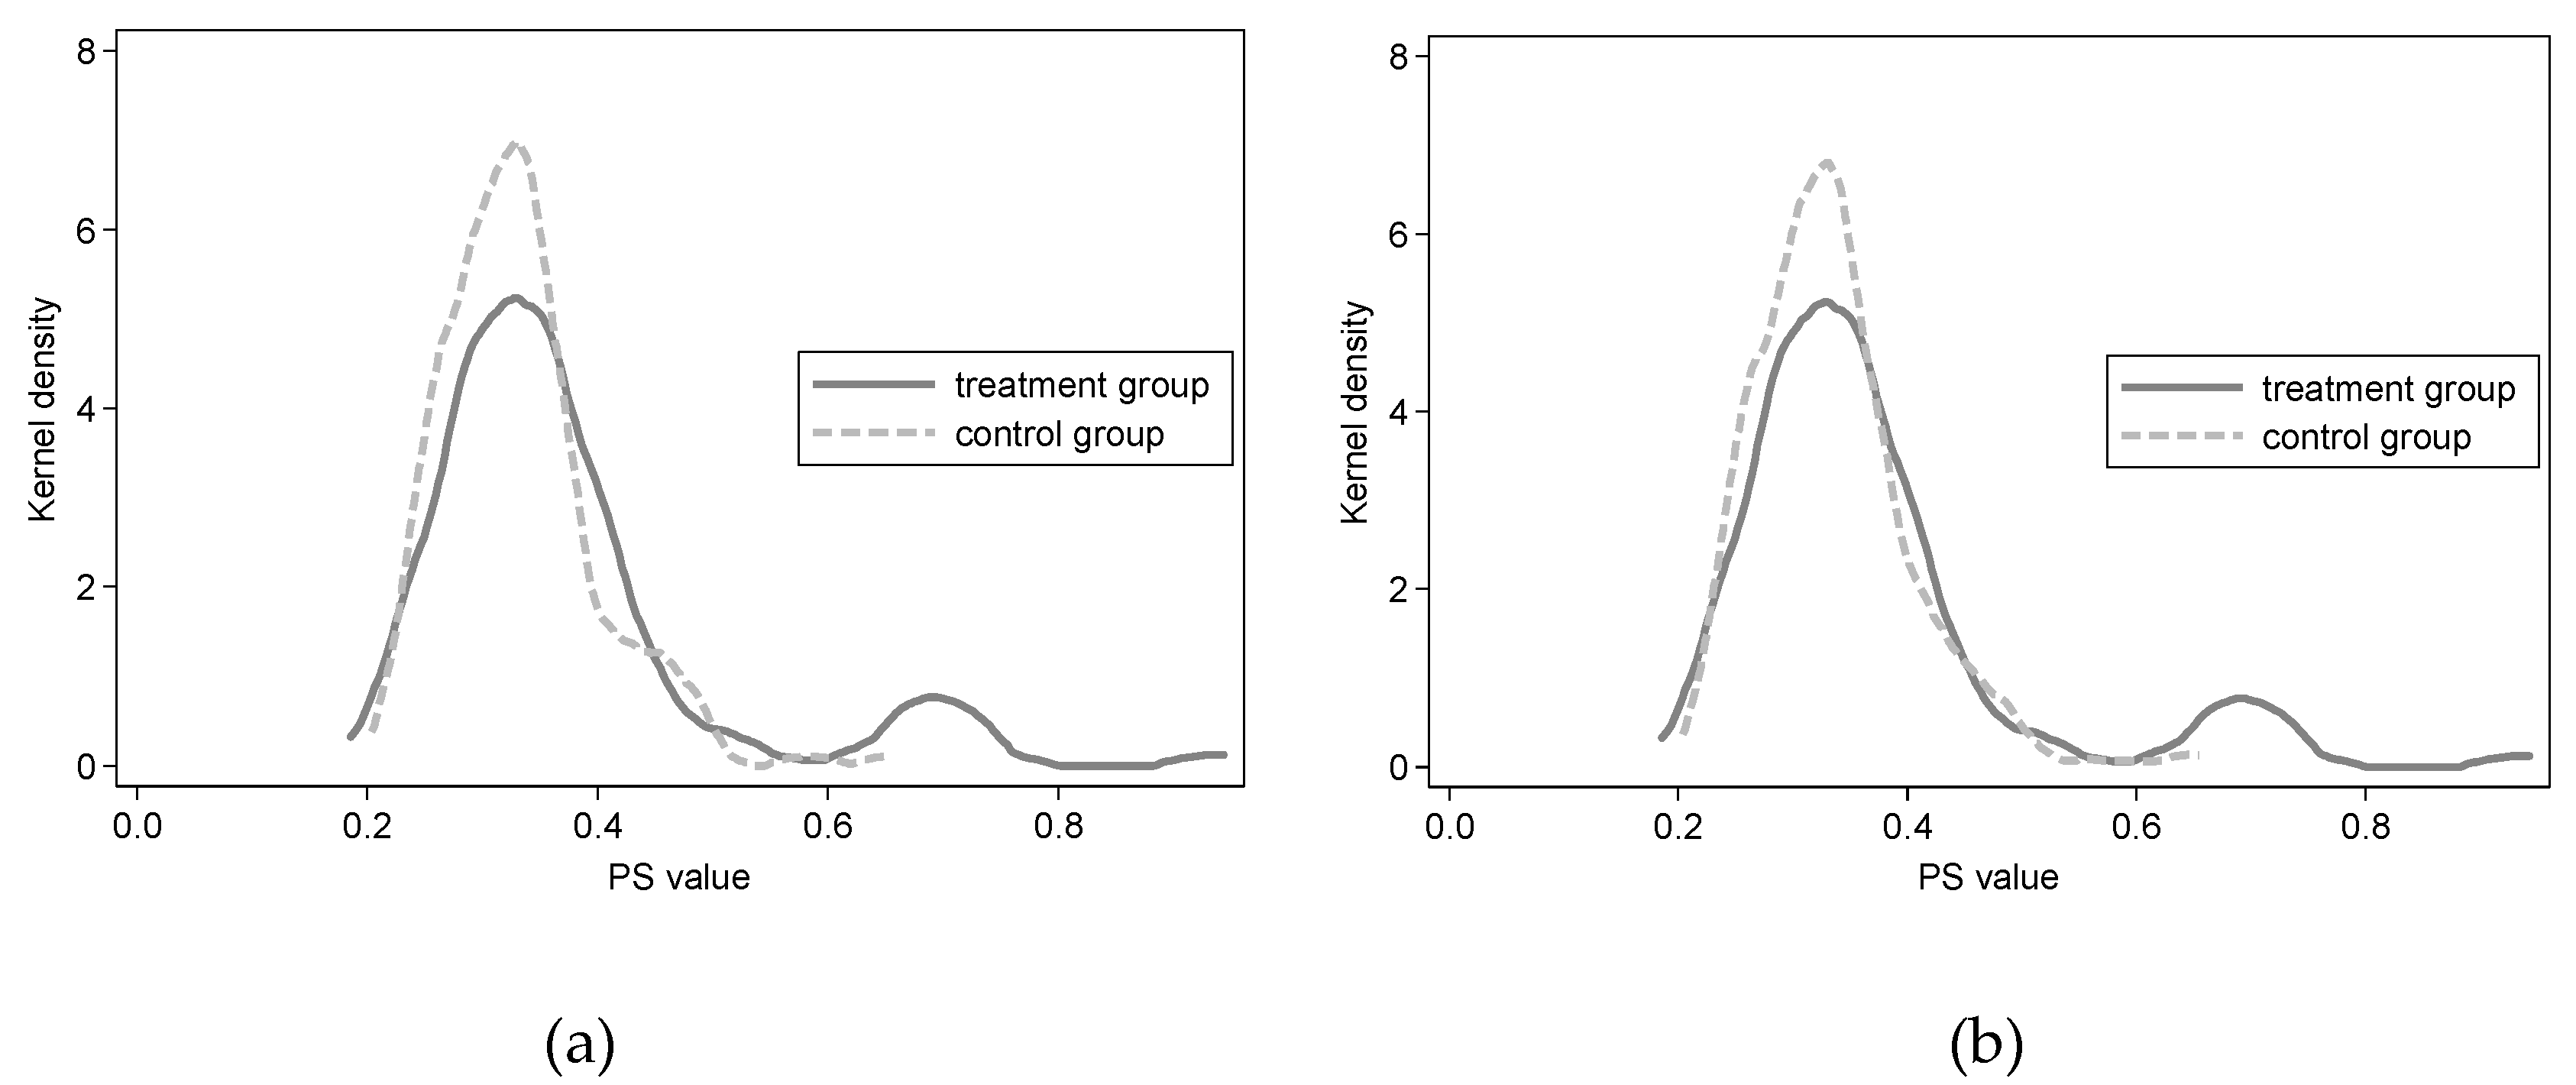
Figure 1 depicts the kernel density distribution of propensity scores for high trade credit (treatment group) and low trade credit (control group). Sub-diagrams (a) and (b) represent the kernel density functions of the PS values of each group before and after matching, respectively. In comparison, the probability distributions of the PS values of the treatment and control groups are closer after matching. This finding indicates that adopting kernel matching under the probit model is effective. Moreover, we achieved similar results under the logit model; those results are not presented separately here.
As Table 10 shows, the difference between the ATT of the treatment group and the control group after PSM is −0.0036 and −0.0035 in the probit model and the logit model, and their T values are both significant at a significance level of 5%. This means that under the situation of financial constraints and internal funds fluctuation, enterprises will use trade credit for R&D investment at high adjustment costs, which is consistent with the empirical result of the regression. Therefore, we can confirm that trade credit can maintain sustainable R&D investment of SMEs under financial constraints after considering the counterfactual situation.
The reported standard errors are deduced by assuming that the propensity scores are the real values, whereas the assumption of the standard errors’ homoscedasticity is likely to be false. Moreover, the potential bias from a small sample size could also affect the conclusion. Thus, this article reports the standard errors using the bootstrap method. The steps of the bootstrap method are as follows: (1) repeatedly draw random samples with size n as empirical samples from the original samples; (2) calculate the ATT of empirical samples using the kernel matching method; (3) repeat the above two steps 500 times to obtain 600 empirical statistics of ATT, ATT1, ATT2, …, ATT500; and (4) calculate the standard deviation of the 500 ATT values to obtain the standard error of the ATT statistic of the original samples. From the last two columns of Table 10, the Z values all remain significant at the significance level of 1% under the probit and logit models, even when using the bootstrap standard errors.
To test the balance of matching, we followed Smith and Todd [47] to calculate the standard deviations between the treatment group and the control group based on the matching variables after kernel matching.
As shown in Table 11, the percentage biases are all below 20%, which will not cause the matching to fail [48], proving the appropriateness of matching variables and kernel matching. The matching results meet the requirement of matching balance.
After considering the counterfactual situation, we can still obtain the same conclusion, which is consistent with the results of the system GMM.

5. Conclusion and Discussion

SMEs are the indispensable players for promoting sustainable R&D investment. R&D investment has positive impacts on financial performance in both the current and the lag periods [49]. Therefore, it is very important to research the subject of sustainable R&D investment of SMEs under financial constraints. Based on existing research, this paper takes Chinese listed SMEs between 2007 to 2014 as samples to test empirically the relaxing effect of trade credit on R&D investment under financial constraints. The results show that SMEs in China are typically trapped by severe financial constraints. As an informal financing factor, trade credit can relax financial constraints of R&D investment for Chinese SMEs. Furthermore, private enterprises are more reliant than non-private enterprises on the relaxing effect of trade credit, and this effect is stronger during periods of tight monetary policy. Our results also can be generalized to other developing countries like China with GDP per capita below the World Bank Standards.
The conclusion of this study is significant for both micro business management and macro policy formulation:
First, SMEs in developing countries should regulate their financial management and establish a perfect system to disclose adequate information related to finance and R&D activities. In this way, both the enterprises’ credit risks and the banks as well as other external creditors’ information-searching costs can be reduced. Banks and investors will be more confident in enterprises’ R&D and will provide enough funds for R&D investment.
Second, SMEs in developing countries should build regional cooperation networks and industry alliances to ensure an adequate trade-credit supply. They can make full use of the effect of industrial agglomeration and relieve the financial constraints of R&D investments by cooperating with upstream and downstream enterprises in the long run and receiving an adequate supply of trade credit.
Third, different monetary policies will exert influence not only on SMEs’ financing environment through bank loans but also on the role of alternative informal financing channels such as trade credit. Therefore, the government should consider the chain reaction of a given monetary policy and comprehensively consider the orientation and change range of its policy so that it can avoid the negative economic reactions caused by a range that is either too loose or too short when making monetary policy.
Further research can be undertaken in the following directions. First, our regressions are only based on the Euler equation model, so it would be interesting to test whether the results are robust when using other models. Second, informal financing channels are also important in other developing countries, so it would be interesting for researchers in these counties to test whether the results are robust. Third, to rule out the impact of equity financing, we used listed firms, so it would be interesting to test whether the results also hold for unlisted firms. Fourth, some studies have emphasized making a distinction between “research” (R) and “development” (D). However, the data from listed firms in China prevented us from conducting such an exercise.
Finally, limited by research power, we did not consider the issues of location and company sector of activity in this paper. They are issues worthy of future research.

Author Contributions

Z.C. was responsible for generating the idea and writing the article. L.C. was responsible for gathering the data and performing the analyses. J.L. was responsible for article modification and language modification.

Funding

This research was funded by the National Natural Science Foundation of China [71302118; 71872042], Department of Education, Jiangsu Province (2018SJZDI059), Qing Lan Project of Nanjing Normal University.

Conflicts of Interest

The authors declare no conflict of interest.

References

  1. Hall, B.H. The financing of research and development. Oxf. Rev. Econ. Policy 2002, 18, 35–51. [Google Scholar] [CrossRef]
  2. Chen, L.Z.; Li, J.; Zander, P. Can political connections maintain the sustainability of R&D investment in China? There is no such thing as a free lunch. Sustainability 2018, 10, 4238. [Google Scholar] [CrossRef]
  3. Myers, S.; Majluf, N. Corporate financing and investment decisions when firms have information that investors do not. J. Financ. Econ. 1984, 13, 187–221. [Google Scholar] [CrossRef]
  4. Weng, Q.; Söderbom, M. Is R&D cash flow sensitive? Evidence from Chinese industrial firms. China Econ. Rev. 2018, 47, 77–95. [Google Scholar]
  5. Brown, J.R.; Petersen, B.C. Why has the investment-cash flow sensitivity declined so sharply? rising R&D and equity market developments. J. Bank. Financ. 2009, 33, 971–984. [Google Scholar]
  6. Dasgupta, S.; Noe, T.H.H.; Wang, Z. Where did all the dollars go? the effect of cash flows on capital and asset structure. J. Financ. Quant. Anal. 2011, 46, 1259–1294. [Google Scholar] [CrossRef]
  7. Brown, J.R.; Fazzari, S.M.; Petersen, B.C. Financing innovation and growth: Cash flow, external equity, and the 1990s R&D boom. J. Financ. 2009, 64, 151–185. [Google Scholar]
  8. Brown, J.R.; Martinsson, G.; Petersen, B.C. Do financing constraints matter for R&D? Eur. Econ. Rev. 2012, 56, 1512–1529. [Google Scholar]
  9. Howell, A. Firm R&D, innovation and easing financial constraints in China: Does corporate tax reform matter? Res. Policy 2016, 45, 1996–2007. [Google Scholar]
  10. Borisova, G.; Brown, J.R. R&D sensitivity to asset sale proceeds: New evidence on financing constraints and intangible investment. J. Bank. Financ. 2013, 37, 159–173. [Google Scholar]
  11. Ju, X.; Lo, D.; Yu, Y. Financial constraints, working capital management, and the sustainability of firm innovation. Econ. Res. J. 2013, 48, 4–16. (In Chinese) [Google Scholar]
  12. Guney, Y.; Karpuz, A.; Ozkan, N. R&D investments and credit lines. J. Corp. Financ. 2017, 46, 261–283. [Google Scholar]
  13. Chen, L. Managerial incentives, R&D investments and cash flows. Manag. Financ. 2017, 43, 898–913. [Google Scholar]
  14. Mateut, S. Subsidies, financial constraints and firm innovative activities in emerging economies. Small Bus. Econ. 2018, 50, 131–162. [Google Scholar] [CrossRef]
  15. Li, R.; Ramanathan, R. Exploring the relationships between different types of environmental regulations and environmental performance: Evidence from China. J. Clean. Prod. 2018, 196, 1329–1340. [Google Scholar] [CrossRef]
  16. Chen, Y.; Hua, X.; Boateng, A. Effects of foreign acquisitions on financial constraints, productivity and investment in R&D of target firms in China. Int. Bus. Rev. 2017, 26, 640–651. [Google Scholar]
  17. Fisman, R.; Love, I. Trade credit, financial intermediary development, and industry growth. J. Financ. 2003, 58, 353–374. [Google Scholar] [CrossRef]
  18. Ayyagari, M.; Demirgüç-Kunt, A.; Maksimovic, V. Formal versus informal finance: Evidence from China. Rev. Financ. Stud. 2010, 23, 3048–3097. [Google Scholar] [CrossRef]
  19. Petersen, M.A.; Rajan, R.G. Trade credit: Theories and evidence. Rev. Financ. Stud. 1997, 10, 661–691. [Google Scholar] [CrossRef]
  20. Laeven, L. Does financial liberalization reduce financing constraints? Financ. Manag. 2003, 32, 5–34. [Google Scholar] [CrossRef]
  21. Ratti, R.A.; Lee, S.; Seol, Y. Bank concentration and financial constraints on firm-level investment in Europe. J. Bank. Financ. 2008, 32, 2684–2694. [Google Scholar] [CrossRef]
  22. Chan, K.S.; Dang, V.Q.T.; Yan, I.K.M. Financial reform and financing constraints: Some evidence from listed Chinese firms. China Econ. Rev. 2012, 23, 482–497. [Google Scholar] [CrossRef]
  23. Arellano, M.; Bover, O. Another look at the instrumental-variable estimation of error-components models. J. Econom. 1995, 68, 29–52. [Google Scholar] [CrossRef]
  24. Blundell, R.; Bond, S. Initial conditions and moment restrictions in dynamic panel data models. J. Econom. 1998, 87, 115–143. [Google Scholar] [CrossRef]
  25. Allen, F.; Qian, J.; Qian, M. Law, finance, and economic growth in China. J. Financ. Econ. 2005, 77, 116–157. [Google Scholar] [CrossRef]
  26. Ding, S.; Knight, J. Why has China grown so fast? the role of physical and human capital formation. Oxf. Bull. Econ. Stat. 2011, 73, 141–174. [Google Scholar] [CrossRef]
  27. Guariglia, A.; Liu, P. To what extent do financing constraints affect Chinese firms’ innovation activities? Int. Rev. Financ. Anal. 2014, 36, 223–240. [Google Scholar] [CrossRef]
  28. Meltzer, A. Mercantile credit, monetary policy, and size of firms. Rev. Econ. Stat. 1960, 42, 429–436. [Google Scholar] [CrossRef]
  29. Huang, Y.; Ma, Y.; Yang, Z.; Zhang, Y. A fire sale without fire: An explanation of labor-intensive FDI in China. J. Comp. Econ. 2016, 44, 884–901. [Google Scholar] [CrossRef]
  30. Nilsen, J.H. Trade credit and the bank lending channel. J. Money Credit Bank. 2002, 34, 226–253. [Google Scholar] [CrossRef]
  31. Brancati, E. Innovation financing and the role of relationship lending for SMEs. Small Bus. Econ. 2015, 44, 449–473. [Google Scholar] [CrossRef]
  32. Loury, G.C. Discrimination in the post-civil rights era: Beyond market interactions. J. Econ. Perspect. 1998, 12, 117–126. [Google Scholar] [CrossRef]
  33. Brandt, L.; Li, H. Bank discrimination in transition economies: Ideology, information, or incentives? J. Comp. Econ. 2003, 31, 387–413. [Google Scholar] [CrossRef]
  34. Cull, R.; Xu, L.C. Institutions, ownership, and finance: The determinants of profit reinvestment among Chinese firms. J. Comp. Econ. 2005, 77, 117–146. [Google Scholar] [CrossRef]
  35. Bond, S.; Meghir, C. Dynamic investment models and the firm’s financial policy. Rev. Econ. Stud. 1994, 61, 197–222. [Google Scholar] [CrossRef]
  36. Love, I.; Preve, L.A.; Sarria-Allende, V. Trade credit and bank credit: Evidence from recent financial crises. J. Financ. Econ. 2007, 83, 453–469. [Google Scholar] [CrossRef]
  37. Liao, W.; Tapsoba, S. China’s Monetary Policy and Interest Rate Liberalization: Lessons from International Experiences. IMF Working Papers; International Monetary Fund: Washington, DC, USA, 2014. [Google Scholar]
  38. Irvine, P.J.; Pontiff, J. Idiosyncratic return volatility, cash flows, and product market competition. Rev. Financ. Stud. 2009, 22, 1149–1177. [Google Scholar] [CrossRef]
  39. Zhu, H.; Yoshikawa, T. Contingent Value of Director Identification: The Role of Government Directors in Monitoring and Resource Provision in an Emerging Economy. Strateg. Manag. J. 2016, 37, 1787–1807. [Google Scholar] [CrossRef]
  40. Hadlock, C.J.; Pierce, J.R. New evidence on measuring financial constraints: Moving beyond the KZ Index. Rev. Financ. Stud. 2010, 23, 1909–1940. [Google Scholar] [CrossRef]
  41. Vermoesen, V.; Deloof, M.; Laveren, E. Long-term debt maturity and financing constraints of SMEs during the Global Financial Crisis. Small Bus. Econ. 2013, 41, 433–448. [Google Scholar] [CrossRef]
  42. Andrieș, A.M.; Marcu, N.; Oprea, F.; Tofan, M. Financial Infrastructure and Access to Finance for European SMEs. Sustainability 2018, 10, 3400. [Google Scholar] [CrossRef]
  43. Campello, M.; Graham, J.R.; Harvey, C.R. The real effects of financial constraints: Evidence from a financial crisis. J. Financ. Econ. 2010, 97, 470–487. [Google Scholar] [CrossRef]
  44. Levine, R.; Lin, C.; Xie, W. Corporate resilience to banking crises: The roles of trust and trade credit. J. Financ. Quant. Anal. 2018, 53, 1441–1477. [Google Scholar] [CrossRef]
  45. Dajcman, S. The bank lending channel of monetary policy and its macroeconomic effects: Evidence from a sample of selected euro area countries. Eng. Econ. 2016, 27, 124–133. [Google Scholar] [CrossRef]
  46. Gilligan, D.O.; Hoddinott, J. Is there persistence in the impact of emergency food aid? evidence on consumption, food security, and assets in rural ethiopia. Am. Econ. Assoc. 2007, 89, 225–242. [Google Scholar] [CrossRef]
  47. Smith, J.A.; Todd, P.E. Does matching overcome LaLonde’s critique of nonexperimental estimators? J. Econom. 2005, 125, 305–353. [Google Scholar] [CrossRef]
  48. Rosenbaum, P.; Rubin, D. Constructing a control group using multivariate matched sampling methods that incorporate the propensity score. Am. Stat. 1985, 39, 33–38. [Google Scholar]
  49. Zang, Z.; Zhu, Q.; Mogorrón-Guerrero, H. How does R&D investment affect the financial performance of cultural andcreative enterprises? The moderating effect of actual controller. Sustainability 2019, 11, 297. [Google Scholar]
Figure 1. Kernel density functions of the PS values of each group before and after matching: (a) Kernel density functions of the PS values of each group before matching; (b) Kernel density functions of the PS values of each group after matching.
Sustainability 11 00843 g001
Table 1. Representative studies on sustainable R&D investment under financial constraints.
AuthorCountriesType of FirmsMethod of ResearchData PeriodFactors
Brown et al. [7]USAhigh-tech firmsGMM1990–2004cash flow and stock issues
Brown & Petersen [5]USAmanufacturing firms,OLS and GMM1970–2006public equity
Dasgupta et al. [6]USAmanufacturing firmsOLS1971–2006leverage reduction
Brown et al. [8]16 countries in Europemanufacturing firmsGMM1995–2007costly stocks of liquidity
Borisova & Brown [10]USAmanufacturing firms and services firmsGMM1980–2008cash inflows from fixed asset sales
Ju et al. [11]Chinaunlisted industrial enterpriseGMM1998–2008working capital
Howell [9]Chinathe “above scale” SOEs and non- SOEs firmsGMM2001–2007reduction in the corporate tax burden
Guney et al. [12]17 European countriespublicly listed firmsGMM2004–2013credit lines
Chen et al. (2017) [16]Chinacross-border mergers and acquisitionsOLS and 2SLS1994–2011foreign acquisitions
Chen [13]USAnon-financial listed firmsOLS1992–2013managerial risk-taking incentives
Mateut [14]30 Eastern Europe and Central Asian countriesmanufacturing, the retail and the coreOLS2009public subsidies
Li et al. [15]Chinanon-financial listed firmsOLS2007–2014environmental regulations
Chen et al. [2]Chinalisted firms in manufacturing industryGMM2006–2015political connections
Table 2. Description of all variables.
VariablesDescriptionMeasure
InnovR&D expendituresmeasured by R&D expenditures of firm
Yincome of enterprisemeasured by sales revenue of firm
CFinternal fundsmeasured by net cash flow generated through operating activities
Ktotal assets of enterprisemeasured by natural logarithm of total assets
NCRtrade credit measured by subtracting accounts receivable from accounts payable and then obtaining the result divided by current operating revenues
Stateownership of enterprisesstate equals 1 for private enterprises and 0 for non-private enterprises
MPmonetary policymeasured by changing rate of M2, MP equals 1 for a negative changing rate of M2, and 0 for a positive changing rate of M2.
Table 3. Descriptive statistics analysis.
VariablesMeanStandard DeviationMinimumMaximum
Innov/K0.0020.00700.167
(Innov/K)20.00010.00100.028
Y/K0.7020.4900.0457.609
CF/K0.0420.081−0.3930.430
NCR−0.0820.175−1.4861.580
State0.2110.40801
MP0.3830.48601
Notes: This paper retains only three rounds if empirical results have more than 3 decimal places but preserves the sign before the coefficient to indicate the direction of the coefficient.
Table 4. The correlation matrix.
VariablesInnov/K(Innov/K)2Y/KCF/KNCRStateMP
Innov/K1
(Innov/K)20.825 ***1
Y/K−0.079 ***−0.037 *1
CF/K0.027 **0.009 ***0.086 ***1
NCR−0.135 ***−0.065 ***0.206 ***0.188 ***1
State0.030 *0.053 *−0.014 *0.094 ***0.118 ***1
MP0.013 *0.009 *0.008 *0.142 ***0.005 *0.018 *1
* Significant at 10%; ** significant at 5%; *** significant at 1%.
Table 5. The unit root test of the panel data.
VariablesInnov/K(Innov/K)2Y/KCF/KCF/K*NCRCF/K*StateCF/K*NCR*StateCF/K*MPCF/K*NCR*MP
Fish-PP−6.69 ***−5.75 ***−28.97 ***−31.56 ***−43.59 ***−27.27 ***−22.89 ***−38.51 ***−35.52 ***
r ^ number of common factors666565544
ta *−25.65 ***−22.02 ***−44.02 ***−49.02 ***−55.65 ***−45.32 ***−41.88 ***−52.06 ***−51.01 ***
tb *−11.92 *−8.99 ***−15.02 ***−19.12 ***−25.26 ***−15.55 ***−11.39 ***−22.14 ***−20.11 ***
autoregressive parameter0.610.680.530.460.420.590.610.490.51
Notes: (1) We report the Z statistic of the Fish-PP test; (2) * Significant at 10%; ** significant at 5%; *** significant at 1%; (3) ta, and tb are the unit root test statistics based on de-factored panel data.
Table 6. Test report of the regression model.
Model (1)Model (2)Model (3)Model (4)Model (5)Model (6)
VIF1.01–3.161.01–3.301.02–3.301.02–3.311.02–5.901.03–4.27
Chi-squared 5.0 × 1038 ***1.7 × 1039 ***1.1 × 1037 ***3.4 × 1037 ***1.6 × 1035 ***4.2 × 1037 ***
Notes: * Significant at 10%; ** significant at 5%; *** significant at 1%.
Table 7. The effect of trade credit on R&D investment.
Model (1)Model (2)Model (3)Model (4)Model (5)Model (6)
Innov/Kt−10.405 ***0.744 ***0.752 ***0.741 ***0.496 ***0.613 ***
(142.25)(232.61)(322.10)(283.66)(279.94)(128.02)
(Innov/K)24.182 ***4.03 × 10⁻²¹ ***4.16 × 10⁻²¹ ***4.23 × 10⁻²¹ ***2.67 × 10⁻¹⁹ ***2.45 × 10⁻²¹ ***
(87.90)(27.56)(33.02)(21.63)(352.81)(62.20)
Y/K−0.001 ***−0.003−0.001 ***−0.00030.001 ***−0.001 ***
(−4.20)(−1.33)(−3.25)(−1.80)(3.79)(−4.06)
Dummy year 11.14 *26.42 ***73.24 ***14.08 **433.73 ***40.52 ***
CF/K0.004 ***0.003 **0.0010.002 **0.022 ***−0.002
(4.38)(2.05)(1.01)(1.98)(30.70)(−1.56)
CF/K*NCR −0.024 ***−0.002−0.005 −0.009 ***−0.012 ***
(−4.00)(−0.45)(−1.21)(4.12)(−3.98)
CF/K*State 0.014 ***
(10.97)
CF/K*MP −0.002 **−0.004 ***−0.003 ***
(−2.03)(−4.52)(−2.90)
CF/K*NCR*State −0.049 ***
(−5.78)
CF/K*NCR*MP −0.031 ***−0.039 ***−0.009
(−3.15)(−5.35)(−0.89)
AR(1) 0.0080.0150.0090.0140.0290.027
AR(2) 0.2020.1450.1690.1540.3030.285
Sargan test71.40763.19386.74157.49670.74893.028
Number of observations26782678267826785692109
Number of instruments647698888186
Notes: (1) * Significant at 10%; ** significant at 5%; *** significant at 1%; (2) z statistics in parentheses; (3) p-values are reported for AR (1), AR (2); (4) chi-squared value are reported for Sargan test.
Table 8. The robust test by changing data structure and sample size.
Model (7)Model (8)Model (9)Model (10)Model (11)Model (12)
Innov/Kt−10.974 ***0.518 ***0.518 ***0.502 ***0.492 ***0.554 ***
(164.66)(86.55)(81.315)(81.97)(251.30)(81.51)
(Innov/K)2−5.772 ***1.54 × 10−205.56 × 10−222.37 × 10⁻²⁰−6.63 × 10⁻²¹ ***3.25 × 10⁻¹⁹ ***
(−62.73)(0.65)(0.03)(0.96)(−10.14)(6.35)
Y/K−0.001 ***−0.001 ***−0.001 ***−0.001 ***0.002 ***−0.0003 *
(−3.89)(−3.63)(−3.89)(−5.17)(9.61)(−1.71)
Dummy year84.59 ***26.34 ***25.29 ***48.07 ***714.57 ***41.83 ***
CF/K0.024 ***0.001 **0.002 ***0.005 ***0.009 ***0.001 ***
(23.96)(2.18)(5.79)(5.33)(14.77)(15.45)
CF/K*NCR −0.054 ***−0.014 **−0.015 ***−0.021 ***−0.023 ***
(−7.71)(−2.02)(−2.71)(−6.58)(−4.38)
CF/K*State −0.016 ***
(−6.41)
CF/K*MP −0.004 ***−0.005 ***−0.002 *
(−3.14)(−6.90)(−1.78)
CF/K*NCR*State −0.028 ***
(−4.67)
CF/K*NCR*MP −0.058 ***−0.052 ***0.048 ***
(−6.47)(−16.10)(4.11)
AR (1)0.0060.0390.0310.0350.0640.035
AR (2)0.3390.1310.1570.1490.3080.354
Sargan test50.52971.146102.8291.89163.77465.227
Number of observations18751875187518754651410
Number of instruments6173122878183
Notes: (1) * Significant at 10%; ** significant at 5%; *** significant at 1%; (2) z statistics in parentheses; (3) p-values are reported for AR (1), AR (2); (4) chi-squared value are reported for Sargan test.
Table 9. The robust test by the fixed effect model and random effect model.
Fixed EffectRandom Effect
Innov/Kt−10.360 ***0.662 ***0.669 ***0.658 ***0319 ***0.588 ***0.447 ***0.585 ***
(126.60)(207.02)(286.69)(252.45)(112.38)(183.76)(254.46)(224.09)
(Innov/K)23.722 ***3.03 × 10⁻¹⁸ ***3 × 10⁻¹⁶ ***3.23 × 10⁻¹⁹ ***3.30 ***3.03 × 10⁻²⁹ ***3.22 × 10⁻¹⁹ ***3.33 × 10⁻²¹ ***
(78.23)(24.53)(29.39)(19.25)(69.44)(21.77)(26.08)(17.09)
Y/K−0.001 ***−0.002−0.001 ***−0.003−0.003 ***−0.003−0.001 **−0.0003
(−3.74)(−1.18)(−2.89)(−1.60)(−3.32)(−1.05)(−2.57)(−1.42)
Dummy year controlcontrolcontrolcontrolcontrolcontrolcontrolcontrol
CF/K0.003 ***0.002 **0.0010.002 *0.004 ***0.003 *0.0010.002 *
(3.89)(1.82)(0.009)(1.76)(3.46)(1.66)(1.01)(1.66)
CF/K*NCR −0.019 ***−0.002−0.003 −0.019 ***−0.002−0.005
(−3.56)(−0.40)(−1.08) (−3.16)(−0.36)(−0.96)
CF/K*State 0.012 *** 0.011 ***
(9.76) (8.67)
CF/K*MP −0.002 * −0.002 *
(−1.83) (−1.78)
CF/K*NCR*State −0.043 *** −0.039 ***
(−5.14) (−4.57)
CF/K*NCR*MP −0.028 *** −0.025 **
(−2.80) (−2.49)
Number of observations26782678267826782678267826782678
Durbin (score) chi212.97 ***13.65 ***15.27 ***16.22 ***12.23 ***13.35 ***14.21 ***17.12 ***
Wu-Hausman F15.98 ***17.77 ***18.92 ***19.15 ***14.36 ***15.43 ***16.71 ***19.43 ***
Notes: (1) * Significant at 10%; ** significant at 5%; *** significant at 1%;
Table 10. Treatment effect of propensity score matching (entire samples).
Treatment EffectTreatment Control DifferenceS.E.TBootstrap S.E. Z Value
OLS0.00040.0039−0.00360.001−3.45
ATT of probit model0.00040.0039−0.00350.001−4.410.001−4.09 ***
ATT of logit model0.00030.0039−0.00350.001−4.420.001−4.46 ***
Note: * Significant at 10%; ** significant at 5%; *** significant at 1%.
Table 11. Test results of the matching balance of variables (entire samples).
Probit ModelMean%Bias%Reduct| Bias|
TreatedControl
F/Ai,t0.2620.2573.287.0
LOANi,t0.1480.150−1.295.5
GROWTHi,t0.1960.315−4.874.6
OCFLi,t0.0790.07011.8−60.0
Logit modelTreatmentControl%bias%reduct| bias|
F/Ai,t0.2620.2582.789.0
LOANi,t0.1480.150−1.494.5
GROWTHi,t0.1960.302−4.377.4
OCFLi,t0.0790.07111.1−50.9

