1. Introduction
In light of the unprecedented rapidity and size of economic growth, China has long been praised for top priority in public investment on infrastructure, aiming at promoting social welfare through a series of positive measures like the China Railway High-speed (CRH), Three Gorges Dam, Fiber-To-The-Home (FTTH), and so on. However, in the shadow of expensive housing prices hovering at an incredible level and gradually escalating trade war, the latter half of year 2018 in China was featured by a hotly-debated concept: “consumption downgrade”. Deeply worrying about the potential adverse influence upon their normal life, some pessimistic consumers express excessive anxiety and impute their decreased purchasing power to aggressive expansion of public infrastructure investment, for the reason that these projects bear a long return period and crowd out their counterparts, which directly satisfies the current needs of ordinary citizens. Consumers around China complain about the sky-high housing prices and heavy household debt, which successfully aroused the attention of the government. No matter how excellent the economic performance is, it is hard to deny that a widespread belief in a dismal business outlook impairs market expectation, as well as government executive ability. Hence, it is important to consolidate sustainability by letting government attach importance to household consumption and welfare, in addition to the chief goal of achieving economic growth.
What is worse, the situation faced by the central bank and monetary policy is also tough and grim. Although the People’s Bank of China (PBoC) successfully accomplished the purpose of curbing excessive credit expansion in M2and bank loans, the shadow banking system has sprung up rapidly, and the loans in it have taken up 20.25% by the first quarter of 2018, according to the data released by the Center for Quantitative Economic Research (CQER), Federal Reserve Bank of Atlanta. These quasi-bank financial institutions growing up in the shadows are by no means subjected to regulations compared with their traditional counterparts and act as the perfect places concealing credit and liquidity risks. A salient feature of shadow banking is high leverage, which is accompanied by asset price bubbles especially exposed in the turbulent housing market in China recently. As is pointed out by [
1], the prosperously-developed shadow banking sector contributes to a noticeably rising debt-to-GDP ratio. Since many transactions conducted by these non-bank institutions are invisible to regulators and inexperienced investors, the monetary authority’s hand is actually tied, and its once effective conventional contractionary interest rate policies no longer work well as before. Just as the wide criticisms on the large-scale fiscal stimulus after the 2008 global financial crisis, public infrastructure investment and all other well-intended policies might run counter to the government’s desire: The liberalized Chinese financial system cultivates incentives for hiding default risks, which leads the financial assistance to flow into high-stake trade markets rather than into the real economy [
2].
At another level, as is strongly appealed and advocated by scholars and politicians, public infrastructure investment indeed plays a pivotal role in improving people’s living standards, realizing free education, and providing affordable healthcare. This infrastructure-based development path contributes to a harmonious civil order and rational consumption behavior associated with sustainable growth in the long term, especially in emerging and developing countries.
Quite a few criticisms towards vigorous government support on fundamental facilities and systems concentrate on its side effects through corruption and inefficiency during the execution process. The work in [
3] proposed a conceptual model for benchmarking the sustainability of local governments. Another vein is the tendency of accumulating surplus capacity and bringing down capital utilization rate, which generates a waste of resources and not environmental production behaviors. If the Ministry of Finance incessantly grants appropriation for capital construction, the government-supported enterprises will continually operate, even if their commodity supply has already exceeded the market demand. When the downstream building companies do not need so much steel or the subway lines in city’s outskirts rarely carry passengers, the steel mills and subway systems run idle, bearing tremendous operational costs. Even worse, state-owned banks are prone to finance government business enterprises, which are backed by public credibility. As a result, numerous private enterprises with high efficiency find it hard to get funded and have to start empty-handed, leading to a further deterioration of the market environment.
Therefore, critical questions arise here: Does the aggressively-expanded government infrastructure spending unintentionally breed the by-product of consumption degradation? Does the actively-proposed investment in manufacturing industry create the problem of overcapacity or not? Should we blame the well-intentioned Productive Government Expenditure (PGE) accumulation for the disorganization, redundancy, and inefficiency among certain state-owned enterprises? What are the exact macroeconomic effects of these infrastructure projects all across the nation?
To address these issues, this paper focuses on the particular institutional arrangements in China and carries out a systematic and meticulous study. We first characterize stylized facts in China and apply a Vector-Autoregression (VAR) model to discuss the effect on household consumption and aggregate output in response to a positive PGE shock. The VAR model indicates that PGE crowds out household consumption. Then, we incorporate public infrastructure investment and capacity utilization in a Dynamic Stochastic General Equilibrium (DSGE) model. The dynamic analysis shows that a conscious policy decision of actively-promoting public investment crowds out household consumption and generates the superficial appearance of the so-called “consumption downgrade”, which resonates well with the empirical evidence. However, such a policy in essence enhances secular growth invisibly by alternative fiscal support. The situation of industry overcapacity is alleviated by the increased capital utilization and rapidly-diminished goods in stock.
Regarding the methodologies, the Vector-Autoregression (VAR) model is an econometric method of applying time series, through which we can identify the dynamic effect of Productive Government Expenditure (PGE) on other economic variables, such as consumption, output, and so on. For the theoretical part, the Dynamic Stochastic General Equilibrium (DSGE) model is a useful and prominent tool for policy makers (e.g., central banks and local governments), to analyze the aggregate economic behavior and predict the outcomes of policy intervention. More importantly, a calibrated DSGE model simulates the effects of fiscal and monetary policies and, thus in this way, confirms the impulse response analysis in vector autoregression accordingly.
This paper contributes to existing studies in the following aspects. First, to the best of our knowledge, this is the first paper attempting to comprehensively elucidate the underlying causes and exact mechanism of the hotly-debated, yet still ambiguous notion of “consumption downgrade”. It is of crucial importance in both theory and practice to expound this new concept for the sake of guiding the direction of public opinion, stabilizing market sentiment, as well as fulfilling the ultimate objective of improving people’s livelihood. As a second contribution, this study establishes a formal and explicit framework in which principal indicators including consumption, output and capacity utilization are examined in a theoretical framework with respect to PGE. As is later manifested in
Section 2.3, even though so much literature had referred to industry overcapacity produced by PGE before, no deterministic conclusions have been drawn. More importantly, this paper is instructive for posterior scholars who are curious and keen to draw on the experience of the “China miracle” and helps them delve into the desirable policy instruments applicable to developing economies that share the same traits as China. By fitting their typical characteristics into an extended Dynamic Stochastic General Equilibrium (DSGE) model, we extend the applicability of this model to institutional design aiming at facilitating healthy, harmonious, and sustained development.
The impact of productive government expenditure on household consumption mainly depends on two opposite effects in our model. On the one hand, in the Real Business Cycle (RBC) model, an increase in productive government expenditure changes household’s lifetime budget constraint, therefore reducing the present value of household’s lifetime wealth. The negative wealth effect pulls down current consumption and increases labor supply, which finally crowds out private consumption. On the other hand, in view of the transmission path of production, the increase in productive government expenditure raises aggregate output and total income of residents, thus leading to a positive wealth effect. In the traditional Keynesian theory, the expansion of fiscal policy will promote total output and consumption. In our general equilibrium model, however, the effect of fiscal expansion on consumption is due to the dominant wealth variation. Furthermore, the magnitude of the effect on consumption also depends on other indirect price effects, such as the wage effect and the interest rate effect.
The rest of our work is organized as follows.
Section 2 reviews existing literature concerning the comprehensive influence of government infrastructure investment.
Section 3 displays the macro characteristics in China and presents preliminary empirical results.
Section 4 builds up a theoretical general equilibrium model, characterizing agents behaviors and solving the deterministic steady state.
Section 5 calibrates the theoretical model with credible parameters in line with the stylized facts in China, adds an exogenous Productive Government Expenditure (PGE) shock, and evaluates impulse responses in the simulated framework. In this section, sensitivity analysis is further conducted as an extension of the benchmark model in the face of uncertainty in calibrated parameters.
Section 6 concludes, provides policy implications, and puts forward limitations and corresponding future research.
3. Empirical Evidence
3.1. Stylized Facts
As a matter of fact, the current economic climate in China seems not so dismal as certain gloomy predictions.
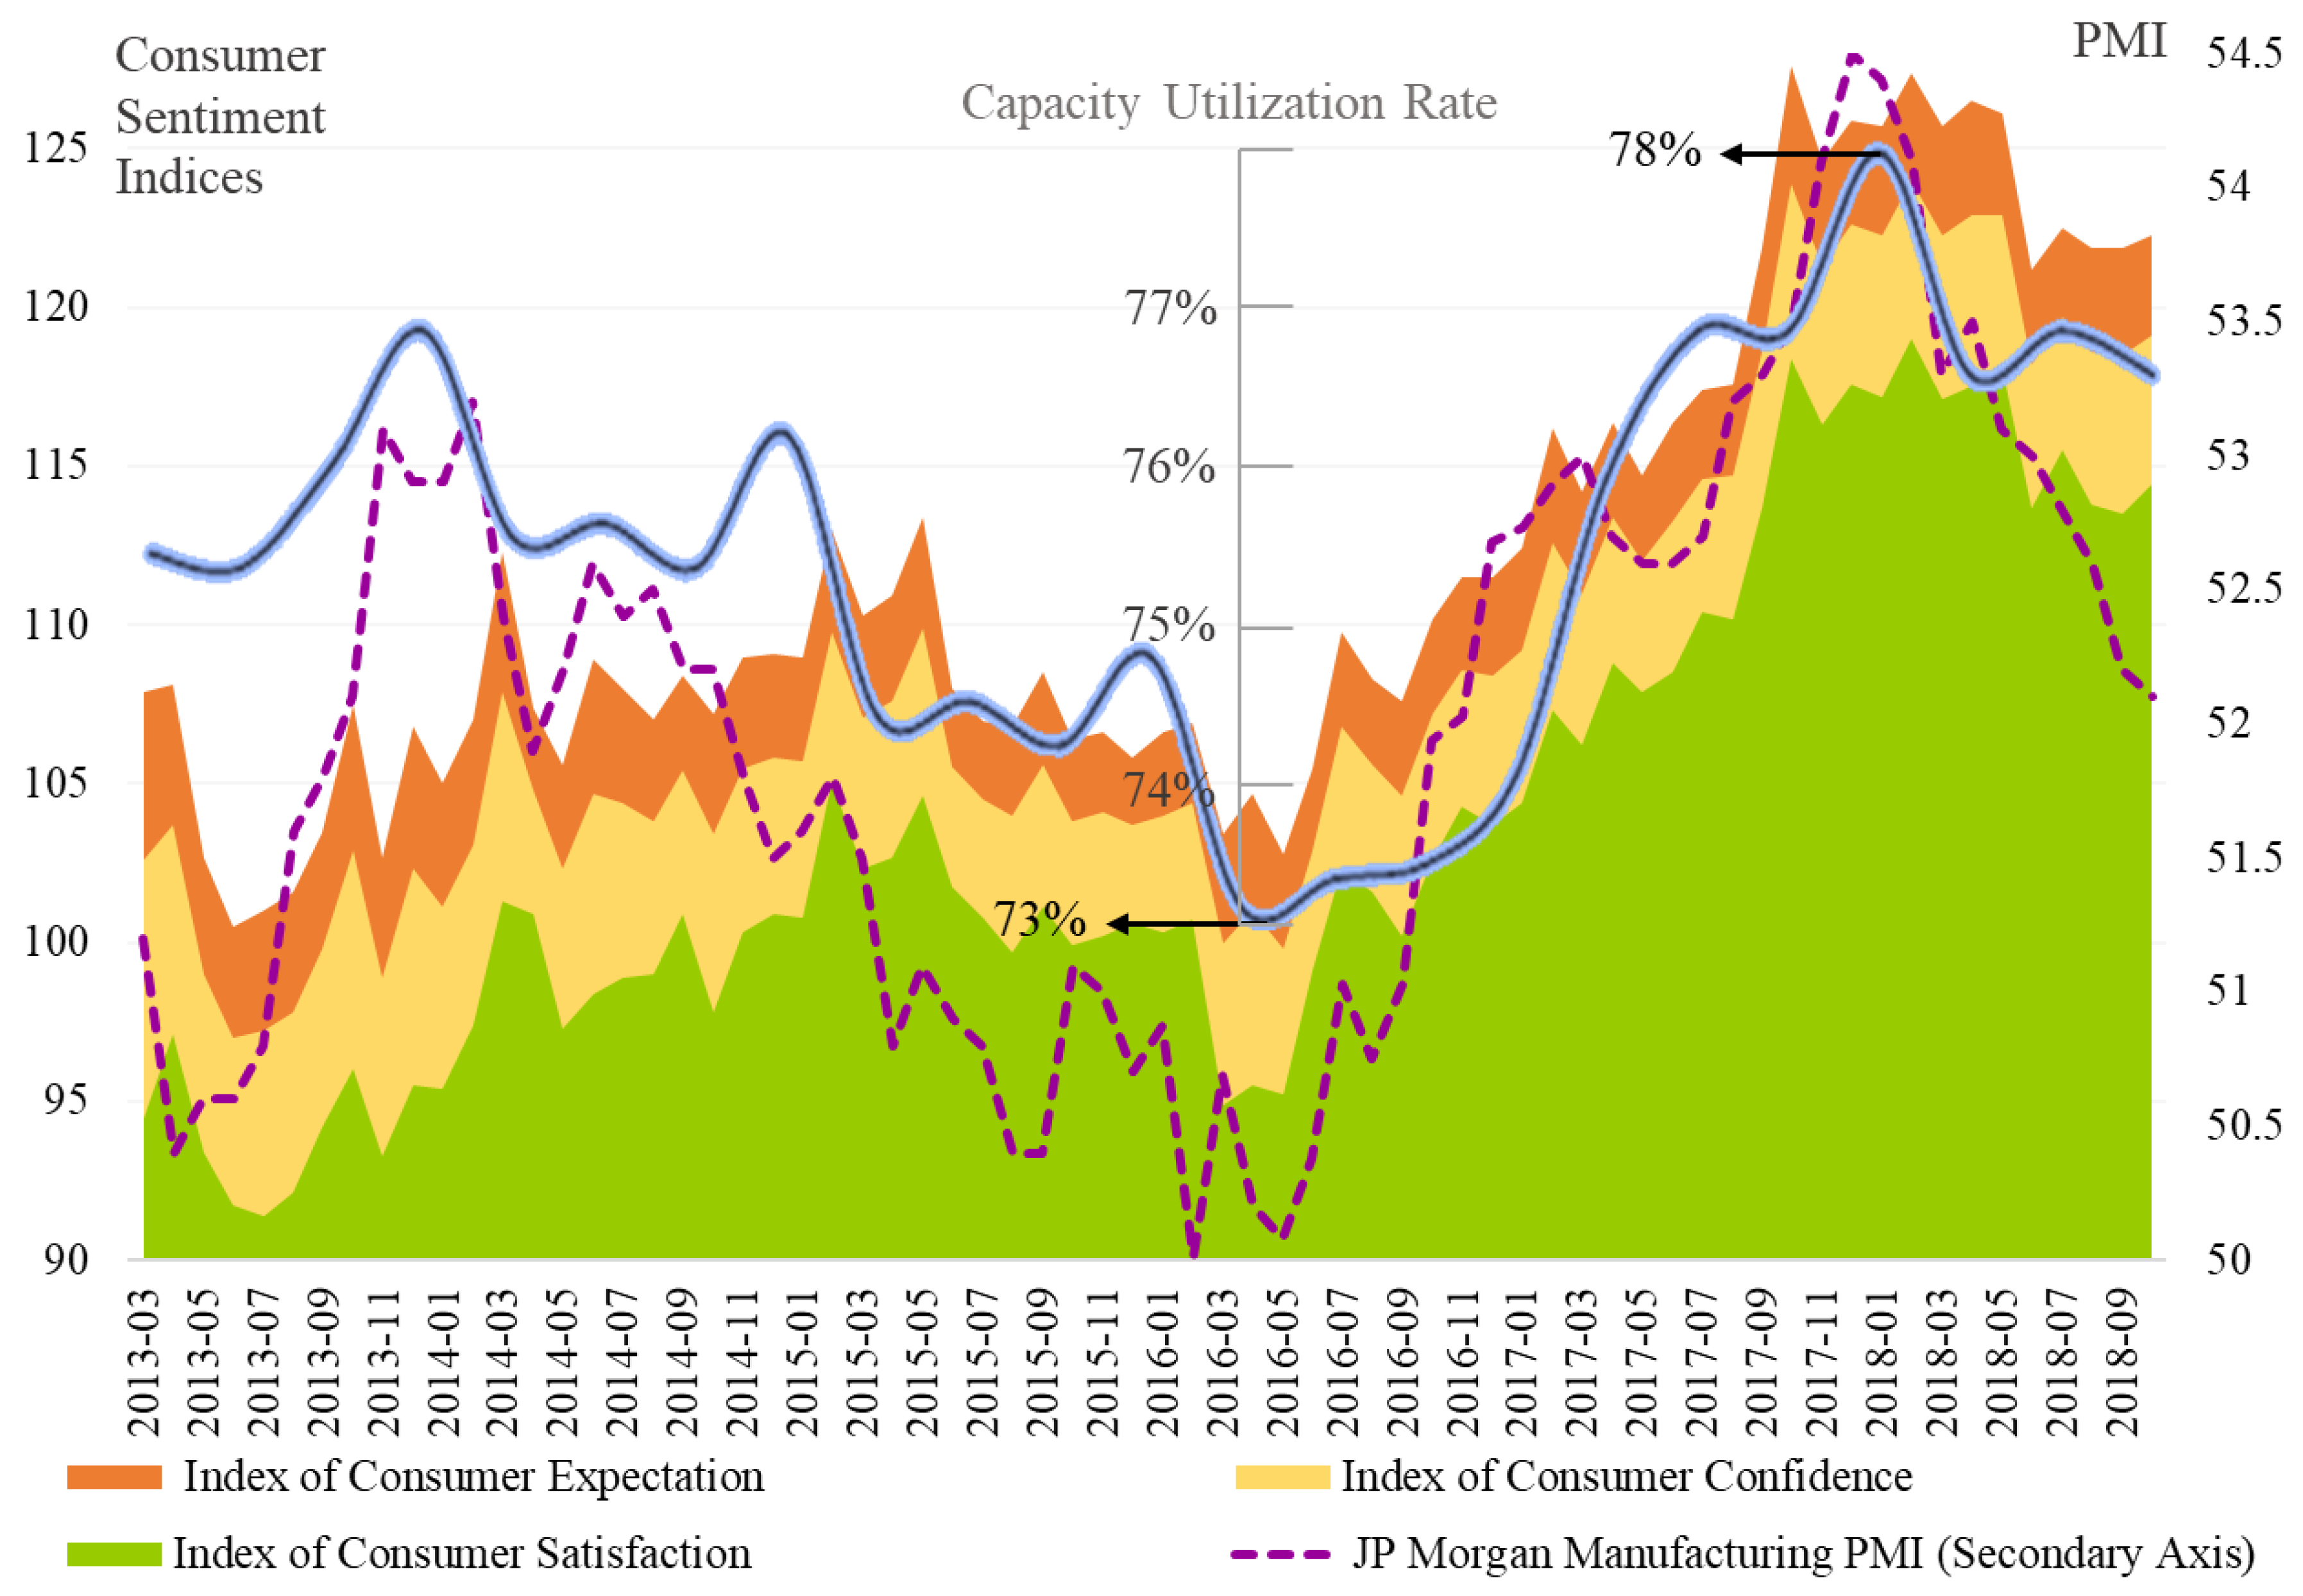
Figure 1 provides a visual overview of market sentiment for consumers and producers. First, the main body (stacked areas) of this chart displays three indices, which measure economic outlook of households, their degree of optimism about overall economic personal finance, and how products/services supplied by manufacturers meet consumer expectations, respectively. None of these indicators in the consumer market reflect a sentiment downturn, at least in the past five years. As a matter of fact, we can observe a distinct steady upward trend since the middle of year 2016, under a series of supportive news including the Chinese official currency (Renminbi) added to the Special Drawing Rights (SDR) Basket, implementation of supply-side reforms, reconstruction of central-controlled enterprises, etc. Second, in the market for domestic manufacturers, the purple dashed line shows that the Purchasing Managers’ Indices (PMI) keep pace with the consumer indices, presenting a stable and bullish mood among business decision makers, purchasing managers, and market analysts.
Apart from the market sentiments, we add some extra information closely linked to the long-term stability of the aggregate economy. The blue solid line in
Figure 1 further gives insight into how efficient the production sectors operate in China. As a standard business metric and a key macro indicator for productive capacity, the utilization rate captures the ratio of actually realized economic productivity to its potential level. The industrial capacity utilization rate in China reached its peak at the beginning of 2018, steadily rising after the wave trough in mid-2016, at least over the last five years.
Overall, the broad outline of economic status for some time past cannot help to confirm the existence of shrinking consumption power for households. The business activities slowed down in 2015, which is very reasonable since the spreading of the concept of the “new normal” laid less stress on full-speed growth and paid more attention to profound structural reform. Nevertheless, over the last two years, China soon returned back to a sound growth momentum.
Since the above picture is still a sketchy overview, the displayed general prosperity in China’s economy may have some shortage of credibility. Therefore, descriptive details are called for in
Table 1 to reveal the time series characteristics of the concerned variables during the period of 1995Q1∼2017Q4 in China. All the quarterly time series we use were extracted from the integrated dataset in [
36] based on the raw data from China’s National Bureau of Statistics (NBS), Ministry of Finance, and the People’s Bank of China (PBoC). “PGE share” is the ratio of gross fixed capital formation of government to total government spending. “Consumption” and “output” are household consumption level and Gross Domestic Product (GDP) by expenditure. “Investment” is gross capital formation. “Inflation” is the quarterly percentage change in the Consumer Price Index (CPI). Nominal variables are deflated by their respective price deflators, detrended, and take the logarithmic form.
Some salient features deserve to be mentioned in
Table 1, reflecting distinct Chinese characteristics.
From the perspective of volatilities, consumption is more volatile (1.64 times) than output, which is a stylized fact in developing countries. Investment fluctuates much more (five times) than output, whereas the magnitudes of fluctuations in output and inflation are nearly equal.
First of all, one plausible explanation for more volatile consumption is the fast-expanding Chinese “Moonlight Clan” in recent years, who consume all their disposable incomes before the next month they get paid. In addition, raised concerns about the sustainability of unprecedented high growth rates have an impact on consumer sentiments and render households more sensitive to market turbulence. It is worth noting that the correlation between consumption and PGE share is negative and statistically significant. A higher proportion of productive government expenditure promotes production and increases aggregate output. However, as a tradeoff, more taxation will be imposed to keep government budget balanced, and in turn pull down the household’s disposable income. As a result, the negative correlation coefficient implies that the effect on the reduction in consumption is dominant, showing the crowd out effect of PGE on consumption.
The chief variable in evidence, the proportion of productive government expenditure in total government spending, shows intense volatility, 1.76-times that of the fluctuation of the business cycle. This result resembles the observations of the frequent application of fiscal policy in China. Aiming at stimulating economic growth, multiple investments in infrastructure and development (e.g., Beijing-based Asian Infrastructure Investment Bank (AIIB), globally-watched Belt and Road Initiative (BRI) initiative, etc.) all contribute to the sharp wave of government expenditure. Although the increase in PGE share stimulates the production, consumption is diminished by the negative income effect, which in turn pulls down the aggregate output. The increase in productive expenditure partially offsets the expansionary effect of the reduction in consumption. As a result, the correlation coefficient between PGE share and output is negative, but not statistically significant.
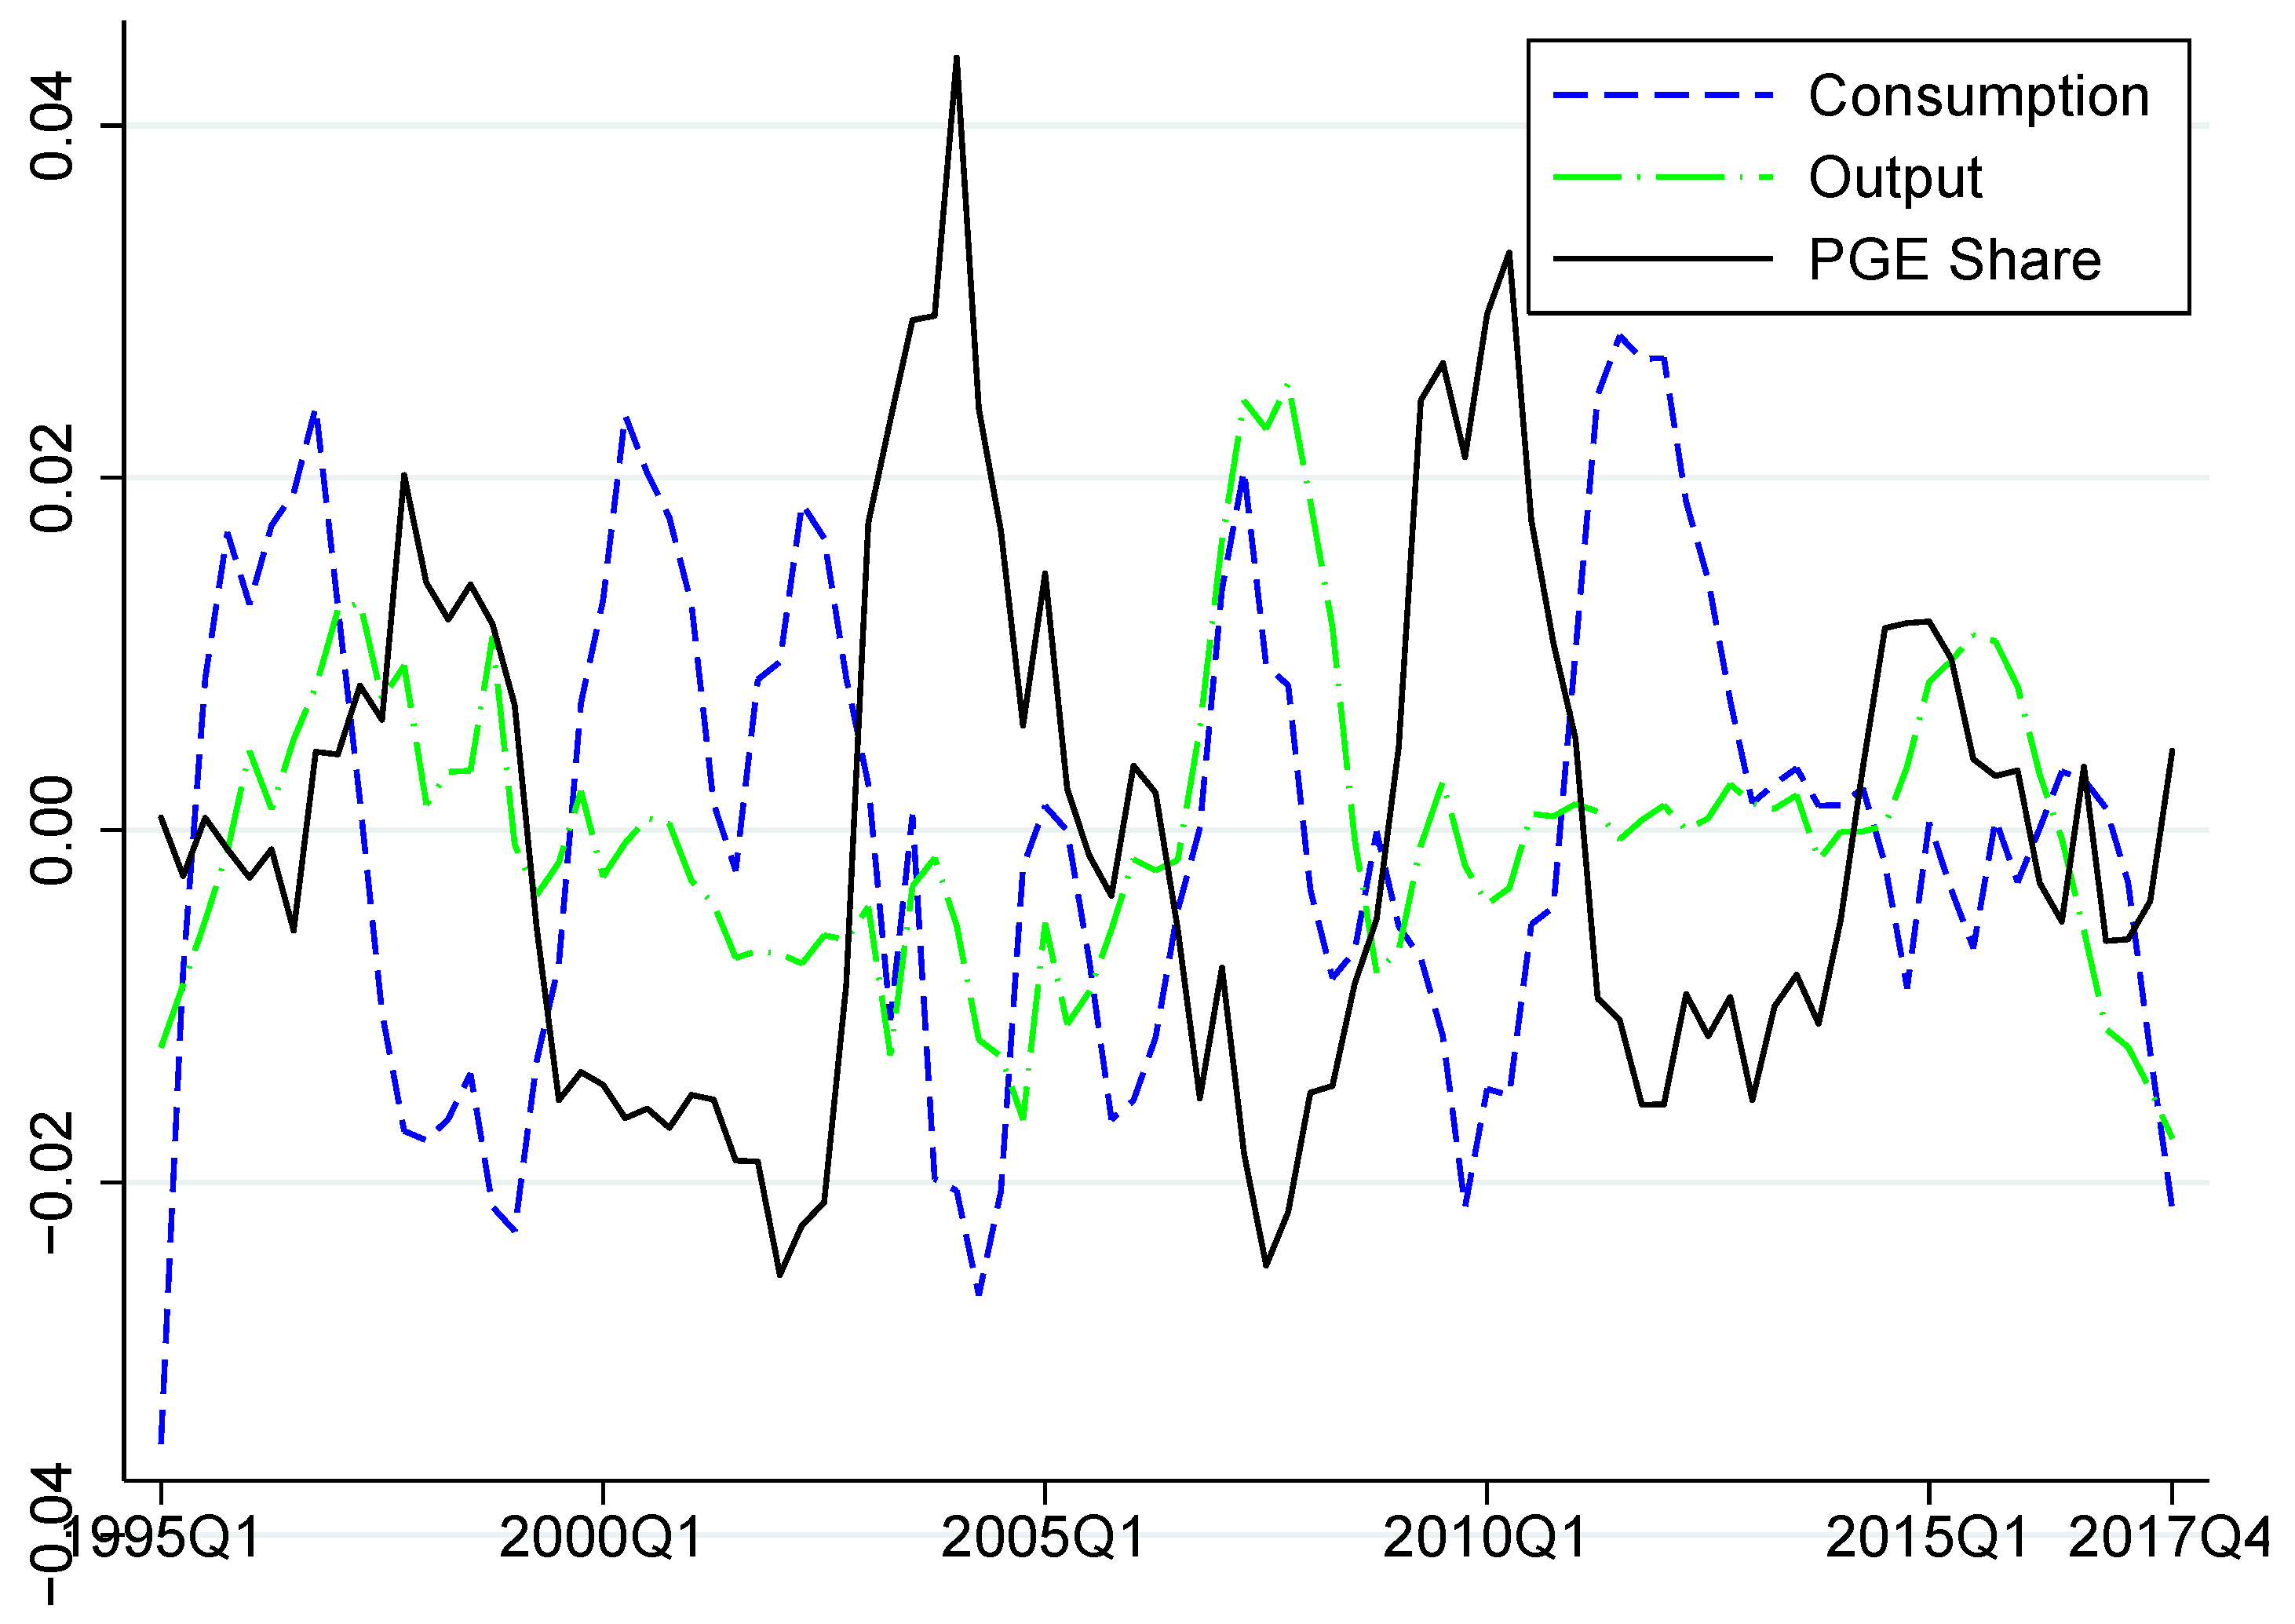
As a visual supplementary of the characteristic macroeconomic environment in
Table 1, the time series chart in
Figure 2 intuitively exhibits the evolution trend of public infrastructure investment with respect to the business cycle. The inverse behavior of PGE and private consumption can be observed easily, while output shows a more vague and smooth development through the last five years in China.
3.2. Public Infrastructure Shock
According to the descriptive statistical analysis in
Section 3.1, a more aggressive investment into public infrastructure construction goes along with a conspicuously lower consumption level and uncertain economic development. Nevertheless, the very shallow correlation analysis seems not able to provide persuasive evidence for ascribing “consumption downgrade” and even bad economic performance to these active initiatives.
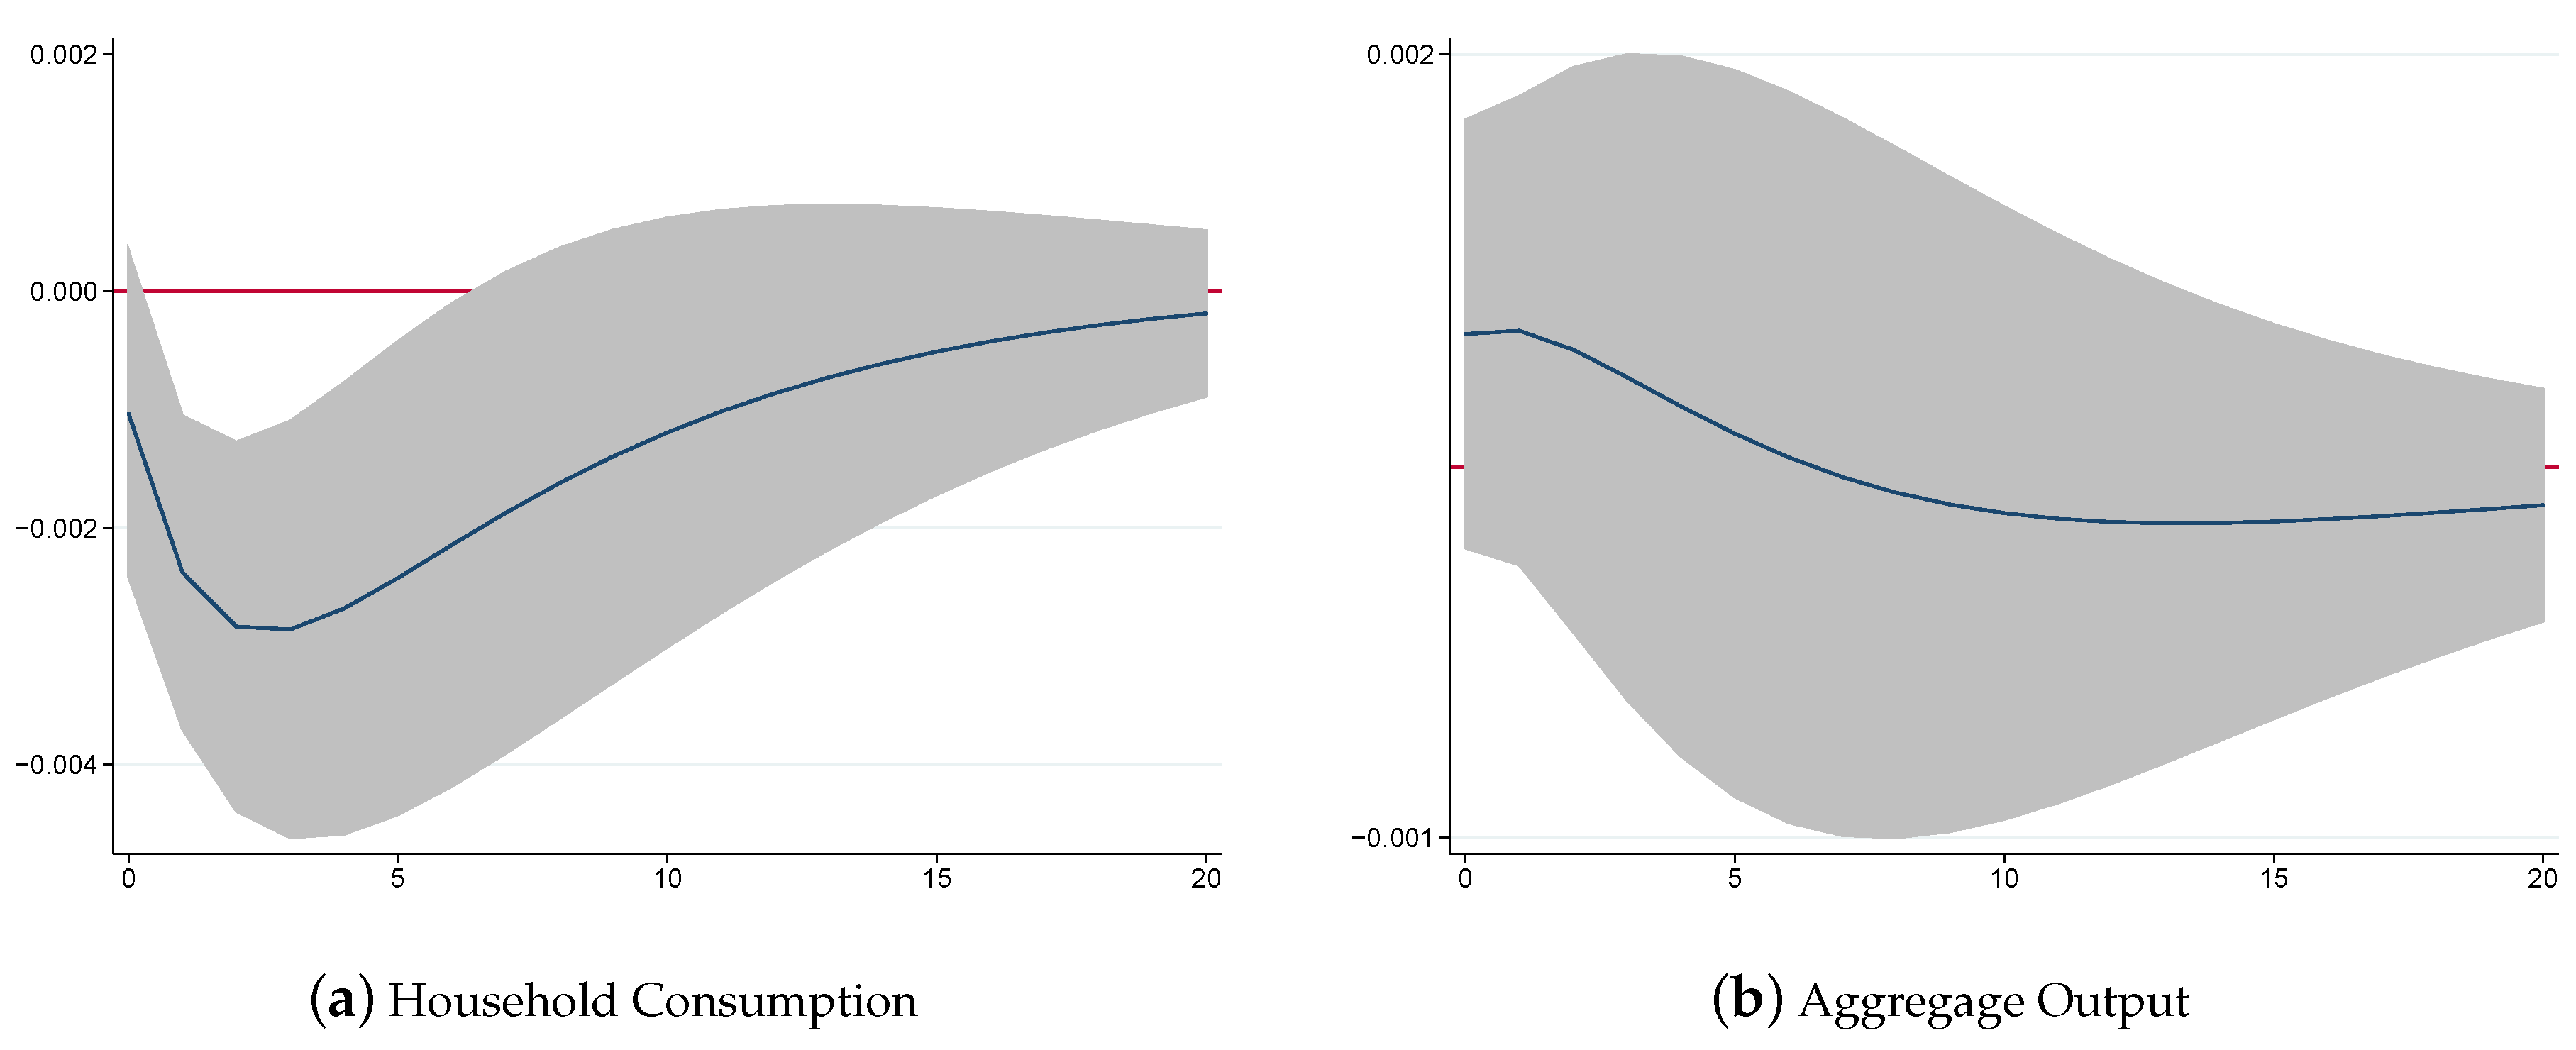
To settle this problem, we take a step further and develop a standard Vector-Autoregression (VAR) model, in order to explore the exact causal relationship between public infrastructure investment and economic condition. The dynamic impacts of an unexpected increase in PGE are reported in
Figure 3, in which the full sample is again 1995Q1∼2017Q4.
The results of the VAR model are lucid. When the economy is hit by a positive PGE shock, household consumption receives an apparent crowd-out impact and continues to drop under the aggressive expansion of public productive investment for a long time. The logic is intuitive: vigorous movements in construction programs signify clear policy orientation and lead individuals to form a natural expectation to earn appreciable profit by cutting down expenses and putting money into real estate and emerging companies.
The dynamic evolution of aggregate output is, once again, not explicit enough, in view of the fairly thick confidence interval denoted by the grey areas in
Figure 3b. At the very start, economic productivity gets an immediate promotion and lasts for some periods. This expansionary impact is interpretable and satisfies the strong desire for pursuing aggressive growth and development. In accordance with the national priority of boosting economic growth above the annual GDP target, the Chinese government has established complete and systemic strategic development plans to throw into heavy industries and long-term construction for productive purposes.
As a whole, the VAR evidence demonstrates a dual role of a temporary PGE shock: it restrains private consumption of the current age, as well as accelerates potential GDP growth.
Even so, a couple of pending issues are still up in the air because of the lacking data: Does this investment-driven economy bring forth the hidden peril of excess capacity in the industrial sector? Extensively praised for the remarkable “China miracle” of seemingly sustained eminent growth, what on Earth is the general public benefit from the well-intended public spending on manufacturing industries? A comprehensive general equilibrium model is called for systematically exploring the overall macroeconomic effects of the active policy on public infrastructure, especially the effects on overcapacity, which is closely bound up with long-term social and economic development and the living standard of domestic residents, which unfortunately failed to be explained by the empirical analysis before.
5. Results
On the basis of this constructed model, we can finally evaluate concretely the systematic and structured influence of long-term infrastructure projects over the entire dynamic economy, especially on excess productive capacity.
5.1. Calibration
In order to investigate the internal transmission channel of PGE to household consumption, economic output, and remnant inventory, we calibrate our model parameters in
Table 2 according to the conventional new Keynesian DSGE model, while keeping up with the actual characteristics of China’s economy.
The time-discounting factor is set at
, which helps to determine the steady-state rate of return to capital
with the rate of quarterly depreciation
. On the production side, the share of capital input is calibrated at a general level of
. The monopoly markup in steady state
follows [
43]. For labor supply, the intertemporal elasticity of substitution
is consistent with [
44], which enables us to pin down the relative preference for consuming goods or leisure at
. The Calvo contract non-resetting parameter for price stickiness is
. A typical eight-hour workday is applied to the labor market, which implies the steady-state average individual’s hours
.
In line with the empirical evidence presented in
Section 3, we used the same dataset over the period 1995Q1∼2017Q4 and obtained the consumption-output ratio
, the proportion of productive expenses in government budget expenditure
, and the steady-state value of quarterly CPI inflation
. The rest of the steady-state values for solving the steady-state equilibrium can be calculated using the expressions in
Section 4.5.
In the second part of
Table 2, as for the key parameter denoting the elasticity of PGE in the intermediate production function, we set the benchmark level as
, following [
45]. With regard to the policy instruments of the central government, we followed [
42] and let the Taylor rule coefficients be
,
,
, and
.
Finally, for exogenous shocks, the persistency of technology, PGE, and interest rate shocks are respectively , (benchmark level), and , generally following the existing literature about monetary policy in China. The standard deviation of shocks is: .
5.2. Model Dynamics
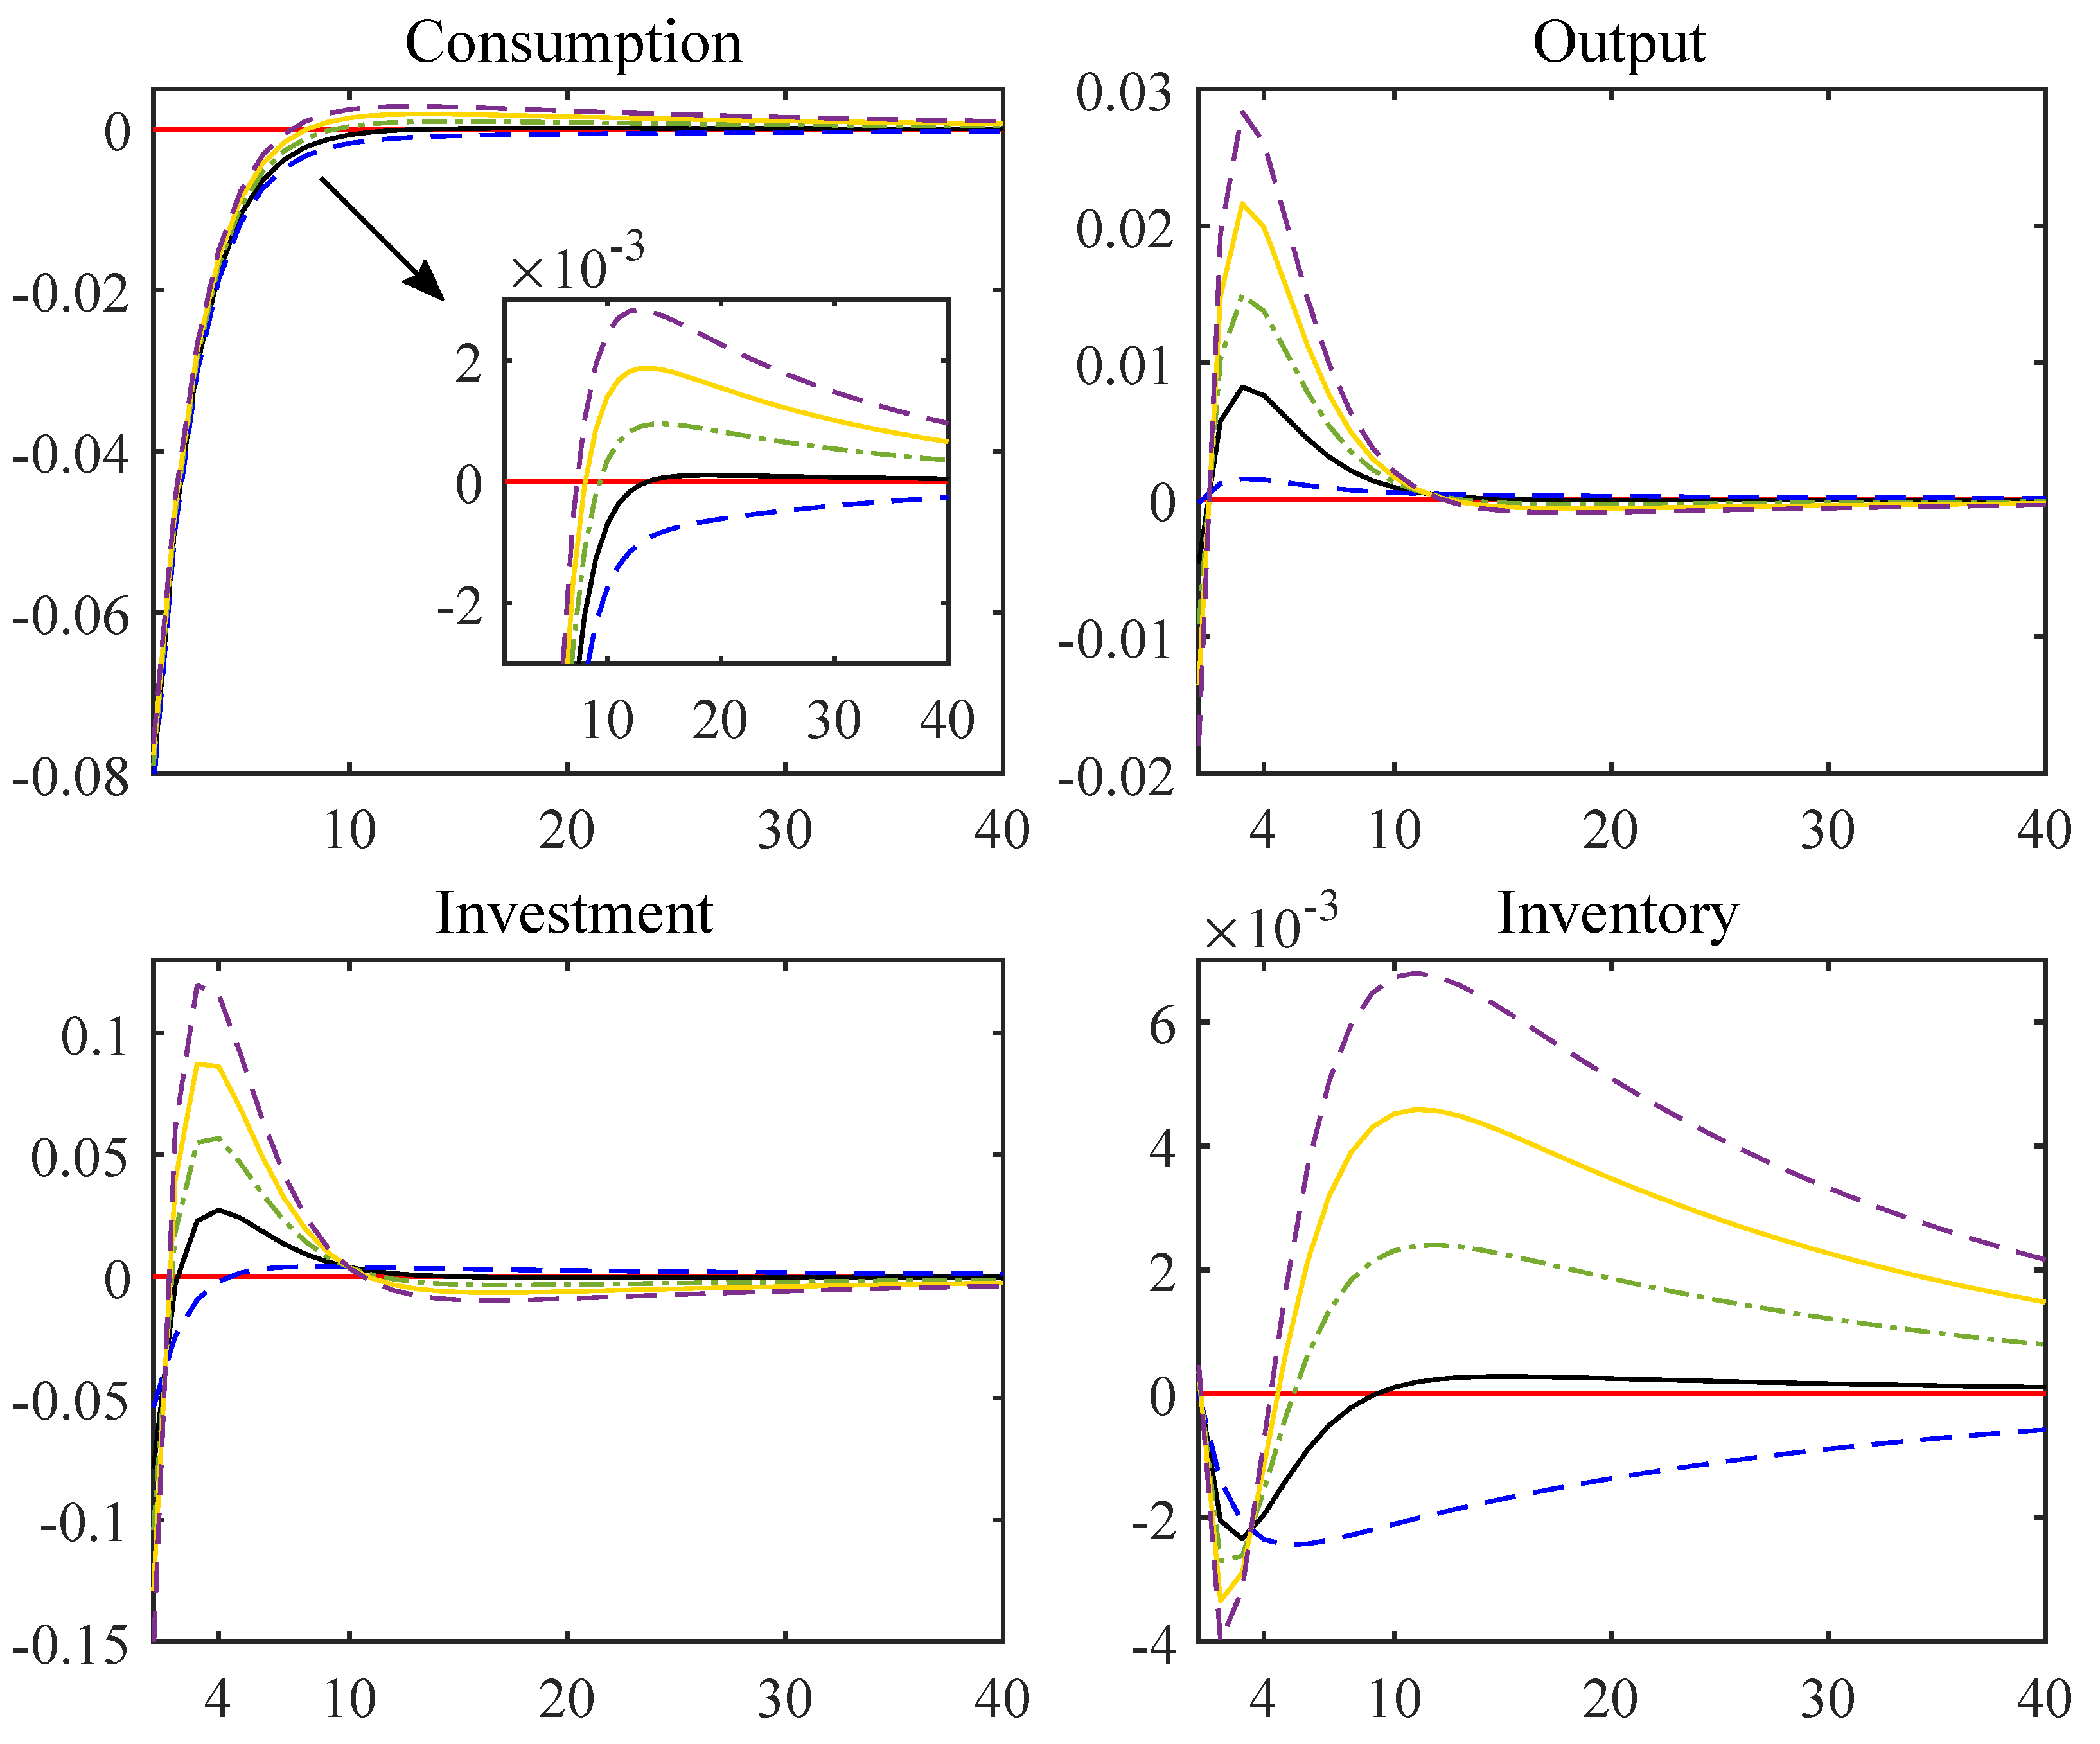
This section conducts impulse response analysis for the overall dynamic effects of an increased input on infrastructure development.
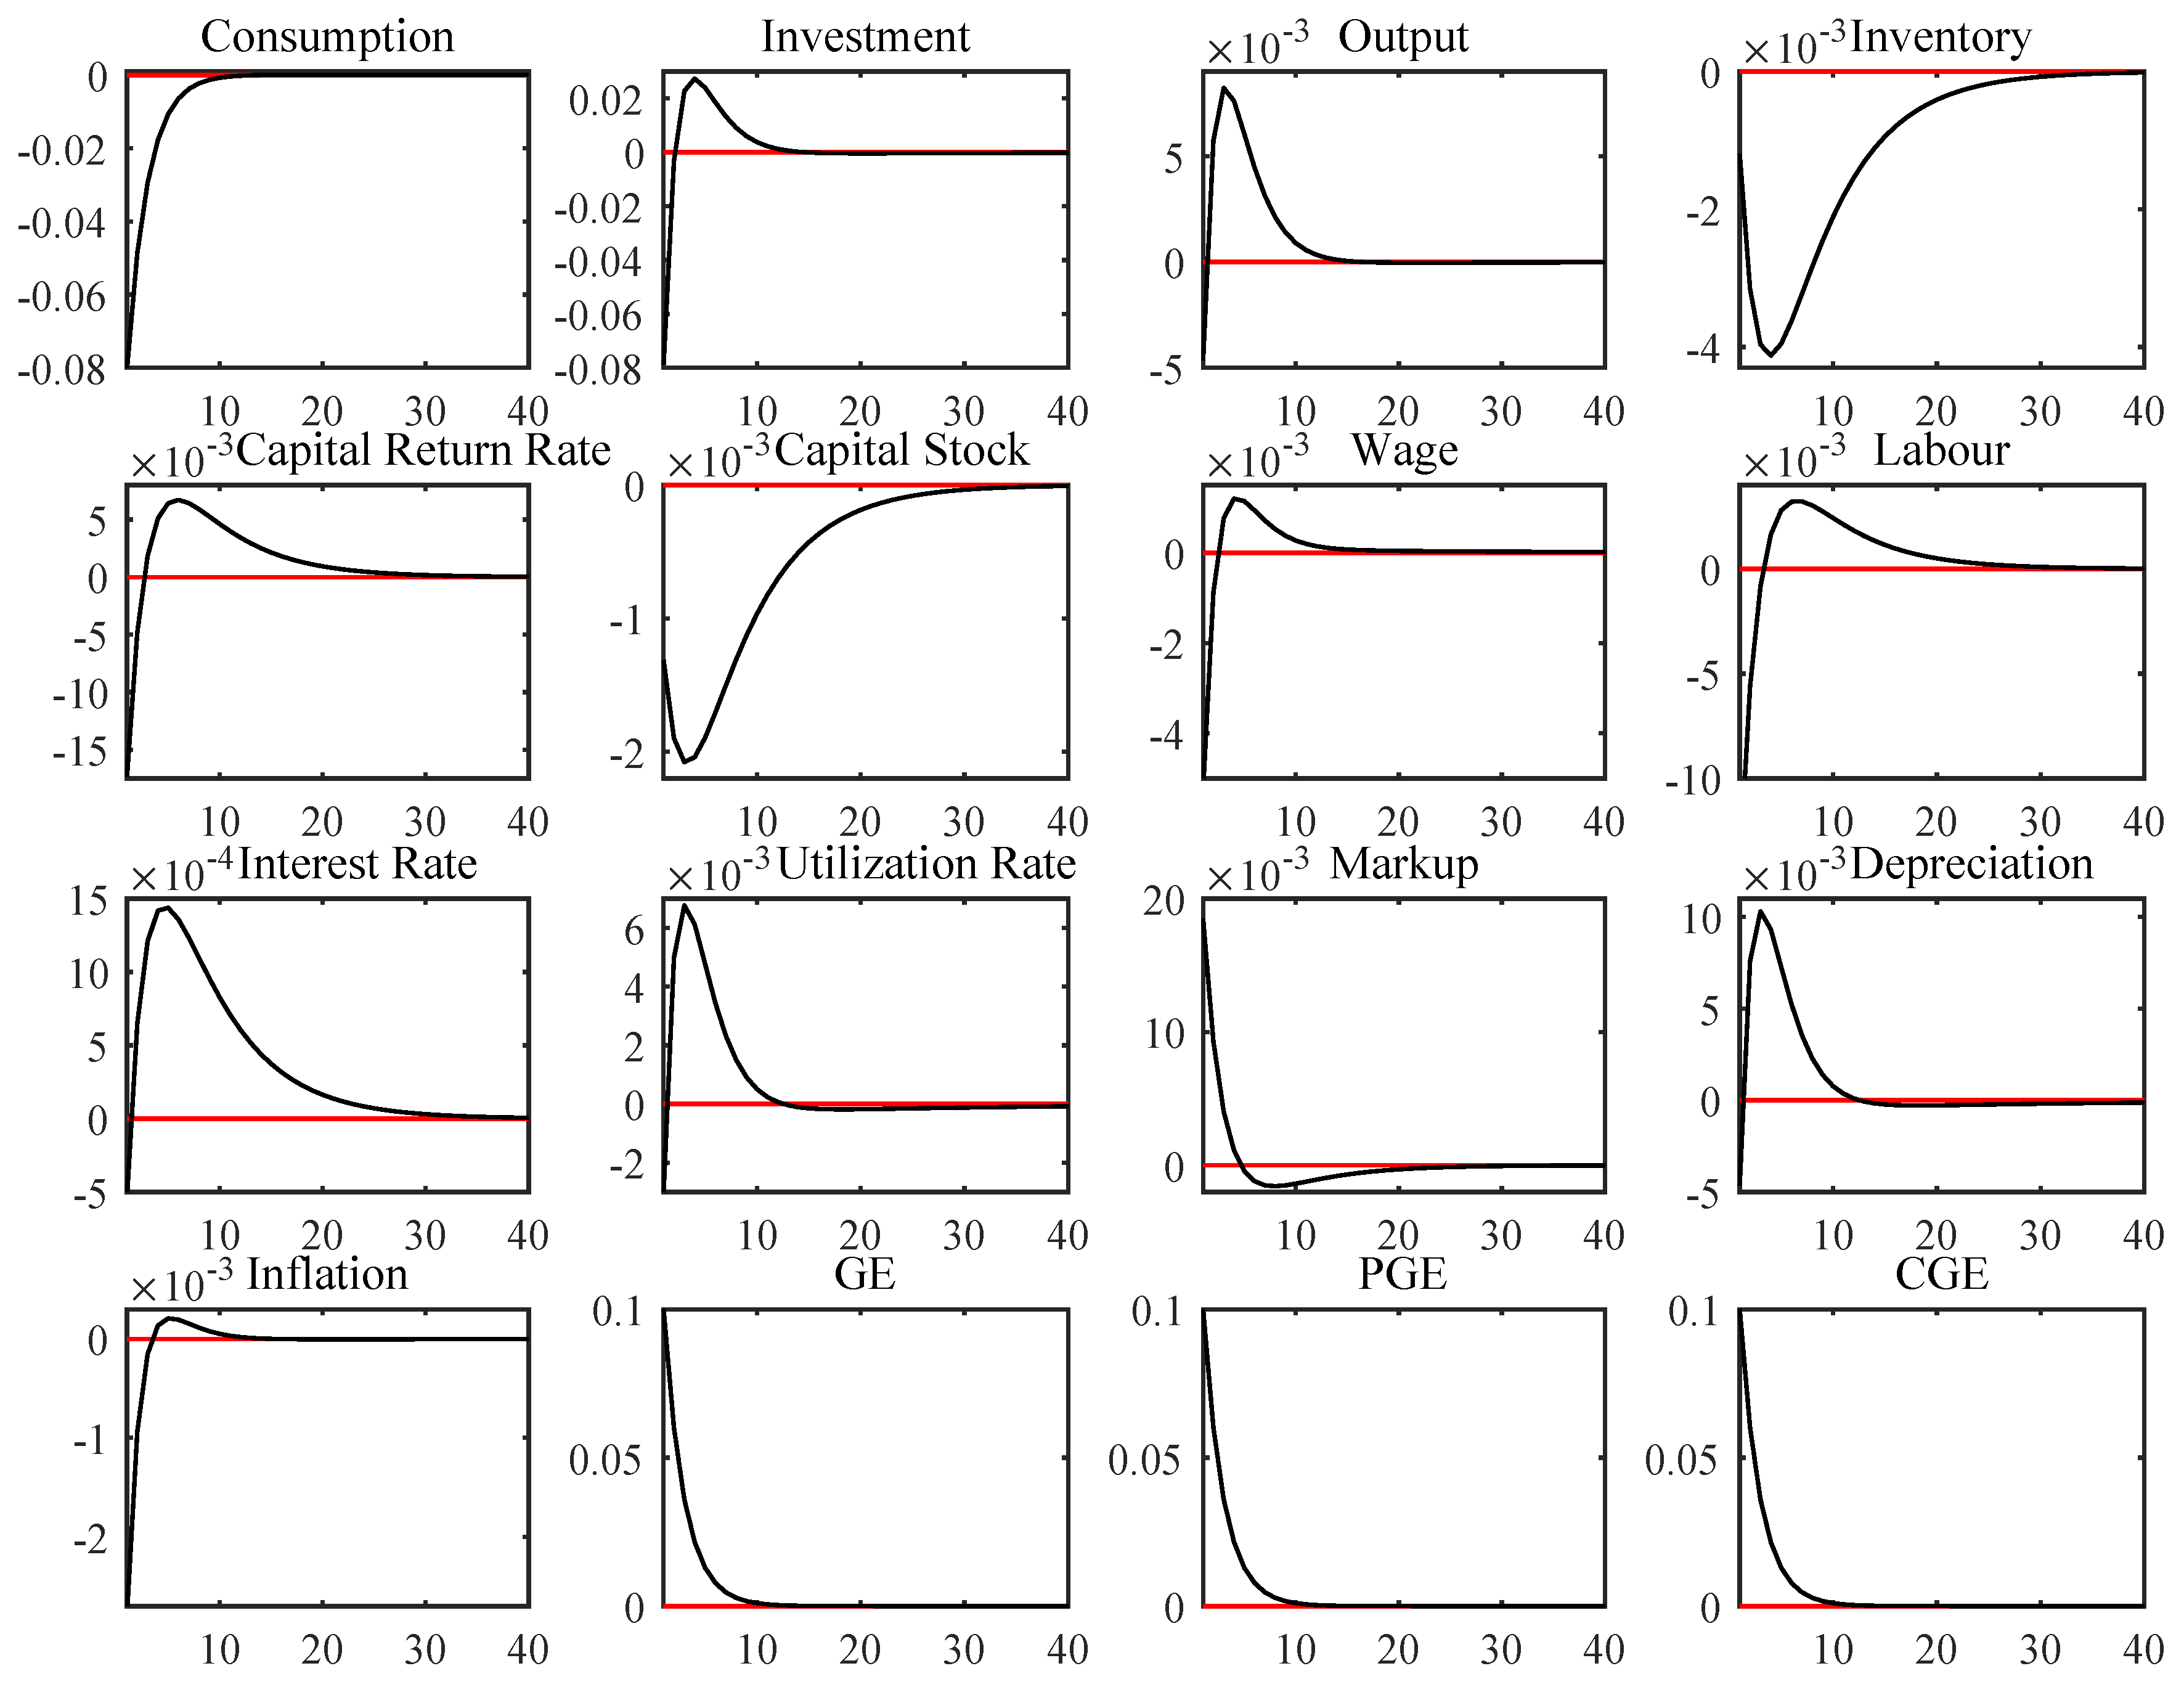
Figure 4 draws a big picture of economic impacts in the face of a standard PGE, which is quite indicative if we go through it row by row.
The first row in
Figure 4 gives an overall macro dynamics under the expansionary PGE shock. First, household consumption suffers a conspicuous and immediate drop, which lasts for some periods. In the similar pattern shown by the VAR model in
Section 3.2 and explained previously, a large scale of public support in manufacturing processes crowds out individual consumption, as well as private investment for speculative purposes. This suppressed tendency, however, by no means lasts long. The second impulse response swiftly jumps back before the fifth period, which implies rapid recovery in investor sentiment. Corresponding to that, output displays an optimistic outlook, and productivity improves. The variable of “inventory” here deserves serious discussion. Contrary to the speculations that government-backed manufacturing and construction are subject to the defects of redundancies and inefficiencies, excess capacity is actually well eliminated. The situation of industry overcapacity is turned around, displayed by the rapidly-diminished goods in stock.
The effects of primary factor inputs in production are presented in the second row. Corresponding to the alleviation of excess capacity, capital stock declines in the same trajectory as overcapacity, with its rate of return going up conversely (since capital stock in the conventional DSGE model is always a state variable lagging one period by default, the rate of return to capital gets a momentary drop when the shock comes). In the labor market, the transient drop of real wage is acceptable if we consider the career moves when intensive public infrastructure creates a large number of new vacancies, which elevates job mobility. After new employees are in position, their real wages are in effect quickly promoted, just like the closely-resembled trajectory of the impulse response of working hours.
The dynamic evolutions in the third row are rather sensible likewise. Inventory depletion by virtue of large-scale installations and constructions efficiently improves capital utilization rate, as well as speeds up the velocity of depreciation. The impact response of monopoly markup is thought-provoking. Repeatedly emphasized by sociologists, politicians, and economists, the heavy government investment in the productive process breeds a defect of exacerbated monopoly in state-owned enterprises. Thereby, price markup is immediately elevated when the shock hits. Yet, this condition is not sustained: after the installation and configuration of productive resources are accomplished, enhanced efficiency soon brings about a lower level of monopoly in intermediate goods’ production and a benign market environment.
In the last row, from the aspect of price movements, inflation drops at the very beginning due to the auxiliary contractionary monetary policy of raising market interest rates (as is revealed in the impulse response of interest rate in Column 1), yet soon springs back in a favorable investment climate, in concert with the second subgraph in the first row. Finally, provided that the government maintains the balance between productive and consumptive expenditure in its fiscal budget, every type of GE receives a standard positive impact from the exogenous PGE shock.
Overall, our numerical simulation results take a deep dive into the comprehensive macroeconomic effects of strengthened public infrastructure. Not only do they make a logical extension on stylized facts in
Section 3.1 and empirical evidence from the VAR model in
Section 3.2, but they also confirm that the new Keynesian DSGE model behaves well and develops a fine theoretical framework for investigating the macroeconomic effects in China. This thorough investigation on the general equilibrium system indicates that a conscious policy decision of actively promoting public investment especially in infrastructure for the purpose of stimulating economic growth seems to crowd out private consumption and generate the superficial appearance of the so-called “consumption downgrade” symbolized by the slowdown in retail sales, yet in essence enhances secular growth invisibly by alternative fiscal support. As a matter of fact, focusing sorely on the fast-moving consumer goods markets and claiming “consumption downgrade” are wholly implausible. If we consider consumers’ pursuit of high-quality lifestyle, as well as efficiently improved rates of capital return and utilization, a positive PGE shock virtually brings about the “economy upgrade”.
5.3. Sensitivity Analysis
As is manifested in
Section 5.2, despite creating the unfavorable situation in the consumer market instantly, a positive PGE shock implicitly brings about beneficial effects on sustained productivity progress and superior de-stocking performance. Strictly speaking, these results are in the first place based on our calibrated parameter of
and
drawn from the estimation of [
45]. Going a step further, what if the output elasticity of productive government spending
changes (which means
carries a stronger/weaker weight in production function (
4)) or the policy persistence of public infrastructure investment
changes (longer/shorter duration for which the policy remains in force): will the remarkable policy achievements on output and overcapacity fail to accomplish their goals? Which direction will the economic activities evolve towards? What then are the interactions of every macro indicator? To address these questions, we conduct the following sensitivity analyses as an extension of our benchmark model, trying to probe in what way could parallel emerging countries strive for the successful outcomes China has achieved.
Table 3 summarizes the results of the three types of sensitivity analyzes, and
Section 5.3.1,
Section 5.3.2 and
Section 5.3.3 demonstrate the details.
5.3.1. Output Elasticity of PGE
Figure 5 exhibits the macroeconomic characteristics with the change of PGE weight. We extract the most representative indicators (consumption, output, investment, and inventory) from
Figure 4, since all dynamic trajectories of the rest of the variables can be categorized into impulse responses of these four.
The first three key macroeconomic indicators reflect the broad economic climate. It is conceivable that output and investment are boosted when increases, and even household consumption presents a subtle recovery. The dynamic movements of existing inventory, nevertheless, reveals crucial information. Under the current PGE weight in production function calibrated for China, we have observed an evident depletion in inventory representing greater efficiency in capital utilization and conversion. As goes higher, although it still achieves a lower level of inventory accumulation, in the longer term of economic development, potential overproduction eventually comes to the surface, raising the issue of excess productive capacity.
5.3.2. Persistency of PGE
The results displayed in
Figure 6 are more straightforward. As expected, the rise of
prolongs the duration and extends the scope of policy impacts brought forth by persistent PGE shock. In addition, a more persistent policy support generates a deep and profound influence upon the capital accumulation process, in which production resources are more quickly used in the firstten periods, yet easily stacked in later periods.
5.3.3. Supplementary Measures of the People’s Bank of China
Another meaningful issue worth exploring is the not yet completed market-oriented interest rate reform. With the wake of the developing financial system and liberalizing interest rate, the PBoC has become fully conscious of the instability and weaker power of money velocity and decided to conduct the gradual transition to price-based monetary policy. In the past, China was used to maximizing its limited resources through a centralized structure. Then, in the progressively market-oriented Chinese market, when the PBoC lays more emphasis on the interest rate tool and makes it react to the economy climate more flexibly, is the above macroeconomic effects of a positive PGE shock of great difference?
Here,
Figure 7 reports the macroeconomic impacts when the monetary authority changes official interest rates slightly/strongly in response to the economic situation. Analogous to the alteration in
Section 5.3.2, albeit at a moderate scale, the general economic atmosphere receives a bigger impact when the degree of marketization increases and the PBoC lets interest rates respond more freely. A more sensitive monetary policy rule (higher
) generates a more frictionless business environment, paving the way for a sustained and potent investment for production. It should not be neglected that a less flexible interest rate rule generates the consequences of considerable overcapacity on the production side, which calls for a more free and frictionless business environment, for the sake of maximizing resource utilization and raising efficiency.
To sum up, the sensitivity analyses of the facet of PGE’s productive weight, shock persistency, and monetary policy rule give much information: our preliminary result that generous public infrastructure input in China inhibits consumption and expedites productivity remains robust under the change of the above three conditions. The perpetual business development benefits from the active initiatives of government. The intricate impact on internal productive capacity is divergent given different parameter values. A healthy and not a backlash inventory depletion requires lower weight in production function , shorter policy duration , and a more market-driven interest rate rule .
6. Conclusions and Policy Implications
Despite firmly retaining its position as the top contributor to world GDP growth, unfortunately China has not achieved its goal of “prosperity-for-all” thus far, in the presence of the major obstacle of enormous population and marked wealth disparity. With an eye toward reducing poverty and building an advanced and affluent society, China has been dedicated to promoting public facilities and services with great effort.
The merits of mature and reliable public infrastructure are too numerous to enumerate: For instance, a modern and smart transportation system reduces auto use and alleviates a great deal of air pollution. The world’s largest hydroelectric dam helps China to meet its energy demand without depleting non-renewable resources. Successful clean water and sanitization projects effectively extend the average life expectancy of the entire society and raise the overall level of residents’ health. In other words, from a developing perspective, public infrastructure is indeed of vital significance to emerging countries, creating appreciable positive externalities especially for those that hold tremendous production potential.
The outstanding policy performance, of course, has a dual character. We should never take convenience and premium services for granted, and thoroughly pondering the profound and far-reaching influence of government infrastructure investment deserves to be carried out.
In this paper, we first characterize China’s stylized facts for the past two decades utilizing the latest time series data of the Chinese macro economy, collect empirical evidence, and build a standard VAR model so as to explore the impact of a positive PGE shock on household consumption and aggregate output. From the VAR model, we come up with the primary results that PGE crowds out private consumption and benefits economic productivity. For the purpose of thoroughly investigating the internal mechanism of how government infrastructure expenditure affects household consumption, economic productivity, and general capacity utilization in a dynamic interactive system, we develop a new Keynesian DSGE model and incorporate public infrastructure investment as a kind of PGE into the production function of intermediate firms. Model equilibrium gives the deterministic steady state, in which values are assigned to corresponding calibrated parameters. Subsequent numerical results enable us to evaluate the applicability of the simulated model, with which we explore further analysis on the profound influence from the heavy investment in the facilities and services fundamental for domestic economic operation.
6.1. Policy Implications
Based on the above-mentioned results, we draw corresponding policy implications of strengthening infrastructure construction.
First and foremost, the generally supposed “consumption downgrade” is by no means a groundless conjecture. Not only does the empirical evidence (either the simple correlation analysis or standard VAR model) show that much emphasis on public infrastructure reduces household consumption, but our carefully-designed theoretical framework demonstrates that a manufacturing-oriented policy shift indeed produces an inhibitory effect on residential expenditure. As a vital weather vane of market demand and social production, this indicator ought to be taken seriously by the government and especially its authorized spokesman. Given its direct and indirect influence on domestic sentiments of consumers, investors, as well as entrepreneurs through the macroeconomic mechanism, the relevant authority is obliged to truthfully and publicly announce the inevitable outcome of slumped consumption level and more essentially clarify the necessity and desirability of its specific policy design: the unexposed policy outcome of long-term benefited productivity and economic growth is a proven fact, not to mention the effectively utilized productive capacity in China’s case. Only in this way could the administrative accountability system operate with a long-term effective mechanism.
Our second implication is a logical extension of the underlined argument in the first implication and is also the direction of endeavor for the government exerting efforts to apply PGE policy extensively, efficiently, and successfully. As is manifested by the extended sensitive analysis on benchmark impulse response results, booming industrial and infrastructure development has disparate impacts on inventory in the economy, allowing for the movement of PGE weight in the production function, shock persistency, or monetary policy rule. When we turn our eyes toward the details of the manufacturing process, a worrying development during industry upgrading is the excess capacity of productive factor input. Large-scale installation and construction accumulate a huge amount of capital stock, with the underlying propensity to lead to a waste of resources, environmental deterioration, and an ecologically-unsustainable economy. A sensible government shall always accurately assess the characteristics of its own economy, prudently conceive of corresponding plans, and keep an appropriate balance between economic development and excess productive capacity. For example, the administrative institution might need to control the PGE policy to be prompt and potent, but not sluggish or sloppy. Besides, an auxiliary support of an unrestricted and flexible market environment is worth trying. Our paper points out the crucial requisite for how promoting public infrastructure in effect expedites the production process and depletes inventories in quantity. The tricky issue of excess capacity could be well addressed by this active policy initiative, under the detailed conditions in our research results above.
Building upon the former two arguments, our research helps decision makers endow PGE action a greater appearance of legitimacy. When households finally apprehend that their ultimate well-being is not impaired, but improved and, more importantly, they need not weigh and consider tradeoff between instant and future living conditions, the sensational “consumption downgrade” will be correctly deciphered. As a matter of fact, the cooled enthusiasm of fast-moving consumer goods is an implicit sign for the general pursuit of a high-quality lifestyle, reflected by the consumer preferences of spending more on culture accumulation, entertainment activities, sports, and travel. Dispelling the public misunderstanding of “consumption downgrade” is of vital significance to improve administrative efficiency, prevent panic spread, stabilize market sentiment, and advance a steady economic development.
6.2. Limitations and Future Research
Admittedly, there are of course certain limitations in this work. First, the shortage of applicable data in the VAR model is an inevitable deficiency of current work. Therefore, it would be very ideal if future empirical research could make up for it and carry out a perfect and flawless econometric analysis. For an applicable dataset with more information about government activities, we can estimate the dynamic effect of Productive Government Expenditure (PGE) and the magnitude of the crowd out effect on household consumption based on the structural VAR model and time-varying structural VAR model. Second, the policy specification of our present model is still confined to a simplified monetary rule, since this paper mainly emphasizes the discussion about the fiscal policy effect of Productive Government Expenditure (PGE). A pretty interesting research direction is to adopt a modified Taylor rule following [
46] in a more elaborate way. For China’s special institutional background, a monetary rule taking into consideration both the nominal interest rate and money supply will enhance the persuasive power of the theoretical framework, under the premise of an effective and feasible model solution.
Last, but not least, from the concern about more flexible, but fragile financial markets in China thanks to the bulky shadow banking system, it is quite crucial to add the internal transmission mechanism from nominal interest rates to asset price bubbles to future work. Currently, the present model still deems market interest rates to be simply set by the central bank, which is succinct and fits the facts. Nevertheless, if we elaborate an integral and essential sector of financial intermediaries in our generalized equilibrium model, the whole narration may be organized more comprehensively and be more well-grounded.


