Article

A Tour-Based Mode Choice Model for Commuters in Indonesia

by
Faza Fawzan Bastarianto
1,2,
Muhammad Zudhy Irawan
1,*,
Charisma Choudhury
2,
David Palma
2 and
Imam Muthohar
1
1
Department of Civil and Environmental Engineering Universitas Gadjah Mada, Jln. Grafika No.2 Bulaksumur, 55281 Yogyakarta, Indonesia
2
Institute for Transport Studies University of Leeds, 34-40 University Road, Leeds LS2 9JT, UK
*
Author to whom correspondence should be addressed.
Sustainability 2019, 11(3), 788; https://doi.org/10.3390/su11030788
Submission received: 19 December 2018 / Revised: 28 January 2019 / Accepted: 30 January 2019 / Published: 2 February 2019
(This article belongs to the Section Sustainable Transportation)

Abstract

:
With the advent of activity-based modelling, transport planners’ focus has shifted from isolated trips to tours. Tours are series of interconnected trips that start and finish at home. There are different types of tours; we focus on two: hwh (start at home; go to work; and then go back home) and hw+wh (where + represents a non-work activity). Tour types introduce a new dimension to the traditional problem of travel mode choice, as the mode choice might be influenced by the type of tour. This study attempts to measure and compare the relationship between tour type and mode choice using three different modelling approaches: Multinomial Logit (MNL); Nested Logit (NL) and Cross-Nested Logit (CNL). We compare each approach using secondary data from a larger survey: 24-h daily activity patterns of 420 commuters between Bekasi and Jakarta; one of the busiest commuting routes in Indonesia. Among other results, we found that gender and income significantly influence commuter’s choice of mode and that reducing travel time and cost can increase the ridership of public transport. Furthermore, the NL and CNL models showed significant improvement over the simpler MNL when grouping the alternatives based on tour types. This points to a significant influence of the tour type on the mode choice. Policy recommendations to increase traveler’s wellbeing are also formulated.

1. Introduction

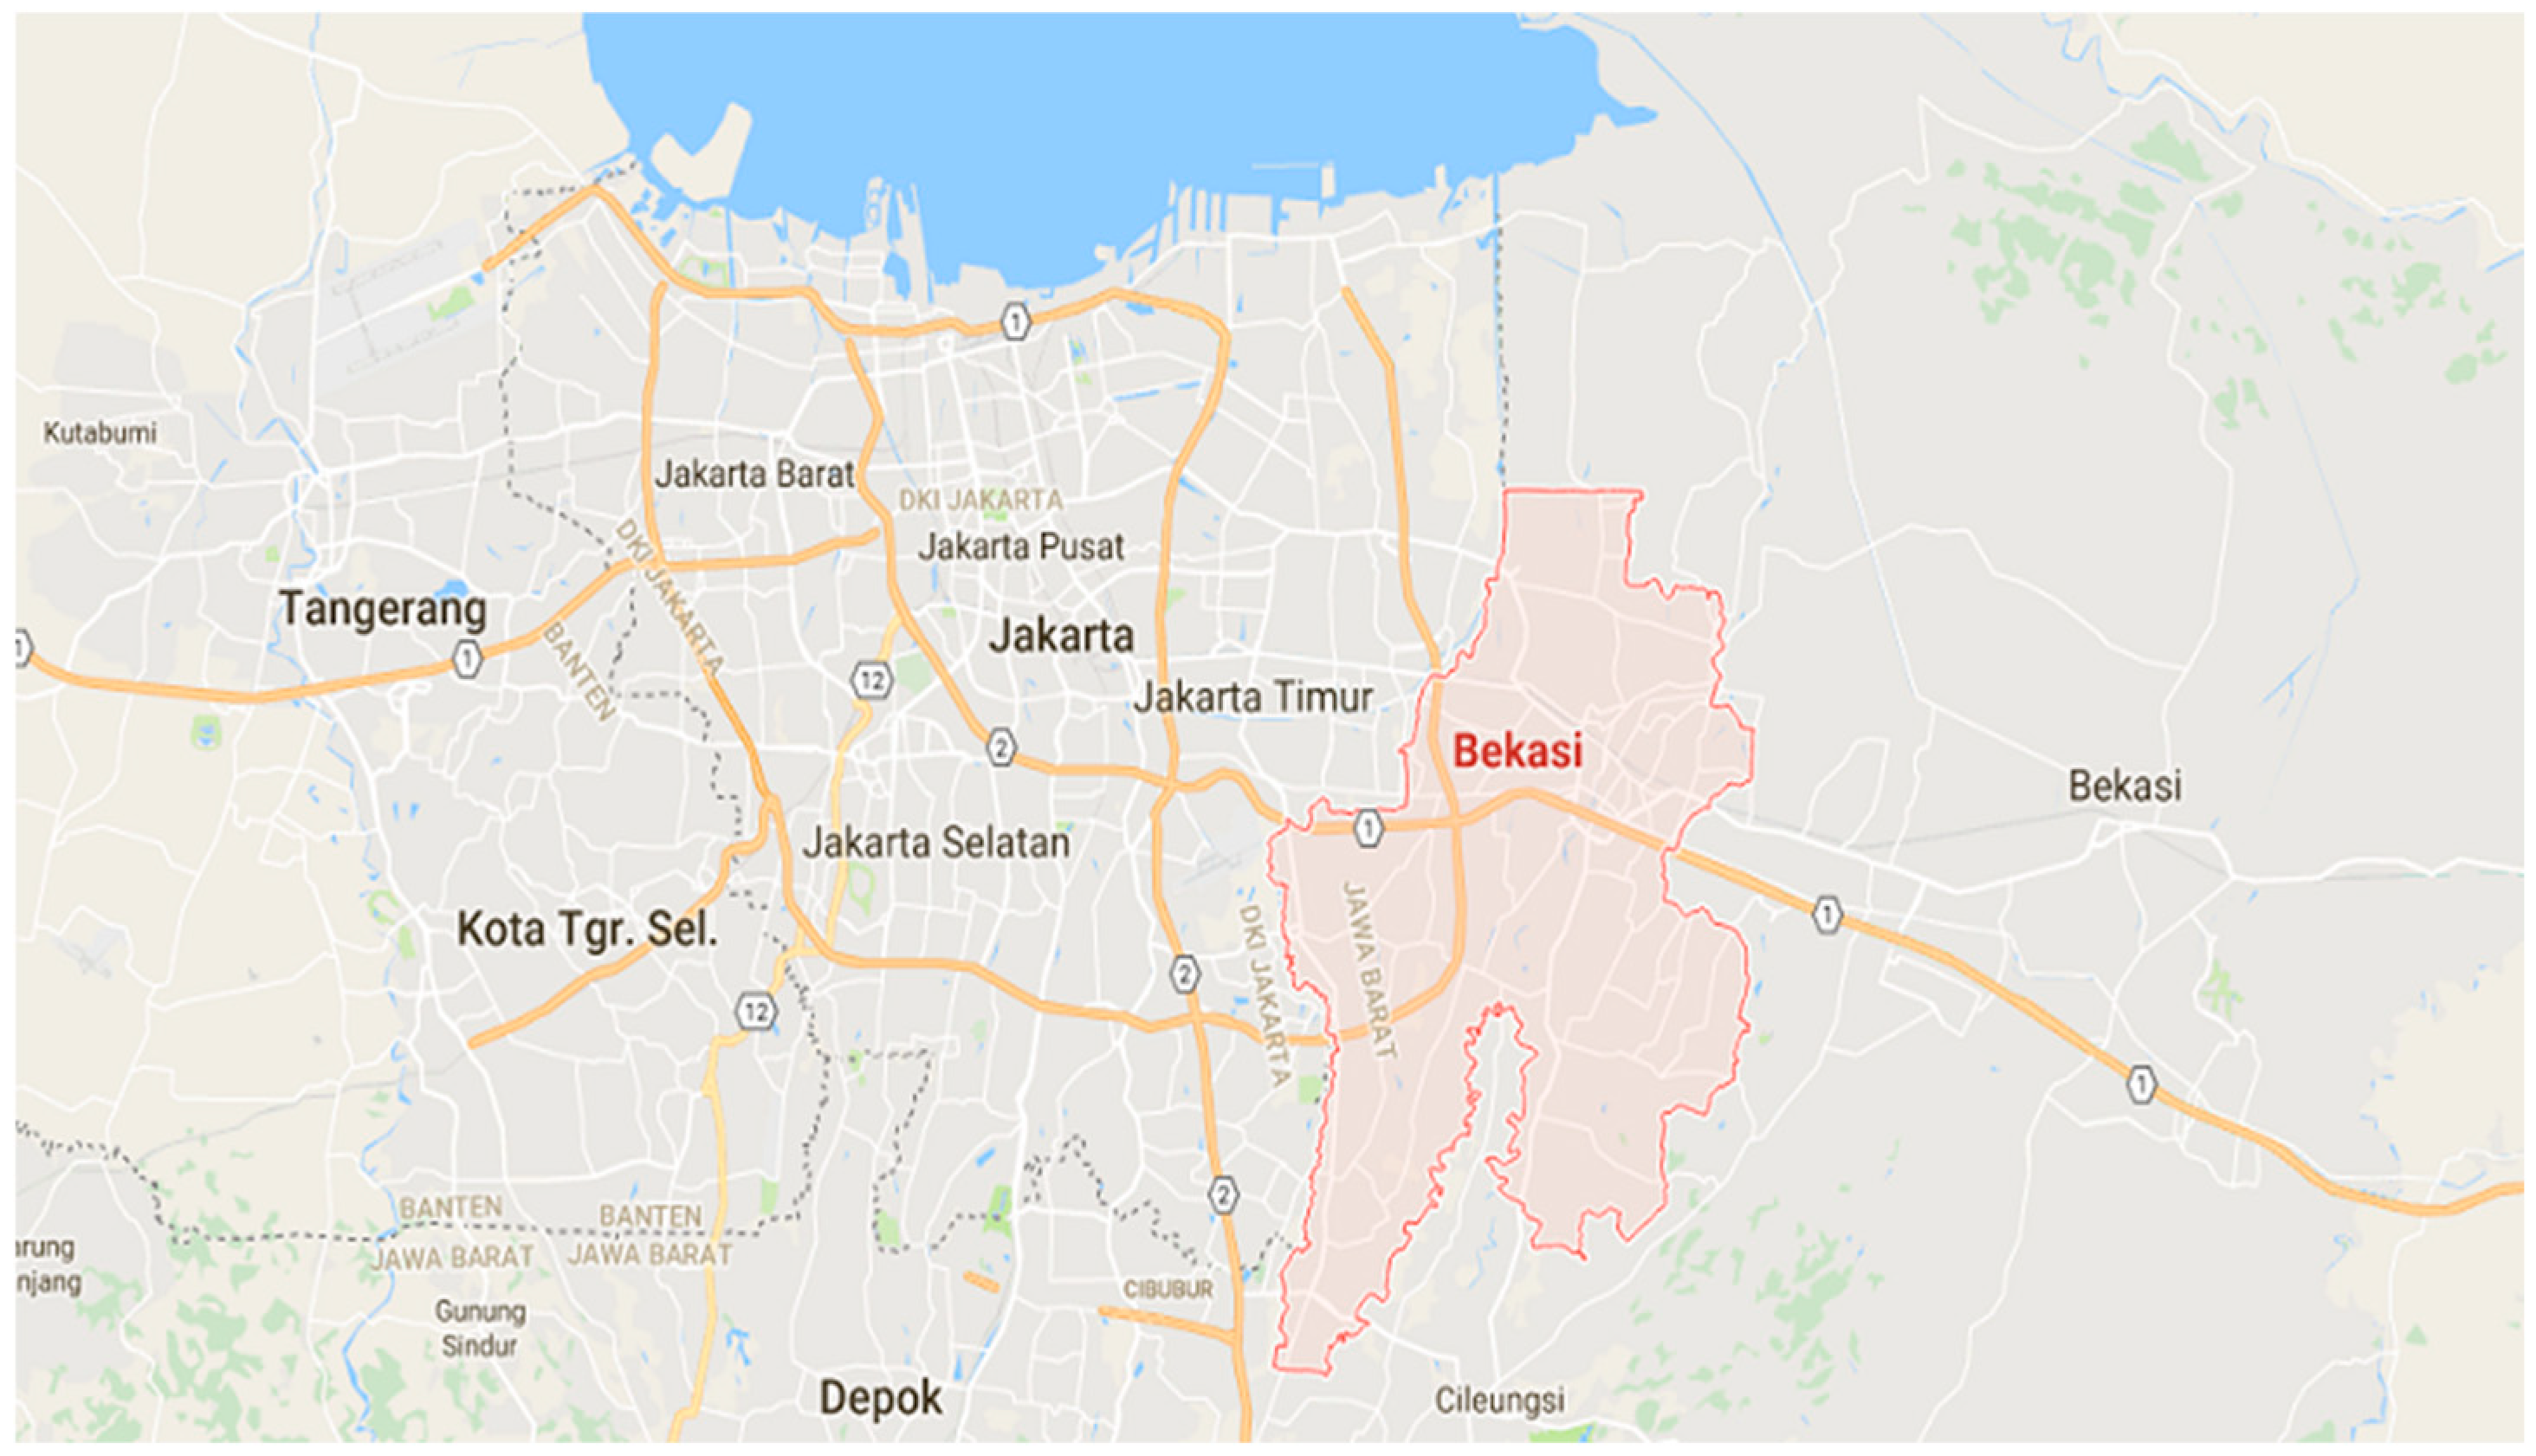
As the capital city of Indonesia, Jakarta is a big attraction to the cities surrounding it, such as Bogor, Depok, Tangerang, and Bekasi. Thus it generates trips which are growing every year due to increasing urbanization. Bekasi, which is a city located on the east side of Jakarta, contributes the largest number of commuters to Jakarta consisting of about 14.8% [1]. This number consists of 204,240 commuters who use different modes for their trips, such as private car, motorcycle, bus, commuter line (hereafter: KRL), minibus, online taxi, etc. As many commuters travel to Jakarta from Bekasi, there are some problems between these two cities, such as severe traffic congestion and lack of high quality public transport serving the two cities. Therefore, there is a need for robust mode choice models to investigate the behavior of commuters between these two cities.
Review of related literature shows that the mode choice decisions are affected not only by the level-of-service of the modes (e.g., travel time, cost, etc.), but also the purpose and nature (e.g., number of stops, trip-chain pattern, etc.) [2]. As a result, tour-based mode choice analysis have been conducted in developed countries up to today. Examples include the European national models in countries such as The Netherlands [3], Sweden [4,5], and Denmark [6], or US cities such as San Francisco [7,8], Boston [9], and Portland [10]. However, there are fewer studies of travel behaviour specifically in tour-based mode choice in developing countries [11]. The reason for this might be related to a lack of data relating to either surveys of household travel or traffic pattern and other resource limitations.
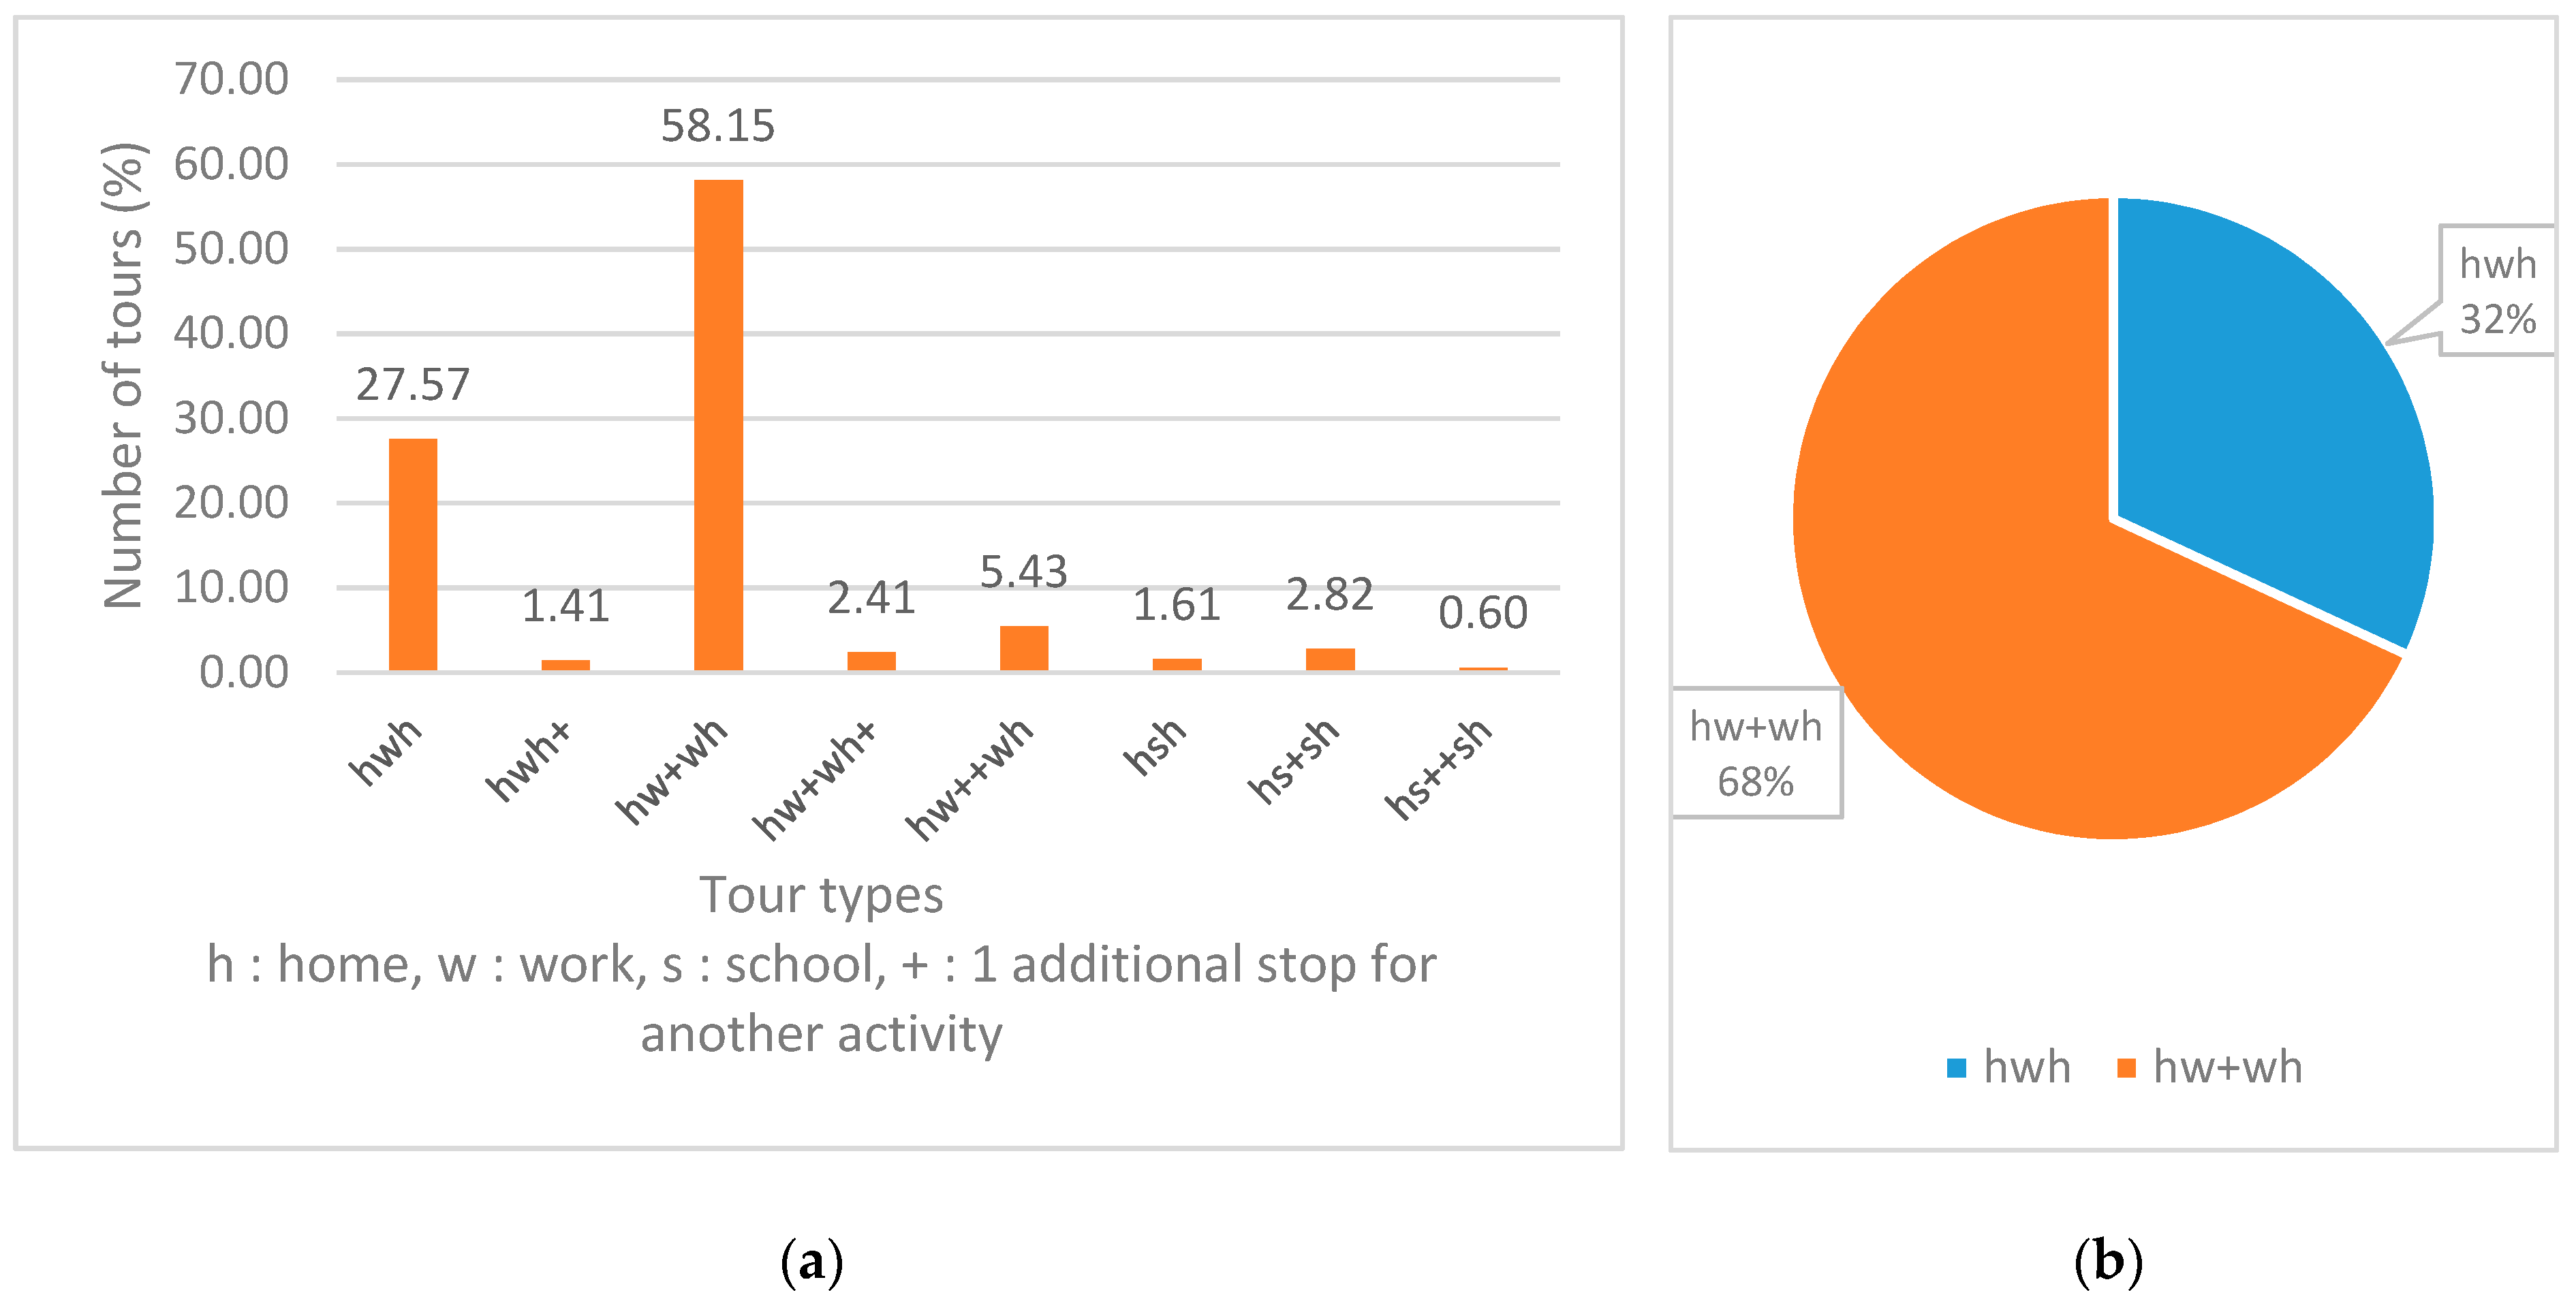
The tours themselves have many variations such as hwh, hwh+, hw+wh, hw+wh+, hw++wh, hsh, hs+sh, hs++sh. Description of these kinds of tour types are for the tour types that have “w” and “s” representing tour type including at least one work (w) activity and one school (s) activity, respectively. The symbol (+)represents that the tour includes one additional stop for another activity [9], and the symbol “h” represents home. Understanding the relationship between tour types and modes is vital for sustainable planning and policy strategies aimed at private vehicles reduction and public transport promotion. Thus, the tour-based mode choice of the commuters specifically in a developing country will be the emphasis of this study.
Concerning methodology and model structure, to date, many studies have used the multinomial logit (MNL), nested logit (NL), and cross-nested logit (CNL) models. The MNL model is a traditional logit model, which is widely used in transport research due to its simplicity and reliability. The NL model is an extension of the MNL model, where the choices can be structured in different levels and nests, each nest grouping correlated alternatives, in such a way that each alternative can only belong to one nest. Finally, the CNL model is a generalization of the NL model, allowing alternatives to belong to more than one nest [12]. Hess et al. [13] point out that the CNL model can capture more correlation patterns of alternatives rather than a three-level NL structure, in a multi-dimensional choice process. However, there is an absence of studies comparing different logit model structures specifically in developing countries.
Therefore, the main aim of this investigation is to develop logit model structures of tour-based mode choice model for commuters in developing countries, specifically from Bekasi to Jakarta. The study focuses on analysing the relationship between the tour types and mode choice of the commuters, and investigating the attributes that influence the commuters on choosing their mode and tour type. The mode choice will be based on characteristics of the respondents. This study will also explore different logit model structures between simple choice model or MNL, NL, and advanced choice model or CNL to see which structure best estimates the relationship between the tour types and mode choice. Also, the results of this study could be analysed further to formulate policy recommendation to improve the trip quality of the commuters from Bekasi to Jakarta.

2. Literature Review

2.1. Tour-Based Model

The tour-based modelling approach assumes a trip chain as the basic decision unit for an individual. Trip chains start at an individuals’ home, take them to one or more activity locations, and finish at the starting point [9]. The tour-based model approach can be used to develop more complex disaggregate choice modelling, such as activity-based model and tour-based mode choice model. This study, however, uses a tour-based mode choice model for analysing the data. The tour-based mode choice model can give us a better understanding of the relationship of individual decision to travel in daily activity with a particular mode used [14]. Some factors influence individuals’ travel mode choice, such as built environment factors, socio-economic factors, attitudinal factors, and trip chain [15].
In terms of modelling a large class of models with the set of alternatives which can be partitioned into subsets, a NL specification is a common model structure used especially for tour-based mode choice since it can effectively model multidimensional choice processes in a natural hierarchy [9], unlike other discrete choice models. Since this model has two-levels of modelling; the marginal probabilities (upper model) and the conditional probabilities (lower models), which subsequently will be incorporated into a nest [12]. In the case of the tour-based mode choice model, the upper levels are the tour type and the lower levels are travel modes used.
The studies undertaken by Ho and Mulley [16] used two-levels NL model to investigate the tour-based mode choice of joint household travel patterns in Sydney. Their model structure is divided into joint travel patterns in the upper level and travel modes in the lower level. The upper level represents an individual’s choice of joint travel activity amongst household members while the lower level exhibits an individual’s choice of main travel mode between public transport, car, and walking. By separating alternatives into two levels, this model has allowed each household member to choose the main travel mode to maximise their personal utility on their choice of joint travel patterns. The results of the model show that higher joint household travel in the weekend days is directed toward recreational and maintenance trips by using public transport. Meanwhile, in contrast, weekday travel is more oriented to work, and education trips by either individuals or shared rides are dominated by the car mode.
Another study of modelling approach conducted by Miller et al. [14] gives a comprehensive explanation of tour-based mode choice. The tour-based mode choice model in its study is modelled by determining the travel mode for each trip on an individual’s home-based tour which consists of a set of trip chains from home to one or more destinations including a non-homebased tour. The non-home-based tour consists of the trips that start from a particular place, such as workplace, school, market, etc., and end at the same place. A conceptual model of its approach is to integrate the tour level and travel mode level in a single tour. The results of the model show a good fit of the model with over 89% of observed modes being chosen on average. The predicted mode shares are very closely matched with observed mode shares. This is different with conventional logit model where predicted, and observed mode shares are forced to be relatively matched by using some selection of alternative-specific parameter values.
Furthermore, there is a vast amount of literature examining tour-based mode choice using simple choice models such as NL and MNL, but it is a challenge to find relevant literature about modelling tour-based mode choice using advanced mode choice model. Thus, it is essential to develop the tour-based mode choice model using advanced mode choice, such as using CNL, since this model is believed to have more significant results than the other three kinds of NL models [17].

2.2. Travel Behavior Studies in Jakarta, Indonesia

Several studies about travel behaviour in Jakarta and developing countries have been undertaken by researchers in recent years. These studies are critical for stakeholders to determine the outcomes of policies before implementing them. Even though conducting these studies is essential, there are few studies of tour-based mode choice in developing countries. Most of the studies that have been undertaken focus on mode choice [18,19,20,21], travel behaviour [22,23,24], and activity-travel patterns [25,26]. While their results are useful to inform policy, they tend to ignore the influence of tour type on mode choice or focus on time of use more than travel behavior.
However, there are several studies which have been done mainly in Jakarta. Most of the studies used data collected from The National Planning and Development Agency of the Republic of Indonesia (Bappenas) and Japan International Cooperation Agency (JICA) which conducted a household travel survey from 28th of June 2002 to 8th of November 2002. This data aimed to study an integrated transportation master plan (SITRAMP) 2004 over Jakarta Metropolitan Area (JMA). Still, there are deficient studies with other data sources to investigate further of disaggregate choice model in Jakarta.
The study of Yagi and Mohammadian [27] using SITRAMP 2004 data focused on joint models of home-based tour to build an activity-based modelling framework for Jakarta. They used a NL model to develop four different activity types; work, school, maintenance, and discretionary. Travel modes are divided into the eight most commonly used modes in the region. The overall results of the model show that the model structure, choice alternatives, and critical variables significantly differ from other activity-based models in developed countries. In Jakarta, they found that shared ride is often associated with people who employ chauffeurs, meaning that this mode is common among high-income people. Income has a significant influence on mode choice. For instance, the utility of a private vehicle or a taxi increases as income rises, while the utility of a motorcycle, public transport, and non-motorized transport increases as income declines. Gender, age, and status of individuals directly increase the utilities of specific travel modes. Male respondents have higher use of private vehicles and females have higher use of public transport and taxis. In addition, full-time workers have greater use of private modes and homemakers have greater use of non-motorized transport.
Using the same SITRAMP 2004 data, Dharmowijoyo et al. [28] examined the variability in travellers’ activity-travel patterns in JMA. The explanatory variables are daily constraints, land use, road network conditions, and resources. The study looks at the influences of these variables on activity-travel patterns such as travel mode choices, a number of trips, trip chains, departure time, and total daily travel time interact with each other. The trips are made by workers, students, and non-workers. The results show that some variables influencing activity-travel patterns in developing countries are similar to developed countries, but others differ. The variables, such as individual, household, transport network, and land use, significantly influence workers and students’ activity-travel patterns, with the exception of the departure time variable. They are more likely to use motorised modes to travel and have lesser daily trips for those who have high-income than other income levels. Their activity-travel patterns are also more predictable, especially during weekdays, and more flexible during weekend days. On the other hand, because non-workers have much more flexible time, they are not significantly influenced by departure time, travel time spent, and mode shares. Furthermore, older non-workers have daily trips with more trip chains using motorised modes than others.

3. Methodology

The relationship between tour type and mode of travel has been mostly modelled using logit models such as MNL [29] and NL [16]. Meanwhile, one of the advanced logit models, CNL, has rarely been used in modelling this relationship. The simplicity of MNL was one consideration that this specific model is selected, following NL which could estimate the correlation among different alternatives within specific groups or nests. Finally, one of the most advanced logit models, CNL, is used to estimate the correlation among alternatives in different groups or nests.
We tested a single NL model structure, with two levels, where the upper level captures the tour types, while the lower level represents a joint choice of mode choice and tour type. Meanwhile, the CNL structure has four nests based on tour types (hwh and hw+wh) and vehicle types (private vehicles and public transport). Additionally, we estimated a simpler MNL model without any nest. Figure 1, Figure 2 and Figure 3 present the structures of these models.
The tour types from the data are divided into eight types as previously stated in the introduction. However, there are only two groups with high variations of tour type and mode choice that will be analysed in this study: hwh and hw+wh.
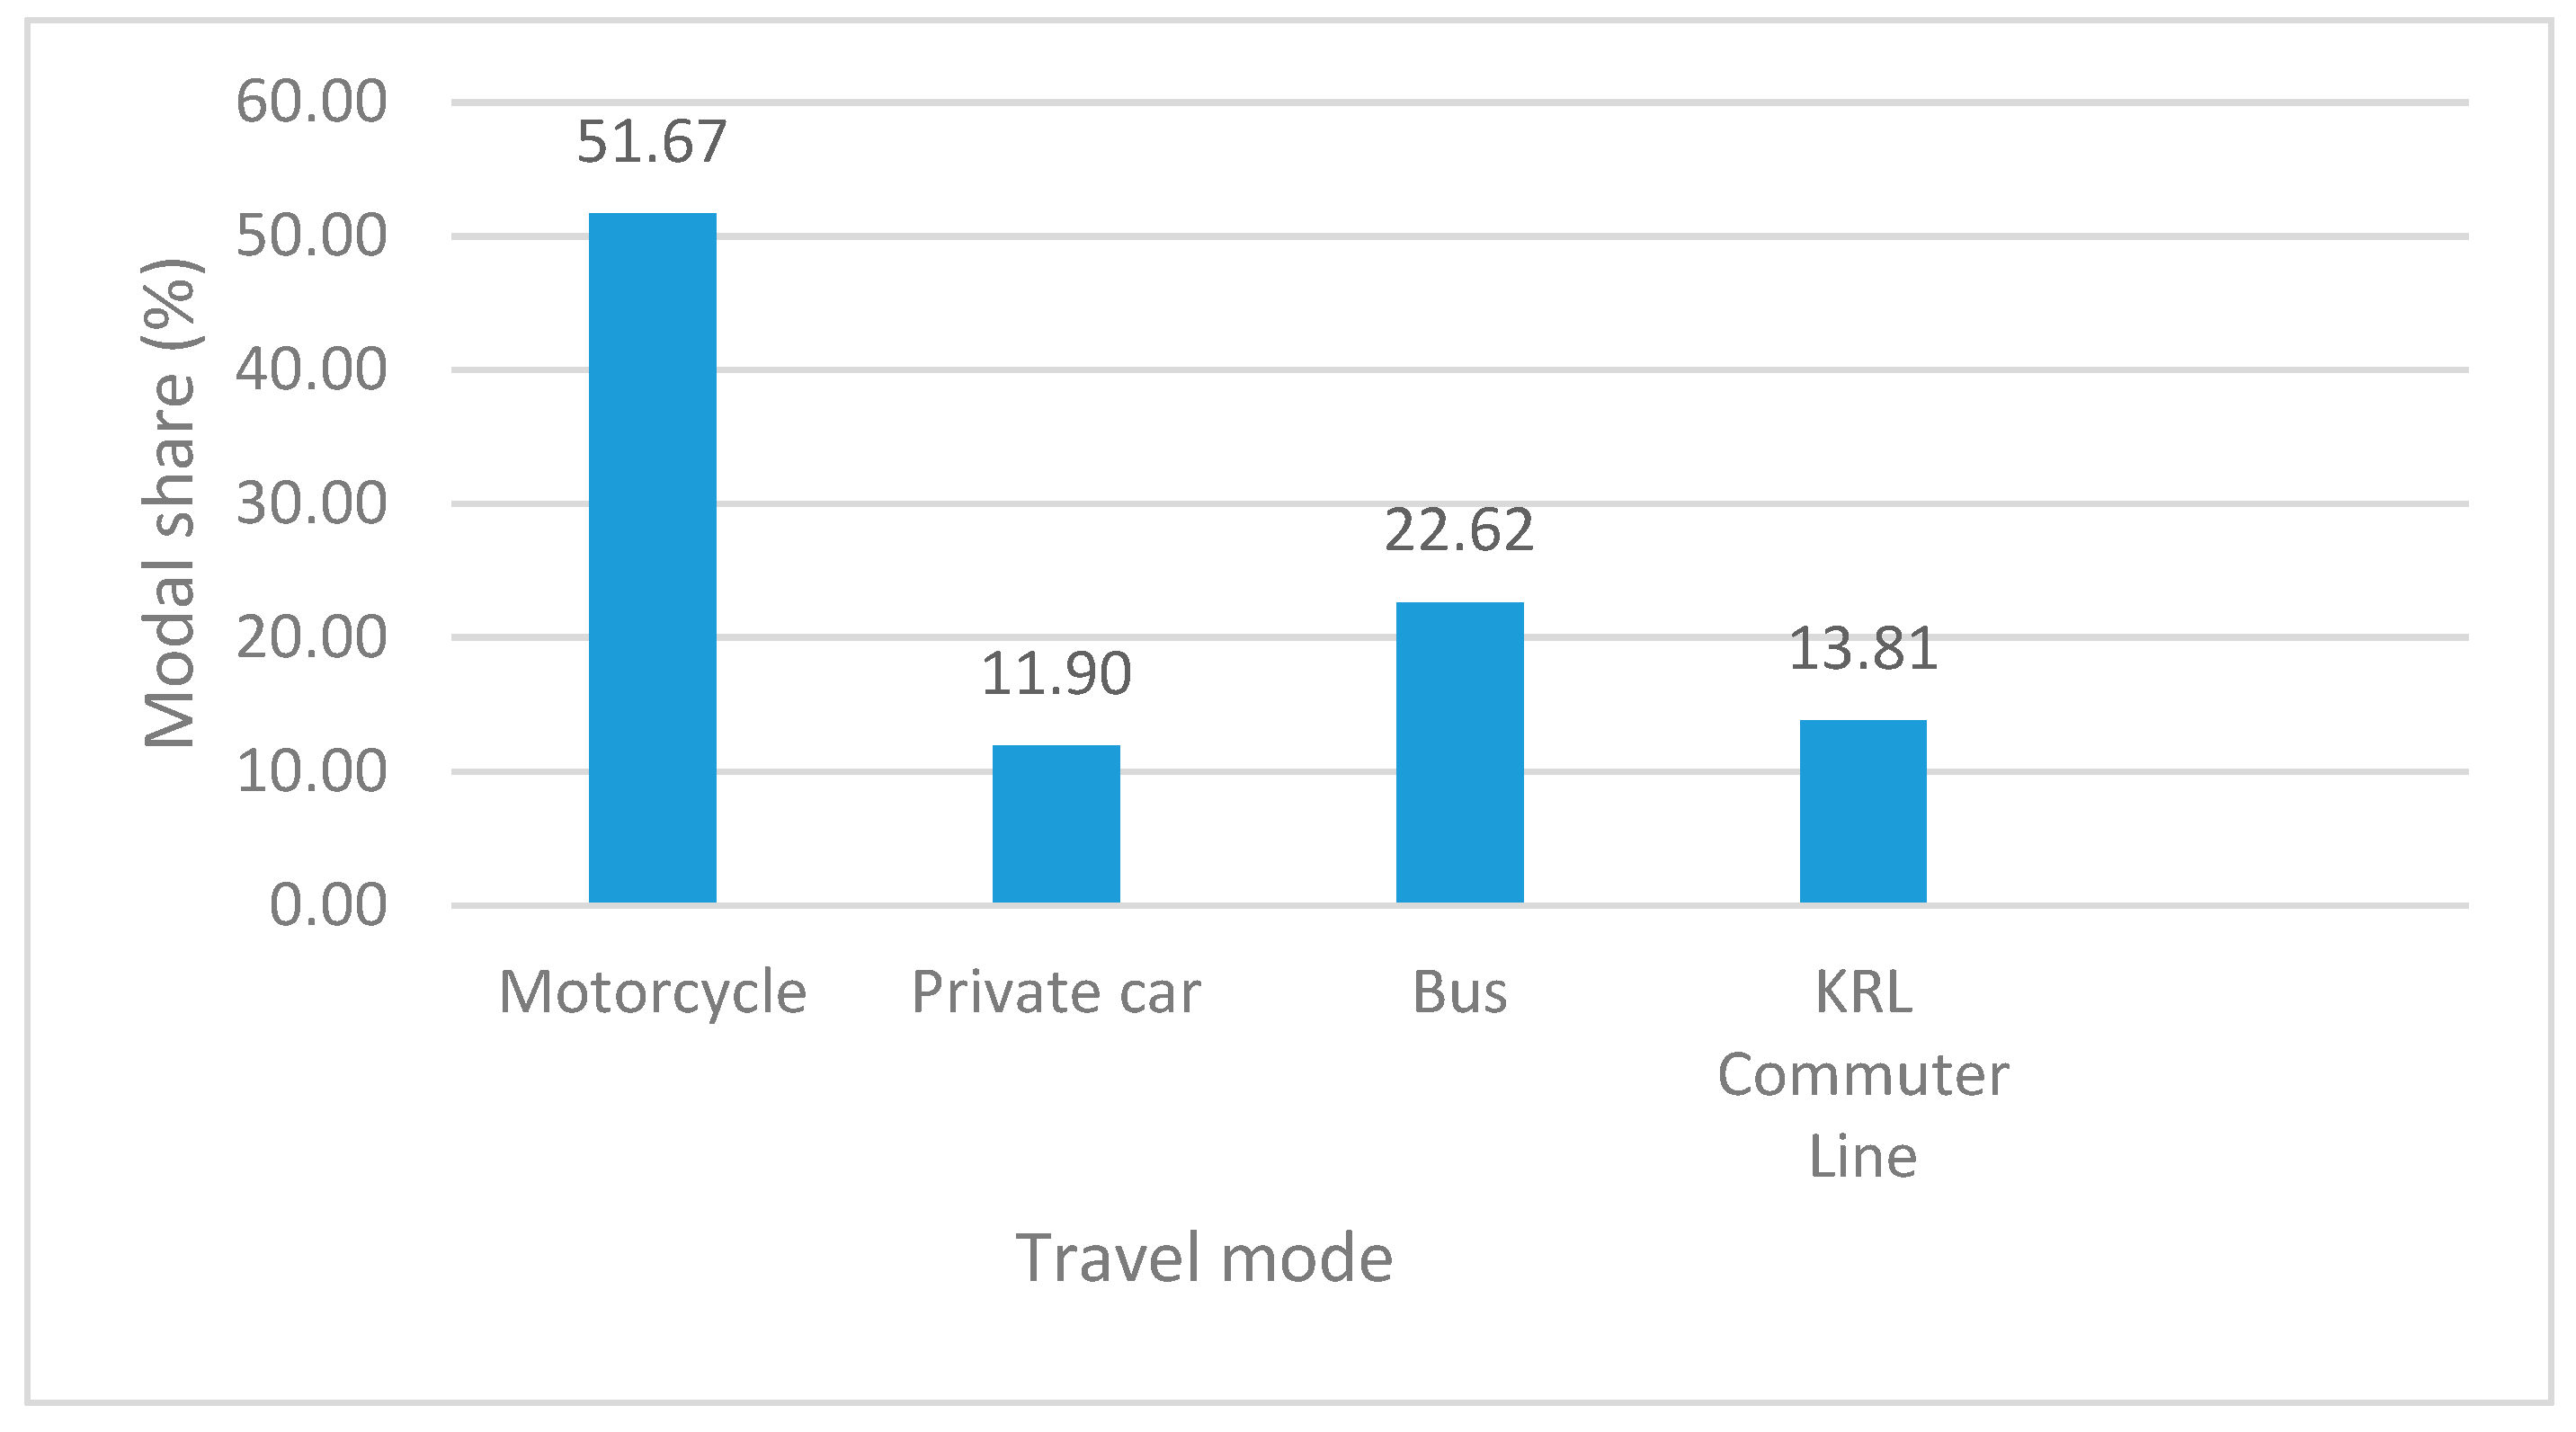
In regard to mode choice, the private vehicles in this study are limited to private car and motorcycle as these are the primary private vehicles used in the context of the Jakarta Metropolitan Area. Meanwhile, public transport is divided into bus and KRL commuter line train, since these two modes are the modes with the highest occupancy of commuters.
The interaction between tour type and mode choice generates eight alternatives or sets of choices which are described in Table 1.
The utility function of each alternative is different since varying parameters are included in each function. Each parameter is assumed to have significant effect on the value of utility. The utility function for all alternatives is presented in Equation (1) to Equation (8) below.
U H W H _ M C = A S C H W H + A S C M C + β T C * T C M C + β T T * T T M C + β I N C L   M C * L O W   I N C O M E  
U H W H _ C A R = A S C H W H + A S C C A R + β T C * T C C A R + β T T * T T C A R + β I N C H   C A R * H I G H   I N C O M E  
U H W H _ B U S = A S C H W H + A S C B U S + β T C * T C B U S + β T T * T T B U S + β G E N B U S * F E M A L E  
U H W H _ K R L = A S C H W H + A S C K R L + β T C * T C K R L + β T T * T T K R L + β G E N K R L * F E M A L E
U H W + W H _ M C = A S C M C + β T C * T C M C + β T T * T T M C + β I N C L   M C * ( I N C M C = = 1 ) + β P U R P O S E * P A R T   T I M E   W O R K E R
U H W + W H _ C A R = A S C C A R + β T C * T C C A R + β T T * T T C A R + β I N C H   C A R * H I G H   I N C O M E + β P U R P O S E * P A R T   T I M E   W O R K E R
U H W + W H _ B U S = A S C B U S + β T C * T C B U S + β T T * T T B U S + β G E N B U S * L O W   I N C O M E + β P U R P O S E * P A R T   T I M E   W O R K E R
U H W + W H _ K R L = β T C * T C K R L + β T T * T T K R L + β G E N K R L * L O W   I N C O M E + β P U R P O S E * P A R T   T I M E   W O R K E R
The equations above show the utility function for all alternatives. The βTC, βTT, βINCL MC, βINCH CAR, βGEN, and βPURPOSE are the dummy variables of mode and socio-demographic of the commuters related to travel cost, travel time, low income for motorcycle users, high income for car users, gender, and travel purpose. These dummy variables will explicitly indicate the behavioural trend of commuters in choosing their mode choice and tour types. The alternative specific constant (ASC) of each alternative shows the average effect on the utility of all factors outside of the observed parameters [12]. The presence of alternative specific constant in each function eliminates the error term or unobserved portion of utility ε in the utility function. Moreover, a variety of alternative specific dummies are included in the model to investigate the household travel behaviour and attitudes such as income, gender, and travel purpose of the commuters. Meanwhile, the differences between three logit models will be described and drawn in the figures below.
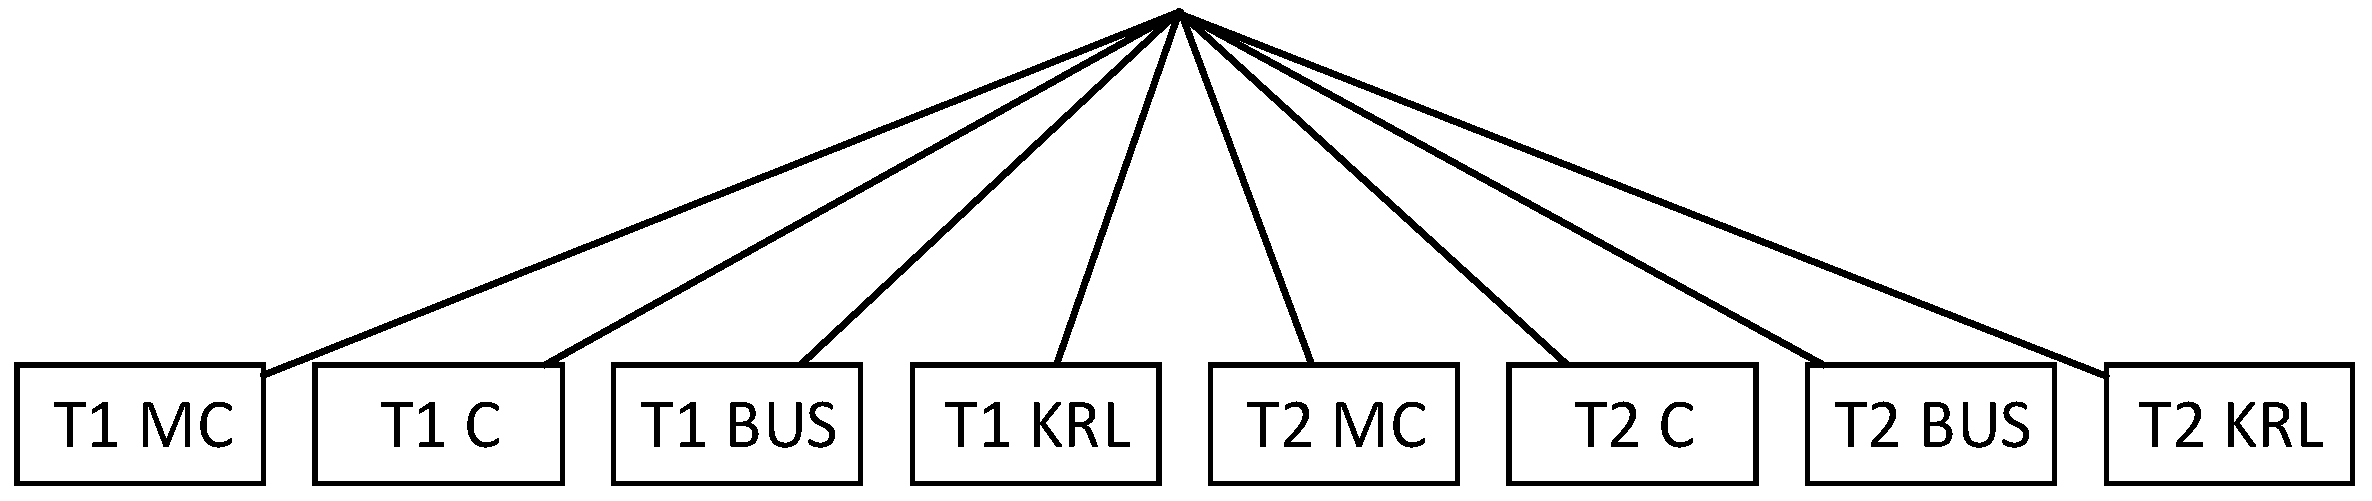
The MNL model structure is drawn in Figure 1 above. There are eight alternatives to the model which have the same level of choices. Where T represents the tour type of the commuters, which is divided into T1 and T2 to represent hwh and hw+wh, while MC, C, BUS, and KRL are motorcycle, car, bus, commuter line train, respectively.
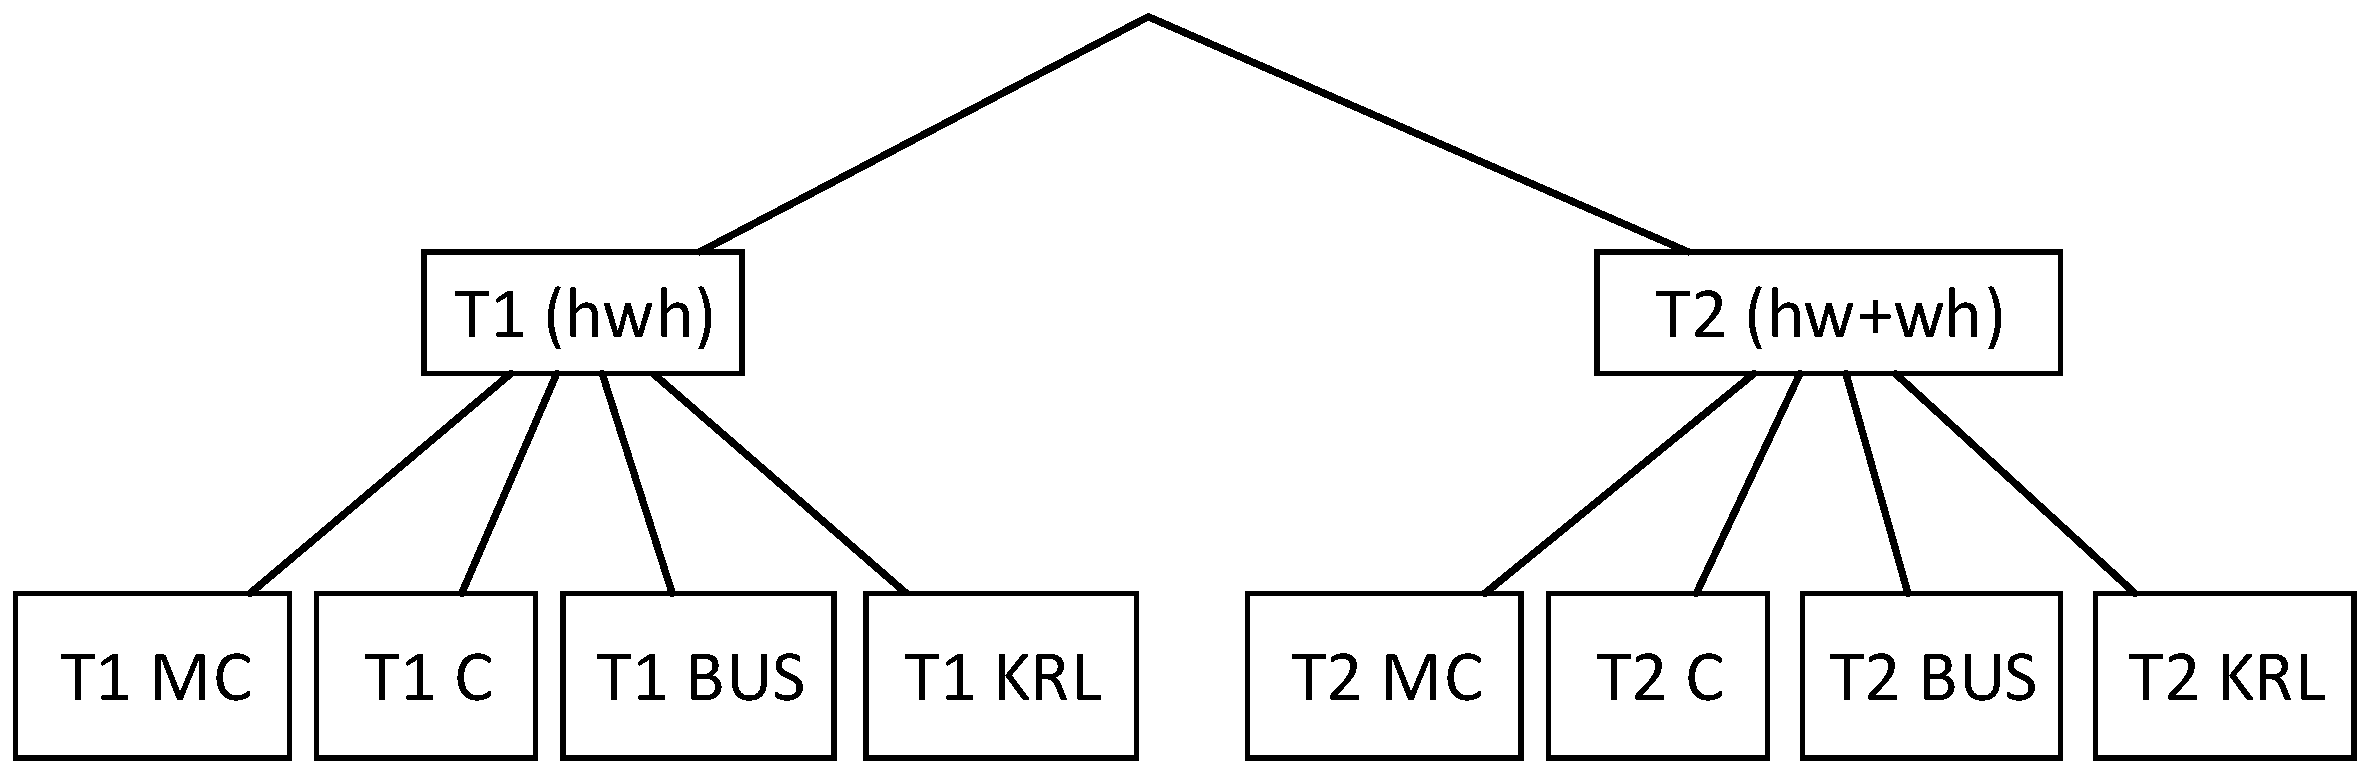
Figure 2 illustrates the model structure of NL that is deployed in this study. This model structure is a two-level NL where the upper level is partitioned of tour type into two nests and the lower level is the joint choice of tour types and travel mode of the commuters. Thus, by using a NL model, the correlation between these two tour types will be explored in this model.
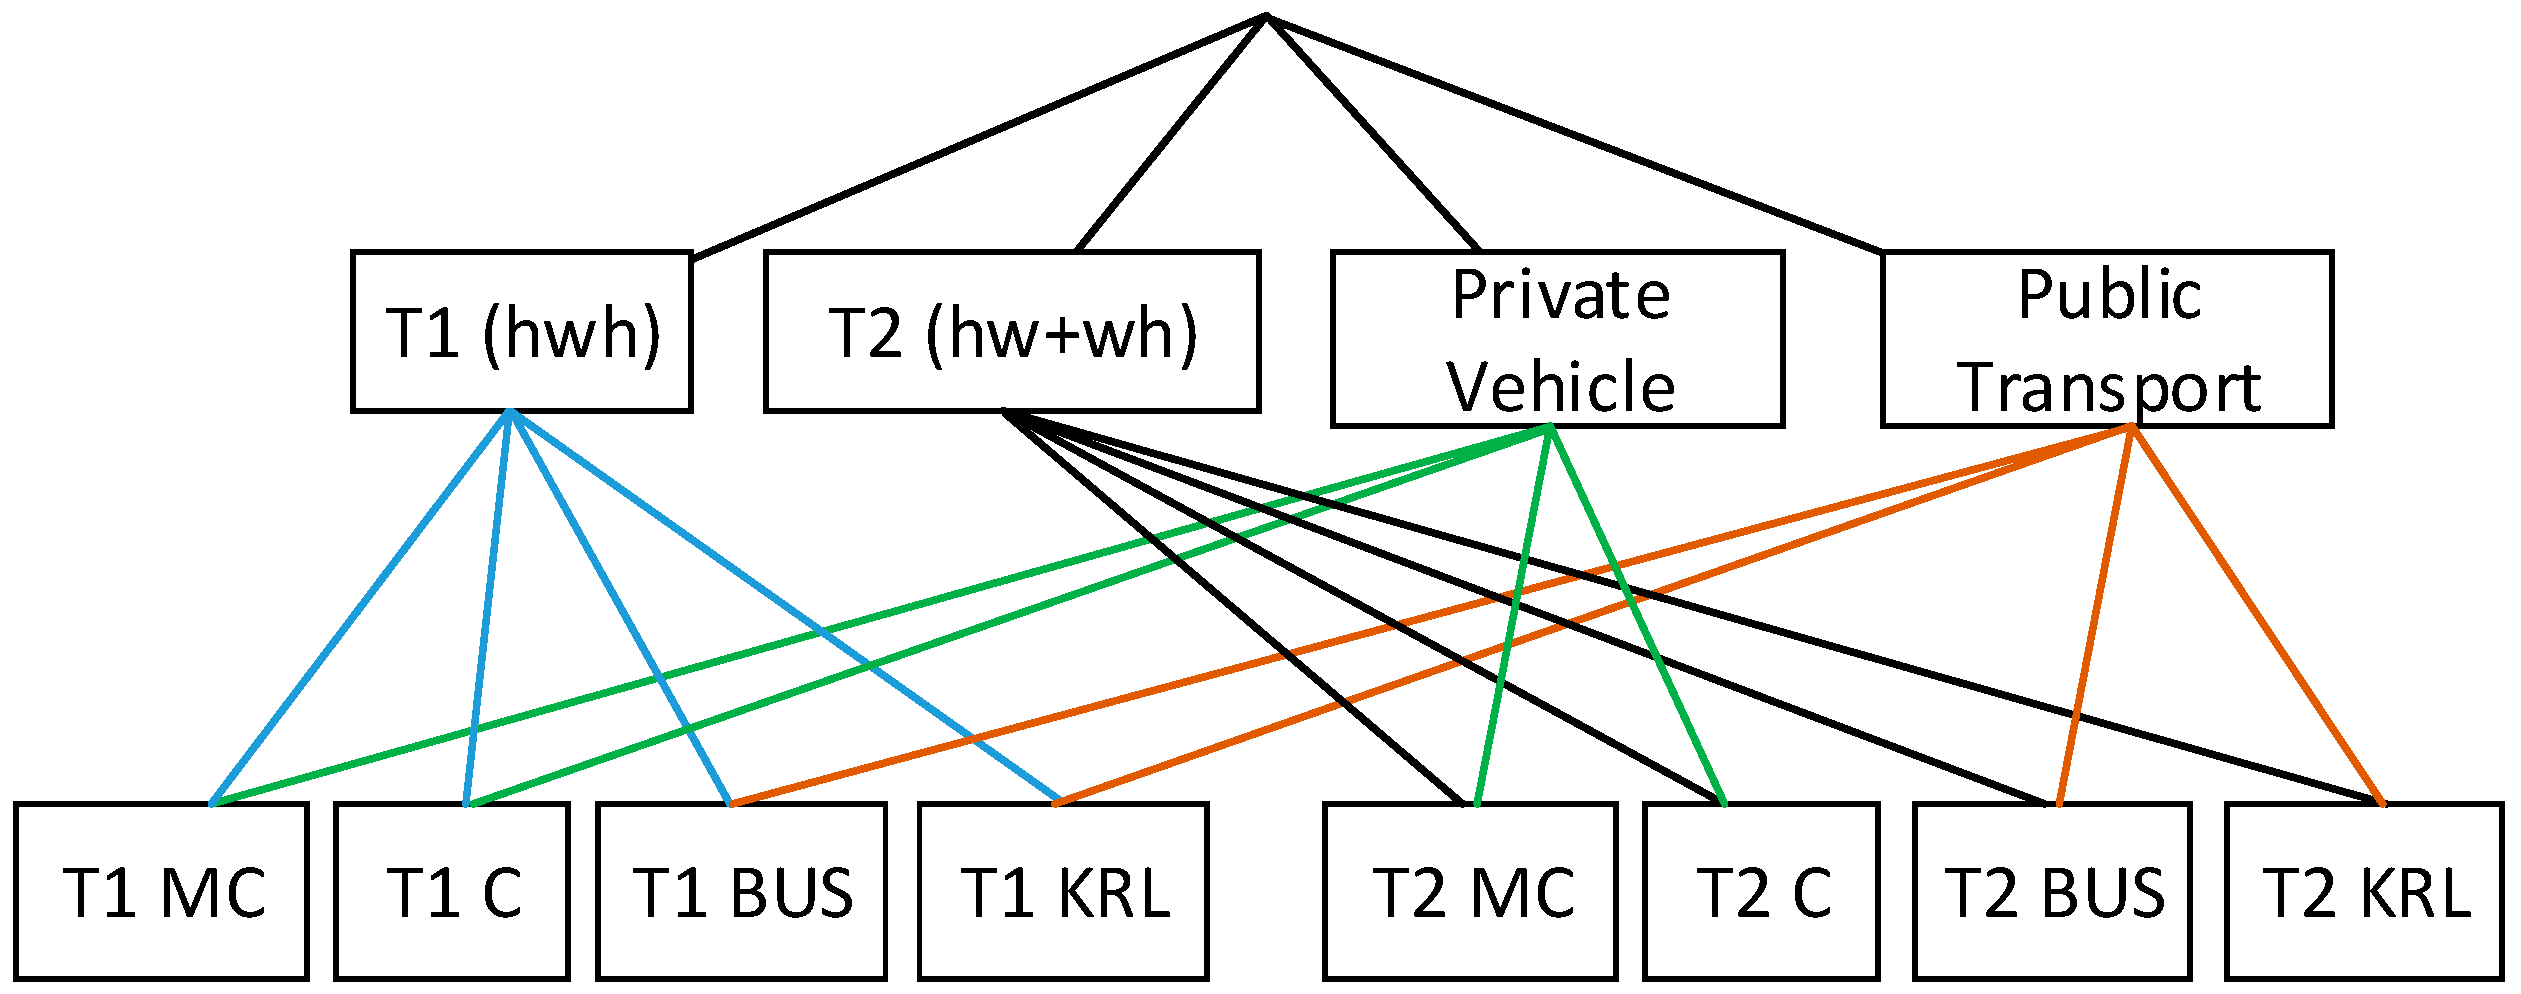
Figure 3 above demonstrates that the CNL model is similar with NL, but the alternatives in the lower level could be the member of one or more nest in the upper level. In this model, the upper level consists of four nests: hwh, hw+wh, private vehicle, and public transport, whereas the lower level includes joint choice of tour types and modes. Each joint choice belongs to two nests both tour type and vehicle type. However, this structure can be drawn in NL structure but it requires either two different NL structures based on tour types and vehicle types or combined nest in three level NL structure based on the study conducted by Hess et al. [13]. Therefore, by using the CNL structure from this model, the correlation pattern among alternatives across the nest can be more easily apprehended.

4. Data Description

4.1. Study Area

The capital city of Indonesia, Jakarta, has a population of 10,277,628 which is around 3.97% of the total Indonesian population [30]. The administrative, industrial, and commercial activity in Indonesia is centralised in Jakarta. This causes rapid development in Jakarta where there are plentiful constructions sites, infrastructure facilities, as well as a fleet of public transport to increase the mobility of the people inside and toward Jakarta. Therefore, it attracts many people in Indonesia to work and live there as permanent residents. However, for the people who live in the cities surrounding Jakarta, they are commuters. In terms of the origin-destination (OD) of the commuters, Bekasi city is set to be the origin, whereas the Special Region of Jakarta is chosen to be the destination, including the municipalities within those two cities. The map of Jakarta Metropolitan Area (JMA) is shown in Figure 4 below.
There are several modes of transport to commute from Bekasi to Jakarta, such as a private car, motorcycles, bus, and the KRL commuter line train. According to the survey from Statistics of DKI Jakarta Province [1], they pointed out that the number of commuters from the outskirts of Jakarta is 1.38 million which is comprising the cities of Bekasi, Depok, Bogor, and Tangerang. The modal shift consists of 58 percent of commuters using motorcycles, 12.8 percent of commuters using cars, and 27 percent using public transport, such as buses and KRL commuter line trains. The highest number of commuters was contributed by Bekasi which is about 14.8 percent of the total number of commuters.

4.2. Daily Activity Patterns Survey Data

The survey was conducted by Irawan et al. [32] by using the random sampling technique. The survey obtained three kinds of data: socio-demographic and travel data, as revealed preference data and stated preferences data. These data were obtained at the stations and offices both in Bekasi and Jakarta and these data are useful to analyse complex travel behaviour and forecasting travel demand for the planning project of the new LRT system from Bekasi to East Jakarta. However, the stated preference data was not analysed in this study. The sample profiles used in this study is shown in Table 2.
The survey collected socio-demographic data which is relevant to tour-based mode choice. The characteristics of socio-demographic of the commuters include monthly income, gender, and the type of profession of the commuters. Meanhile, the tour type characteristics of the commuters were grouped into eight groups, which included two tour types with four different travel modes. The summary of socio-demographics and tour types of the commuters from Bekasi to Jakarta is shown in Table 2 above.
Based on the data above, it can be examined that the total number of commuters from Bekasi to Jakarta is large compared to the total number of population of Bekasi City. Around 10% of the total population of Bekasi City are commuters. The sample size of commuters surveyed in this study is 420 commuters from 501 initial sample size. This number can be assumed to represent the total number of commuters by using Slovin Sampling Theory.
According to Table 2 above, the percentage of monthly income of the commuters is equally varied from low income to high income. In addition, the average monthly income of the commuters was around six million Indonesian Rupiah. Thus, due to this financial limitations, generally, vehicle ownership is limited to owning one car and two or more motorcycles for each household, since it is not very common to have more than one car per household in developing countries [34]. Regarding the tour type of commuters, Figure 5 shows the number of tours and the tour type selected for this study.
The initial data of tour type is shown in Figure 5a. There are eight tour types which include tour purpose to workplace and school. Furthermore, the tour is varied and not limited to only one destination since there will be one or more additional stop for another activity, such as lunch, meeting, shopping, and other destinations within the tour. From Figure 5b, it can be seen that the tour types hw+wh and hwh are the two most dominant tour types of the commuter. Thus, the tour type of commuters is simplified into two types from eight types collected based on initial data which will be analysed in this study. Consequently, there is no tour type for school purpose used in this study due to the limitation of its data. The proportion of these two types are 32% and 68% for hwh and hw+wh. The tour type hw+wh is the most dominant tour type since most of the Bekasi to Jakarta commuters are the workers who have an additional trip purpose in the workplace. Usually, they would take trips for lunch during the afternoon break. Meanwhile, the hwh tours is in the second rank of number of tours, since there are several workplaces or offices which are integrated with many facilities, such as shopping malls and food courts, so that commuters do not have to take an extra a trip to other places during break times. Furthermore, the information of modal share of commuters from Bekasi to Jakarta is shown in Figure 6 below.
According to the data in Figure 6, the modal share of commuters from Bekasi to Jakarta is dominated by motorcycle, contributing 51.67%, followed by public transport, and third is bus and KRL train with modal share of about 22.62% and 13.81%. Lastly, car is the last choice for the commuters, with the percentage of 11.90%. This initial analysis is in line with the study conducted by Yagi et al. [35] which found that the motorcycle is the most dominant mode used in many urban areas in developing countries such as Jakarta and there was less modal share of public transport. In addition to the data above, the modal share for the hwh and hw+wh tour types is drawn in Figure 7 and Figure 8 respectively.
The figures above imply that both motorcycle and bus are the most commonly chosen modes for the commuters when they are going to work and going back home with no additional trip within the workplaces. The modal shares for motorcycle and bus in the hwh tour type are 41.61% and 36.50%, respectively. On the other hand, almost 50.17% of the commuters choose motorcycle as the primary mode for the tour type of going to work and going back home with at least one additional trip in the workplace. This number is the highest modal share compared to other modes in hw+wh tour type.

5. Discussion

This section of the paper will briefly discuss the results of the tour-based mode choice model. The models investigated are MNL, NL, and CNL, for which estimated parameter, robust standard error, and robust t-stat values are presented and discussed. Moreover, the model comparison will be based both on informal and formal tests, including signs and magnitudes of parameter estimates, log likelihood ratio test, goodness-of-fit tests, and t-statistics.

5.1. Multinomial Logit Model

The result of parameter estimation of MNL model structure in Figure 1 is presented in Table 3. By analysing the informal test on the sign of the parameter estimation, the results show that several utility coefficients have a positive impact on the utility of mode choice for particular tour types, as these values have positive signs. However, there are also some coefficients that have negative impact on the utility, as these values have negative signs. These signs imply whether the coefficients increase or decrease the propensity of commuters to choose the mode based on their preferred tour type. See Equation (1) to Equation (8) for the utility functions which were used and with clarification of each estimated parameter that will be evaluated in this model.
According to Table 3, the car, KRL, and bus are the most preferred modes for the commuters from Bekasi to Jakarta since the alternative specific constant for these modes are positive and statistically significant. Also, the parameter magnitude of these modes are vast compared to other modes, such as motorcycle, which is smaller. On the other hand, the commuters are less likely to take a motorcycle due to the small value of the parameter magnitude of the mode specific constants for this mode, and the value is found to be insignificant.
The estimated dummy parameter of commuters with low income is positive and statistically significant, indicating that low income commuters have a higher preference to choose motorcycle, whereas the commuters with high income prefer to drive a car to work since the estimated parameter is also positive and significant.
Meanwhile, the female commuter dummy shows a positive sign and is statistically significant which implies that they are more likely to take public transport for commuting. The magnitude of the parameter of female commuter dummy travelling by bus is higher than the female who takes KRL, indicating that females tend to choose bus rather than KRL for commuting trips.
Moreover, the occupation of the commuters is also taken into account and analysed by using dummy parameters. The corresponding dummy parameter in the utility function is positive in result, which explains that the commuters who have a part-time job are more likely to have flexible tour type. However, this attribute is found to not be statistically significant at 10% error tolerance.
Therefore, based on the findings above, it could be argued that the income and gender influence the probability of the commuters to choose the travel mode. However, besides all of the attributes above that contribute positively to utility, there are two differing attributes that are negative and statistically significant: travel time and travel cost. Thus, these attributes decrease the propensity of the utility of the commuters in choosing their mode. The estimated value of travel cost is found to be higher than the travel time. For this reason, the commuters have a higher preference to choose the cheapest mode, followed by the fastest mode.
In terms of summary statistics of the total 420 observations, there are 11 parameters estimated and eight alternatives evaluated. In addition, the goodness-of-fit of the models such as the rho square and adjusted rho square values are 0.31 and 0.29, respectively, which means that these values are substantially high. Therefore, it can be stated from the goodness-of-fit test that the model has a good fit to the data.

5.2. Nested Logit Model

As stated earlier, the NL model that will be analysed in this study is based on tour types (See Figure 2). The initial analysis for this model was eliminating some parameters of the previous MNL model and adding several parameters related to the NL model. Some deleted parameters were alternative specific constant for hwh (ASC_HWH) and hw+wh (ASC_HW+WH) which was then added with the scale parameter of λ both for nest hwh and hw+wh. Consequently, some nest-specific parameters (β value) for both nests are divided in order to inspect the effect of particular attributes in a different nest. These nest-specific parameters include βINC, βGEN, and βPURPOSE. Nonetheless, the generic parameters βCOST and βTIME were kept alongside the nests.
Within this initial analysis, only the alternative specific constants for KRL was fixed to be one, whereas the other new parameters will be estimated. Result show that the values of λhwh and λhw+wh were greater than one, which is inconsistent with the utility maximising behaviour since the value of λ should be between zero and one [12]. In order to make sure that the value of both λ is between zero and one, the value of λhw+wh was fixed to 0.99 while keeping λhwh free, we made this assumption based on the hypothesis that correlation among alternatives in nest hw+wh was bigger due to the more complex tour. Next, the scale parameter for nest hw+wh was set to be 0.99 (λhw+wh=0.99) while for nest hwh was free. The second approach worked better, and is reported in Table 3.
The results in Table 3 show that after fixing the parameter of λhw+wh, both λhwh and λhw+wh are in the range between zero and one which is consistent with the utility maximising behaviour theory. The value of λhwh is found to be 0.55 and statistically significant. Therefore, it can be argued that there is correlation among alternatives in nest hwh.
Some findings are found to be similar with MNL model results, such as the alternative specific constants value for car, bus, and KRL, which were significantly positive. This finding indicates that these mode are more likely to be chosen by the commuters whereas the motorcycle is unlikely to be chosen by the commuters since its parameter has small magnitude value and is found to be statistically insignificant at 90% of confidence level. Furthermore, travel cost and travel time also indicate similar commuters’ behaviour to choose their preferred mode. The coefficients of travel cost and time are negative and statistically significant.
Other results obtained from the NL model reveal that the commuters with low income with hw+wh tour type have a higher preference to choose motorcycle rather than commuters with hwh tour type because of the estimated parameter obtained for low income commuters in hw+wh being more significant than in hwh. Subsequently, the commuters with high income have a higher preference to choose car as the main mode to commute in hw+wh tours rather than in hwh tours, since both estimated parameters are statistically positive. This finding is sensible when it is assumed that the commuters who have private vehicles tend to have complex tour types, particularly in their workplace rather than having a fixed tour type, such as hwh.
Other findings of this model indicate that there are different behaviours of commuters who take different tour types. Female commuters are more likely to take a bus in hwh tours than hw+wh tours as the estimated parameter is found to be positive and statistically significant for hwh tours, unlike hw+wh tours, which is insignificant. However, female commuters tend to choose KRL rather than bus when they have hw+wh tour type, as the estimated parameter for females to take KRL is significantly positive for nest hw+wh.
In terms of commuters’ occupations, the results show similar findings to the MNL model results. The commuters who have a part-time job show a tendency to have the hw+wh tour type due to their flexibility. However, this parameter is found to be statistically insignificant at the 90% confidence level.
The statistics summary of 420 observations show that there are 15 parameters obtained from eight alternatives. The results of the goodness-of-fit test was shown to be higher than the MNL model since the rho square and adjusted rho square increased to 0.35 and 0.33, respectively. Hence, this result implies that this NL model has a good fit to the data. Moreover, the likelihood ratio test between NL and MNL has a result of 64.48, which, in regard to chi-square statistic, is greater than the critical value of three degrees of freedom and the 90% confidence level used in this study. Thus, this indicates that the parameter estimations (See Equation (1) to Equation (8)) in this model are considerably different from zero.

5.3. Cross-Nested Logit Model

The CNL model provides a higher degree of flexibility in capturing wider correlation patterns among alternatives than the two previous models that have been used [36]. The restricting aspect of grouping some alternatives in one nest in NL model can interrupt in capturing the correlation of alternatives that may belong to more than one nest. Since each of the alternatives belong to more than one nest, as shown in Figure 3, this model structure is appropriate and efficient to be used in the analyses rather than using two NL models based on tour types and vehicle types.
Therefore, in this model, it is assumed that each joint choice alternatives of commuters will be allocated in two nests according to tour type and vehicle type. The upper level represents the tour types and vehicle types, while the lower level consists of the joint choice alternatives. The estimation results for the CNL model are shown in Table 3. The final values of λ and α shown in the Table 3 and Appendix A have been transformed using the logit transformation equation, as during estimation an appropriate logit transformation was used to avoid these values going outside the [0, 1] interval.
According to the findings, it can be said that the CNL model can categorize the correlation among alternatives in different nests since all α values were below one, with the exception the value of α for alternative six to nest private vehicle which has a scale parameter of about one. While the highest correlation between alternative and nest is detected for the commuters who select car in hw+wh tours with nest hw+wh, followed by the commuters who ride a motorcycle in hwh and hw+wh tours with the nest private vehicles, and the commuters who take a bus and KRL in hw+wh tours with the nest public transport.
In terms of correlation among alternatives in each nest, the λ values show that these values are less than one, meaning that correlation among alternatives exist. The λ values for hwh tours, hw+wh tours, private vehicle, and public transport are 0.99, 0.22, 0.92, and 0.00 respectively. Moreover, by using the t-test, all λ values are different from one. The most apparent correlation among alternatives was found for the nest public transport, meanwhile, the lowest correlation is on the nest hwh.
On the other hand, the modes car, bus, and KRL are still the most preferred mode for the commuters, whereas the motorcycle is less preferred. It is found that the parameter magnitude of car is the highest among the other modes, followed by bus and then KRL.
Consistent with the previous result, the generic parameters of travel cost and travel time have reasonable significance and correct signs. Based on the magnitude value of these generic parameters, the commuters tend to choose the cheapest mode rather than the fastest mode as the estimated parameters are shown to be −0.23 and −0.01 for travel cost and travel time, correspondingly.
Most of the dummy parameters for commuters’ income show reasonable significance. The commuters’ income in this model also shows the same interpretation as the previous model. The low income commuters have a preference to ride motorcycles, whereas high income commuters have a higher preference to drive cars.
Contrary to the results of the previous model for the female commuter dummy, the dummy parameter is found to be significantly positive for female commuters who take public transport in hwh tours, whereas it is insignificant for hw+wh tours. This indicates that female commuters have the tendency to make use of public transport in simple tours rather than complex tours. Moreover, the female commuter is found to be more likely to choose bus rather than KRL, as the magnitude value for bus is higher than KRL.
Similar to the findings in the two previous models, part-time workers are less likely to make simple tours, since the parameter is found to be positive in complex tours but it is not significant. Therefore, this logit model also could not capture a significant result for this parameter.
The summary of the statistical analysis of this model shows that there are 26 parameters obtained from eight alternatives. The goodness of fit and final log likelihood is improved compared to the two previous models. The rho square and adjusted rho square are found to be 0.37 and 0.3, respectively, while the final log likelihood is −478.28. Thus, the likelihood ratio compared to the NL is found to be 30.53, statistically significant at 10% tolerance of error and with 11 degrees of freedom.

5.4. Model Comparison

In the three logit models above, the utility parameter of mode and tour type for the commuters are estimated by using individual and socio-demographic data to investigate commuter preferences for travel modes when taking their tour type. This section will present the comparison of similar attributes used at least for two of three logit models that have been used in this study. The comparison of the three models’ performances above is presented in Table 3.
As shown in Table 3, it can be seen that the three logit models used: MNL, NL, and CNL, mostly yield similar results concerning the alternative specific constants and estimated parameters with similar signs and magnitude. Furthermore, the estimated parameters from individual and socio-demographic data also have similar significance levels.
However, some parameters were found to have different significance results associated with the dummy female commuters. This can be found by estimating nest-specific parameters of the dummy female commuter in two different nests in the NL and CNL models. This indicates that the NL and CNL models provide a better estimation for a particular group of alternatives.
Dummy part time commuter was found to be non-significant in all models. This might be because the data provided little evidence that part-time commuters tend to have complex tours in their commute, since the proportion of part-time workers is only 1.90% of the total sample.
The generic parameters and alternative specific constants are used in the same utility functions for the three models. Thus, these parameters are easily compared based on the significant results. The CNL model provides the highest t-test value compared to the other models, indicating that CNL is more appropriate in evaluating the estimated parameters than MNL and NL.
Based on the findings, it was shown that the alternative specific constants for motorcycles has the lowest magnitude compared to other modes. However, from the initial descriptive analysis, this mode was found to be most commonly used by the commuters. This is because the travel cost and travel time for motorcycle were found to be the lowest compared to other modes based on the data source. Therefore, the utility of motorcycle is greater than other modes.
Going further, all of the λ parameters in the CNL model are significantly different from one another. It implies that this model is also more robust to capturing increasing correlation inside the nests. Likewise, α parameters have reasonable significance, which means that correlation among alternatives in different nests could be captured.
Based on the comparison table above, it can be seen that the values of travel time (VTT) are different among the three models. The MNL has the highest VTT at about 1381.29 IDR/hour while the CNL has the lowest VTT at around 544.14 IDR/hour. These values are sensible in the Indonesian context.
Regarding the formal testing of the result, the CNL model shows better improvement compared to the MNL and NL models. The final log likelihood value increases from about −525.78 in the MNL to −493.54 in the NL model and then improved to −478.28 in the CNL model. Likewise, the goodness-of-fit test, which includes rho square and adjusted rho square, also shows better result compared to the values obtained in both MNL and NL models, since these values in CNL model are found to be the highest. Furthermore, by using the likelihood ratio test, the CNL model is significantly better at the 90% and 99% confidence levels. According to this study, therefore, the CNL model is argued to be the optimum model among the tested ones, to be used in the estimation of parameters among multi-alternatives in nesting structures that may belong to other nests. Moreover, NL is also considered to have significant improvement of final log likelihood for nesting the choices based on tour types, indicating that the NL model is also appropriate to evaluate nesting structure in a tour-based mode choice model.

5.5. Policy Recommendations

Based on the findings from the previous sections, some policy implications can be formulated to improve the travel quality of commuters from Bekasi to Jakarta. The policy implications in this report will likely be related to the findings of commuter behaviour from Bekasi to Jakarta. The policy is formulated based on previous studies and case studies both from developed and developing countries that result in significant quality improvement for urban mobility including for the commuters as the policy has been implemented. Thus, there are five policy implications proposed based on commuter behaviour analysed in this study to improve the travel quality for commuters. The policy implications are summarized in Table 4 and the rationale for recommending them are described below.
The findings show that travel cost has a negative impact on utility. Therefore, by increasing the travel cost of private vehicles and reducing the travel cost of public transport, it will significantly encourage people to shift from private vehicles to public transport for their commuting activities. A congestion pricing scheme is one of the policies that is believed to have successfully reduced the traffic both into and out of the city centre, increased traffic speed, and promoted a modal shift from private vehicles to public transport [37,38]. As the congestion pricing is sensitive for the commuters from different income groups [18], the congestion pricing scheme could be implemented in toll roads and existing congested links between Bekasi and Jakarta. The scheme can set to be dynamically based on location, time, and vehicle type. This policy can be significantly implemented during peak hours when the congestion is often occurring between two cities and targeting the private car.
Further, the revenue from road pricing allows the government to invest in operational and infrastructure facilities of the public transportation system. This strategy is important in order to ensure that the policy will be maintained in sustainable ways. Since ticket fare has a significant effect on influencing travel behaviour [39], investment in the public transport system could be implemented by having a subsidy for public transport. Therefore, the operator can offer a ticket fare which is affordable for all social groups to increase the ridership of public transport [40]. Dissanayake and Morikawa [34] investigated the “push and pull” policy strategy in the Bangkok metropolitan region using the NL model. The strategy considered a road pricing scheme for cars and motorcycles combined with reducing ticket fares of public transportation by 50%. The results show that travel usage by car and motorcycle reduced and the ridership of public transport increased.
As the estimated parameter for travel time is found to be statistically negative, it is important to reduce the travel time by having good reliability of public transport. S. Jain et al. [41] found that commuters were satisfied with the public transport due to its high frequency, adherence to the schedule, and less travel time. They also pointed out that about 96% of commuters are willing to shift to public transport if all above services or criteria are fulfilled for the commuters. Moreover, Ho and Mulley [16] investigated the feasibility of a modal shift from cars to public transport by reducing the ticket fare and increasing the travel time of public transport. They pointed out that this strategy is feasible to attract people to public transport. Another policy of an operator to enhance the service level of public transport is by implementing an integrated ticketing system that can be used by the commuters for all public transport services between Bekasi and Jakarta.
Currently, Jakarta has been constructing the first rail-based transit in Indonesia, LRT and MRT. The MRT is built in the Jakarta area to move people within the city centre, whereas the LRT together with BRT is built to support the MRT as feeder services from the outskirts of Jakarta to the city centre, such as from Bekasi to Jakarta. Furthermore, expansion of the BRT, LRT, and MRT network in Jakarta and the cities surrounding it, is crucial to meet the travel demand. Sohoni et al. [42] conducted a study to see the behaviour of commuters due to the new rail transit mode. They found that about 60% of the commuters who were using private vehicles were willing to shift to the new metro rail line. Therefore, the presence of this new rail transit network and expansion of public transport network could increase the attractiveness and convenience of using public transport [43], which could encourage more people to choose public transport rather than private vehicles for their daily commute.
In terms of transport and land use planning, Jakarta, as the destination of the commuter, should consider implementing integrated transport hubs where commercial developments and offices are connected to the public transport system. This system is widely known as transit-oriented development. This integration is considered to reduce traffic, improve urban environment quality, and increase the modal share of public transport [44,45].
In summary, the high cost of private vehicle usage combined with the affordable ticket prices and better service level of public transport may reduce the level of private vehicle usage and increase the appeal of using public transport. Furthermore, network expansion and transit-oriented development are considered to encourage more commuters to choose public transport instead of private vehicles.

6. Conclusions

This study attempted to present the discrete choice models of different logit models analysis using MNL, NL, and CNL models. The models were specified to estimate the relationship between tour type and mode choice and influencing attributes of the commuters from Bekasi to Jakarta by considering the travel patterns and socio-demographic data of the respondents. The estimation of these models used a set of secondary data obtained from the travel diary of commuters. This set of data allowed these models to be compared in formal and informal tests to evaluate the estimated parameters that offer significant results and to determine whether there is correlation between alternatives.
From the analysis and discussions above, it can be argued that commuters’ characteristics can influence their mode choice. According to the results from three different models, female commuters have a higher rate of using public transport, such as bus and KRL, which is consistent with the findings by Yagi and Mohammadian [27]. Increasing income has a positive effect on choosing a car for their daily commute trip, whereas lower income pushes the commuters to have a higher preference to ride a motorcycle. This finding is consistent with the study conducted by Soltani [46] in developing countries. Moreover, travel time and travel cost were found to negatively contribute toward the utilities. Since there is an absence of comparisons between different logit model structures related to travel behaviour in developing countries, this study contributes to enriching the literature in that area by comparing MNL, NL, and CNL in the context of tour type and mode choice. The three logit models show reasonable results for estimation. However, the NL model showed a significant improvement in final log likelihood when grouping the joint choices based on tour type. Furthermore, the CNL model is considered the best model structure as it captured the correlation among alternatives within and across nests. Some of the estimated parameters were also found to have a higher significance level compared to the two other models. The CNL model also has the highest final log likelihood and the most flexible model structure, leading to a better fit.
The proposed policy package in this research is summarised to five main policies in order to improve the travel quality of commuters between Bekasi and Jakarta. These policies include: (1) implementing a congestion pricing scheme; (2) subsidising public transport; (3) improving the level of service of public transport; (4) expanding the public transport network and mass transit planning, and (5) land use control.

Funding

This research was funded by Ministry of Research, Technology and Higher Education of the Republic of Indonesia, grant number 170/UN1/DITLIT/DIT-LIT/LT/2018.

Acknowledgments

I would like to give the highest gratitude to the Indonesia Endowment Fund for Education (LPDP) for sponsoring my postgraduate study. I would also like to thank Bashir Haque, Dian Azmi, Ahmida Rizki Aulia, and Wida Yuliar Rezika as the discussion partner for this paper.

Conflicts of Interest

The authors declare no conflict of interest.

Appendix A

Table A1. Scale parameter of CNL.
Scale ParametersEstimateRobust Std. ErrorRobust t-stat
λhwh0.990.002.01
λhw+wh0.220.164.83
λprivate vehicle0.92 *0.061.37
λpublic transport0.000.00341.66
αalt1_hwh0.99 *0.010.02
αalt1_private vehicle0.01 *
αalt2_hwh0.120.0420.51
αalt2_private vehicle0.88
αalt3_hwh0.590.085.27
αalt3_public transport0.41
αalt4_hwh0.750.073.71
αalt4_public transport0.25
αalt5_hw+wh0.990.004.98
αalt5_private vehicle0.01
αalt6_hw+wh0.000.0043818.49
αalt6_private vehicle1.00
αalt7_hw+wh0.990.002.79
αalt7_public transport0.01
αalt8_hw+wh0.98 *0.650.02
αalt8_public transport0.02 *

References

  1. Statistics of DKI Jakarta Province. Commuter of DKI Jakarta Province; Statistics of DKI Jakarta Province: Jakarta, Indonesia, 2015.
  2. Ben-Akiva, M.E.; Bowman, J.L.; Ramming, S.; Walker, J. Behavioral Realism in Urban Transportation Planning Models. In Proceedings of the Transportation Models in the Policy-Making Process: A Symposium in Memory of Greig Harvey; Asilomar Conference Center: Pacific Grove, CA, USA, 1998. [Google Scholar]
  3. Hague Consulting Group. The Netherlands National Model, 1990: The National Model System for Traffic and Transport; Hague Consulting Group: Wellington, New Zealand, 1992. [Google Scholar]
  4. Algers, S.; Daly, A.; Widlert, S. Modelling Travel Behaviour to Support Policy Making in Stockholm. In Understanding Travel Behaviour in an Era of Change; Stopher, P., Lee-Gosselin, M., Eds.; Elsevier: Amsterdam, The Netherlands, 1997; pp. 547–569. ISBN 0-08-042390-6. [Google Scholar]
  5. Beser, M.; Algers, S. SAMPERS—The New Swedish National Travel Demand Forecasting Tool. In National Transport Models. Advances in Spatial Science; Lundqvist, L., Mattsson, L., Eds.; Springer: Berlin/Heidelberg, Germany, 2002; pp. 101–118. [Google Scholar]
  6. Fosgerau, M. PETRA—An Activity-based Approach to Travel Demand Analysis. In National Transport Models. Advances in Spatial Science; Lundqvist, L., Mattsson, M., Eds.; Springer: Berlin/Heidelberg, Germany, 2002; pp. 134–145. [Google Scholar]
  7. Bradley, M.; Outwater, M.; Jonnalagadda, N.; Ruiter, E. Estimation of activity-based mocrosimulation model for San Francisco. In Proceedings of the 80th Annual Meeting of the Transportation Research Board, Washington, DC, USA, 7–11 January 2001. [Google Scholar]
  8. Jonnalagadda, N.; Freedman, J.; Davidson, W.A.; Hunt, J.D. Development of Microsimulation Activity-Based Model for San Francisco: Destination and Mode Choice Models. Transp. Res. Rec. J. Transp. Res. Board 2001, 1777, 25–35. [Google Scholar] [CrossRef]
  9. Bowman, J.L.; Ben-Akiva, M.E. Activity-based disaggregate travel demand model system with activity schedules. Transp. Res. Part A Policy Pract. 2000, 35, 1–28. [Google Scholar] [CrossRef]
  10. Bowman, J.L.; Bradley, M.; Shiftan, Y.; Lawton, K.; Ben-Akiva, M. Demonstration of an Activity-Based Model for Portland. In Proceedings of the 8th World Conference on Transport Research, Antwerp, Belgium, 12–17 July 1999. [Google Scholar]
  11. Dissanayake, D.; Morikawa, T. Investigating household vehicle ownership, mode choice and trip sharing decisions using a combined revealed preference/stated preference Nested Logit model: Case study in Bangkok Metropolitan Region. J. Transp. Geogr. 2010, 18, 402–410. [Google Scholar] [CrossRef]
  12. Train, K.E. Discrete Choice Methods with Simulation, 2nd ed.; Cambridge University Press: New York, NY, USA, 2009; ISBN 9780521747387. [Google Scholar]
  13. Hess, S.; Fowler, M.; Adler, T.; Bahreinian, A. A joint model for vehicle type and fuel type choice: Evidence from a cross-nested logit study. Transportation 2012, 39, 593–625. [Google Scholar] [CrossRef]
  14. Miller, E.J.; Roorda, M.J.; Carrasco, J.A. A tour-based model of travel mode choice. Transportation 2005, 32, 399–422. [Google Scholar] [CrossRef] [Green Version]
  15. Hu, H.; Xu, J.; Shen, Q.; Shi, F.; Chen, Y. Travel mode choices in small cities of China: A case study of Changting. Transp. Res. Part D Transp. Environ. 2018, 59, 361–374. [Google Scholar] [CrossRef]
  16. Ho, C.; Mulley, C. Tour-based mode choice of joint household travel patterns on weekend and weekday. Transportation 2013, 40, 789–811. [Google Scholar] [CrossRef]
  17. Yang, L.; Zheng, G.; Zhu, X. Cross-nested logit model for the joint choice of residential location, travel mode, and departure time. Habitat Int. 2013, 38, 157–166. [Google Scholar] [CrossRef]
  18. Siddique, M.A.B.; Choudhury, C.F. Modelling the Behavioural Response to Congestion Pricing in Dhaka, Bangladesh. Transp. Dev. Econ. 2017, 3, 23. [Google Scholar] [CrossRef]
  19. Santoso, D.S.; Tsunokawa, K. Spatial transferability and updating analysis of mode choice models in developing countries. Transp. Plan. Technol. 2005, 28, 341–358. [Google Scholar] [CrossRef]
  20. Irawan, M.Z.; Belgiawan, P.F.; Widyaparaga, A.; Deendarlianto, X.; Budiman, A.; Muthohar, I.; Sopha, B.M. A market share analysis for hybrid cars in Indonesia. Case Stud. Transp. Policy 2017, 6, 336–341. [Google Scholar] [CrossRef]
  21. Leinia, A.V.; Muthohar, I.; Fauzi, I. The application of random regret minimization on commuter’s mode choice behaviour: Model-Fit comparisons with Rum-Modelling (case: Comparison between Matsuyama and Yogyakarta). In Proceedings of the 1st International Symposium on Transportation Studies for Developing Countries (ISTSDC 2017); MATEC Web of Conferences, Hasanuddin, Sudan, 3–5 November 2017. [Google Scholar]
  22. Irawan, M.Z.; Putri, M.K.; Belgiawan, P.F.; Dwitasari, R. Analyzing Commuters’ Behavior on Egress Trip from Railway Stations in Yogyakarta, Indonesia. Open Transp. J. 2017, 11, 53–66. [Google Scholar] [CrossRef]
  23. Hyodo, T.; Montalbo, C.M., Jr.; Fujiwara, A.; Soehodho, S. Urban Travel Behaviour Characteristics of 13 Cities based on Household Interview Survey data. J. East. Asia Soc. Transp. Stud. 2005, 6, 23–38. [Google Scholar]
  24. Irawan, M.Z.; Sumi, T. Motorcycle-based adolescents’ travel behaviour during the school morning commute and the effect of intra-household interaction on departure time and mode choice. Transp. Plan. Technol. 2012, 35, 263–279. [Google Scholar] [CrossRef]
  25. Dharmowijoyo, D.B.E.; Susilo, Y.O.; Karlström, A. Analysing the complexity of day-to-day individual activity-travel patterns using a multidimensional sequence alignment model: A case study in the Bandung Metropolitan Area, Indonesia. J. Transp. Geogr. 2017, 64, 1–12. [Google Scholar] [CrossRef]
  26. Irawan, M.Z.; Munawar, A.; Dewanti; Muktaf, F. Analyzing the Effect of Trip Pattern on the Mode Choice Decision of LRT in Palembang City. In Proceedings of the the World Congress on Engineering, London, UK, 4–6 July 2018; pp. 145–148. [Google Scholar]
  27. Yagi, S.; Mohammadian, A. Joint Models of Home-Based Tour Mode and Destination Choices: Applications to a Developing Country. Transp. Res. Rec. J. Transp. Res. Board 2008, 2076, 29–40. [Google Scholar] [CrossRef]
  28. Dharmowijoyo, D.B.E.; Susilo, Y.O.; Karlström, A. Day-to-day variability in travellers’ activity-travel patterns in the Jakarta metropolitan area. Transportation 2016, 43, 601–621. [Google Scholar] [CrossRef]
  29. Lekshmi, G.R.A.; Landge, V.S.; Kumar, V.S.S. Activity Based Travel Demand Modeling of Thiruvananthapuram Urban Area. Transp. Res. Procedia 2016, 17, 498–505. [Google Scholar] [CrossRef]
  30. Statistics of DKI Jakarta Province. Jakarta in Figures; Statistics of DKI Jakarta Province: Jakarta, Indonesia, 2017; ISBN 0215.2150.
  31. Google Maps Bekasi—Google Maps. Available online: https://www.google.co.id/maps/place/Bekasi,+Kota+Bks,+Jawa+Barat,+Indonesia/@-6.2614904,106.7753868,10.75z/data=!4m5!3m4!1s0x2e698c6900964f69:0xd00495351896398!8m2!3d-6.2382699!4d106.9755726 (accessed on 18 August 2018).
  32. Irawan, M.Z.; Munawar, A.; Dewanti. Pemodelan Dan Penyusunan Pedoman Standar Pemilihan Tipe Angkutan Umum Perkotaan Di Indonesia; Universitas Gadjah Mada: Yogyakarta, Indonesia, 2017. [Google Scholar]
  33. Statistics of Bekasi Municipality. Bekasi Municipality in Figures; Statistics of Bekasi Municipality: Bekasi, Indonesia, 2017; ISBN 1907.3763. [Google Scholar]
  34. Dissanayake, D.; Morikawa, T. Household Travel Behavior in Developing Countries: Nested Logit Model of Vehicle Ownership, Mode Choice, and Trip Chaining. Transp. Res. Rec. 2002, 1805, 45–52. [Google Scholar] [CrossRef]
  35. Yagi, S.; Nobel, D.; Kawaguchi, H. Time Series Comparison of Joint Mode and Destination Choice Models in Changing Transportation Environment. Transp. Res. Rec. J. Transp. Res. Board 2013, 2394, 100–110. [Google Scholar] [CrossRef]
  36. Wen, C.-H.; Koppelman, F.S. The generalized nested logit model. Transp. Res. Part B Methodol. 2001, 35, 627–641. [Google Scholar] [CrossRef] [Green Version]
  37. Menon, A.; Lam, S.; Fan, S. Singapore’s road pricing system: Its past, present and future. ITE J. 1993, 63, 44–48. [Google Scholar]
  38. Olszewski, P.; Xie, L. Modelling the effects of road pricing on traffic in Singapore. Transp. Res. Part A Policy Pract. 2005, 39, 755–772. [Google Scholar] [CrossRef]
  39. Taylor, B.D.; Miller, D.; Iseki, H.; Fink, C. Nature and/or nurture? Analyzing the determinants of transit ridership across US urbanized areas. Transp. Res. Part A Policy Pract. 2009, 43, 60–77. [Google Scholar] [CrossRef] [Green Version]
  40. Levinson, D.M.; Zhao, J. Introduction to the Special Issue on Value Capture for Transportation Finance. J. Transp. Land Use 2012, 5, 1–3. [Google Scholar] [CrossRef]
  41. Jain, S.; Aggarwal, P.; Kumar, P.; Singhal, S.; Sharma, P. Identifying public preferences using multi-criteria decision making for assessing the shift of urban commuters from private to public transport: A case study of Delhi. Transp. Res. Part F Traffic Psychol. Behav. 2014, 24, 60–70. [Google Scholar] [CrossRef] [Green Version]
  42. Sohoni, A.V.; Thomas, M.; Rao, K.V.K. Mode shift behavior of commuters due to the introduction of new rail transit mode. Transp. Res. Procedia 2017, 25, 2603–2618. [Google Scholar] [CrossRef]
  43. Diao, M. Towards sustainable urban transport in Singapore: Policy instruments and mobility trends. Transp. Policy 2018, in press. [Google Scholar] [CrossRef]
  44. Nasri, A.; Zhang, L. The analysis of transit-oriented development (TOD) in Washington, D.C. and Baltimore metropolitan areas. Transp. Policy 2014, 32, 172–179. [Google Scholar] [CrossRef]
  45. Hasibuan, H.S.; Soemardi, T.P.; Koestoer, R.; Moersidik, S. The Role of Transit Oriented Development in Constructing Urban Environment Sustainability, the Case of Jabodetabek, Indonesia. Procedia Environ. Sci. 2014, 20, 622–631. [Google Scholar] [CrossRef] [Green Version]
  46. Soltani, A. Social and urban form determinants of vehicle ownership; evidence from a developing country. Transp. Res. Part A Policy Pract. 2017, 96, 90–100. [Google Scholar] [CrossRef]
Figure 1. Multinomial logit model structure.
Sustainability 11 00788 g001
Figure 2. Nested logit model structure.
Sustainability 11 00788 g002
Figure 3. Cross-nested logit model structure.
Sustainability 11 00788 g003
Figure 4. Location map of Jakarta Metropolitan Area (JMA) [31].
Sustainability 11 00788 g004
Figure 5. (a) Initial tour type of commuters; (b) Tour type selected.
Sustainability 11 00788 g005
Figure 6. Modal share of commuters from Bekasi to Jakarta.
Sustainability 11 00788 g006
Figure 7. Modal share for hwh tour type.
Sustainability 11 00788 g007
Figure 8. Modal share for hw+wh tour type.
Sustainability 11 00788 g008
Table 1. Sets of choices of alternatives in the model.
Set of ChoicesDescription
Alternative 1 (HWH_MC)Decision-maker takes hwh tour type and chooses motorcycle as a mode of travel to commute
Alternative 2 (HWH_CAR)Decision-maker takes hwh tour type and chooses a car as a mode of travel to commute
Alternative 3 (HWH_BUS)Decision-maker takes hwh tour type and chooses a public transport bus as a mode of travel to commute
Alternative 4 (HWH_KRL)Decision-maker takes hwh tour type and chooses KRL commuter line train as a mode of travel to commute
Alternative 5 (HW+WH_MC)Decision-maker takes hw+wh tour type and chooses motorcycle as a mode of travel to commute
Alternative 6 (HW+WH_CAR)Decision-maker takes hw+wh tour type and chooses a car as a mode of travel to commute
Alternative 7 (HW+WH_BUS)Decision-maker takes hw+wh tour type and chooses a public transport bus as a mode of travel to commute
Alternative 8 (HW+WH_KRL)Decision-maker takes hw+wh tour type and chooses KRL commuter line train as a mode of travel to commute
Table 2. Sample profiles in the study.
VariablesCategoryFrequencyPercentage
Socio-demographic characteristics at individual level [32]
GenderMale29269.52
Female12830.48
Travel purposeFull-time worker41298.10
Part-time worker81.90
Household characteristics [32]
Monthly incomeLow income < 4 million IDR14534.52
Medium income 4–6 million IDR11828.10
High income > 6 million IDR15737.38
OwnershipVehicle ownership37789.76
Car ownership7016.67
Tour types characteristics [32]
Tour types of commutershwh - Motorcycle5613.33
hwh - Car122.86
hwh - Bus4911.67
hwh - KRL174.05
hw+wh - Motorcycle16138.33
hw+wh - Car389.05
hw+wh - Bus4610.95
hw+wh - KRL419.76
Characteristics of population and study area
Population, employment, and geography situationCityBekasi City [33]Jakarta [33]
Population (million)2.80310.937
Survey area (km2)210.49662.33
Population density (person/km2)1141315,517.38
Total number of commuters [1]204,240
Number of commuters surveyed (N) [32]420
Table 3. Summary of model performance for MNL, NL, and CNL.
Utility CoefficientMNLNLCNL
EstimateRobust t-statEstimateRobust t-statEstimateRobust t-stat
Alternative-specific constants
Motorcycle0.69 *1.580.57 *1.600.24 *1.23
Car4.454.344.084.714.976.39
Bus2.344.942.215.632.247.30
KRL1.00 (fixed)NA1.00 (fixed)NA1.00 (fixed)NA
Scale parameters
λhwh 0.556.010.99 ***2.01
λhw+wh 0.99 (fixed)NA0.224.83
Household characteristics
Dummy: low income for motorcycle users5.385.27
Dummy: high income for car users0.43 ***2.35
hwh
Dummy: low income for motorcycle users 6.593.763.532.65
Dummy: high income for car users 0.50 **1.750.763.56
Dummy: female for bus users 1.425.080.763.58
Dummy: female for KRL users 0.40 *1.130.20 ***2.48
hw+wh
Dummy: low income for motorcycle users 5.235.585.203.94
Dummy: high income for car users 0.583.720.753.40
Dummy: part-time worker, travel purpose1.21 *1.130.97 *1.021.01 *0.99
Dummy: female for bus users 0.19 *0.50−0.09 *−0.30
Dummy: female for KRL users 0.63 **1.650.28 *1.05
Travel characteristics
Travel cost (Rupiah)−0.18 **−1.79−0.20−2.39−0.23−3.77
Travel time (min)−0.02−4.41−0.01−3.70−0.01−3.41
Dummy: female for bus users1.344.17
Dummy: female for KRL users0.71 ***1.89
Value of travel time (Rp/hr)1381.29627.86544.14
Summary statistics
Number of observations420420420
Number of alternatives888
Number of parameters121526
Rho square0.310.350.37
Adj. Rho square0.290.330.34
Null Log likelihood−761.2−761.2−761.20
Final Log likelihood−525.78−493.54−478.28
Likelihood ratio 64.4830.53
Chi-square statistic (for LR test) 6.25 (3, 0.10)17.28 (11, 0.10)
Table 4. Proposed policy implications to improve travel quality of commuters.
PolicyPolicy MakersDescription
Implementing congestion pricing schemeJakarta’s and Bekasi’s government
Toll operator
Road pricing and dynamic toll charges based on time, location and vehicle type by using smart technologies such as IU and cameras.
Subsidising the public transportJakarta’s and Bekasi’s governmentSubsidy for public transport to keep the ticket fare affordable for commuters in all social groups.
Improving level of service of public transportPublic transport operatorsIncreasing the level of service of public transport by improving reliability, comfort, and safety.
Implementing an integrated ticketing system
Expanding public transport network and mass transit planningJakarta’s and Bekasi’s government
Public transport operators
The expansion of the public transport network can be both rail-based (MRT, LRT) and road-based (BRT)
Planning of mass transit for commuters
Land use controlJakarta’s and Bekasi’s governmentPlanning an integrated transport hub by implementing transit-oriented development in the central business district in Jakarta

