1. Introduction
Sustainable development of countries increasingly depends on planning, designing, realizing, and continuously upgrading sustainability and livability of cities and neighborhoods at the meso- and micro-scales, respectively [
1,
2,
3]. As urban populations, on average throughout the world, have already surpassed rural populations, sustainability of urban centers is increasingly decisive of economic growth, social inclusion, exploitation of environmental resources and peoples’ livelihoods. For city-states and small-sized countries such as Singapore and Qatar, respectively, where there is a single major metropolis, sustainability and sustainable development are not much of a choice.
Qatar strives to be recognized as a truly sustainable and responsible state in the global community, and this aim is endorsed by the 2030 Qatar National Vision and the National Development Strategy 2032 [
4,
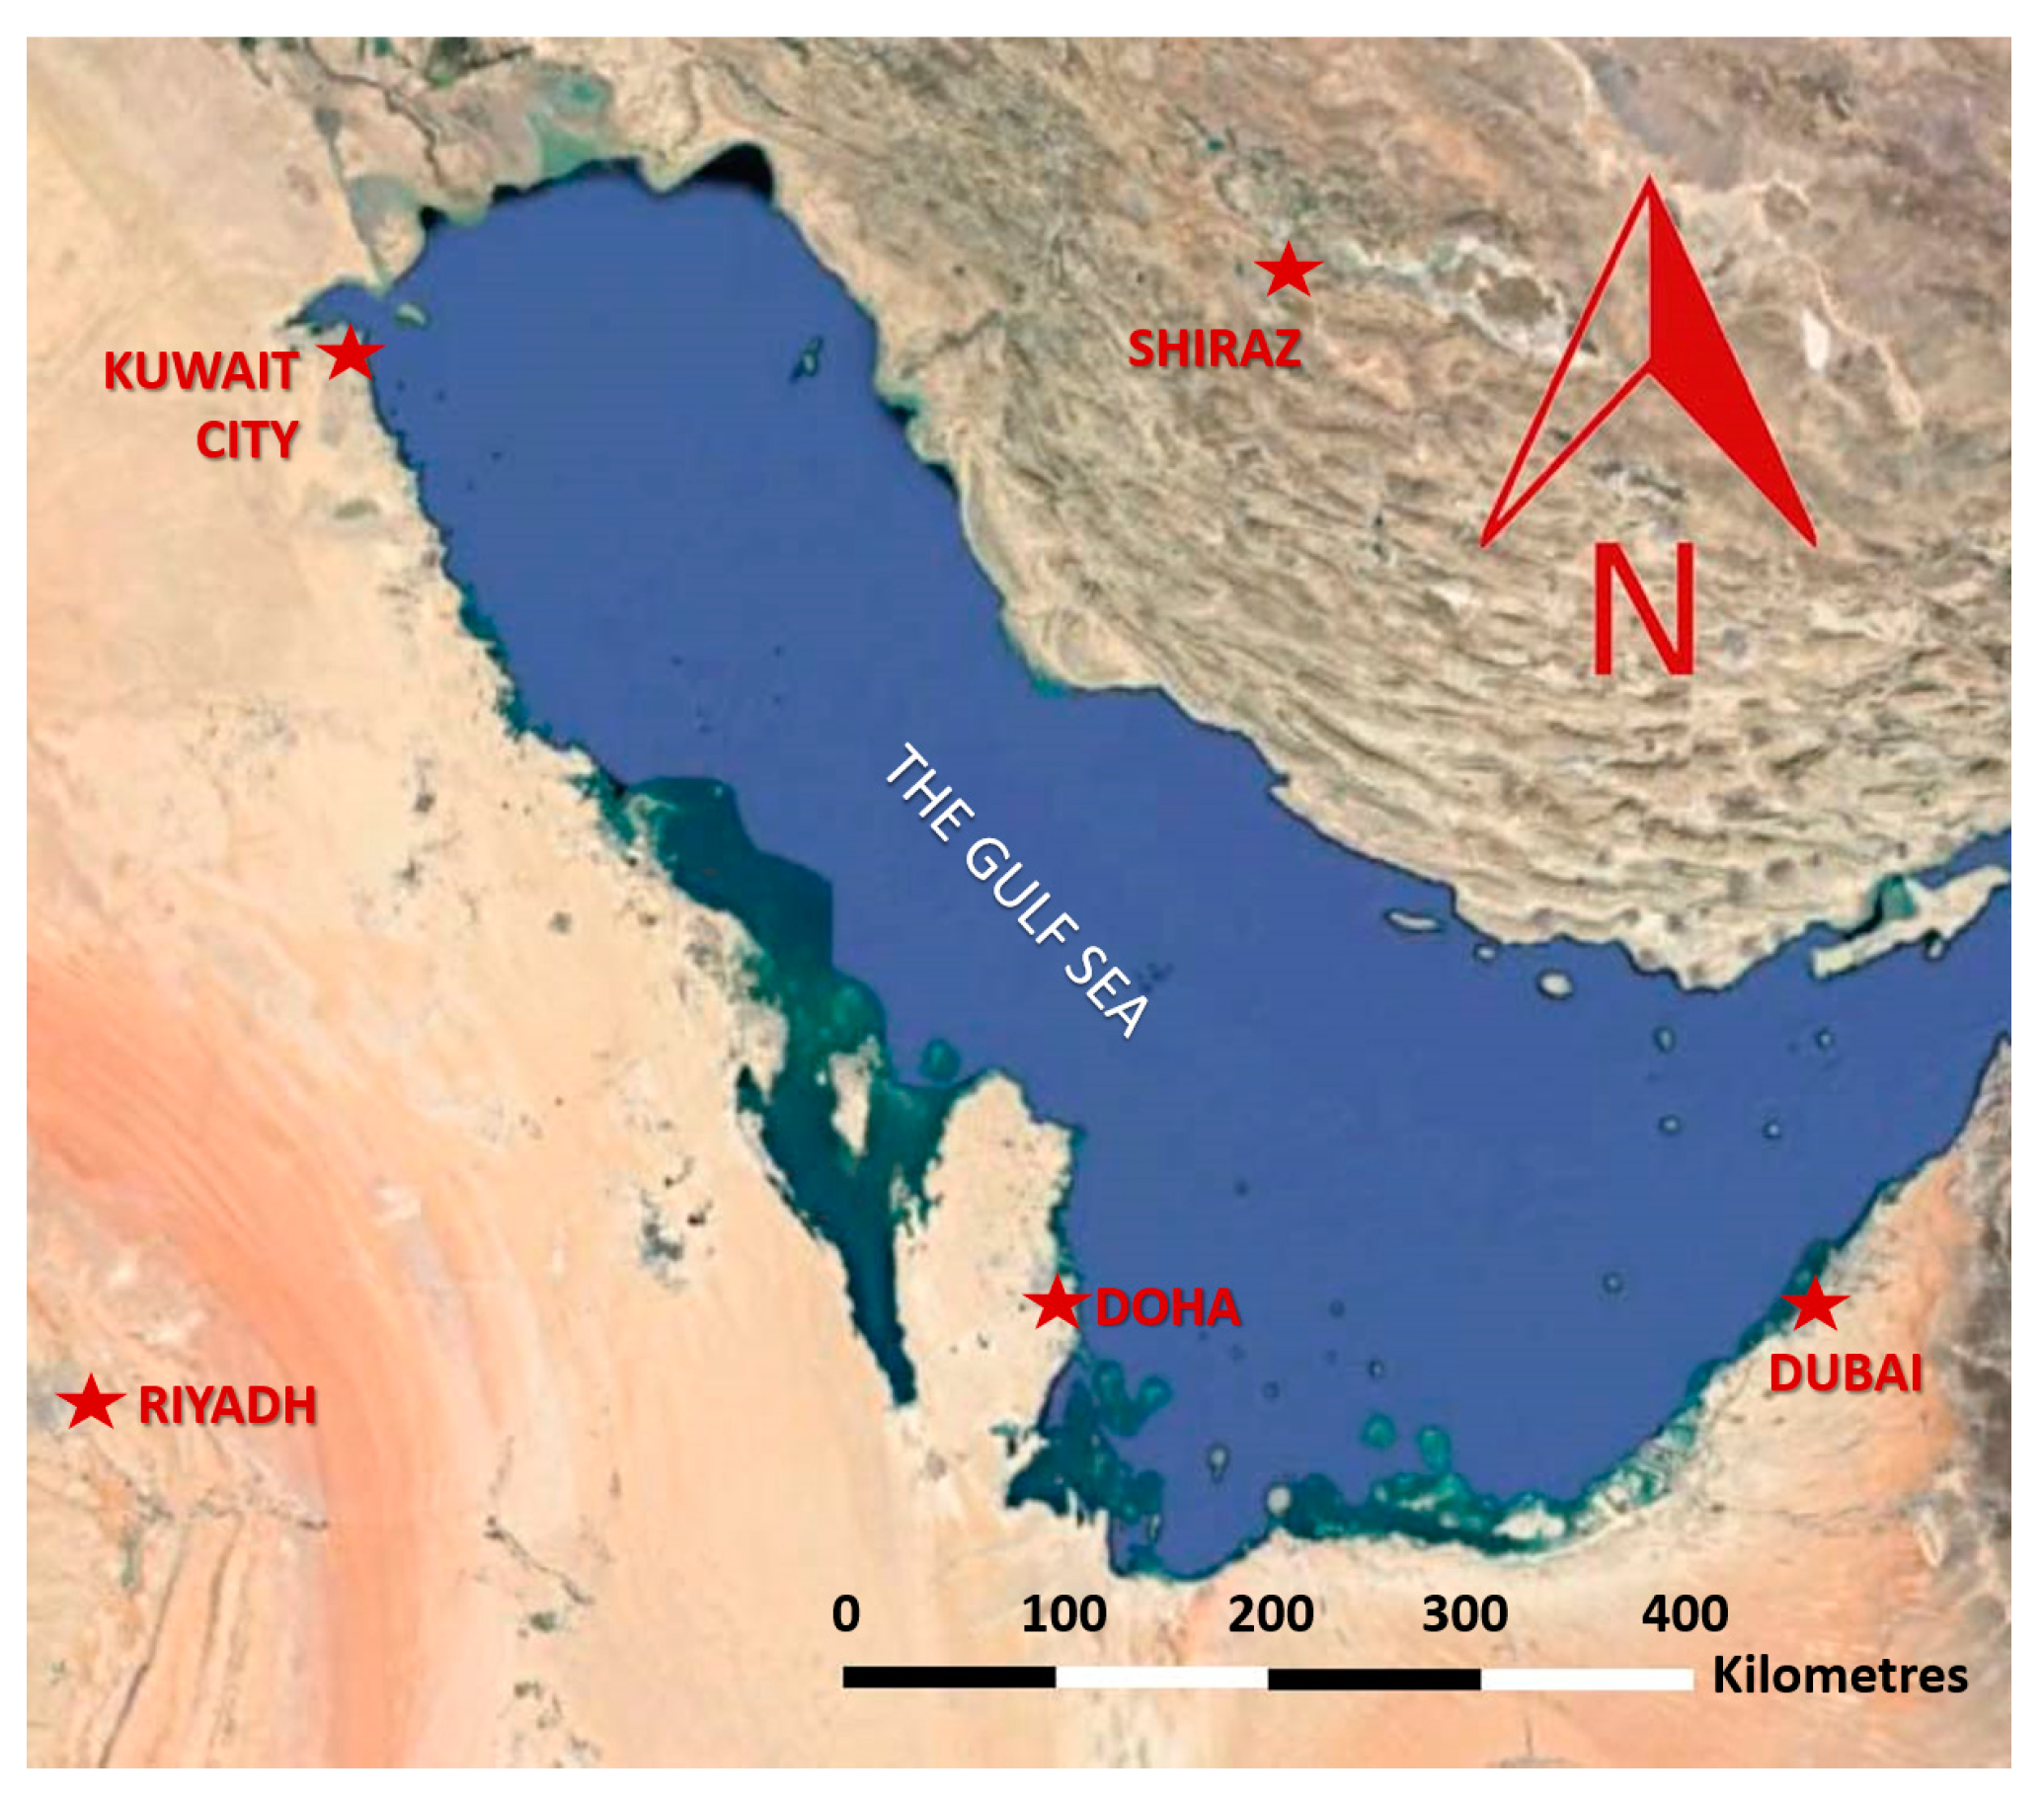
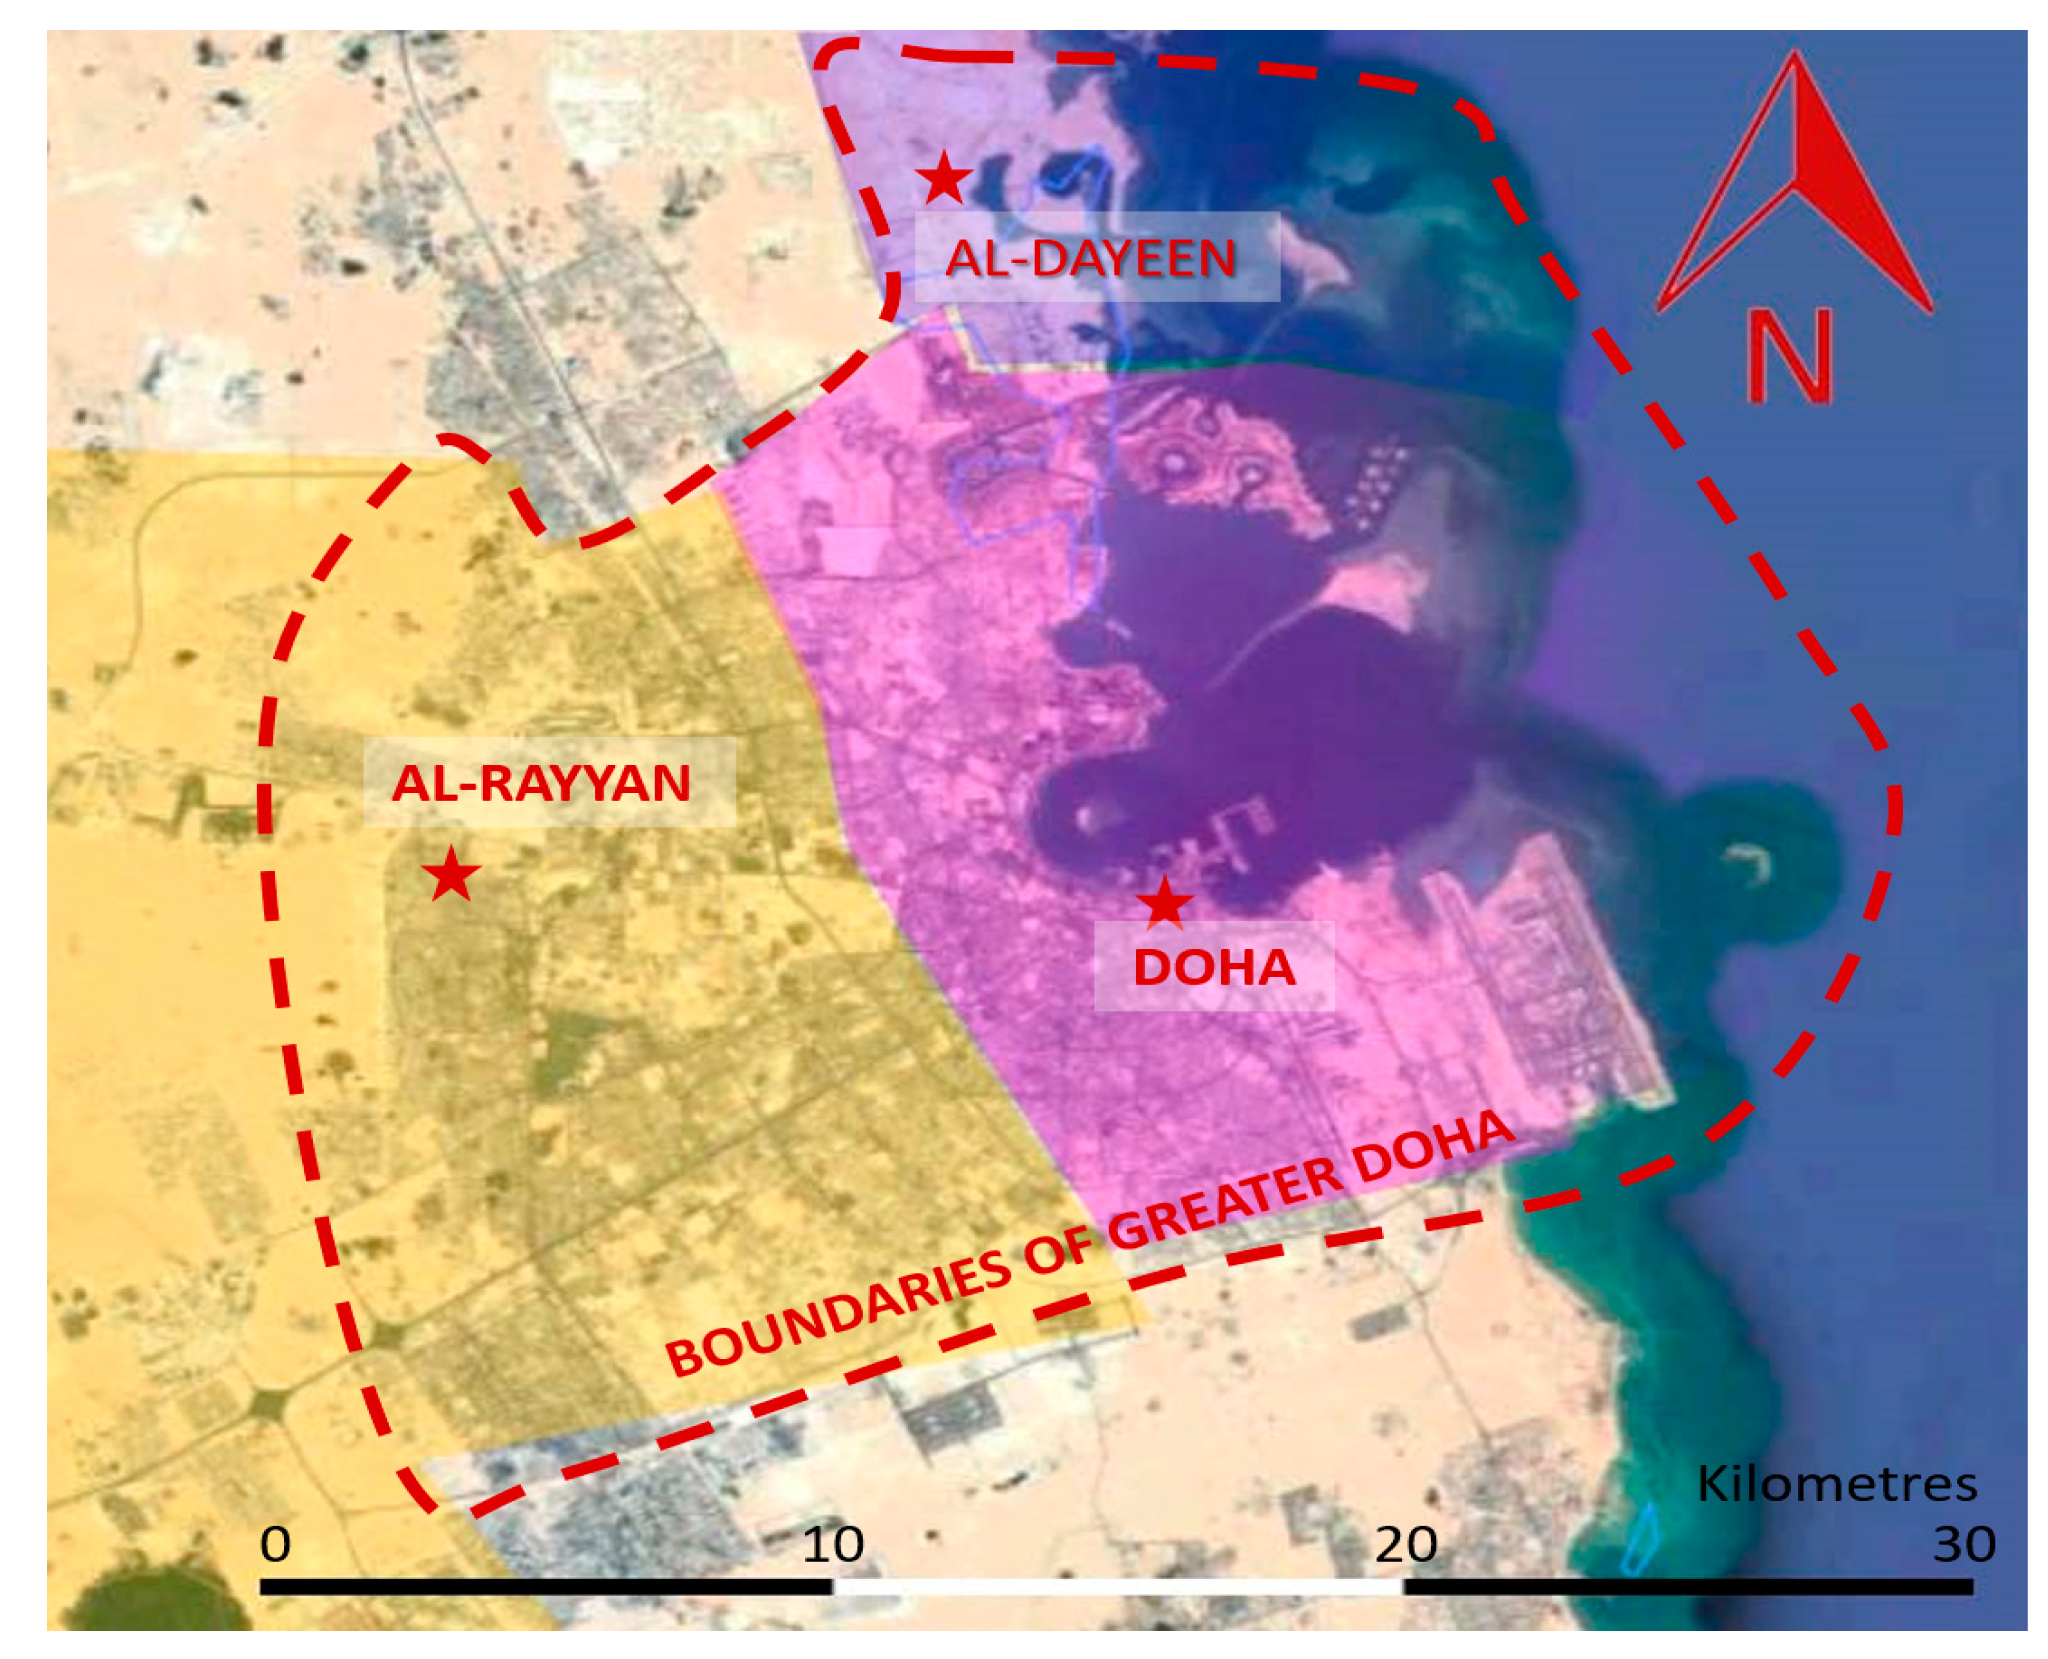
5]. However, in its current form, Greater Doha (including parts of Al-Rayyan and Al-Dayeen Municipalities), Qatar’s capital,
Figure 1, and where 80% of the population resides, lags in many of the international city livability indices. Acknowledging that the carbon and eco-footprint of cities is one significant gauge of advancement in sustainability [
6], the inevitable question that follows, however, is “How can Doha’s urban form be transformed to help achieve Qatar’s national sustainability targets?”
Doha is in many ways a fractured city where the rapid growth has led to extensive urban sprawl with very high dependence on private-vehicle transportation, mostly large-sized SUVs, due to the lack of reliable and proper public transportation. Doha is a relatively low-density city. The powerful driver of Doha’s current urban form is the deep-set desire of the population for home-ownership of detached villas, which have become the predominant residential neighborhood form with little provisions of local neighborhood services and amenities [
7]. Consequently, this has led to long and frequent commutes to work, shopping venues, socialization, and recreation centers, affecting all individuals and families and increasing the number of vehicles in traffic, multiplying traffic congestions, heightening transportation-related CO
2 emissions, adding expenses of time among several other environmental, social and economic sustainability impacts.
Two well-known approaches currently prevail in designing for sustainability in cities. The first emphasizes a city’s environmental performance. In the recent past, this approach has often led to the compact city concept where high density is sought to sharpen efficiency of resource exploitation, and thus, reduce environmental burdens. Cities, such as Hong Kong and Singapore, have been regarded as exemplars of the efficacy of their public transportation and for maintaining local services that are within walking distance of a sufficiently large catchment population to preserve economic sustainability [
8]. The second approach focuses on the social sustainability, dealing mainly with increasing the citizens’ quality of life. This, in return, has led to the concept of city livability as an important requisite for sustainability. Indicators of city livability, such as the Economist’s annual Liveablity Index, have regularly ranked relatively low-density cities, such as Melbourne, high on the scale; hence, questioning assumptions posed by the first approach that regards high-density in an urban center as a prerequisite of sustainability [
9].
The association of compact cities with sustainability is not only questioned by the recognition of low-density, but also by recent developments in smart transportation, smart communication and internet technologies, and innovative arrangements (e-commute, e-health, e-school, etc.). There now seems to be sufficiently rapid developments to indicate, with some certainty, that there will be a paradigm shift required to move away from current vehicle ownership norms and private-transportation needs [
10,
11].
Extensive infrastructure investment has been underway to provide an effective road network. And with the provision of an extensive metro and public bus transportation system, congestion is expected to be reduced and transportation-associated environmental burdens are anticipated to be alleviated [
12]. However, it is still not clear whether these measures will be sufficient to significantly improve livability, and thus, the overall sustainability of Doha, and Qatar at large. To address such a complex question, this study will investigate proper approaches for making a low-density city, such as Doha, both livable and sustainable considering its overall contextual circumstances and ongoing initiatives.
In this study, the concept of livability is examined at the neighborhood level as neighborhoods are the most elemental component of a city, and they firsthand relate to the concept of livability [
1]. Although neighborhoods may exist in both high and low density, the study considers low-density residential neighborhoods, as they make up the predominant urban form of residence communities in Doha. Moreover, demographic predictions indicate that Doha and Qatar’s population has peaked for the foreseeable future, ceasing new urban development [
5]. Future emphasis will, therefore, be on urban renewal and refurbishment– with limited new construction works such as infill and/or redevelopment of parking lots, low-density shopping malls, etc., rather than new development projects [
5]. This study, thus, focuses on Doha’s existing residential neighborhoods and commences with an examination of how residents perceive their existing neighborhoods and their openness to the new car ownership norms and mobility patterns likely to emerge in Qatar as they become increasingly prevalent worldwide. This paper presents results of the conducted attitudinal survey, which mainly sought local residents’ views on neighborhood improvement and changes of transportation modes.
2. Background on Doha, Qatar
Many of Qatar’s current major urban centers that were close to Doha were once separate residential settlements, such as Al-Rayyan and Al-Dayeen [
13]. The first professional masterplan of Greater Doha by British consultant Llewelyn-Davies, in 1972 [
14], recognized that the Doha Municipality should become the central downtown core for all other established urban centers, such as Al-Rayyan to the northeast and Al-Wakra to the south. However, Qatar’s rapid population growth, fueled by hydrocarbon exploitation and subsequent accumulated wealth, has accelerated growth into an urban sprawl that effectively merged previously separate settlements of Al-Rayyan and Al-Dayeen into one conurbation, herein termed Greater Doha, shown in
Figure 2 [
5]. Today, this historic precedence is reflected in Greater Doha’s governance, where there are still separate municipalities for Doha, Al-Rayyan, and Al-Dayeen.
The first comprehensive Greater Doha masterplan acknowledged the country’s characteristically low-density urban form and relayed on the abundance of private cars and the low price of fuel to make the transportation aspect of the masterplan a workable solution [
7]. Decades of relatively uncontrolled urban sprawl followed, resulting in people often spending extensive time commuting daily between the city center(s) and other parts of Greater Doha. Consequently, there has been regular traffic congestions and associated air pollution problems. Moreover, the urban form has made it difficult to distinguish geographical boundaries of the original settlements, and thus making it difficult to discern any unique residual identity [
5].
The existence of this condition is acknowledged by the “Qatar National Development Framework 2032”, reiterating that the previous centers of Al-Rayyan and Al-Daayen have been subsumed within Greater Doha. However, this has resulted in Greater Doha becoming a multi-centric metropolis [
5], a state described by many current urbanists such Robert Lang and Jennifer LeFurgy, as first defined and articulated during the turn of the twentieth century by Jean Gottman and Gordon Willey as an important prerequisite for industrialization and rapid development of cities [
15].
2.1. The Development of the Old Doha City
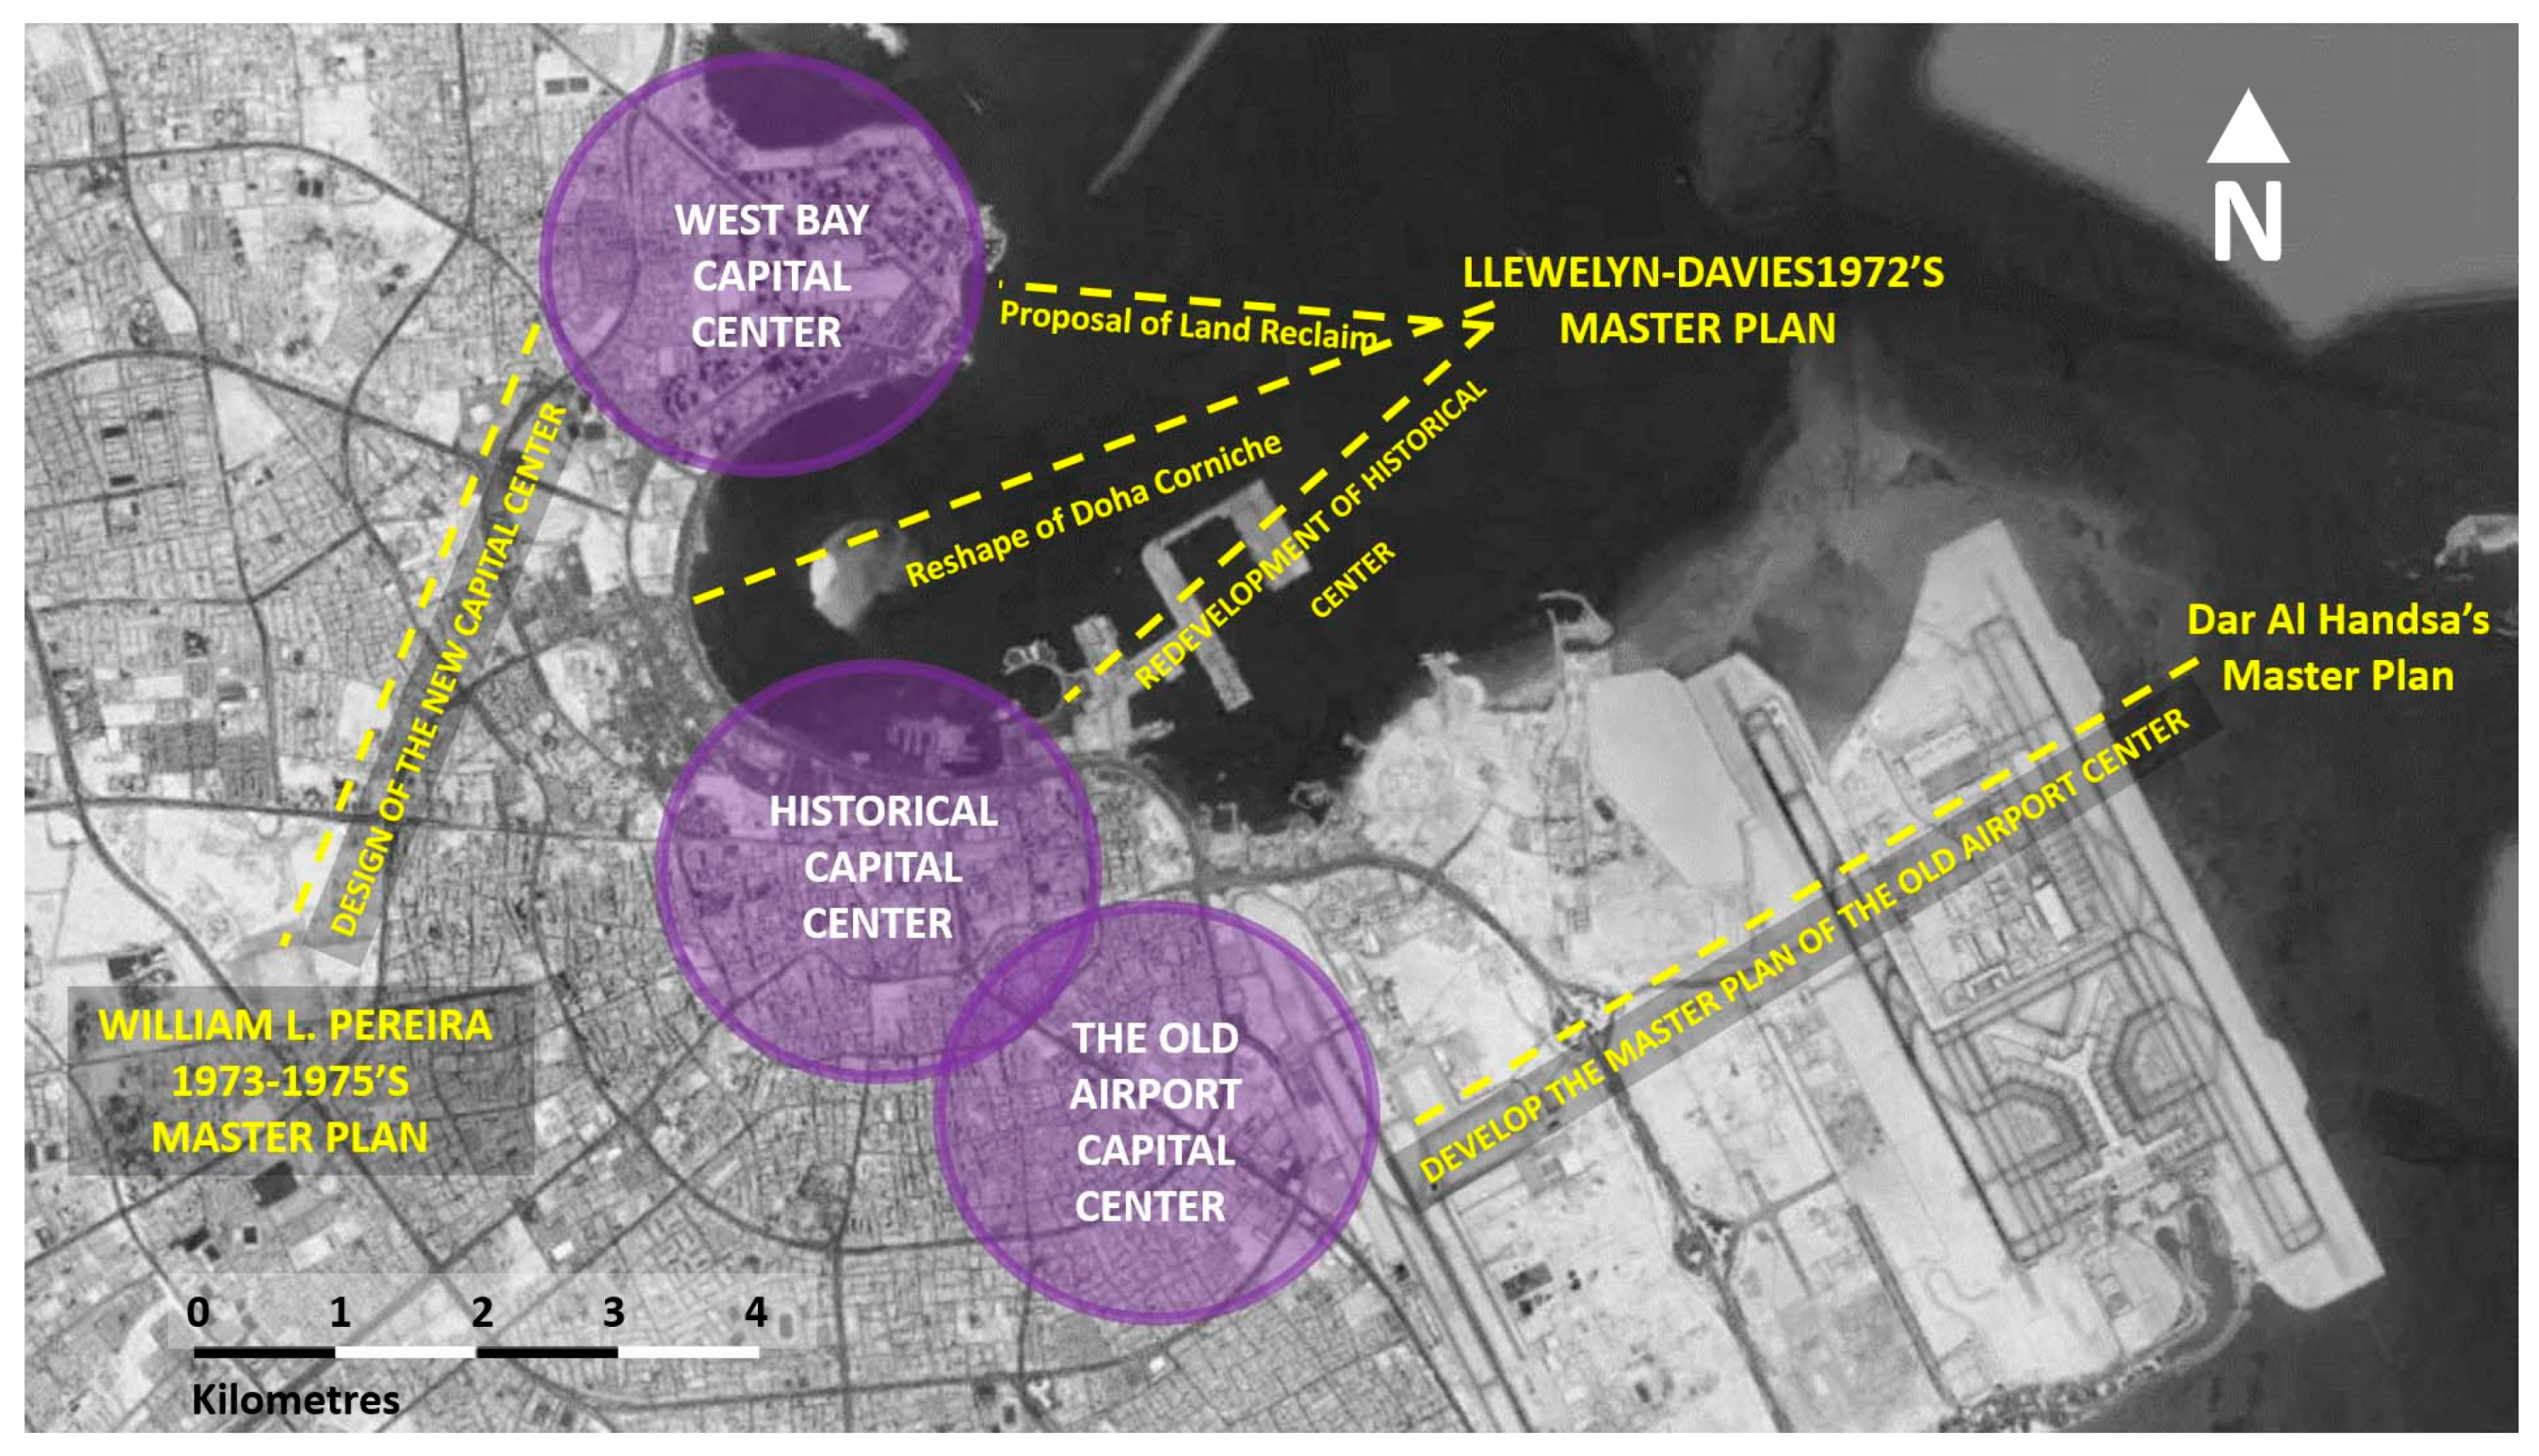
The municipality of Doha is comprised of multiple centers. The most distinguishably identifiable are the southern historic center, shown in
Figure 3, built around the old tribal neighborhoods, the new northern centers, such as West Bay, the Pearl and Education City, and the less distinguishable, relatively undeveloped Old Airport area [
14].
The southern center contains many of the historic features of the original Doha city. At the core of this center is the Amiri Diwan, and Souq Waqif lies to the south. This center witnessed the first characteristics of modernity in the city of Doha during the early 1950s. It had paved roads of modernization, having the first hospital and school in Qatar within a walking distance from the surrounding neighborhoods [
16]. To the west is the Musheireb district, which is currently being redeveloped as the Heart of Doha project, a most commendable example of sensitive urban renewal [
17]. This southern center remained compact for many years as walking was the typical means of movement between neighborhoods. In 1972, the Government of Qatar appointed the British consultant Llewelyn-Davies to work with Doha Municipality to conduct surveys and studies of Doha and propose a masterplan. The first Llewelyn-Davies’s proposed master-plan was only limited to the old Doha Center. However, some issues such as compactness, availability of land, and the government’s desire for a city that reflects Qatar’s wealth, extended the scheme to include both the Corniche and the West Bay. Both of these areas were not inhabited at the time of developing the Llewelyn-Davies Masterplan [
18].
Throughout the 1970s, Qatar’s economy grew rapidly, the population and job opportunities increased, so the demand of land for residential and commercial development also significantly increased. Land lots became relatively expensive, so many of the tribal families retained their properties in the historic center, refusing to sell them to the government to enable re-development. The persisting resistance hindered execution of the Llewelyn Davies Masterplan, which was eventually frustrated. The government, therefore, declared alternative housing for Qataris, who were living in the old city center, at substantial distance from any of the government-sponsored masterplan proposals.
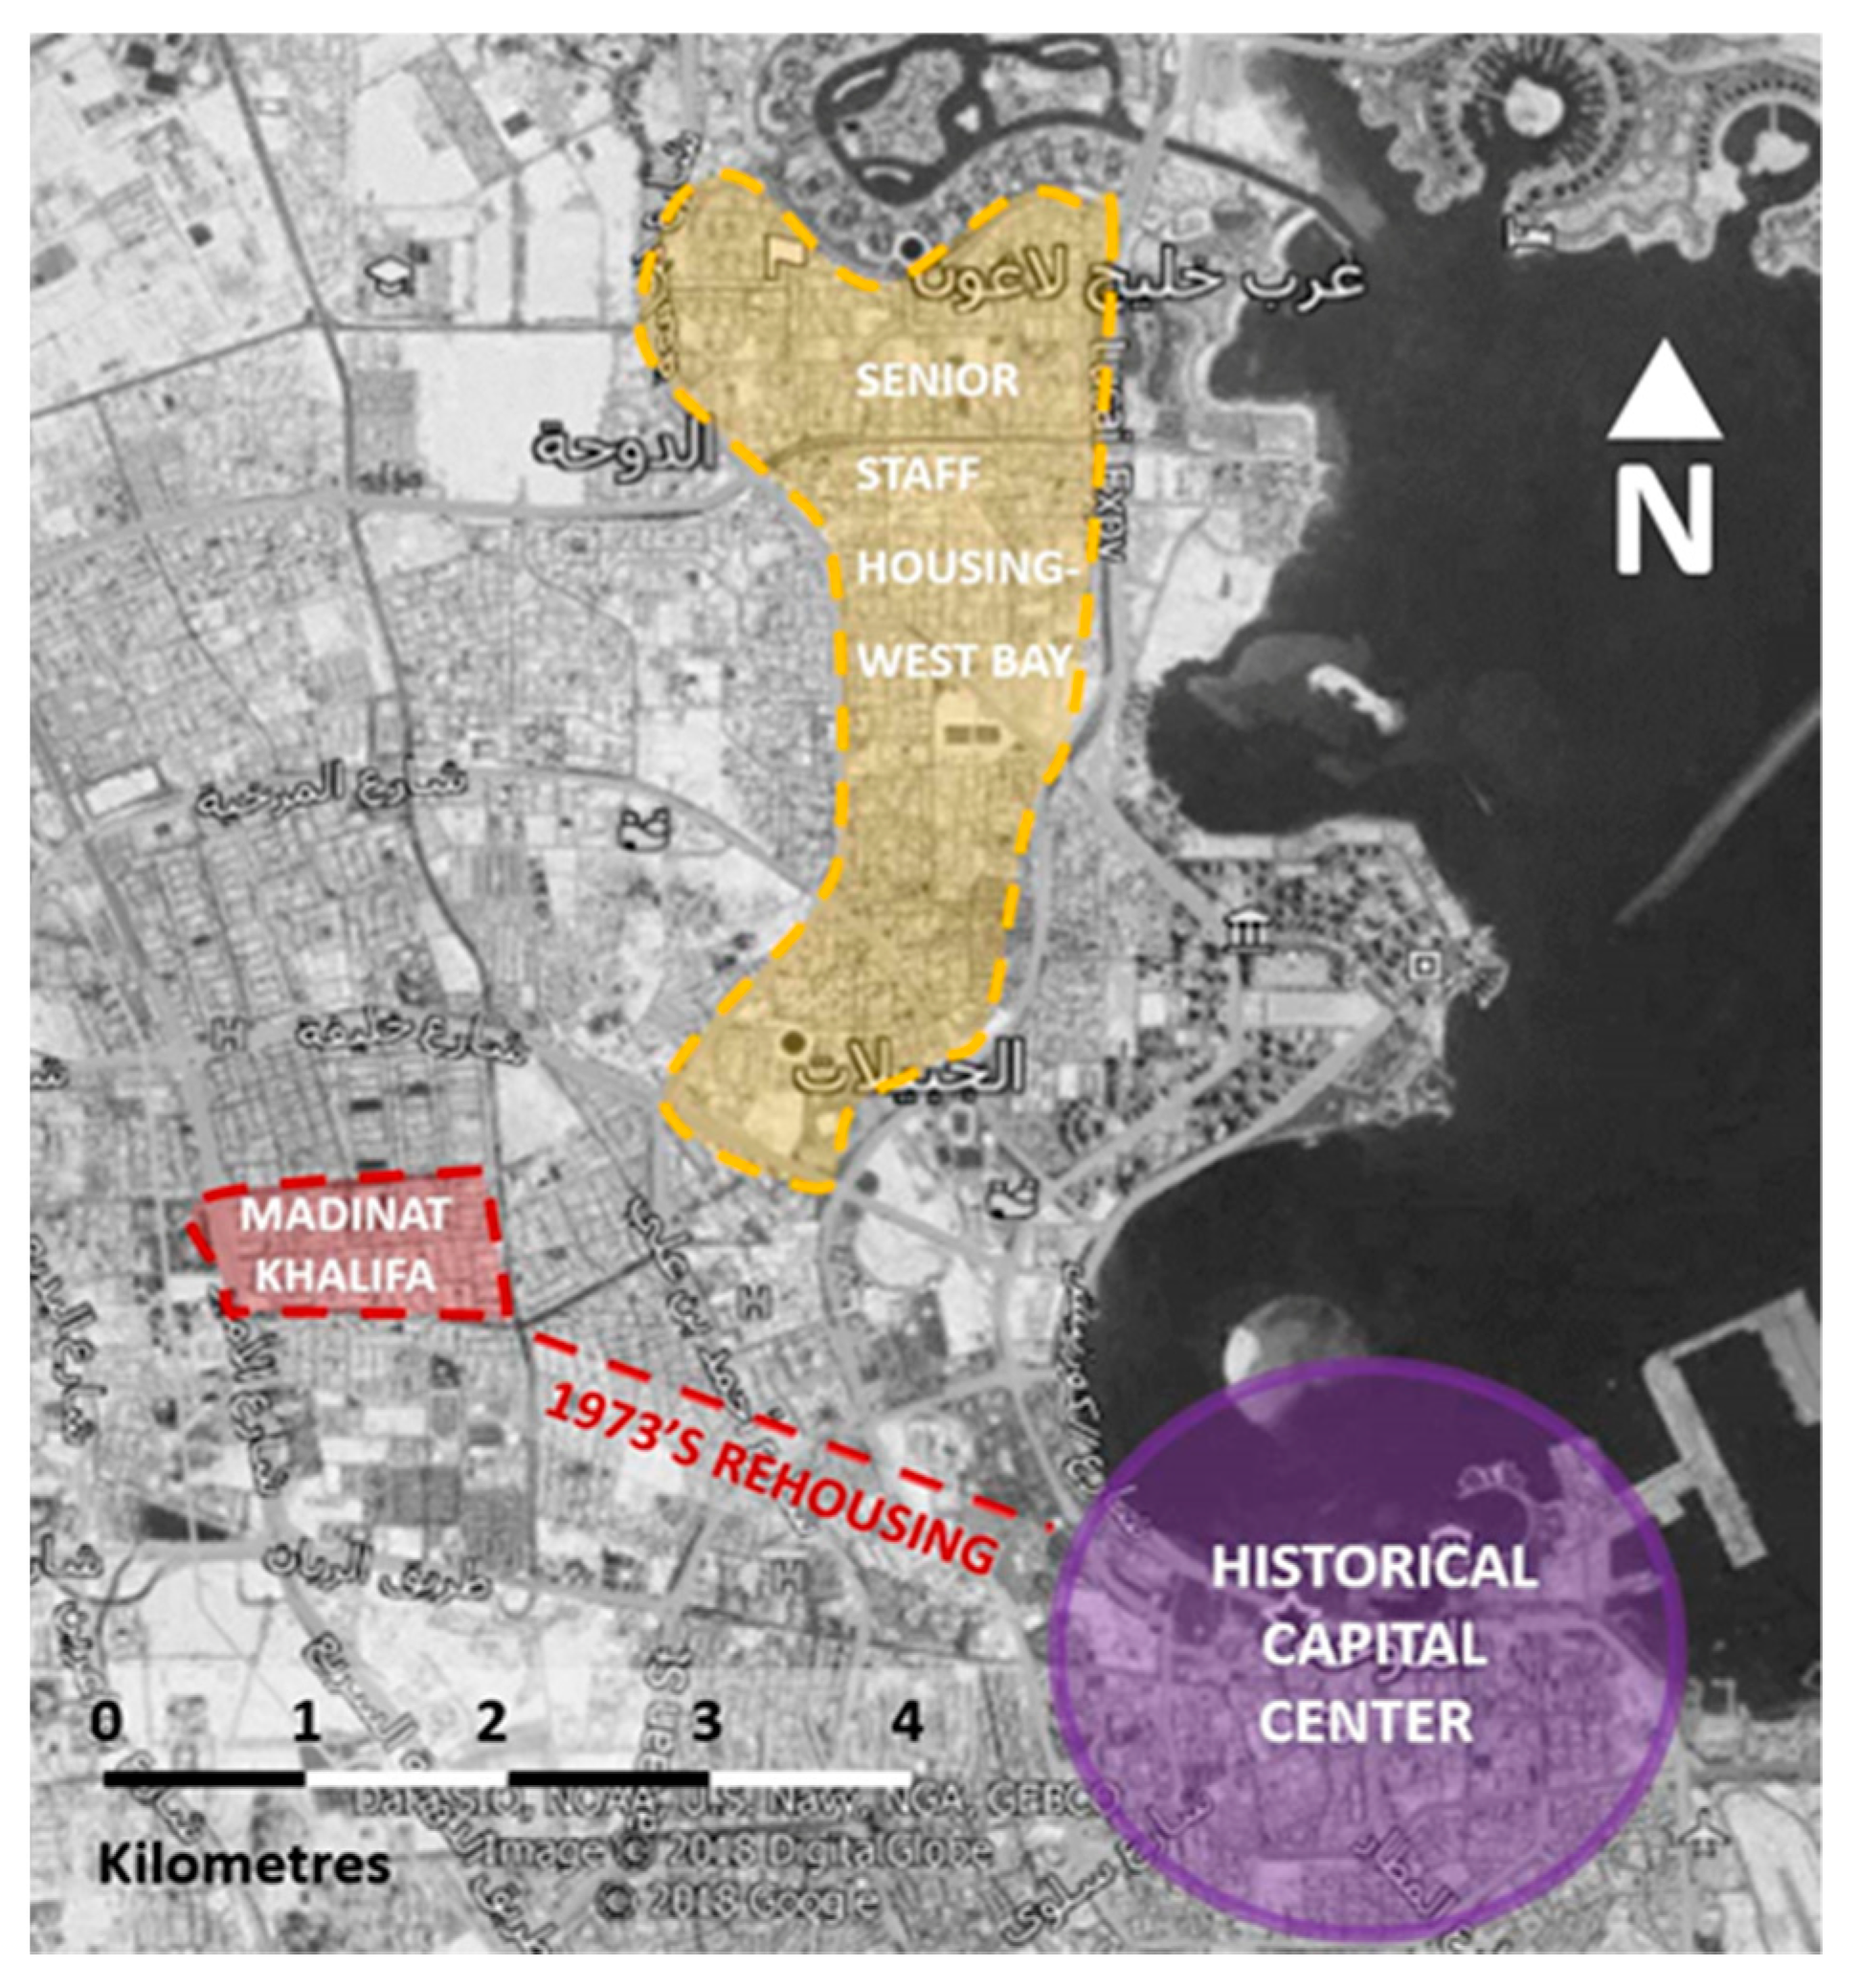
The Madinat Khalifa area, shown in
Figure 4, was selected as the location of the housing project to ease the housing and development problems encountered by the government at the old city center. The Madinat Khalifa housing project was completed in the early 1970s, and inhabitants of many of the old neighborhoods were rehoused in this new landmark project [
19]. The accommodation provided had many unique characteristics, compared to then traditional residential neighborhoods. The new homes were no less than three times the size of traditional houses and were surrounded by an outside space, making each house detached rather than having a shared internal courtyard and terrace. The standard modern Qatari villa was thus created. Both the birth of this new and highly desirable low-density housing form and the use of private cars has transformed most of Qataris’ lifestyle, expectations, and social norms. Therefore, in creating norms for much of the subsequent development of Greater Doha, the significance of the Madinat Khalifa project, cannot be understated [
20].
The second center that the government took on to alleviate the development restrictions encountered in the old city center was the Al-Dafna area, originally a very shallow part of the Gulf, north of the old city center. In the 1970s, the Doha Municipality took the decision to reclaim this portion of the coastline to build a second central downtown area for the city of Doha. It was believed that land reclamation would be the most economically feasible solution as it sidestepped the seemingly intractable problem of land ownership. Between 1978 and 1981, the land was reclaimed from the Gulf waters [
21].
The surge in oil prices in the 1970s was a factor that greatly helped supporting the idea of developing the new center. Subsequently, William L. Pereira Associates were appointed to plan a new modern central area at the reclaimed land of Al-Dafna. Pereira Associates’ plan included a central commercial area with a national conference center, a business district—Al-Dafna Towers, an area for Senior Staff Housing, an Intermediate Staff Housing area, and a Diplomatic Area. The now landmark Sheraton Grand Doha Resort & Convention Hotel was duly built. Construction of the Senior Staff residential project started during the same time of constructing the Sheraton Hotel during the early 1980s. However, the Pereira Associates scheme was not fully implemented, as the decline of oil prices in the early 1980s meant that most of the plans set by the scheme were to be put on hold [
14]. The result was that West Bay/Corniche and Al-Dafna areas remained stagnant, in terms of new development projects, for a decade until the late 1990s when many of the restrictive municipal regulations relating to the previously envisioned Business District were changed, most notably the limitations to building heights. In addition, regulations on mixed-use developments were rescinded [
22].
Nevertheless, proposals of Pereira Associates did have significant impacts. The Senior Staff Housing introduced and popularized new design standards for residential villas in Qatar. Senior Staff Housing plots were no less than 30 by 30 m (900 m
2). Thereafter, citizens were given low-interest loans to build their own houses according to their personal preference, on similar size plots. Such residential developments were inevitably low-density, producing a population of 25 to 35 people per hectare, with residential neighborhoods containing between 4000 and 5000 people. These Senior Staff Housing standards, since, spread to become a norm for the residential real estate market in Qatar [
20].
The third area within the city of Doha identified by the Doha Municipality for expansion was the Old Airport Area. Dar Al-Handsa Consultancy, an organization originating from Lebanon, was appointed to develop a masterplan for the newly selected area. However, due to the fall in oil prices in the mid-1980s, Doha municipality also abandoned development of this part of Doha. Ramifications of this decision still impedes the progress of that district to this day. The area continues to show signs of high fragmentation, largely devoid of distinguishing planning characteristics [
7].
After June 1995, the country has propelled itself along a path of rapid progressive political, economical, and social liberalization due to dramatic shifts in the political and economic approaches by Sheikh Hamad Bin Khalifa Al-Thani as soon as he ascended to rule in Qatar [
23]. This led to a sharp increase in the rate of economic growth and resulted in a significant increase in the wealth of the average Qatari citizen. What followed was the period of sprawling urban growth discussed previously, mostly in the form of suburban sprawl. Newly established quasi-governmental development organizations also emerged. Intending to flex their generously funded financial muscle both in Qatar and abroad, these development organizations created a series of expansive urban development mega-projects within and around Doha [
5].
In 2014, the Doha Municipality published a new, visionary masterplan, the Qatar National Development Framework 2032, which differed from its predecessors as it acknowledged the necessity of maintaining a degree of flexibility in delivering an effective masterplan of Greater Doha through a broad strategy that could give the city’s multi centers the freedom to make internal planning decisions in conjunction with raising transportation efficiency among the centers [
14]. It also encouraged mixed use development within each center, thus making each of them more self-sufficient, obviating much of the need to travel out of the district center. It addressed topics such as the integration of multiple socioeconomic groups, food security, and environmental sustainability. It also stressed the importance of walkability and the possibility of increasing pedestrian movement around transportation hubs [
5].
2.2. Qatari Social Norms and Residential Areas
Social norms are the behavioral principles that are accepted and/or adopted by a society. These norms may stem from the collective perceived, experienced, interpreted, and/or communicated interactions as internalized by a society’s social actors. Though these norms are noninstitutionalized, nonetheless there is a tendency, by a society, to comply with these compelling forces of being normative. The broad concept of social norms comprises family norms, professional norms, religious norms, etc. Social norms have a strong influence on the use and the form of urban spaces as well as daily habits of a people [
24].
In the particular case of the Gulf Cooperation Council (GCC) countries, the especially strong sense of social solidarity of the Gulf peoples is becoming increasingly fragile as a result of the rapid urbanization and manipulation of community organization, according to a statement by the World Bank [
25]. The World Bank proposes and encourages urban development projects that pay increased attention to participatory approaches during conceptualization and operation, or pursue any means of directly involving communities as primary stakeholders of urban development, stressing the importance ensuring the acceptance of change by the society [
25].
In light of the historical background of major development projects taking place in the 1970s and the 1980s, in Qatar, Qatari families, as well as the increasing number of expatriate families of diverse origins, grew in favor of single-family villas, some quite large, located on the outskirts of Doha where land is less expensive and distant from the relatively higher-in-density city centers. Inevitably, this new arrangement has led to the formation of expansive, low-density suburban areas. The newly developed northern part of Doha also attracted expatriates who mostly live in residential compounds, which depict another characteristic of the current urban form that has notably emerged in Qatar, as well as in other GCC countries. Although derived from gated-community models in the USA [
7], Doha’s residential compounds tend to have higher densities and smaller lot size than their stateside forbearers, composed of terraced or semi-detached houses with very small private gardens.
The social norms, especially of housing, are a key challenge to the developmental future of Qatari cities. This matter has not been the subject of academic research or investigation. To address this issue, structured interviews were conducted with people from the first municipality period to gain an understanding of the development of the local social norms in Qatar. Buqal Salman, a long-serving engineer in the Doha Municipality since it was established in 1972, has witnessed historical legislation milestones that influenced planning and development of Doha; and Yacob Al-Mass is a Qatari historian who had worked for the Department of Municipality Affairs since the late 1960s. During his tenure, Al-Mass witnessed the establishment of the Municipality of Doha in 1972, the first governmental housing project in Madinat Khalifa in 1973, and the construction of Al-Dafna area during the 1980s. He experienced first-hand key urban planning events and their influence on the Qatari social norms.
Yacob Al-Mass stated that Madinat Khalifa 1973 was the first government housing project, and it was not easy for people to move from the old center to the new project because they were too attached to their original houses and neighborhoods. Buqal stated that both government housing projects, Madinat Khalifa and Al-Dafna, were based on Neighborhood Unit Theory principles [
26]. The neighborhood surrounded a school, had many amenities, and had a public realm. Many of the residents enjoyed the available features. However, the reason that many other residential areas in Qatar lack these features was because it was owned by a private developer, and though the government provided these areas with some infrastructure, the government could not force them to provide all of these features. This explained the randomness of the masterplan of Doha and patchiness.
3. Literature Review—Sustainability and Livability
Given that communities cannot be sustainable unless they create a place/environment where people perpetually want to live, livability, by definition, is an axiom and an instrument of sustainability. In 2004, discourse on the relation between sustainability and livability was initiated by David Godschalk by adding the livability dimension to Scott Campbell’s Conceptual Triangle of Conflicts, hypothesized in 1996 [
27,
28]. For over a decade, however, sustainability has been conflated with livability, leading to, in most instances, both terms being used interchangeably. Putting both concepts in perspective, theoretically, sustainability is concerned with achieving long-term goals of economic, environmental, and societal wellness, primarily with regard to future demands of continuous growth. Livability, on the other hand, is concerned with currently available conditions of a place to achieve immediate effects in meeting the urban needs of the residing community. The general experience of the place with regard to transportation, social and environmental interaction decide on making the place more, or less, livable. While sustainability may appear to be the more idealistic, more appealing concept, in practice, however, livability is manifested and measured favorably [
29].
Considering that sustainability and livability differ in efficacy scale, future outlook, and preferential context of a community, the interlinks between them balance a nexus that is useful to urbanists and policy makers alike. One interlinks—making sustainability livable—relates national sustainability of the larger community, e.g., a country, to locales, allowing for independence and distinctiveness in the realization of broad economic, environmental, and social goals. The reciprocal interlink—making livability sustainable—sanctions livability resources, investments, and interests within a large, shared vision of national sustainability to which local livability ventures contribute, forging drive and a common sense of purpose [
30].
3.1. The Sustainable Urban Form
In the 1990s, the idea of compact cities was encouraged for increasing social integration and improving economic conditions. Compact cities decreased the need for new infrastructure and increased the efficiency and feasibility of public transportation systems [
31]. This vision was perceived to be mainly European and did not reflect American or Australian cities [
8]. The idea of a compact city was often a monocentric one. And by centralizing the city around one axis, the demand for housing and services increased, which impacted affordability, thus degrading the livability and quality of life, which included security, social equality, and healthcare [
31]. It has to be acknowledged that compact, high-density cities may not be the only form for realizing sustainability, especially when it comes to the promotion of livability and quality of life factors [
32]. In fact, the two approaches are not mutually exclusive and can be enhanced by in-depth urban planning.
3.2. Livability and Urban Form
Quality of life is the subjective first-person experience of individuals, or groups, in a society with regard to standards of wellbeing, in general [
33]. Livability is the equivalent term to quality of life, used to describe experience of residents of urban centers. The American Association for Retired Persons (AARP) considers a livable community to have “affordable and appropriate housing, supportive community features and services, and adequate mobility options, which together facilitate personal independence and the engagement of residents in civic and social life” [
34].
The Global Liveability Index (GLI), by The Economist Intelligence Unit, emerged as an important index for measuring cities’ quality of life [
35]. The aim of the Liveability Index is to quantify challenges possibly faced by individuals that their livability and quality of life. World cities are assigned scores for over 30 qualitative and quantitative factors across the five broad categories of stability, healthcare, culture and environment, education, and infrastructure [
35]. Low-density cities of Australia and Canada have always been ranked among the most livable cities in comparison to other cities from around the globe [
35], perceived as capable of offering higher quality of life.
Typically, low density creates more affordable housing, especially in a country that has less restrictions and relaxed regulations of land-use, as is the case for Qatar. Low-density urbanism also improves living standards by means of boosting social inclusiveness and equity [
36,
37]. Additionally, low-density cities can be rather resilient and adaptable to future trends and conditions [
37,
38]. They can also provide a safer and healthier outdoors, encouraging people to socialize, and children to play in parks and public spaces [
36,
39]. A disadvantage of the low-density urban form is that it renders public transportation hardly feasible and incapable of covering the entire road network of a city [
40]. As a result, low-density can pose an environmental challenge that is the high carbon footprint of transportation. The widespread of residences also pose a challenge in the availability of commercial, education, health, and civic service venues to serve many residential settlements [
41]. However, low-density settlements are appreciated for being spacious living environments that provide privacy and the availability of housing plots, outdoor spaces that benefit families with a healthier lifestyle [
41]. The concurrent arguments for high density can be split into categories. Firstly, the high efficiency of public transportation and city-provided public services, and secondly, the available social and economic benefits, such as increased social integration and thriving businesses. Research, however, shows that the efficiency of public transportation and city services are affected by factors such as personal income and affordability, which have great influence on the use of public transportation [
9]. Studies show that doubling the density of a city’s residents will reduce the number of private car trips, but does not halve it. In addition, very dense cities are less affordable for the poor, perpetuating the misdistribution of socioeconomic groups and the absence of social cohesion [
37]. Finally, low-density grants more space that can be dedicated to on-site energy generation, water recycling, and food production, aiding cities in being highly self-sufficient [
42].
3.3. Smart Technology
Technology has had tangible impacts on urban planning. Technology has changed the form of world cities [
43], especially in transportation and communication. Technologies such as autonomous, self-driving cars and car sharing schemes may help rethink how cities are developed. Such technologies could have the potential to transform sizable areas dedicated to cars and transportation vehicles such as the conversion of parking lots for commercial or recreational use. Studies [
11,
44] propose that the use of car sharing schemes can encourage people to walk and use public transportation systems.
Information and communication technology (ICT) have also formed a new type of infrastructure that facilitates services to communities. The use of smart grids and smart meters for power and water transmission, reduced waste, increased transparency, and reliability of services. Tele-health/Tele-medicine services connect hospitals to remote facilities for consultation, diagnosis, and medical training. These are examples in which ICT has added priceless features to basic human needs. ICT connects providers of public services closely with consumers, increases safety and security, and optimizes the efficiency of resource usage to generally better people’s lifestyles by smartening cities [
45].
3.4. Walkability
Active transportation has been addressed with relation to urban forms in numerous publications, branching out to especially tackle walking as a measure of the subject community’s socio-demographics. Density, land-use diversity, and accessibility are deciding factors of outdoor physical activities, including active transportation, e.g., walking and cycling. Residents of high-density urban centers, typically, tend to walk more. In general, it is noted that higher connectivity among neighborhood amenities and spaces, typical feature of high-density urban centers, can help improve neighborhood walkability [
46].
There are several elements that determine the extent of walkability in a community: “street connectivity, social safety, traffic safety, aesthetics, sidewalk quality, physical barriers, amenities, and others” were set as walkability factors by several studies [
47]. Many recent publications have discussed walkability, as well as other forms of active transportations such as cycling, but have made little to no mention of climatic conditions and their impact on walkability. Examining walkability with the weather variable could help ascertain and identify walkability patterns that may help in designing livable urban forms for neighborhoods and cities.
3.5. Sustainability and Livability Challenges in Doha
The Ministry of the Municipality and Environment (MME) addresses Greater Doha’s urban problems in its document “Qatar National Development Framework 2032” [
5], and proposes medium- and long-term solutions. In the medium term, it is foreseen that the transport regimes of the three municipalities will be significantly changed by completion of the metro system. In the long term, opportunities for self-sufficiency in food, water, energy, and even employment are to be created.
Doha City, through its evolution, has grown into a multi-center city. The economic drives created by oil and gas wealth and Qatar’s aspiration to global prominence prompted the creation of new centers within Doha. These centers are functionally characterized, such as the business center in the West Bay and the research and development center in the Education City. The centers have economic roles in that they provide job opportunities and contribute to international migrations to Doha, increasing the country’s population. In return, the demand for residential units and the expansion of Doha horizontally in a low-density form accelerate [
48]. These centers lack reciprocal relationship with their surroundings, especially with residential neighborhoods. However complied with world-standards pertaining to the quality of the built-environment, socially, the centers of Doha remain constricted to certain classes of residents as determined by the availability of employment in these centers. The inhomogeneous relationship among centers and surrounding neighborhoods ought to be corrected in an integrative manner [
49].
Inhomogeneity has also encouraged random transportation patterns. In fact, this sort of available public transportation and private vehicles have widened the gap and increased social isolation in Doha, maintaining it as a low-density city and rendering public transport unfeasible. Doha’s future plans of developing a metro system also included the development of 12 transit-oriented development centered around metro stations to increase density. Low density and the prevalent social norm of traveling in private vehicles remain the two blatant challenges to sustainable transportation in Doha [
5].
The current form of multi-centered Doha could be enhanced to emphasize and develop a relation to surroundings of centers and create more homogenous city texture that reinforces sustainability and raises quality of life [
5]. One aspect of aspired homogeneity is walkability and it directly pertains to social cohesion, the provision of affordable services, health, and the environment. Several theories of urban planning, such as Garden City, Neighborhood Unit, and New Urbanism [
1,
50], examine the multicenter phenomena in relation to an urban unit. Residential neighborhoods, the rudimentary urban unit in a city like Doha, is associated by these theories with social cohesion through walkability. The success of the residential neighborhood as a sustainable element is difficult to be independent of the surrounding context and must be linked with other centers through a hierarchical relation [
14]. For example, Education City is the main metropolitan center of the southern of Al-Rrayyan city. Although this center is a place of work and education for many residents of Doha, as well as located within a location surrounded by large numbers of Qatar family houses, there is no correlation between Education City and its context negating functionality of walking. Thus, developing walkability is the most elementary building block of the low-density city, connecting it to its surroundings, rehabilitating it internally to meet the conditions that contribute to increased walking movement, social cohesion, and self-sufficiency, would eventually leverage suitability aspects at the city of Doha overall [
5].
Doha currently stands at a sustainability crossroads as it approaches the 2022 FIFA World Cup, requiring firm decisions to deliver the city and the country to a sustainable future. Overall, the main characteristics of Greater Doha are low-density and polycentrism. The current masterplan of the Greater Doha:
Encourages the uses of private cars and has no infrastructure for alternative modes.
Encourages urban sprawl through the randomization of government housing distribution and make it difficult for the Public Works Authority (ASHGHAL) to provide adequate infrastructure.
Lacks adequate provision of infrastructure for pedestrians in neighborhoods and cities. Roads lack good qualities for pedestrians’ external uses and activities.
Lacks public spaces. Parks and open-public spaces are few, suffer from non-conformity to the surrounding environment, and have limited safety measures.
Restrains neighborhoods from having amenities and services.
Fractures and fragments Doha city with no strategy to improve connectivity of a multi-centered city.
Livability:
Sustainability and livability have common grounds. Livable cities are often walkable, designed to human scale, and have a mixture of socioeconomic groups. The livability challenges of Doha are [
7]:
This city relies on the practice of zoning, i.e., dividing municipalities into zones of sectors, e.g., industrial, educational, residential, which go against the design to human-scale and the provision of a walkable environment.
There is no variety of housing and building in the city and neighborhoods, affecting their use and affordability.
The lack of public spaces.
In seeking a resolution to how Doha’s urban form can be transformed to help achieve Qatar’s national sustainability targets, the basic concepts hypothesized throughout this paper are as follows:
High density is not necessarily needed to make a city sustainable [
51,
52]. Published literature supports the notion that low-density cities can be sustainable [
53], where especially smart transportation can assist in approaching sustainability [
54].
Neighborhoods are a key part, for they are one of the essential building blocks of a city [
36,
55]. Sustainable neighborhoods can create a sustainable, low-density Doha by configuring livable communities that are both desirable and resource efficient through retrofitting existing neighborhoods, optimizing land-use and encouraging smart transportation and communication technologies that reduce the overall carbon footprint.
These notions may be the most appropriate solution to transform Doha into a sustainable and livable city. However, As Dr. Mike Jenks explained in “Future Forms and Design for Sustainable Cities,” urban forms are closely linked to local culture and social norms [
42]. Meaning, any proposal for a specific city must be examined against the social acceptability and the societal/behavioral norms of its people.
To approach sustainability and livability design for Doha, sample population attitudes are polled on communication technologies, transportation modes, and walkability, in addition to assessing major urban form criteria, specifically at the (meso-scale of cities): compactness, density, availability of amenities and mix-use [
56].
4. Methodology
Considering the hypothesis postulated in conclusion of the above
Section 3.5, a survey is a suitable tool to test and baseline the average attitude of people in Qatar towards walkability and smart technology.
Surveys are highly flexible research tools that can be used to examine a wide range of matters. In the case of non-experimental, descriptive designs that seek to reflect the current reality of a situation, as it is the case of a part of this research, a survey—consisting of a questionnaire—is a proper tool. Similarly, surveys are used to poll data on attitudes and behaviors, which is another measure of this study.
4.1. Preparation of the Survey
Sample surveys were first reviewed and used for refining the final distributed survey. The medium of the questionnaire was paper copies. The decision was based on consultation from the local Qatar Green Building Council, where they explained that, in Qatar, online surveys receive very low participation/response, and the same groups of people often participate in these online surveys; thus, the surveys do not reflect the entirety of the population. Additionally, online surveys are difficult to associate with specific geographic locations in Qatar. Therefore, it has been decided to opt for a paper-based survey instead of a digital one. In addition, paper surveys in Qatar will ensure a larger population sample, which can also be identified with specific locations. The research, thus, shall reflect views of different socioeconomic groups in Qatar by distributing it in various locations, resulting in more reliable and conclusive results. One survey limitation that should be noted is that the survey was written in Arabic for parents of students. Surveying primarily Qataris and Arab expats/residents, the survey was not distributed to bachelors or non-Arabic speakers.
4.2. Distribution of Questionnaires
The main objective of the distribution is to reach the largest number of targeted participants. With the assumption that parents readily attend by school request, the following standards are set:
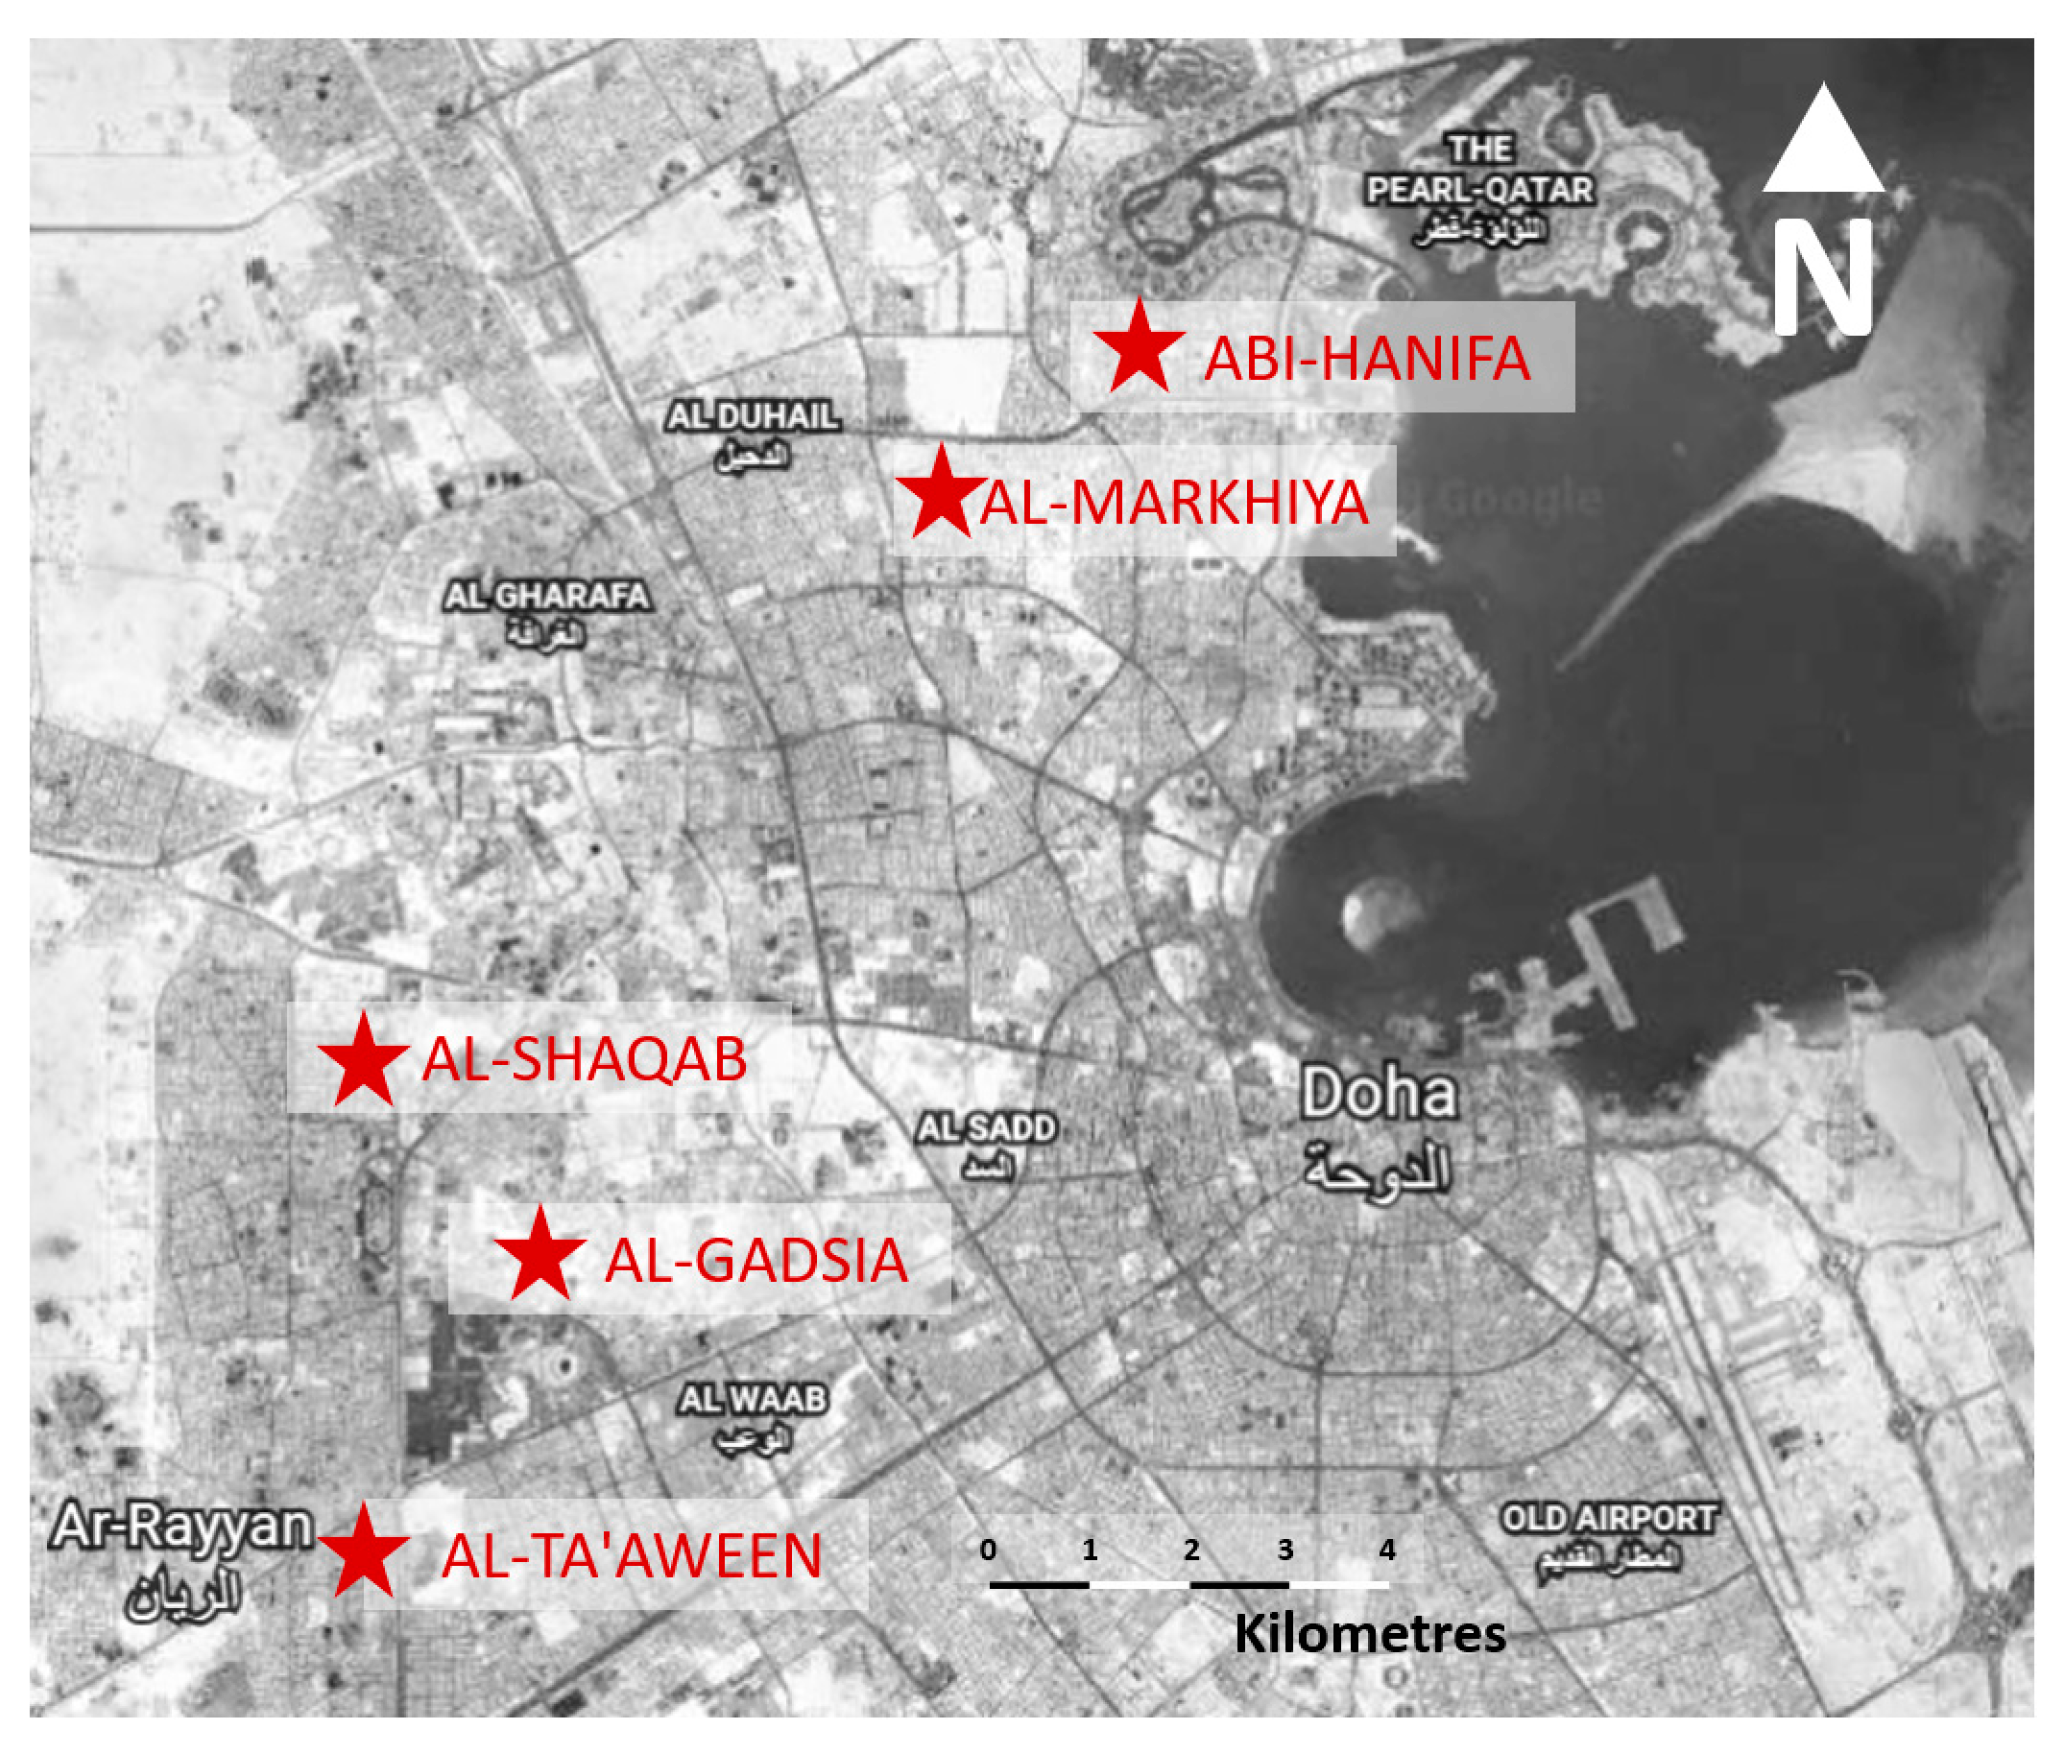
First, identify a primary school in the test-bed neighborhood. The selected neighborhood in Doha is Al-Markhyia, where two schools are located. Families with kids between the ages of 5 and 12 are targeted to potentially express their views on issues like public venues to take out children to play.
Second, the targeted participants to answer the questionnaire are the students’ parents, since families with children are the subjects of this poll.
Third, a controlled sample that reflects the attitude of families living in Qatar towards walkability and smart technology is targeted. Considering that limiting the questionnaire to Al-Markhiya would only reflect this area’s views on these topics, other highly-populated schools in Qatar were approached for participation. Two of the schools are located within an area developed by the government in the northern center of Doha, and three were in an area developed by private establishments (Muaether). As shown in
Figure 5, the schools where surveys were distributed are:
- ○
Abi-Hanifa Boys’ Primary School, Al-Gotifa,
- ○
Al-Markhya Girls’ Primary School, Al-Markhiya,
- ○
Al-Shaqab Girls’ Primary School, Muaether,
- ○
Al-Gadsia Girls’ Primary School, Murikh, and
- ○
Al-Ta’aween Girls’ Primary School, Al-Rayyan.
Finally, the permission for conducting this survey was obtained from the Ministry of Education and Higher Education. Principals (School Head) of the five selected schools were to administer the distribution and collection of the questionnaire in their schools within a period of a week.
4.3. Responses
Each of the schools received 200 questionnaires (given to 40 students of grades 2 to 6) totaling 1000 distributed questionnaires. The percentage of responses received from each of the selected schools varied:
Al-Gadsia Girls’ Primary School: 12%;
Al-Markhya Girls’ Primary School: 28%;
Al-Ta’aween Girls’ Primary School: 38%;
Abi-Hanifa Boys’ Primary School: 53%; and
Al-Shaqab Girls’ Primary School: 82%.
It was assumed that the low response rate, especially in one of the schools, was due to the level of the parents’ interest. Further enquiry about the method of questionnaire distribution, however, revealed the high response rate from the Al-Shaqab school was due to firm follow-up by the school management. Al-Shaqab school notified the parents with a deadline to submit responses and used a check-list to collect responses from students.
The background questions covered the information of gender, age, level of education, and profession. Answers to questions were all multiple-choice. The age categories were 20–30, 30–40, 40–55, and above 55 years. Professions were identified as private, office work, outdoors and technicians, and doctors and engineers. Education level was categorized as secondary school, bachelor, higher education, and none.
5. Findings
Statistically analyzed in
Section 6, a total of 420 responses were received, out of the 1000 questionnaires distributed. 71% of the respondents were female—assumed to be mothers of students. Overall, the survey shows that people have a positive attitude towards walking, and they generally enjoy the places they live in. However, there were concerns about safety and comfort that were raised. At the end of the questionnaire, polled individuals were asked to give general comments or feedback. Some of the feedback and comments shared by the respondents were: neighborhoods are well perceived if they include amenities; are strategically located in areas that easily access the main centers in Doha and are quiet. Numerous participants mentioned that they wish their neighborhood had shopping malls or shops. Some participants expressed wishes for their neighborhoods to have venues of healthcare services (clinics) and public parks (recreation areas). All survey responses and the Institutional Review Board (IRB) approval are available in
Supplementary Materials.
5.1. Attitude Towards Walking
There are four parts related to the design of a walkable urban form. First, the attitude and willingness to walk. Second, the feeling that it is safe and secure to walk. Third, the ease and comfort in walking. And finally, the enjoyment of the walking experience [
57].
Regarding safety and security, most participants who thought they generally felt safe and secure in their neighborhood also responded that their neighbors were family and friends. However, people who felt worried and unsafe had labor accommodation in their neighborhoods. In Qatar, short-term immigrants are predominantly males. It is perceived as inappropriate, by many Arab families, for single, male residents to share residence neighborhoods with families.
Some respondents expressed worry about passing cars, fearful about the safety of their children playing out on the roads. This worry led to expressing the lack of places for designated children as frequent driver violations of neighborhood speed limits. Also, some of the roads in the neighborhood are wide and can have regular, speedy car movement like that on highways. This restricts pedestrian and cyclist movement and is a source of discomfort to some families.
Additional amenities required by the people are the ones that encourage walking as well as social integration like shops and public parks to enhance their enjoyment of walking in the neighborhood.
5.2. Attitude towards Smart Technology
This questionnaire includes five sections. Each of these sections starts with an introduction to ensure that the participants are familiar with the topic:
E-health (this section has 2 questions): For the first question, the answers were generally positive. Participants believe that consistent monitoring will ensure better health services. The responses stayed positive when the participants learn that they would be diagnosed by a clinician through remote, smart devices.
E-learning and e-working (3 questions): For the first question, 70% of participants agreed that the quality of offered education can be trusted. In the second question, there was a consensus about the desire to live, work, and learn in the one neighborhood instead of going to other areas. A total of 63% respondents agreed that they preferred staying in their own neighborhoods. In the third question, 65% of the respondents agreed that e-learning and e-working might isolate community members and reduce interaction.
The last two sections of the survey are about private car and street use:
Safety and security: 75% of the participants believe that data collected from public routes are not private, and 84% after they have been told that the data would be classified.
Self-driving cars and car-sharing schemes: Unexpectedly, the responses to both questions were positive. However, many of the female participants wrote that they would not trust/feel safe in a driver-less car.
6. Analysis
There are several personal and environmental variables in this survey that may affect how results are interpreted. Some of these variables are gender, geographic location, neighborhood’s amenities and facilities, education and jobs/professions. The following questions attempt to interpret influence of these variables on the findings:
Where do differences in perceptions and opinions among males and females arise with respect to the entire questionnaire?
Are there differences in the abundance and proximity of businesses/facilities based on geographic location?
How do respondents view the various amenities available in their respective neighborhoods?
How do people with different educational backgrounds, and having different professions, view the technological advances that make up the informational backbone of smart cities?
6.1. Gender
To explore the difference between opinions and perceptions of males and females with regards to the questions raised in the survey, a four-grade scale was used, shown in
Table 1. Lack of response by some respondents has been taken as having no opinion on an issue, thus, the “neither agree nor disagree” category was introduced to account for these non-responses.
The chi-square test is commonly employed to measure if there is a statistically significant difference between the responses of two independent groups [
58]. For each issue, the null hypotheses
H0, is formulated and assigned. For the gender variable, it implies that that there is no difference between men and women’s opinions regarding a certain issue. The idea is to estimate the probability that the observed opinions arose purely by chance given the
H0 is true. The 5-grade responses to all of the questions are tallied, conditioned by gender, giving rise to a 2 × 5 contingency in
Table 1 for every question analyzed.
Note that because of the data imputation strategy used for this particular analysis, the percentages in each row necessarily add up to 100%. By a visual inspection of the counts, there appears to be significant difference in the percentages of males vs. female who strongly disagree on the issue, as well as the percentages of those who strongly agree. It is unlikely that the difference arose out of mere chance. Chi-square analysis,
Table 2, will either confirm or refute intuition.
What is relevant to the study here is the asymptotic significance (2-sided) for the “Pearson Chi-Square”. The two-sidedness indicates that the genders are evaluated symmetrically. The obtained “p-value” of 0.004 is the probability of the null hypothesis being true. In other words, there is only a 0.4% chance that the null hypothesis was true, and the observed counts were just due to random chance. This means the null hypothesis could be reasonably neglected to conclude that there is a statistically very significant difference between male and female opinions on the issue being considered.
The remark at the bottom of
Table 2, “2 cells have expected count less than 5,” ascertains that the minimum expected count is 1.31”. This is due to only a few no-responses which have been taken to be a case of “neither agree nor disagree”. According to conventional wisdom of statistics, the Chi-square analysis is reasonably reliable as low as 80% of the cells have a count of 5, which is true in this case. The analysis is performed for all of the questions, giving rise to the following
Table 3. The questions where the p-value is less than 0.05 are denoted with an asterisk “*” and where it is less than 0.10 with “~.” The former is regarded as indicating “quite strong evidence against the null hypothesis”, and the latter as indicating “relatively strong evidence against the null hypothesis”.
It is seen that for a few questions, the opinions/perceptions of males vs. females differ widely. Before analyzing the reasons for this observation, the analysis is repeated for joining the “strongly disagree” and “somewhat disagree” categories into a single “disagree” category, and the “strongly agree” and “somewhat agree” categories into a single “agree” category and regarding the missing values as in fact missing data in
Table 4.
Justifications of the grouping approach:
It is quite reasonable to treat disagreement vs. agreement as a binary variable, even if some responses are grouped for easing calculations. The advantage of this approach is that certain cases where the “strongly” and “somewhat” responses, when treated together, show a statistically significant difference which was not revealed and are counted and analyzed as two separate categories.
For the resulting 2 x 2 contingency table, it is feasible to conduct an exact Fisher test [
58], which is comparable to the Chi-square test. If both tests have similar results, this solidifies confidence in accuracy.
This approach eliminates the low cell count problem which can, in some cases, affect the Chi-square analysis.
Since no neither agree nor disagree category was originally provided, it is possible that there might have been respondents who would have chosen such category, but chose agree/slightly disagree so as to not skip a question.
It is observed that there is generally significant difference between males and females with respect to the outdoor experience in their neighborhoods. The average female opinion is somewhat more critical than that of men in this regard. However, there is no statistically significant difference between the opinions of males and females about technological matters (e-working, e-learning, surveillance, automated vehicle, etc.) that would pertain to the operation of a smart city.
6.2. Geographic Location
6.2.1. Amenities
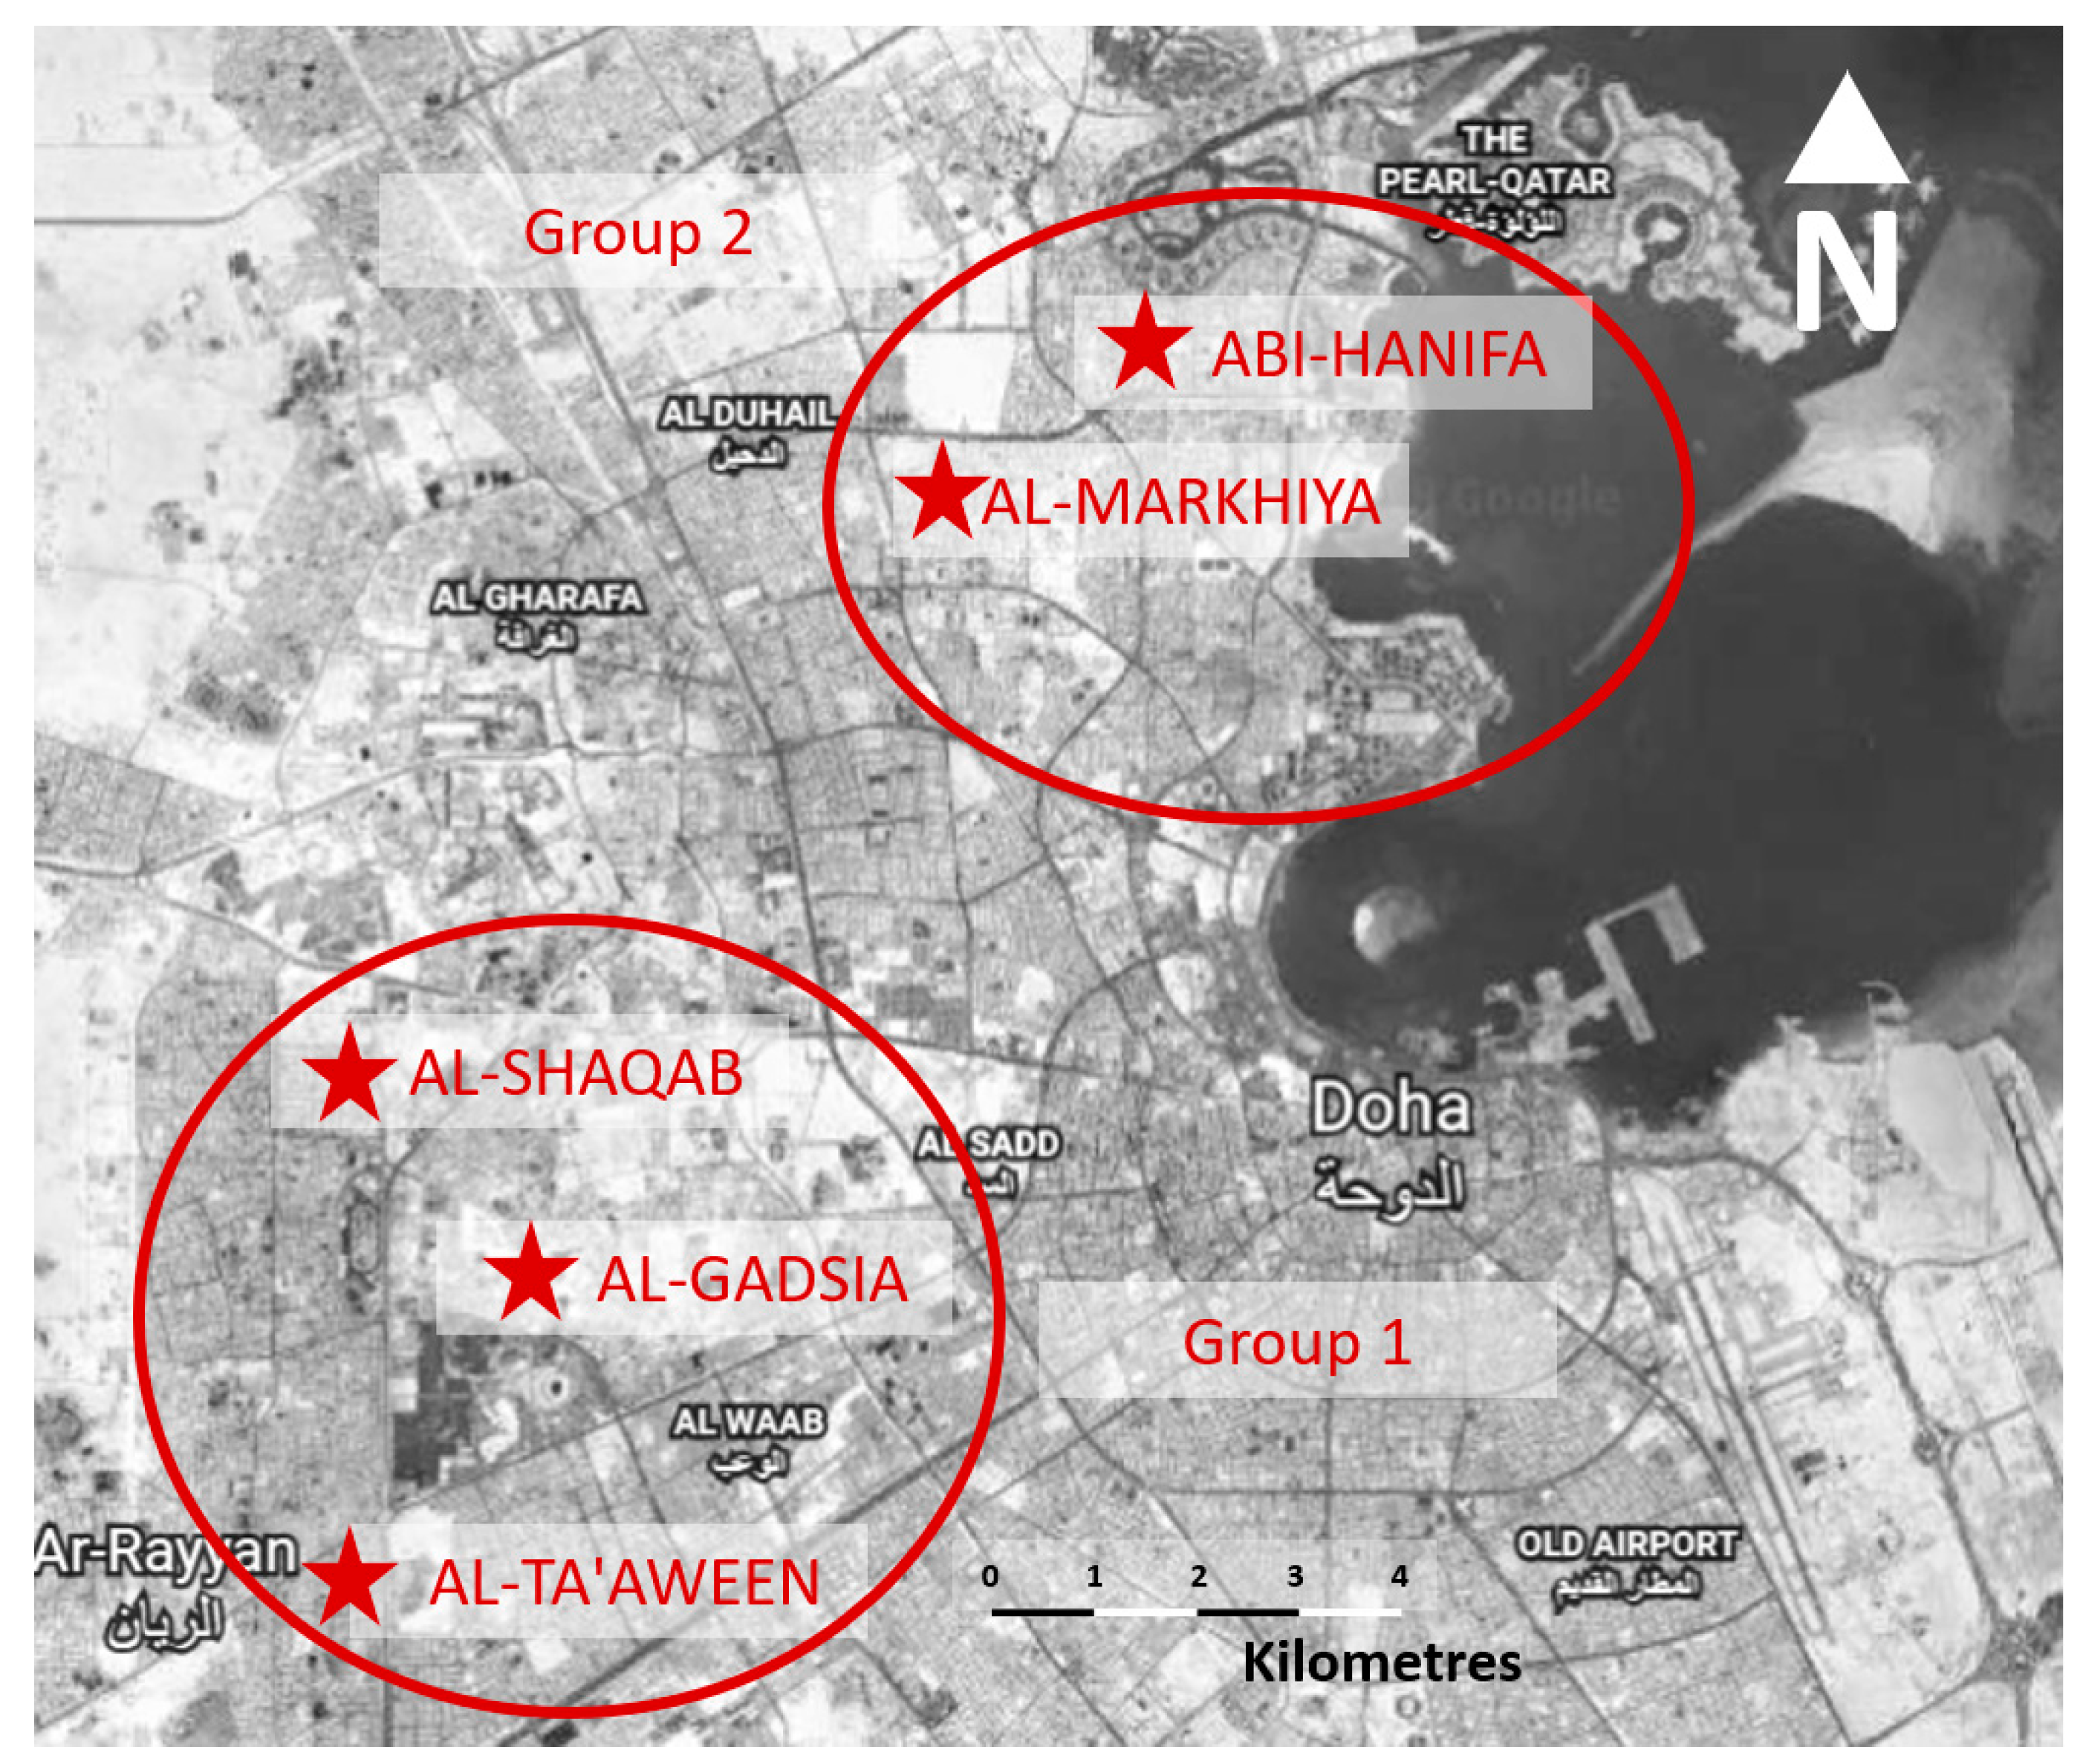
The respondents were asked to list the number of facilities/businesses based on proximity (time taken to reach) to their homes. The categories were “1–5 min”, “6–10 min”, “10–20 min”, “more than 20” and “don’t know”. It is the objective to analyze whether there are significant differences in this regard based on area, i.e., does one area have more close-by facilities compared to the other?
To analyze this data, while keeping the results meaningful and interpretable, schools were grouped based on geographic proximity into two groups: Al-Shaqab, Al-Qadsia and Al-Taween in one group, and Al-Markhiya and Abu Hanifa in another. The schools Group 1 are towards the north-east of Doha whereas Group 2 schools are more towards south central west. The assumption is that students will be attending schools close to their homes, i.e., someone living close to Al-Taween would not be attending Abu Hanifa or Al-Markhiya due to the long commute. So, in effect, two fairly distinct geographical clusters in the city are considered;
Figure 6.
Hereafter, the mean numbers of facilities within each group located for the various walking distance(s) were calculated and independent sample T-tests were conducted. These tests compare the means of two independent groups in order to determine whether there is statistical evidence that the associated population means are significantly different;
Table 5.
To interpret the results above, of
Table 6, the significance of “Levene’s test for Equality of variances” must be considered. If the value is low enough, it means that the null hypothesis, “the variances are equal,” is very unlikely, and it shall be assumed that the variances are significantly different. From
Table 6, this is true only for the first row (with significance level of 0.049 “with double Asterisk**”), corresponding to the mean number of businesses/facilities within 1 to 5 min walking distance. This is reasonable, as some people might be living quite close to shops and businesses, while others are not as close.
The result of Levene’s test means that for the independent samples test, the second row in the “Sig (2-tailed)” column should be taken into account. (“variances not assumed equal”—also “with double Asterisk **”). For the remaining rows, Levene’s test does not give a significance value low enough to reject the null hypothesis of equal variances, hence the values in the first rows are considered (“with single Asterisk *” in the ‘Sig (2-tailed) column’). As it turns out, the null hypothesis (that the difference between means in just due to chance) cannot be reasonably rejected for any of the cases, including the first one. It can be concluded that there is no statistically significant difference in the mean number of facilities available at each of the distances under consideration. This result is useful because there are many questions in the sample that pertain to walking and accessibility of businesses and facilities, and it may be reasonably assumed that the answers are not affected by a difference in accessibility.
6.2.2. Neighborhood Location
The next question looks at the respondents’ opinions about the facilities available in their respective neighborhoods, in terms of a good environment conducive to walking, and also concerns about safety (speeding drivers, crimes, etc.), based on the area (as grouped above) they live in.
The main observation, from
Table 7, is that there is statistically significant difference in opinion regarding elements that pertain to the outdoor experience, including provision of shady trees, recreational facilities, interesting sights, etc. The counts will indicate that in general Group 2 indicate a more positive opinion than Group 1. This is summarized by looking at the mean of the Likert items for each question, in
Table 8. Even though Likert items are not interval data, and therefore the mean is not a measure of central tendency, it can still indicate, by comparison, whether one group has a relatively more favorable outlook.
6.3. Education
The opinions of respondents in regards to futuristic technology that comprise some of the salient features of smart cities are herein examined. The objective is to examine whether education and professional background have any bearing on respondents’ attitudes towards information technology-based work, learning, transportation, and privacy.
Table 9 indicates that for most questions there is no statistically significant difference between the educational groups.
6.4. Job
The bearing the type of profession has on each question are herein examined;
Table 10. There are four choices for the job type in the survey: private, office, outdoors/technician, and doctor/engineer. Respondents were also given the freedom not to specify their job at all. In the analysis that follows, those who did not specify their jobs were treated as missing values and were not included. The analysis was carried out on the original 4-grade Likert scale and missing values were ignored issues.
Intriguingly, the only question for which there is any statistically appreciable difference between the various job categories is the question of the respondent’s feeling of comfort when using an automated vehicle. It turns out that doctors and engineers are (relatively) less likely to feel comfortable in automated vehicles. Otherwise, there is no statistically significant data from which conclusions can be drawn.
7. Discussion
The Chi-square test assisted in clarifying the gathered data from the survey. The survey responses were positive to both topics of walkability and smart technologies, giving the impression that people in Qatar are seeking a more sustainable and livable urban form. The survey also highlighted that there are some unique urban design issues in existing neighborhoods of Doha. With respect to gender, the average female opinion (majority of respondents were females) is somewhat more critical on walkability than men even though Doha is a relatively safe city [
59]. These differences may be explicated based on a few key factors. First, socio-cultural aspects, where, in general, males are expected to spend more time walking outside than females, so they are more acclimated to walking. Additionally, women wear the traditional Abaya, which might make walking in the hot sun less comfortable. Second, psychological makeup: differences in men and women’s perception and sense of danger might explain why more women than men feel that drivers in their neighborhoods over-speed, or that walking at night, or even during the day, alone is unsafe [
60]. There are also many streetscape measures that can improve the conditions of the outdoor environment visual and physically, such as speed design, to make the street safe for pedestrian use [
36].
For neighborhood location, in general, Group 2 indicates a more positive opinion than Group 1. Drawing onto the general stereotypical perception of Doha city, Group 2 comprises of more recently developed, government-planned, “affluent” neighborhoods (West Bay) compared to the Group 1 area. So, in general the perception of respondents living in Group 2 is more favorable than those in Group 1. Interestingly, even though there was no significant difference in the mean numbers of facilities/businesses within a certain walking distance, there is significant difference between the responses about whether neighborhood stores within easy walking distance. This might account for the responses to the other questions which indicated that walking is a more pleasant experience for Group 2 compared to Group 1. Thus, Group 2 residents perceive it as easier even though on an average they have access to the same number of facilities within a certain walking distance.
Smart Technology indicates that, for most questions, there are no statistically significant differences between the variable groups. This is perhaps because many of the issues surveyed are hypothetical in nature and the respondents’ attitudes are based on their personal thoughts and emotional perceptions which may have been prompted to them by the media, news and Internet, rather than their own experiential knowledge. The two exceptions are:
Respondents’ opinions on whether e-working is more favorable than e-learning. A relatively higher percentage of respondents with a higher education qualification feel e-working is more favorable than e-learning. Perhaps these respondents feel that instruction at the higher educational level cannot be properly delivered or evaluated through e-learning.
A relatively larger number of respondents with secondary school qualification say that they would feel comfortable using an automated vehicle. Even though the trend appears to be statistically significant, it is not obvious what the reason for this might be. A more reasonable explanation is obtained when survey answers are interpreted based on job type.
It appears in general that the job type does not have much influence on respondents’ attitudes on the various elements and issues that pertain to smart cities, despite the fact that the job categories are markedly different. Most notably, variables of education and job showed a statistically significant difference on a question about automated vehicles. A relatively larger number of respondents with secondary school qualification say that would feel comfortable using an automated vehicle. It is possible that individuals with lower educational qualification are in general more intrepid to experiment with new technologies. It also bears noticing that this question was worded in such a way that the respondent’s own comfort and safety was brought to the forefront, i.e., “would you [the respondent] feel comfortable in an automated vehicle?” rather than “do you think passengers would feel comfortable in automated vehicles?” It is important, however, to recall the principle of statistics that correlation does not imply causation. Just because there appears to be a connection between two issues (in this case highest educational level attained vs. attitude about driverless vehicles) does not mean that one is the cause of the other. Rather, the two may be connected through a third, common source. For the job variable, it appears that doctors/engineers are (relatively) less likely to feel comfortable in automated vehicles. This could be attributed to the fact that doctors and engineers are used to having more control and decision-making authority in their professional life, and hence, they feel less comfortable giving up control to a machine (i.e., automated vehicle).
Responses to the smart technology survey were predominately positive. In e-health, for instance, the responses stay positive when the participants learn that they would be diagnosed by a clinician through remote, smart devices. This might be because it is seen as a customized service where the patient can see the doctor at any time. The approach might have been perceived as time-saving, sparing patients driving long distances to clinics and waiting in queues. The positive attitude towards new smart technology may be attributed to two reasons:
Most of the points touched by the questions related to aspects of smart cities are still hypothetical or in early stages of infancy, hence people do not have well-formed experience-based opinions on these matters.
As in it the case for other countries in the Middle East, the IT sector in Qatar is not yet well-developed. Most of the engineering professionals tend to comprise the more “grass-roots” engineering fields such as civil, mechanical, electrical, etc. rather than informatics and computer engineering who would be expected to be more well-read and knowledgeable about some of the expected implication introduced in the latter part of the survey. Therefore, the category of IT experts is not highly represented in the local job demographic, and their opinion (which might well have been markedly different from “lay persons” belonging to other fields/professions) cannot be extrapolated from the survey.
The traditional way of receiving education, attending to a job, running a business or service has transformed and will continue to transform, nullifying many pre-requisites for location-based activities and giving rise to virtual-/e-learning, e-health, etc. Thus, smart technologies, though they may be several years ahead in the future before distinct implementation, could affect how urban centers are formed. Current spatial development of cities could be affected by the subsequent social and economic technology-stimulated rearrangement of demographics, starting from the elemental neighborhood. New, unfamiliar features of neighborhoods and communities may arise as a result of the human-technology interface.
8. Conclusions
Looking ahead beyond the expected eventful year of 2022, the Ministry of Municipality and Environment (MME) anticipated a challenge, in the Qatar National Development Framework (QNDF) 2032, that the governmental investment and development plans would shift to non-construction and infrastructure projects, in line with an estimated large decrease in Qatar’s population after the 2022 FIFA World Cup. This study ascertains that the lagging position of Doha in several indices of city sustainability and livability can be primarily attributed to Doha’s continuous growth and expansion as a polycentric, low-density city. The sprawling growth of Doha impedes the development of adequate infrastructure for transportation modes alternative to private cars.
Socially, the study investigated the causal relation of the current Doha masterplan and the social norms of residents, seeking to answer the question “will it be socially acceptable to promote walkability in Doha’s low-density residential neighborhoods and use smart transportation and communication technologies in pursue of city sustainability and livability goals?” A steep introduction of the unfamiliar—walking and smart communication and transportation technologies—to a car-based society will be socially resisted. Even though this study also shows that walkability, smart transportation, communication technologies are not necessarily western-centric and may be socially acceptable urban planning methods in a low-density Doha City, a gradual improvement that starts with testing hypotheses in pilot communities and neighborhoods could help measure and increase the acceptability of change. A government-sponsored survey, such as the one used in this study, may possibly be a launching pad of transforming perspectives of Qatar residents.
Walkability, in a city designed to the human scale, is a common denominator of sustainability and livability. In addition to the ongoing practice of zoning in Qatar that ignores designing to the human scale, walking, however, is mostly ruled out as a choice of mobility for Doha residents, even within a neighborhood leading to and stemming from lack of local amenities and services, lack of pedestrian roads or their poor quality, lack of parks and open public spaces of socialization, all of which are factors that erode important motives of walking and pose major challenges to promoting walkability in Doha. Additionally, the very arid climate of Qatar, especially during the months of summer, may highly discouraging to pedestrians, heightening the reliance on air-conditioned transportation modes. A study of walkability as determined by seasonal/climatic behaviors and trends may be very helpful in understanding elemental factors that could possibly promote and popularize walking in Qatar’s arid neighborhood [
48,
49].
Walkability is perceived distinctively among males and females. The average female opinion is more critical than that of males adjusting to differences in socio-cultural considerations of gender, expecting males to spend more time walking outside than females, and differences in psychological makeup regarding a safe outdoor walking experience, especially if alone.
Smart transportation and communication infrastructures can help optimize mobility patterns and movement behavior of city inhabitants. The current challenges of low-density Doha could be resolved by advancements in technology and transform Doha into a sustainable city. In planning for a smart city, there appears to be no discrepancy among the opinions of males and females about technological matters (e-working, e-learning, surveillance, autonomous vehicles, etc.). These technological advancements, however, are not pervasive enough to have influenced people’s experiences of a smart city yet. Though correlation does not necessarily imply causation, economic class, educational, and professional backgrounds appear to be factors that significantly influence both attitudes and experiences of neighborhood residents in Doha. When opinions on technologies of a smart city were polled, residents of affluent neighborhoods with higher educational backgrounds were more in favor of smart technologies.


