Abstract
The swift evolution of urbanization in China has led to a rapid increase in the demand for infrastructure. Infrastructure consumes significant amounts of construction materials. The production, packaging, transportation and use of these materials require energy and, therefore, are a source of carbon emissions. In order to make the construction of infrastructure satisfy people’s life demands and economic development, and at the same time conform to low carbon ideas, it is necessary to understand the spatial and temporal variations of embodied carbon emissions and its regional disparity. This study classifies and sorts the calculation parameters of infrastructure material stock and embodied carbon emissions. It estimates the trends and magnitude of 31 provinces over a period of 20 years (1997–2016) and analyzes the spatial-temporal characteristics. Our results indicate that: (1) The overall infrastructure embodied carbon emissions amount to 32.04 billion tons; (2) the embodied carbon emissions from buildings are far greater than that of transportation infrastructure, however, the annual growth rate is contrary to this; (3) the spatial and temporal variations show regional inequality, with the eastern coastal area being higher than the central and western inland areas and the economically developed areas being higher than the less developed areas.
1. Introduction
Infrastructure construction is crucial to both developed and developing countries. In developing countries, infrastructure construction has a transformational impact on lives of people and the development of enterprises; in more mature economies, building and updating infrastructure to meet demand is an integral part of the maintenance of economic growth [1]. Globally, with the increasing demands for development and the growing population, infrastructure is growing rapidly.
Since the start of the gradualist economic reform, in 1978, China’s economic growth and the people’s income level have improved significantly. China replaced Japan as the world’s second-largest economy in 2010 [2]. Meanwhile, the urbanization rate is increasing year after year. In 2016, it reached 57.3% [3]. Due to continuous economic and urban growth, the demand for infrastructure is great, especially for building and transportation infrastructure. On the other hand, the excellent infrastructure system will stimulate the development of the economy and of trade. The Belt and Road is evidence of this [4].
Large-scale infrastructure construction has contributed to the development of the social economy. Nevertheless, it has also created some environmental problems. Such construction activities consume significant amounts of construction materials. Production, packaging, transportation and use of these materials require energy and, therefore, they are a source of greenhouse gas (GHG) emissions. The construction and transportation infrastructure will last a dozen years, decades or, in some cases, more than one hundred years. In this lifetime, construction materials are also needed to maintain and renovate the infrastructure.
It is well known that the key to mitigating global warming is to control and reduce carbon dioxide emissions. In the context of global actions on climate change, China, as the top emitter of CO2, has pledged to, by 2030, reduce the CO2 per unit of GDP by 60–65% of the 2005 level [5]. In order to achieve the target, all sections should have corresponding emission reduction measures and actions. For infrastructure construction, we should understand the status and characteristics of its embodied carbon emissions in order to formulate reasonable low-carbon development routes and emission reduction policies.
In recent years, there have been quite a few papers published regarding material stocks and flows on different scales, country, province and city, and on different study subjects, industrial park, single building, transport networks, and so on.
The majority of researchers calculated infrastructure material stock diminutively but did not go the step further to calculate the embodied carbon emissions. Based on a dynamic MFA (material flow analysis) model, Mülle [6] estimated the material stock and waste of residential buildings from 1900 to 2100 in the Netherlands. Federici and colleagues [7] measured the material intensity of the transportation infrastructure in Italy. The Brattebø group [8] calculated the amount of material consuming and stock by establishing an MFA modal on buildings, roads and bridges in Norway. Nina and colleagues [9] applied a dynamic building stock model to simulate the development of more than half of the building stock in 11 European countries between 1900 and 2050.
Most of the published literature about China’s infrastructure’s embodied carbon emissions just focuses on a single infrastructure or construction material and is confined to a particular area, rather than the whole infrastructure system from the national level. Shi [10] and Huang [11] measured the material stock and CO2 emissions of China’s buildings and transportation infrastructure by dynamic MFA, but the data were only about steel and cement. Cao [12] calculated infrastructure material stock and GHG of Shanghai in the last 30 years with GIS and MFA systematically. Guo [13] studied the infrastructure material stock composition and annual changes of Miao Island in Shandong by establishing a bottom-up calculation model with GIS. Guo [14] focused on the road systems in megacities, like Beijing. Based on the stock model and inventory building, energy consumption and GHG emissions were carried out that the in-use stock is 164.6 Mt and the two main stages with massive GHG emissions are production and maintenance
In view of this, we not only calculate the material stock of infrastructure more systematically, but also study the relationship between these stocks and CO2 emissions. The significance of the research is as follows:
As people’s incomes increase, they pursue more comfortable and enjoyable living conditions that still meet basic living needs. These demands may lead to the construction of larger infrastructures, which will inevitably consume more materials and energy and emit more greenhouse gases. Therefore, a way to balance the relationship between human material needs and the environmental climate is the key to future research.
At present, China’s infrastructure is in the non-carbon emissions trading field. With the promotion and implementation of the carbon trading market, the infrastructure of each province and city will be allocated carbon allowances. At that time, economic benefits will be achieved if the province meets the standard. However, if the province fails to meet the target it will be punished. Assuming that the embodied carbon emission of infrastructure in each region is not accurately verified, how can we objectively and accurately set the baseline value of infrastructure embodied carbon emissions? How can we be fair and transparent? This will inevitably lead to conflicts of interest in regional development.
Based on the above two points, it is necessary to understand the current status of spatial and temporal variations of embodied carbon emissions in China’s infrastructure and to give policy recommendations.
2. Model Setting and Methodology
Infrastructures are generally referred to as constructions, structures and facilities which provide services for people’s life and work [15]. Considering the importance and availability of data, in this study, China’s infrastructures are generally divided into two major units: buildings and transportation. Buildings, both in urban and rural contexts, consist of residential and non-residential [16]. According to the structure of the building, we consider four building styles that are common in China: steel–concrete, brick–concrete, brick–wood and wood buildings. The road system is divided by the traffic volume on the highway and the class, 1–4. Due to data limitations, China’s railway system is divided roughly into single-track and double-track. Additionally, each infrastructure comprises different construction materials which have different carbon emission intensities (Figure 1). By adding up multiple kinds of construction material embodied carbon, we achieve China’s infrastructure’s embodied carbon. Embodied carbon refers to the energy consumed and also the resultant carbon emissions associated with the production of all the materials used in the construction of a new building or new road (including the transport of raw materials and manufactured component) [17,18].
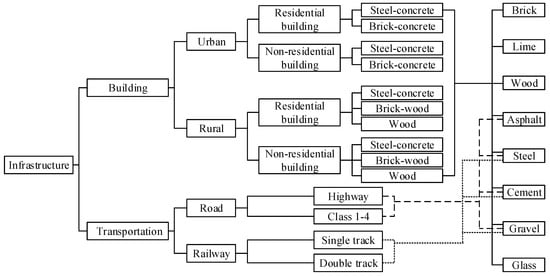
Figure 1.
Classification of infrastructure and type of material stock in each.
As per the definition above, embodied carbon emissions are unlike direct carbon emissions, which can be directly calculated using the traditional energy consumption measurement method [19]. In this study, China’s infrastructure material stock was calculated through a dynamic MFA model [6,11] based on “bottom-up” analysis. We first calculated the stock of various construction materials and then multiplied the carbon intensity of the construction materials to finally obtain the embodied carbon emissions of the infrastructure.
The mathematical equations used to estimate material stock and the embodied carbon emissions of China’s infrastructures are described below.
where is the building stock in year t, representing the actual floor area of the year, is the newly built building in year t, is the demolished building in year t, i = 1, 2, where 1 is urban and 2 is rural, j = 1, 2, where 1 is residential and 2 is non-residential building, and k represents different structural styles of buildings, including steel–concrete, brick–concrete and wood structural construction.
where is the infrastructure transportation stock in year t, is the newly built transportation infrastructure in year t, is the refurbished transportation infrastructure stock in year t, and i′ is the type of road or railway.
where is the floor area stock of building in year t − 1, is the population in year t − 1, is the per capita floor of building in year t − 1, i, j and k are the same as in Equation (1), and k′ is the share of various structural styles of buildings.
where is the demolition rate of buildings in year t. It represents the probability that the building constructed in year t′ is demolished in year t.
where is the demolition rate of transportation in year t. It represents the probability that the transportation constructed in year t’ is refurbished in year t.
The building demolition rate can be defined by a normal distribution function, which is commonly reported in the existing literature [6,9,10,20,21], where is the standard deviation and is a building’s mean lifetime. We can also calculate the transportation infrastructure demolition rate by Equation (6).
where is the material stock of building in year t, is the material intensity of building in year t, m is the different building materials, such as cement, steel, wood and, and i, j, k and t are the same as in Equation (1).
where is the material stock of transportation in year t and is the material intensity of transportation.
where C is the embodied carbon of infrastructure, is the embodied carbon of building, is the embodied carbon of transportation, and is the embodied carbon emission intensity of material.
3. Data Acquisition and Data Processing
3.1. Building Material Stock
3.1.1. Population and Urbanization Rate
Population is a direct factor leading to the accumulation of infrastructure material stock and embodied carbon emissions. As the main place where people live and work, the scale and quantity of buildings will increase with the growth of the population. The urbanization rate is another drive factor. In China, the urbanization rate refers to the proportion of the urban population (non-agriculture) to the total population (agriculture and non-agriculture). Generally, urban people pursue high quality food, clothing, shelter, transportation and entertainment, so the rising urbanization rate is, to a certain extent, accelerated by the growth of the building scale. The population and urbanization rates from 1997 to 2016 were obtained from the “China Statistical Yearbook” [3], the Statistical Yearbook of 31 provinces [22] and the “Comprehensive Statistical Data and Materials on 60 Years of New China” [23] As a default, linear interpolation was used to fill the data (Figure 2).
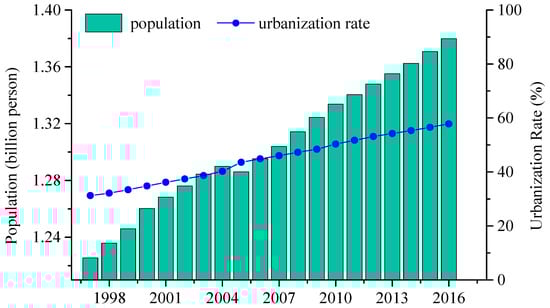
Figure 2.
China’s population and urbanization rate. (Source: statistical data)
3.1.2. Per Capita Floor Area
Per capita floor area is another major factor that affects the material stock and embodied carbon emissions of infrastructure. In the past two decades, the living conditions of Chinese residents have been greatly improved all in areas of function and comfort. In 2016, China’s per capita residence area in urban and rural environments was 36.6 m2 and 45.8 m2, respectively, which were 2.06 and 2.04 times that in 1997. This includes an average annual increase of 3.9% and 3.8%, respectively. The data of rural and urban per capita residence areas were from the “China Statistical Yearbook” [3], the Statistical Yearbook of 31 provinces [22], and the “Comprehensive Statistical Data and Materials on 60 Years of New China” [23]. The per capita floor area of non-residential buildings was not available to the public. For this part of the data acquisition we referred to the research of Shi [10] and Yang [24]. Shi obtained urban non-residential building areas from 1980, according to China’s national urban building census, and established a logistic function model based on Yang’s research results that urban non-residential building area is about 80% of the residential building area in some European countries. Yang also pointed out that China’s rural non-residential construction area accounted for 10–15% of the total rural construction area and would reach about 20% in the future. Shi considered this volume to also follow a logistic function. Based on the conclusions of the two scholars, we combined the urban and rural population to obtain the per capita non-residential building area. In urban regions, the per capita floor area of non-residential building went from 10.6 m2 in 1997, with a gradual increase, to 26.7 m2 by 2016. The value of rural area was 2.5 m2 in 1997 and reached 9.9 m2 by 2016 (Figure 3).
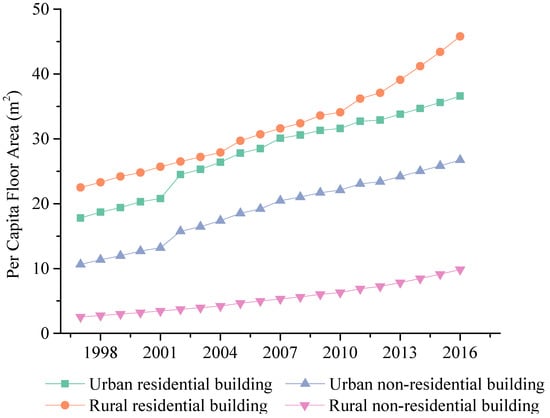
Figure 3.
China’s per capita construction area for different buildings. (Source: residential building: statistical data; non-residential building: Logistic simulation data)
3.1.3. Proportion of Various Types of Buildings
Different types of buildings are composed of different construction materials and their material consumption is not the same. A reasonable classification of various types of buildings would affect the accuracy of the measurement results. Generally speaking, the common building structures in rural areas include wood, brick–wood and steel concrete [3]. We obtain the per capita floor area of the three common building structures from “China Statistical Yearbook” and calculate (per capita building area multiplied by rural population) the respective proportion of different types of buildings in rural areas. In urban area the main building types are brick–concrete and steel–concrete [11]. In the 1990s, clay bricks were prohibited because of environmental protection so new buildings were mostly steel–concrete. Regarding the proportion of the two types of buildings in urban regions, this study learned from the results from Shi [10] and Huang [11]. Their results showed that the earliest steel–concrete building in China was constructed in the mid-1970s. The proportion of steel–concrete structures was about 10% in 1980, which accounted for 50% in 2000 and followed a logistic function. According to the above findings, we established that the percentage of steel–concrete buildings went from 37.8% in 1997 and gradually increased to 66.3% by 2016 (Figure 4).
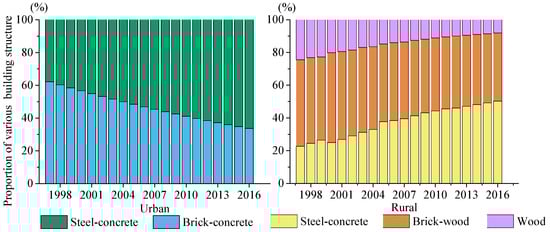
Figure 4.
The proportion of various types of buildings in China. (Source: urban: Logistic simulation data; rural: statistical data)
3.1.4. Average Lifetime of Buildings
The life cycle of a building covers all stages of planning, construction, maintenance and demolition. It directly affects the consumption of construction materials, which is one of the key factors in determining the material stock and embodied carbon emissions. In China, the designed lifetime of ordinary buildings is 50 years [25]. However, buildings that are 20 to 30 years old are considered for demolishing due to the low quality materials and construction technology used [26] and some human factors. This is very common in early buildings. The lifetime of buildings in this research was based on a combination of China’s building design codes and the actual situation. The average lifetime of rural buildings was even shorter, usually 15–30 years [11]. The average lifetime of different types of buildings in urban and rural regions in this study are shown in Table 1 according to the published literatures and the actual situation in China.

Table 1.
Average lifetime of buildings (in years).
3.1.5. Material Intensity of Various Types of Buildings
This study considered that the construction materials commonly used in China are steel, wood, cement, brick, gravel, asphalt, lime and glass. There were few data of material intensity in any manuals or specifications. Information of material intensity about each type building was extracted from various published reports and papers. Liu and Hu [27] calculated the consumption intensity of six major construction materials for three common residential buildings based on design drawings and norms for preliminary estimates. In his research, Shi [10] calculated and collated the material intensity of nine construction materials, including steel, brick and others. The relevant references are explained and listed as footnotes in Table 2.
Table 2.
Material intensity of various types of buildings in China (in kilograms per square meter).
3.2. Transportation Infrastructure Material Stock
3.2.1. Length of Road and Railway
Roads in China are divided into five levels according to the volume of traffic. The highways and Class 1 are high-grade roads. Class 2 is in the middle. Class 3 and Class 4 are low-grade roads [28]. Data from the “Yearbook of China Transportation and Transportations” [29] and “Statistical Communiqué of Transportation and Transportations Development” [30] revealed that all kinds of roads presented a relatively stable linear growth trend from 1997 to 2016. Although the Highway started late, its development speed was the fastest, with an average annual growth rate of 20.2%, followed by Class 1 with an average annual growth rate of 10.7%. Next was Class 4 for which the average annual growth rate was 9.6%. The average annual growth rate of Class 2 and Class 3 were relatively slow, 6.6% and 3.3%, respectively (Figure 5).
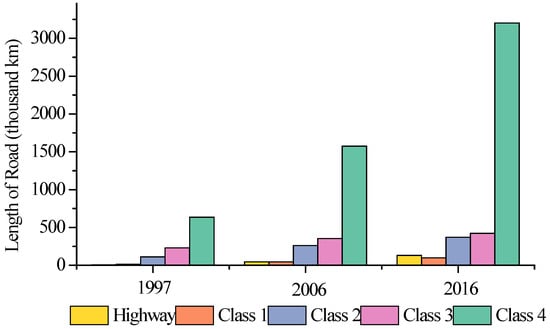
Figure 5.
Length of road in China.
The growth of China’s railway has been faster than that of other countries. By the end of 2015, it was about 121 thousand kilometers, ranking second in the world [31]. In this study, we divided China’s railway system into single- and double-track. Data from the “Yearbook of China transportation and transportations” [29] and the “Statistical Communiqué of Transportation and Transportations Development” [30] showed that the total length of the railways increased from 66.1 thousand kilometers in 1997 to 124.2 thousand kilometers in 2016. The proportion of double-track railways changed little before 2014, and remained at around 30%. It rose sharply in 2014, accounting for 55% of the total mileage of the railway. This was because double-track railways only included state-owned double-track railways before 2014, and since then statistics for all types of double-track railways (Figure 6).
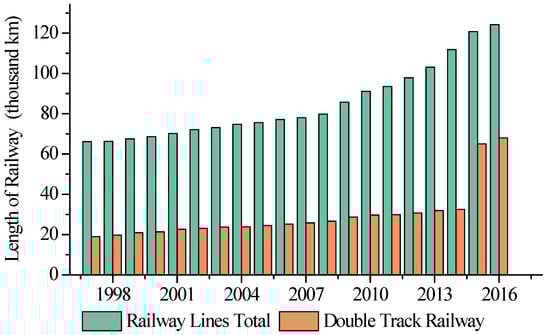
Figure 6.
Length of railways in China.
3.2.2. Pavement Width of Grade Road
For the reason that the material intensity of each grade of road is based on the unit area, it is necessary to obtain the pavement width data of each grade road before calculating the material stock of the road. The data were obtained from the standards of road “Land Use Index for Highway Project Construction JB [2011] 124” [32]. Road width varies with the number of lanes. In this study, the maximum width of each grade road was chosen as the calculation parameter. The width of highways was 42 m (eight lanes), and Class 1 was 33.5 m (six lanes). The other grade roads were all two lanes, with the width of 12 m, 8.5 m and 6.5 m, respectively [32].
3.2.3. Average Lifetime of Road and Railway
The average life cycle of a level road was from “Specifications of Cement Concrete Pavement Design for Highway JTD D40-2011” [33]. The average life cycle of a railway was from “Code for Durability Design on Concrete Structure of Railway TB 10005-2010” [34]. Due to the limitation of engineering technology and material quality, the lifetime of early railways was generally short. In this study, we selected the Class 3 railway, for which the average lifetime is 30 years, to estimate the material stock of railway (Table 3).
Table 3.
Average lifetime of roads and railways (in years).
3.2.4. Material Intensity of Grade Road and Railway
The common materials used in China’s road include cement, asphalt, steel and cement. The railway system incorporates concrete and wooden sleepers. Early railway sleepers were made of high quality wooden sleepers. However, with the large-scale construction, China’s timber resources have become increasingly scarce so, coupled with the short lifetime of the wooden sleepers, generally about 15 years, from the late 1950s a large number of concrete sleepers were used. At present, the railway system is no longer using wooden sleepers. It can be assumed that the sleepers of existing and newly built railways in China have all been concrete since 1997. Gravel, steel and cement are commonly used in railway construction. We obtained the material intensity of the road and railway from the standard specifications by the MTC (Ministry of Transport of the People’s Republic of China) [35] and the study of Huang [36]. The related references are interpreted and listed as footnotes in Table 4 and Table 5.
Table 4.
Material intensity of grade road in China (in kilograms per square meter).
Table 5.
Material intensity of various types of railways in China (in kilograms per meter).
3.3. Infrastructure Embodied Carbon Emissions
The carbon emission intensity of construction materials is also cognized as the carbon emission coefficient, and there is no uniform standard at present. The carbon emission intensity of construction materials was usually expressed as carbon dioxide discharged during the production and processing of unit construction materials from various published reports and papers [10,37] (Table 6).
Table 6.
Embodied carbon emission intensity of construction materials in China (tCO2/t).
4. Results and Discussion
4.1. Material Stock of Infrastructure
Over the period of last 20 years, the material stock of infrastructure has skyrocketed, from 61.12 billion tons in 1997 to 163.49 billion tons in 2016, with an average annual growth rate (Formula: , n = number of years-1.) of 5.3% (Figure 7). The material stock of each stock unit was: MB > MT. The proportions of building and transportation material stock were 90.2% and 9.8%, respectively, in 1997, and 86.1% and 13.9%, respectively, in 2016. In the past 20 years, the material stock of building has increased from 55.12 billion tons to 140.78 billion tons, a 1.6 time increase with an average annual growth rate of 5.1%. In the course of the same period, the material stock of transportation infrastructure has increased from 6.00 billion tons to 22.72 billion tons, a 3.78 time increase and an average annual growth rate of 7.4% (Figure 8).
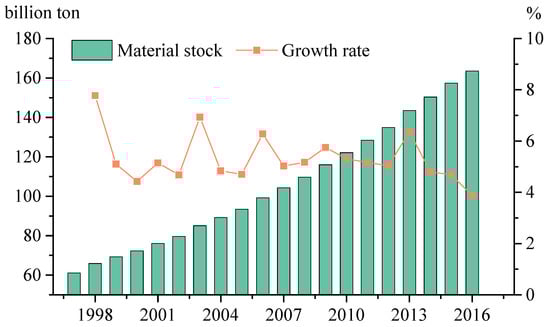
Figure 7.
China’s material stock of infrastructure and its growth rate.
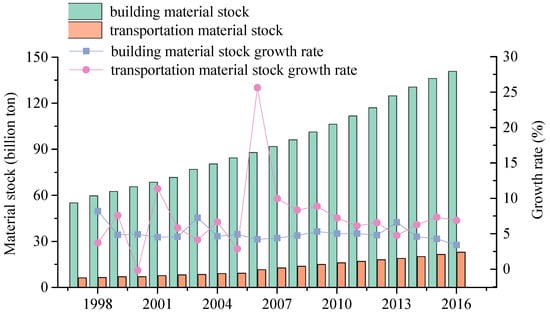
Figure 8.
Material stock of building and transport infrastructure.
This illustrated that the scale of China’s building construction is much larger than that of its transportation. The construction materials consumed are mainly used for buildings. On the other hand, in the past 20 years, the development of China’s transportation infrastructure was faster than that of its buildings. The proportion of transportation infrastructure material stock has gradually increased.
Until 2016, the material stock of gravel, which was one of the eight common construction materials, was in first place and the proportion was 68.7%. This was closely followed by cement and brick, whose proportions were 13.2% and 12.1%, respectively. Other construction material’s stocks were significantly lower, accounting for only 6% of the total stock. During the 20 years from 1997 to 2016, the fastest increase in stock was steel, at a growth rate of 8.0%. This was followed by asphalt and cement, the average annual growth rates were 7.6% and 7.2%, respectively. The slowest were wood and brick, with average annual growth rates of 2.8% and 1.8%, respectively (Figure 9).
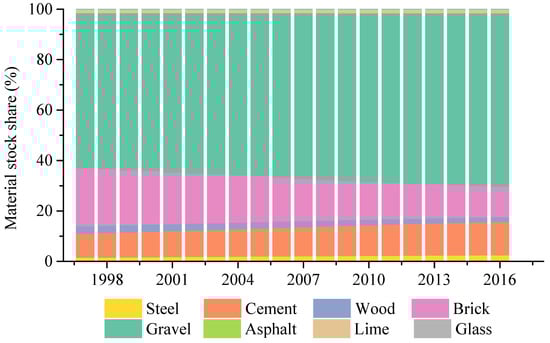
Figure 9.
The proportion of construction materials.
This demonstrated that gravel was the main material of infrastructure construction, because gravel was the major material for concrete. In China the most common buildings and high-grade roads are mainly concrete structures at present. Therefore, the proportion of gravel material stock showed an increasing trend. Although steel accounted for only a small proportion of material stock, it was growing fastest, reflecting the wider use of steel in infrastructure construction. The rapid development of reinforced concrete structure buildings and continuously reinforced concrete pavement superhighways was the best interpretation. The main reasons for the reduction in the share of wood and brick stocks could be explained in two ways. The widespread use of bricks and wood caused a significant amount of cultivated land loss and forest destruction. Therefore, since the late 1990s, China has banned the use of clay bricks [24]. Besides, brick–wood structure buildings have a shorter lifespan compared with others. Therefore, the construction of new infrastructure in China has seldom used wood and bricks as the main construction materials.
4.2. Embodied Carbon Emissions of Infrastructure
Table 7 reveals infrastructure embodied carbon emissions during the past two decades. The changing trends were the same as the infrastructure material stock. By the end of 2016, the overall infrastructure embodied carbon emissions reached 32.04 billion tons, which was three times that of 1997. According to data published by the WB [38] and GCP (Global Carbon Project) [39], the accumulated embodied carbon emissions of China’s infrastructure accounted for 24.5% of the total emissions of the whole country from 1997 to 2016. There are several reasons for this amount of embodied carbon emissions. Primarily, China has a vast territory and a tremendous population. The demand for infrastructure is higher than in many other countries or regions. There is one more point, the Chinese government’s investment in infrastructure continues to increase. In 2016, China’s infrastructure investment was 11.88 billion Yuan, an increase of 17.4% over the previous year accounting for 16% of GDP in that year [40]. Despite the high embodied carbon emissions of China’s infrastructure at present, China’s current infrastructure and its embodied carbon emissions are prepared for the coming decades from the perspective of development.
Table 7.
China’s infrastructure embodied carbon emissions (billion tons).
Table 8 displays infrastructure embodied carbon emissions in 31 provinces and their rankings in 1997, 2006 and 2016. The infrastructure embodied carbon emissions in most provinces increased steadily year by year. There were slight variations in rankings, except Jiangsu, Zhejiang and Jiangxi. By the end of 2016, the top three provinces were Jiangsu, Shandong and Henan. The embodied carbon emissions were 2685.99, 2509.51 and 2326.87 million tons with the proportion of 8.39%, 7.83% and 7.26%, respectively. The lowest three provinces were Qinghai, Hainan and Tibet, whose embodied carbon emissions were 80.20, 143.39 and 149.10 million tons, accounting for 0.47%, 0.45% and 0.25%, respectively. The maximum was 33 times the minimum.
Table 8.
The embodied carbon emissions of 31 provinces in China (million ton).
From 1997–2016, the average growth rate of infrastructure embodied carbon emissions of the whole country was 6.09%. There were 16 provinces above the national average. Among the 16 provinces the fastest were Jiangsu and Zhejiang, whose average growth rates were more than 8.30%. And there were 15 provinces beneath the national average. The average growth rate of the Guizhou province was the slowest, at just 3.97% in the past 20 years, and was less than half of Jiangsu and Zhejiang (Figure 10).
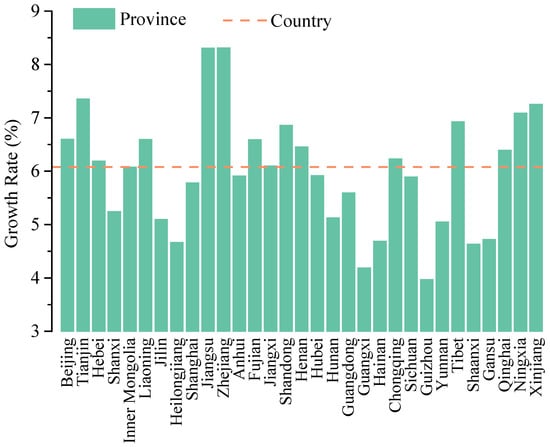
Figure 10.
The average annual growth rate of embodied carbon emissions from 1997–2016.
Both the embodied carbon emissions and the growth rate of each province show two characteristics: The eastern coastal area is significantly higher than the western inland area and the economically developed area is higher than the less developed area. This is due to the imbalance of regional economic development. Basically, it’s inseparable from the outline of China’s economic development. Since China’s reform and opening, the main economic development path is the coastal drive inland.
For a better understanding of the distribution of infrastructure embodied carbon emissions, the change is shown in Figure 11. Generally, the distribution of infrastructure embodied carbon emissions was significantly imbalanced. There was a significant downward trend from the eastern coastal regions to the western inland regions. In 2016, the southwest region accounted for 16.1% of the country’s total infrastructure embodied carbon emissions, followed by the middle Changjiang River, eastern coastal and northern coastal regions, accounting for 15.8%, 15.7% and 15.4%. The northwest region accounted for merely 4.6%. The biggest diversity between regions was about four times. Since the infrastructure embodied carbon emissions were calculated on the basis of the material stock, the spatial distribution pattern of material stock is also presented in the characteristics shown in Figure 11.
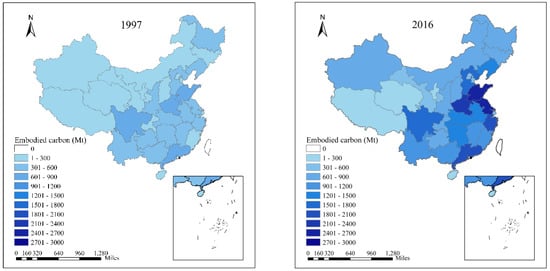
Figure 11.
Spatial distribution of infrastructure embodied carbon emissions.
Although the regional inequality is still conspicuously evident from the current spatial distribution, we speculate that such regional inequality will gradually decrease. Since 2000, the focus of the national plan began to tilt toward the mid-west inland regions and the northeast. Plans such as “develop-the-west strategy” and “central-China-rising strategy” were put forward in the 10th and 11th 5-year plan (2000–2010) and “the revitalization of the Northeast” was proposed in 2004. In addition, China’s infrastructure investment mainly comes from local government credit investment and financing. In recent years, the promulgation of economic policies restricts the financial behavior of local governments, which also restricts local infrastructure investment. The State Council’s Article No. 43 “Opinions on strengthening the management of local government debt” was proposed in 2014. Such regional inequality will shrink further in the future, after the fiscal requirements of the 2017 fiscal document No. 50 and the central work conference of local governments.
5. Conclusions
In this study we calculated China’s infrastructure material stock and embodied carbon emissions from 1997 to 2016 based on MFA, and analyzed the temporal and spatial variations. The major findings and suggestions are described below.
- China’s infrastructure material stock and embodied carbon emissions all show increasing trends year by year. By the end of 2016, the accumulated embodied carbon emissions were 32.4 billion tons and accounted for 24.5% of the total emissions of the whole country from 1997 to 2016. Although the total amount of infrastructure embodied carbon emissions is large, there is a design for the next few decades from the perspective of development.
- The building material stock and embodied carbon emissions are far greater than that of the transportation infrastructure; however, the annual growth rate is contrary to this. It indicates that the development speed of transportation infrastructure was greater than that of buildings in the past 20 years.
- The infrastructure embodied carbon emissions in most provinces have increased rapidly from 1997–2016 but the cumulative carbon emissions and annual growth rate are different. The eastern coastal area is significantly higher than the central and western inland areas and the economically developed area is higher than the less developed area. The main reason for the spatial and temporal inequality is the economic development route, which is the coastal drive inland.
- When planning the development route of infrastructure investment and low carbon emissions, we should be in accordance with the resource characteristics and developing direction of different provinces instead of blindly pursuing large quantities and wide areas. For the eastern coastal areas with high embodied carbon emissions, it is necessary to strengthen the maintenance of infrastructure so as to extend its lifetime. Large-scale demolition and reconstruction caused by man-made factors should be avoided. For the western inland regions with low embodied carbon emissions, we should enhance the role of green building materials and low-carbon construction technologies in infrastructure construction to reduce the materials and energy consumption and CO2 emissions.
Author Contributions
Conceptualization, J.B. and J.Q.; data curation, J.B.; formal analysis, J.B. and J.W.; funding acquisition, J.Q.; investigation, L.X. and Y.F.; methodology, J.B.; writing—original draft, J.B.; writing–review and editing, J.Q. and T.N.M.
Funding
This work was founded by the National Key Research and Development Program of China (No. 2016YFA0602803) and the National Natural Sciences Foundation of China (No. 41671535).
Acknowledgments
We thank the editor and reviewers for their constructive comments and suggestions on the manuscript.
Conflicts of Interest
The authors declare no conflicts of interest.
References
- Global Infrastructure Hub (GIH). Global Infrastructure Outlook—Infrastructure Investment Needs: 50 Countries, 7 Sectors to 2040. Available online: https://www.gihub.org/ (accessed on 26 July 2017).
- Cai, F.; Zhao, W. When demographic dividend disappears: Growth sustainability of China. In The Chinese Economy; Palgrave Macmillan: London, UK, 2012; pp. 75–90. [Google Scholar]
- National Bureau of Statistics of China (NBSC). China Statistical Yearbook; China Statistics Press: Beijing, China, 2017.
- Zhang, N.; Liu, Z.; Zheng, X.M.; Xue, J.J. Carbon footprint of China’s belt and road. Science 2017, 357, 1105–1107. [Google Scholar] [CrossRef] [PubMed]
- Xi, J.P. Work together to build a win-win, equitable and balanced governance mechanism on climate change. In Proceedings of the United Nations Climate Change Conference, Paris, France, 30 November–12 December 2015. [Google Scholar]
- Müller, D.B. Stock dynamics for forecasting material flows—Case study for housing in the Netherlands. Ecol. Econ. 2005, 59, 142–156. [Google Scholar] [CrossRef]
- Federieia, M.; Ulgiatib, S.; Basosi, R. A thermodynamic, environmental and material flow analysis of the Italian high way and railway transport systems. Energy 2008, 33, 760–775. [Google Scholar] [CrossRef]
- Brattebø, H.; Bergsdal, H.; Sandberg, N.H. Exploring built environment stock metabolism and sustainability by systems analysis approaches. Build. Res. Inform. 2009, 37, 569–582. [Google Scholar] [CrossRef]
- Sandberg, N.H.; Sartori, I.; Heidrich, O.; Dawson, R.; Dascalaki, E.; Dimitriou, S.; Vimm-r, T.; Filippidou, F.; Stegnar, G.; Zavrl, M.Š.; et al. Dynamic building stock modelling: Application to 11 European countries to support the energy efficiency and retrofit ambitions of the EU. Energy Build. 2016, 132, 26–38. [Google Scholar] [CrossRef]
- Shi, F.; Huang, T.; Tanikawa, H.; Han, J.; Hashimoto, S. Toward a low carbon-dematerialization society. J. Ind. Ecol. 2012, 16, 493–505. [Google Scholar] [CrossRef]
- Huang, T.; Shi, F.; Tanikawa, H.; Fei, J.; Han, J. Materials demand and environmental impact of buildings construction and demolition in China based on dynamic material flow analysis. Resour. Conserv. Recycl. 2013, 72, 91–101. [Google Scholar] [CrossRef]
- Cao, W.X. Research on Temporal and Spatial Variations of Material Metabolism and Its Environmental Effects of Shanghai’s Urban Infrastructure for Recent 30 Years. Master’s Thesis, East China Normal University, Shanghai, China, 2015. [Google Scholar]
- Guo, Z.; Zhang, X.Z. Study on the composition and dynamic changes of material stock of the infrastructures on islands—Case study of Miao Island in Shandong province. J. Qingdao Univ. Sci. Technol. (Soc. Sci.) 2017, 22, 40–46. [Google Scholar] [CrossRef]
- Guo, Z.; Hu, D.; Zhang, Z.W.; Zhang, P.D.; Zhang, X.Z. Material metabolism and lifecycle GHG emissions of urban road system (URS). J. Clean. Prod. 2017, 165, 243–253. [Google Scholar] [CrossRef]
- Sun, Y.; Wang, K.Y.; Yao, X.D. Study on environmental benefits evaluation of urban public infrastructure. China Popul. Resour. Environ. 2015, 25, 92–100. [Google Scholar] [CrossRef]
- Wang, G.; Sun, L.Q.; Chen, W.D. Housing Architecture; China Electric Power Press: Beijing, China, 2009; pp. 28–29. ISBN 978-7-5083-8827-4. [Google Scholar]
- Qu, J.S.; Wang, L.; Qiu, J.L. Regional analysis of carbon dioxide emission from house building materials in China. J. Lanzhou Univ. (Nat. Sci.) 2014, 50, 200–201. [Google Scholar] [CrossRef]
- Ding, G.K.C. Embodied Carbon in Construction, Maintenance and Demolition in Buildings. Embodied Carbon in Buildings. Available online: https://link.springer.com/ (accessed on 30 January 2018).
- IPCC. IPCC Guidelines for National Greenhouse Gas Inventories; Institute for Global Environmental Strategies: Hayama, Japan, 2006; pp. 1–145. [Google Scholar]
- Organisation for Economic Co-operation and Development (OECD). Measuring Capital OECD Manual: Measurement of Capital Stocks, Consumption of Fixed Capital and Capital Services; OECD: Paris, France, 2001; Available online: http://www.oecd.org (accessed on 22 November 2010).
- Hu, D.; You, F.; Zhao, Y.; Yuan, Y.; Liu, T.; Cao, A.; Wang, Z.; Zhang, J. Input, stocks and output flows of urban residential building system in Beijing city, China from 1949 to 2008. Resour. Conserv. Recycl. 2010, 54, 1177–1188. [Google Scholar] [CrossRef]
- National Bureau of Statistics of China (NBSC). Provincial Bureau of Statistics. Available online: http://www.stats.gov.cn/ (accessed on 6 March 2018).
- National Bureau of Statistics of China (NBSC). Comprehensive Statistical Data and Materials On 60 Years of New China; China Statistics Press: Beijing, China, 2010.
- Yang, W. Modeling the Evolution of the Chinese Building Stock in a Sustainable Perspective. Ph.D. Thesis, Tianjin University, Tianjin, China, 2006. [Google Scholar]
- Ministry of Construction of the People’s Republic of China. Unified Standard for Reliability Design of Building Structures; GB 50068-2001; China Architecture & Building Press: Beijing, China, 2001.
- Song, C.H. Whole life and high grade quality-stick to the idea of giving first consideration for the people and implement housing performance certification. Hous. Sci. 2005, 290, 3–7. [Google Scholar]
- Liu, T.X.; Hu, D. Environmental impact of residential building construction in Beijing: 1949–2003. Assessing the construction materials’ environmental impact by LCA. J. Grad. Sch. Chin. Acad. Sci. 2006, 23, 231–241. [Google Scholar]
- Ministry of Transport of the People’s Republic of China (MTC). Technical Standard of Highway Engineering; JTG B01-2014; Ministry of Transportation of China Press: Beijing, China, 2014.
- Ministry of Transport of the People’s Republic of China (MTC). Yearbook of China Transportation & Communications; Yearbook House of China Transportation & Communications Press: Beijing, China, 2016.
- Ministry of Transport of the People’s Republic of China (MTC). Statistical Communiqué of Transportation & Communications Development; Yearbook house of China Transportation & Communications Press: Beijing, China, 2017.
- The World Bank (WB). The World Bank Open Data of Rail Lines. Available online: https://data.worldbank.org/ (accessed on 22 November 2017).
- Ministry of Transport of the People’s Republic of China (MTC). Land Use Index for Highway Project Construction; JB [2011]124; Ministry of Transportation of China Press: Beijing, China, 2011.
- Ministry of Transport of the People’s Republic of China (MTC). Specifications of Cement Concrete Pavement Design for Highway; JTD D40-2011; Ministry of Transportation of China Press: Beijing, China, 2011.
- Ministry of Railways of the People’s Republic of China (MRC). Code for Durability Design on Concrete Structure of Railway; TB 10005-2010; Ministry of Railway of China Press: Beijing, China, 2010.
- Ministry of Transport of the People’s Republic of China (MTC). The Standard for Design of Railway Line; TB 10098-2017; Ministry of Transportation of China Press: Beijing, China, 2017.
- Huang, T.; Shi, F.; Fei, J.L.; Tanikawa, H.; Imura, H. Study on the material stock of transportation construction associated with the development of infrastructure in China. Environ. Inf. Sci. 2010, 24, 149–154. [Google Scholar]
- Zhang, T.; Jiang, Y.H.; Huang, Y.L.; Zhang, C.X.; Wu, J.J. Carbon emission factors of energy and materials commonly used in buildings. Inf. China Constr. 2010, 23, 58–59. [Google Scholar]
- The World Bank (WB). The World Bank Open Data of Carbon Emissions. Available online: https://data.worldbank.org.cn/ (accessed on 13 January 2019).
- Global Carbon Project (GCP). The Global Carbon Project Open Data of CO2 Emissions. Available online: http://www.globalcarbonatlas.org/en/content/welcome-carbon-atlas (accessed on 13 January 2019).
- National Bureau of Statistics of China (NBSC). China’s National Economic and Social Development Statistical Bulletin. Available online: http//:www.stats.gov.cn/tjsj/zxfb/201702/t20170228_1467424.html (accessed on 28 February 2017).


© 2019 by the authors. Licensee MDPI, Basel, Switzerland. This article is an open access article distributed under the terms and conditions of the Creative Commons Attribution (CC BY) license (http://creativecommons.org/licenses/by/4.0/).